government policy in solving uneven regional development ... · instructions for use title...
TRANSCRIPT
Instructions for use
Title Government Policy in Solving Uneven Regional Development betweenWest and East Indonesia : Case Study onKAPET
Author(s) Soenandar, Ersi S.
Citation Economic journal of Hokkaido University, 34: 171-192
Issue Date 2005-07
Doc URL http://hdl.handle.net/2115/5402
Type bulletin (article)
File Information EJHU_v34_p171-192.pdf
Hokkaido University Collection of Scholarly and Academic Papers : HUSCAP

Government Policy in Solving UnevenRegional Development between West and
East Indonesia: Case Study on KAPET
Ersi S. Soenandar
This paper evaluates Indonesian government policy undertakento accelerate the development Eastern Indonesia and to solve re-gional disparities in income, namely the establishment of IntegratedEconomic Development Zones(Kawasan Pengembangan EkonomiTerpadu, KAPET).Through a case study analysis of KAPET Pare-pare and KAPET Bima, we found that the KAPETs have not beenconsistently well managed. Therefore, to develop the KAPETs thegovernment must be committed and consistent by considering theprofessionalism of KAPET management.
JEL Classification Numbers: O15,O29,R58Key Words: Acceleration of Eastern Indonesia Development, Indone-
sia, Integrated Economic Development Zone(KAPET),Regional Income Disparities
1. Introduction
Uneven regional development is quite often considered by scholars whenanalyzing a country’s economic development. In particular, in large countriessuch as China and Brazil, uneven regional development has occurred betweendifferent economic belts. In China, for example, it has occurred betweencoastal(East)and inland(Middle and West)regions(Song et al.,2000,Fujitaand Hu,2001,Herrmann-Pillath et al. 2002,and Cai et al. 2002).In Brazilsuch development has appeared between northern and southern Brazil(Az-zoni,2001).This problem also has been found in Southeast Asian countriessuch as Vietnam, Malaysia and Thailand(Hill,2000).In Vietnam, significantdifferences in development levels have appeared between the northern andsouthern parts of the country. In Malaysia, a regional development gap hasarisen between West and East Malaysia, and in Thailand, it has appeared be-tween Bangkok and the rest of the country.
Regional development inequality in Indonesia has been studied exten-sively since the early 1970s.1) To analyze this phenomenon, researchers haveemployed several economic and social measurements, such as GDP, per capita
Econ. J. of Hokkaido Univ.,Vol.34(2005),pp.171‐192
1)Beginning with Esmara(1975),who analyzed regional income disparities for the year1972basedon estimations of regional GDP, studies on the inequality of Indonesian economic developmenthave appeared since the1970s. According to Esmara’s calculation, per capita GRDP(excludingmining)differed by a factor of12between the highest income region of East Kalimantan and thelowest income region of West Nusa Tenggara. This study was followed by Uppal and Budiono(1986),Kameo and Rietvield(1987),and Akita and Lukman(1995).
171

GDP and other social indicators such as poverty, facilities and infrastructure.They have found differences in the natural conditions that have produced thegrowing gap in economic and social development among provinces. In addition,uneven regional economic growth leads to a constantly expanding gap not onlyamong provinces and regions(West and East: Indonesia),2) but also amongmunicipalities/regencies within a province.
To overcome these problems, Indonesia’s government has introduced andimplemented various policies. It began in the late1960s, when the governmentinitiated an Indonesian development plan, called the First Five-Year Develop-ment Plan(Rencana Pembangunan Lima Tahun I, Repelita I 1969/70‐1973/74),followed by other policies such as investment and financial reforms, in-terregional fiscal transfers(the Inpres program),and a migration program(Uppal and Budiono,1986,Azis,1990,Hanna,1994,Takeda and Nakata,1998).The outcomes, however, are still far from reaching expectations; i.e., de-velopment growth and economic activities are still concentrated, particularlyin Sumatra and Java(West Indonesia).
Because studies on Indonesian government policies that relate to regionaldevelopment disparities between West and East Indonesia are still limited innumber, this study focuses specifically on evaluating a program(Indonesiangovernment policy)implemented to overcome geographical obstacles and toaccelerate regional development in East Indonesia, namely the IntegratedEconomic Development Zones(Kawasan Pengembangan Ekonomi Terpadu,hereinafter referred to as“KAPET”).This program, which the governmentintroduced in 1996,is expected to enable Indonesia to finally create even eco-nomic development across the country.
The purposes of this study are to trace the establishment of KAPET froma regional policy perspective, to evaluate the current performance of KAPETs,and to provide some suggestions to Indonesia’s government for the improve-ment of KAPETs performance in order to achieve balanced developmentbetween the West and East Indonesian regions, as well as for all regions(prov-ince, and municipality/regency).
This study is divided into three analyses. The first section, an analysis ofincome disparities, is comprised of comparisons among provinces for the coun-try as a whole, between the two economic belts of West and East Indonesia,and among regencies/municipalities within five major regions.3) The secondsection is an analysis of a set of government policies that focus on the accelera-tion of development in Eastern Indonesia. The last section is an analysis of theKAPET as a growth center for eastern Indonesian regions and includes prob-lems illustrated with the use of case studies of KAPET Parepare and KAPETBima. This study is based on fieldwork done at two KAPET Managing Bodies(Badan Pengelola KAPET),which were chosen to give a comparison between
2)West Indonesia refers to Sumatra, Java and Bali and East Indonesia refers to Kalimantan,Sulawesi, Maluku, Papua and Nusa Tenggara.3)Major regions are classified as Sumatra, Java, Kalimantan, Sulawesi and Others(West and EastNusa Tenggara, Maluku and Papua).
Ersi S. Soenandar172

strong and weak management.
2. Perspective on Development between West andEast Indonesia: Literature and Statistics
2.1 Indonesian income disparitiesIncome disparity is one factor used for measuring regional economic
development. A picture of the imbalanced regional economic development inIndonesia can be obtained through an inter-provincial comparison of income,using Gross Domestic Product(GDP)and per capita GRDP. Tables 1 through3 present the 19974)GDP contributions and per capita GRDP of the two eco-nomic belts in West and East Indonesia and five major regions, and give a com-prehensive outline of Indonesian income disparities. As shown in Table 1,West Indonesia contributed significantly to GDP, accounting for about 80% ofGDP(including and excluding mining).The largest contributions were de-rived from Java(62% and 66%),followed by Sumatra(21% and 18%),Ka-limantan(9% and 7%),Sulawesi(4% and 5%)and Others(4% and 4%).
Table1.GDP Contribution and per capita GRDPs for the year of1997
GDP contribution at current market prices Per capita GRDP at current market prices
Including mining Excluding mining Including mining Excluding mining
(Million Rp) % (Million Rp) % (Rp) Index (Rp) Index
Sumatra 126,530,818 21 99,739,028 18 3,127,942 0.63 2,465,628 0.67
Java and Bali 363,873,638 62 356,377,015 66 3,054,956 0.61 2,992,017 0.81
West Indonesia 490,404,456 83 456,116,043 84
Kalimantan 51,483,801 9 38,046,383 7 4,991,031 1.00 3,688,358 1.00
Sulawesi 25,036,043 4 25,036,043 5 1,813,266 0.36 1,813,266 0.49
Others 23,103,633 4 22,743,744 4 1,526,130 0.31 1,526,130 0.41
East Indonesia 99,623,477 17 85,826,170 16
Source : Central Bureau of Statistics(2001),Statistical Yearbook of Indonesia 2000,p.545,547,549,551.
Note : The index used to measure the differences in per capita GRDP is calculated by comparing the per capita GRDP of each re-
gion to that of Kalimantan as the highest region(index of Kalimantan’s per capita GDP=1.00).
In terms of per capita GRDP, Java and Sumatra contributed significantshares to GDP, however, the highest per capita GRDP was achieved byKalimantan. Per capita GRDP in Java and Bali were just 0.61(including min-ing)or 0.81(excluding mining)of those in Kalimantan, respectively. The com-parable figures in Sumatra were 0.63 and 0.67,in Sulawesi 0.36 and 0.49,andin other regions 0.31 and 0.41.The high per capita GRDP in Kalimantan re-flected the high per capita GRDP in East Kalimantan, which has enjoyed highrevenues as a mining province.
4)This year was chosen because of several incidents that occurred after1997,such as the monetarycrisis in1997and the creation of new provinces such as North Maluku(Maluku),Banten(WestJava),Gorontalo(North Sulawesi),and kepulauan Bangka Belitung(Riau)since1999.
Government Policy in Solving Uneven Regional Development 173

To give a better picture of Indonesian income disparities, Tables 2 and 3show the highest and lowest GDP contributions and per capita GRDP inregencies/municipalities within provinces for each of the five major regions.Table 2 shows that Central Jakarta was the highest GDP contributor in the
country. Kutai in East Kalimantan province was the highest contributor inEast Indonesia(0.75 of Central Jakarta).In Sumatra, the highest contributorwas Bengkalis in Riau province(0.50),in Sulawesi the highest contributor wasMakasar in South Sulawesi province(0.15)and in Other Regions the highestcontributor was Mimika in Papua province(0.19).
Although West Indonesia contributed a much larger share of GDP thanEast Indonesia, the lowest GDP contributor in the country was Sabang inWest Indonesia at 0.03.This shows clearly that wide disparities occur not onlybetween West and East Indonesia, but also within the regencies of West Indo-nesia.
Table2.Highest and lowest GDP contributions in1997at current prices
Highest GDP contributors Lowest GDP contributors
Including mining Excluding mining Excluding/including mining
Regency/municipality Index Regency/municipality Index Regency/municipality Index
West
Sumatra Bengkalis, Riau 0.50 Medan, North Sumatra 0.30 Sabang, Aceh 0.03
Java & Bali Central Jakarta 1.00 Central Jakarta 1.00 Blitar, East Java 0.12
East
Kalimantan Kutai, East Kalimantan 0.75 Kutai, East Kalimantan 0.25 Central Hulu Sungai, East Kalimantan 0.14
Sulawesi Makassar, South Sulawesi 0.15 Makassar, South Sulawesi 0.15 Selayar, South Sulawesi 0.06
Others Mimika, Papua 0.19 Mimika, Papua 0.19 Alor, East Nusa Tenggara 0.06
Source: Central Bureau of Statistics(2002),Gross Regional Domestic Product regencies/municipalities in Indonesia 1997-2000,
p.1‐40(Table1to30)
Note: The index is calculated by comparing GDP contribution of each region to that of Central Jakarta as the highest region
(index of Central Jakarta’s per capita GDP=1.00).
Table 3 shows the highest and the lowest per capita GRDPs for all regen-cies/municipalities. As shown in Table 1,East Kalimantan was the regionwith the highest per capita GRDP including mining. If per capita GRDP ofmunicipalities/regencies in each of the five major regions are compared, how-ever, the highest per capita GRDP was achieved by North Aceh in West Indo-nesia. This reflects North Aceh’s position as the country’s oil and natural gasproducer. The second highest per capita GRDP is achieved by Kediri(0.96),followed by Kutai(0.67).
In terms of GDP excluding mining, although Central Jakarta contributesthe largest share of GDP, Kediri municipality in East Java appeared as theregion with the highest per capita GRDP due to the presence of GudangGaram, the largest cigarette manufacturer in Indonesia. West Sumba in EastNusa Tenggara province was the region with the lowest per capita GRDP inthe whole country, with only 0.02 of the per capita GRDP of Kediri, due to to-
Ersi S. Soenandar174

pography and a lack of natural resources. In West Indonesia, the lowest percapita GRDP was in Grobogan in Java and West Lampung in Sumatra(0.03).
Table3.Highest and lowest per capita GRDPs in1997(Regency/municipality level)
Highest per capita GRDPs Lowest per capita GRDPs
Including mining Excluding mining Excluding/including mining
Regency Index1 Regency Index2 Regency Index3
West Indonesia
Sumatra North Aceh, Aceh 1.00 Batam, Riau 0.29 West Lampung, Lampung 0.03
Java & Bali Kediri, East Java 0.96 Kediri, East Java 1.00 Grobogan, Central Java 0.03
East Indonesia
Kalimantan Kutai, East Kalimantan 0.67 Kutai, East Kalimantan 0.70 Sintang, West Kalimantan 0.05
Sulawesi Donggala, Central Sulawesi 0.34 Donggala, Central Sulawesi 0.35 Jeneponto, South Sulawesi 0.03
Others East Lombok, West Nusa Tenggara 0.28 East Lombok, West Nusa Tenggara 0.29 Sumba Barat, East Nusa Tenggara 0.02
Source : Same as Table2,p.61‐90(Table61to90)
Note : The index is calculated by comparing the per capita GRDP of each municipaility/regency to that of the highest region(index
1to per capita GRDP of North Aceh, index2and3to per capita GRDP of Kediri).
2.2 Economic development between West and East IndonesiaAs mentioned above, the issue of income differences among various
regions across the country has been studied and the income differences uncov-ered have led to further discussion of the issue of regional economic develop-ment, particularly between East and West Indonesia. Until now, studies ofIndonesian income disparities have expanded into research on differencesbetween West and East Indonesia(Hill and Weidemann,1991).Hill and Weide-mann have classified Indonesian regions into five categories: resource-rich re-gions, isolated regions, densely populated regions, settled outer islands, andsparsely populated regions(Table 4).
According to the GDP contributions shown in Table 1,West Indonesia isricher and more dynamic than the east. Table 5 provides apparent evidence oncrucial statistics between West Indonesia and East Indonesia for the year2000.As home to around 80% of the country’s population, and with about 32% of the country’s total land area, West Indonesia contributed around 81% ofGDP in 1999.This contrasts with East Indonesia, with 68% of the country’sland area and around 20% of the total population, which contributed only 19% of total GDP. Furthermore, the Human Development Index(HDI 62.9)forEast Indonesia is still below the national standard(HDI 64).
Moreover, the abandonment of East Indonesia development can also bedenoted by the shares of investment amounts between West and East Indone-sia. According to statistical data for 2003,East Indonesia accounted for just 15% of the country’s total investment. Moreover, this condition is shown by theshare of the development budget received from the central government, whichis only around 18% of the country’s total development budget.
Government Policy in Solving Uneven Regional Development 175

Table4.Classification of Indonesian regions
Region type Resource-rich Isolated Densely populated Settled outer islands Sparsely populated
West Indonesia Aceh
Riau
Jambi
Lampung
Jakarta
West Java
East Java
Central Java
Yogyakarta
Bali
North Sumatra
West Sumatra
South Sumatra
Bengkulu
East Indonesia East Kalimantan
Papua
East Nusa Tenggara
West Nusa Tenggara
South Kalimantan
North Sulawesi
South Sulawesi
Central Kalimantan
Central Sulawesi
West Kalimantan
Southeast Sulawesi
Maluku
Source: Hill and Weidemann(1991),p.4.
Table5.Summaries of West and East Indonesia statistics
East Indonesia West Indonesia
Area 68% 32%
Population(1999) 20% 80%
Population density(per km2 in1999) 29 n.a.
Human Development Index(1999) 62.9 n.a.
GDP contribution(2000) 19% 81%
Per capita GRDP(2000‐in rupiah) 2,037,781 1,947,758
Per capita GRDP non-oil & gas(2000‐in rupiah) 1,748,737 1,799,251
Percentage of investment(2003) 15% 85%
Development budget(based on DIP*2003) 18% 82%
Source: Development Council for Eastern Indonesia(DP-KTI)Decree No.1of2002,Attachment p.2.*DIP(Daftar Isian Proyek)is a fund allocation from the national budget(APBN)to sectoral ministries.
Actually, compared to West Indonesia, East Indonesia is endowed withlarge-scale agriculture, forestry, plantations, oil, natural gas and some mining.Due to a lack of infrastructure, human resources, management and capitalfunds, however, the potential resources of East Indonesia have not beenexploited as well as those in West Indonesia.
Takeda and Nakata(1998)found a significant positive correlation betweeninfrastructure development(such as electric power, waterworks and telephonelines)and the growth of per capita GRDP. Furthermore, they argue that thelevel of infrastructure development is a factor that effects regional economicdevelopment. To examine regional economic disparities further, they analyzedthe impact of government policies on regional development funds and fiscaltransfers on per capita GRDP.
Ersi S. Soenandar176

Figure 1. Share of labor force and unemployment(%)
Source: Central Bureau of Statistics(1999),Keadaan Angkatan Kerja Indonesia, August 1998,p.54.
West Indonesia region
East Indonesia region
Another problem in East Indonesia is human resource deficiencies, interms of both quantity and quality(Figure 1).In addition to both foreign anddomestic investment capital, investment in human resources is definitely re-quired to promote regional development. As shown in Table 5,differences inthe share of population between West and East Indonesia contrast with thoseof land territory. Based on statistical data in 1995,West Indonesia accountsfor 82% of the total labor supply, while East Indonesia accounts for 18%. Thelargest share of the labor force is in West Java, Central Java and East Java.This reflects the population of the Java region, which accounts for more thanhalf of Indonesia’s total population. Jakarta, with a 4% share of the laborsupply, accounts for 12% of total unemployment.
According to Figure 1,the low numbers for East Indonesia’s labor forceare accompanied by unemployment ranging from 2% to 12%.The largestshare of the labor force was in South Sulawesi(4%),and the other regionsranged between 1% to 2% or less. This condition is related to the lack of em-
Government Policy in Solving Uneven Regional Development 177

ployment opportunities, particularly in East Indonesia, which is the result ofinsufficient educational attainment(See Garcia and Soelistianingsih,1998).5)
Figure 2. Share of employment by industry
West Indonesia
East Indonesia
Source: Same as Figure1,p.243.
5)Garcia and Soelistianingsih analyzed the evolution and distribution of welfare for the years of1983‐1993.They argued that investments in human capital such as education and health wouldimprove per capita GRDP.
Ersi S. Soenandar178

Turning to employment, industrialization in Indonesia has in fact ab-sorbed a huge supply of labor, particularly blue-collar workers. However, thistrend has not spread equally across the country, and the industrial sector inIndonesia has been concentrated in some regions, such as most provinces inJava(except Yogyakarta6)),Sumatra, East Kalimantan, and South Sulawesi(Figure 2).Employment in both of West and East Indonesia mostly shows asimilar pattern(except Jakarta); the agriculture sector has dominated thenumbers of employed, followed by trade and other services. The data alsoshow that the agriculture sector is still dominated by low-educated labor(Fig-ure 3).In contrast, the manufacturing, finance & business and other servicesectors are dominated by higher-education labor.
Figure 3. Share of educational attainment, by industry(1998)
Source : Same as Figure1,p.126.
3. Government Policies for Reducing the EconomicDevelopment Gap between West and East Indonesia
More than 25 years after independence, Indonesia has undergone spec-tacular economic development that has brought the country out of the low-income country group and into the ranks of mid-low-income countries. Inachieving this economic level, the important roles of the Five-Year Develop-ment Plan(Rencana Pembangunan Lima Tahun, Repelita)implemented since1969,and a set of related policies(for example, the Inpres7)program)are un-doubtedly significant.
While Indonesia has succeeded in increasing economic productivity andper capita GRDP, many obstacles remain to be tackled by the government, par-
6)Yogyakarta is one of Indonesia’s special regions. Unlike the four other provinces(Jakarta, WestJava, Central Java and East Java),although it is also located on Java island, its contribution toGDP is insignificant(Soenandar,2004).7)The Inpres(Instruksi Presiden)program was a government effort to reduce the gap among re-gions. The program was initially implemented in1969.It is a fund allocation from the centralgovernment to local governments(Uppal and Budiono(1986)and Azis(1990)).
Government Policy in Solving Uneven Regional Development 179

ticularly to cope with the disparity between West and East Indonesia. As amatter of fact, the government has introduced some policies to accelerate thedevelopment of Eastern Indonesia. These have been implemented since theearly 1990s and are marked by the inclusion of an essence of acceleration ofEastern Indonesian development in the 1993‐State Policy Guideline(GarisBesar Haluan Negara, GBHN).Although the policies have been gearedtoward GNP growth, the overall living standard of the Indonesian populationhas not yet improved.
To overcome this problem, since Suharto’s New Order Regime(1966‐1998)in 1993,the government has taken strategic moves to even out nationaldevelopment by implementing a program called“Acceleration of Eastern Indo-nesian Development(PP-KTI8))”.According to Decree of the DevelopmentCouncil for Eastern Indonesia(DP-KTI)9)No.1 of 2002 on the National Policyand Strategy for Acceleration of Eastern Indonesian Development(hereinafterreferred to as“Jakstranas PP-KTI10)”),Acceleration of Eastern IndonesianDevelopment basically encompasses four priorities, namely to �1 reduce re-gional inequality,�2 improve the welfare of local people,�3 prepare EasternIndonesia for free trade, and�4 preserve the unity of the country. Those effortsare implemented in five development sectors: human resources, economy,infrastructure, institutions, and incentives. To attain all these goals, thisprogram was manifested by establishing the Development Council for EasternIndonesia(DP-KTI)in 1993,followed by the creation of KAPETs in 1996 andthe Development Body of KAPET(Badan Pengembangan KAPET)in 2000.Tosupport these organizations and actions, the government established the StateMinister of Acceleration of Eastern Indonesian Development in 2000.
The Development Council for Eastern Indonesia(DP-KTI)was launchedthrough Presidential Decree(Keppres11))No.120 of 1993,which has since un-dergone several changes and revisions.12) The decree was subsequently aug-mented by launching Presidential Decree No.55 of 2001 and No.44 of 2002.According to Presidential Decree No.44 of 2002,the Development Council forEastern Indonesia(DP-KTI)is a central-level council comprised of severalministers, over which the State Minister of Acceleration of Eastern IndonesianDevelopment sits as the executive director(Exhibit 1),and has the authorityand responsibility to formulate and establish strategic policies and priorityprograms for improving Eastern Indonesia’s development.
KAPET was established as a follow up to the creation of DevelopmentCouncil for Eastern Indonesia(DP-KTI).As stated in Presidential Decree No.89 of 1996,which was later replaced by Presidential Decree No.150 of 2000,KAPET is designed as a growth center for the region and prime over for hin-terland areas. The decree stated that a KAPET is selected based on geo-
8)PP-KTI refers to Percepatan Pembangunan-Kawasan Timur Indonesia.(KTI=eastern Indone-sia).9)DP-KTI refers to Dewan Pengembangan KTI.10)Jakstranas PP-KTI refers to Kebijakan dan Strategi Nasional PP-KTI.11)Keppres refers to Keputusan Presiden.12)It was revised by Presidential decree No.27of1994,54of1995,75of1998,and173of1998.
Ersi S. Soenandar180

graphical borders with the follow conditions:�1 having potential for rapidgrowth and/or �2 having leading sectors capable of boosting the economicgrowth of hinterland areas and /or �3 offering potential for large investmentreturns.
Management of KAPET at the central level is conducted by the Develop-ing Body(Badan Pengembangan)of KAPET. This consists of several ministers,with the Coordinating Minister for Economic Affairs as chairman and theMinister of Settlement and Regional Infrastructure(Kimpraswil)as executivedirector(Exhibit 1).This body is responsible for policy implementation and co-ordination. To manage a KAPET at the regional level, the Managing Bodies(Badan Pengelola)of KAPET have been formed with local governors as chair-men, represented by an executive director whose task is to manage theKAPET professionally, and assisted by a technical team headed by the Minis-ter of Acceleration of Eastern Indonesian Development as the supervisor atthe central level.
All of the above strategic policies subsequently are pursued under relatedoperational policies, such as Government Regulation(PP13))No.20 of 2000 sup-ported by Finance Minister Decree(Kep. Menkeu14))No.200/KMK.04/2000concerning the implementation of incentives in KAPET and, to achieve theaims of Acceleration of Eastern Indonesian Development(PP-KTI)effectively,through Decree of Development Council for Eastern Indonesia(DP-KTI)No.1of 2002 the National Policy and Strategy for Acceleration of Eastern Indone-sian Development(Jakstranas),supported by Presidential Instruction No.7/2002 for its implementation.
The Jakstranas PP-KTI is comprised of two targets, both short-term(up to2004)and long-term(up to 2010).For example, the short-term target is focusedon bringing the percentage of per capita GDP and the HDI closer to the na-tional average, a 20% share of total national investment, and a 20% share ofthe export level. As long-term targets, the purchasing power of local citizens isexpected to climb above the national average, the HDI at expected to equal thenational average level, and both total investment and exports are expected tobe at least 20% of the country’s total investments and exports. Jakstranas hasalso formulated 31 priority programs: nine programs in human resources, sixprograms in economics and natural resources,11 programs in facilities andinfrastructures, and five programs in institutional sectors.
Up to now, according to the report of Ministry of Acceleration of EasternIndonesian Development(2003)on each KAPET, this program has not workedwell. Good coordination between the central and the local government andeven, among related departments both at the central and the local levels isrequired to achieve the goals of this program.
13)PP= Peraturan Pemerintah.14)Kep. Menkeu refers to Keputusan Menteri Keuangan.
Government Policy in Solving Uneven Regional Development 181

4. Integrated Economic Development Zone(KAPET)
4.1 Challenges and problemsSince Presidential Decree No.89 of 1996 was launched,12 KAPETs15)(Fig-
ure 4)have been established in the eastern Indonesia region through severaldecrees. These consist of four KAPETs in Kalimantan(namely, Batulicin,Khatulistiwa, Das Kakab, Sasamba16),four KAPETs in Sulawesi(Batui, Pare-pare, Bukari, Bitung17)),two KAPETs in Nusa Tenggara(Bima and Mbay18)),one KAPET in Maluku(Seram19))and one KAPET in Papua(Biak20)).
According to the report conducted by the executive director of the Devel-opment Council of Acceleration of Eastern Indonesian and the DevelopingBody of KAPET six KAPETs(Sanggau, Batulicin, Parepare, Bukari, Bitungand Biak)showed optimal performances but the remaining six KAPETs(Bima,Mbay, Kolaka, Seram, Batui, and Das Kakab)were still behind their objectives(Financial and Development Supervisory Board,2003,p.5).The investigationof the KAPETs’ performance is used as a basis to evaluate the target achieve-ments of KAPET by Ministry of Acceleration of Eastern Indonesian Develop-ment.
� K
e
f
hg
j
d
cb
i
a
Note: a. KAPET Khatulistiwa b. KAPET Das Kakab c. KAPET Batulicin d. KAPET Sasamba
e. KAPET Bitung f . KAPET Batui g. KAPET Parepare h. KAPET Bukari
i . KAPET Bima j . KAPET Mbay k. KAPET Seram � . KAPET Biak
Java
Jakarta
SumatraSumatra
BatamKalimantan
Nusa Tenggara
Sulawesi
MalukuIrian Jaya
Figure 4. KAPETs locations in Eastern Indonesia
15)KAPET consists of12KAPET in East Indonesia and one KAPET in West Indonesia. All12KAPETs encompass51areas:15areas in Kalimantan,16areas in Sulawesi, four areas in Maluku,nine areas in Papua, and seven areas in Nusa Tenggara(three areas in West Nusa Tenggara andfour areas in East Nusa Tenggara).16)Presidential Decree No11,12,13,and170of1998.17)Presidential Decree No14,164,167,and168of1998.18)Presidential Decree No.15and166of1998.19)Presidential Decree No.165of1998.20)Presidential Decree No.90of1996(revised by Presidential Decree No.10of1998).
Ersi S. Soenandar182

Entrepreneurs who do business within KAPET will be supported by thegovernment with both fiscal and non-fiscal incentives. The aim is to stimulateprivate investments, particularly for small and medium enterprises(UsahaKecil Menengah, hereinafter referred to as“SMEs”)in East Indonesia. Asstated in Government Regulation No.20/2000 in April 2000(Republic of In-donesia,2000)entrepreneurs who run businesses within a KAPET will receivea partial tax holiday, including �1 a net income tax reduction of 30% of totalinvested capital,�2 alternative choices for applying depreciation and/or accel-erated amortization(Exhibit 2),�3 fiscal loss compensation for the followingfiscal year for a maximum of 10 consecutive years, and�4 a 10% income tax ondividends for foreign taxpayers, or the lowest tariff based on a double taxationavoidance agreement. The incentives were changed after June 2000,however,due to Government Regulation No.20/2000(Republic of Indonesia,2000)supported by Finance Minister Decree No.200/KMK.04/2000(Ministry ofFinance,2000).These changes showed that government implementation of taxpolicy has been inconsistent, and this has been noted as one constraint forKAPETs.
To adjust the management of KAPET under Law(Undang-undang, UU)No.22 of 1999 concerning regional autonomy and Government Rule No.25 of1999(Republic of Indonesia,1999)concerning the revenues allocation act,Presidential decree No.150/2000 stated that KAPETs are managed by localgovernments with the governors as chairmen of the Managing Bodies ofKAPET. The KAPETs have encountered problems with regional governments,inconsistency in incentive treatment, and lack of financial support. This seemsto conflict with policy implementation of development activities in KAPETs,which are organized by the central government.
All operational costs of KAPET Development and Management Bodies areimposed in the State Budget(APBN21)).KAPET management and developmentcosts were being paid not only from the State Budget, but also from theRegional Budget(APBD22))and other valid statutory sources. Since the imple-mentation of regional autonomy, however, fund allocation for KAPETs is nolonger supported by the State Budget. Because of this change, local govern-ments need to consider which financial sources can support the KAPET pro-grams.
Regional autonomy also raises the problem of management control ofKAPETs. Through regional autonomy implementation, the control of KAPETsautomatically will be transferred to the local government from the central gov-ernment. Therefore the ability of local governments to manage the KAPETsneeds to be evaluated.
The most important activity for a KAPET is to support local industries.Table6,based on responses to a questionnaire conducted by the Ministry of
21)APBN is referred to Anggaran Pendapatan dan Belanja Negara(Annual State Budget Revenueand Expenditure).22)APBD is referred to Anggaran Pendapatan dan belanja Daerah(Regional Budget Revenue andExpenditure).
Government Policy in Solving Uneven Regional Development 183

Acceleration of Eastern Indonesian Development(2003),shows the role ofKAPETs for SMEs in local industries. The table shows clearly that the role ofKAPETs is still far from the expected target for all sectors in each region. InKAPET Bima, for example, although the Ministry received positive responsesto the questionnaire, the results(ratio of positive responses to total number ofquestions)showed an only slightly better than 50% achievement for all targets.Therefore the socialization of KAPETs needs to be introduced further to localcommunities, in order for local people to benefit from the KAPET both in serv-ices and facilities.
Table 6.Role of KAPET for local industries, based on questionnaire responses
KAPETA
X(Y)
B
X(Y)
C
X(Y)
D
X(Y)
E
X(Y)
KAPET Khatulistiwa 4(21) 0(25) 4(21) 5(20) 5(20)
KAPET Das Kakab 0(30) 30(30) 2(30) 30(30) n.a.
KAPET Batulicin 7(44) 0(44) 15(44) 17(44) 21(44)
KAPET Sasamba 17(30) 14(30) 12(30) 7(30) 5(30)
KAPET Bitung 11(25) 8(25) 8(25) 13(25) 12(25)
KAPET Batui 8(25) 8(25) 8(25) 8(25) 8(25)
KAPET Parepare 13(35) 8(35) 15(35) 8(35) 12(35)
KAPET Bukari 10(25) 17(25) 17(25) 10(15) 8(25)
KAPET Bima 18(27) 20(27) 21(27) 20(27) 18(27)
KAPET Mbay 2(25) 10(25) 5(25) 5(25) 3(25)
KAPET Seram n.a. n.a. n.a. n.a. n.a.
KAPET Biak n.a. n.a. n.a. n.a. n.a.
Source: Ministry of Acceleration of Eastern Indonesia Development(2003),p.7,17,27,36,44,52,58,67,80,89.
Note: A= Socialization of KAPET, B= Having benefit doing business in KAPET, C= KAPET services, D=KAPET promotion of
SMEs activity, E=Response of BP-KAPET on complaints from SMEs.
X=Positive responses
Y= Total questionnaires
Besides the goal of promoting investment in the KAPET areas, KAPETsare designed to support and encourage the rise of SMEs. As shown in Figures2 and 3,the quality of human resources is still low in most of the East Indone-sian regions, which hinders SMEs development. For example, SME partici-pants need adequate knowledge concerning business management, financingand technology. For these reasons, the Managing Bodies of KAPET have theimportant function of facilitating SMEs with counseling and assistance, suchas administering licenses for developing new SMEs and assisting applicationsfor bank credit to make operating a SME easier.
Unavailable and/or poor infrastructure and facilities are considered themajor constraint faced by KAPETs. Mostly KAPETs are located in a munici-pality/regency that is far from the main city of the province, and lack infra-structure hubs. In this case the facilities are not limited to roads, ports andairports that are of concern merely to facilitate investors; there is also a need
Ersi S. Soenandar184

for social infrastructure such as housing, transportation, public health centers,clean water supply, and education.
4.2. Case studies of KAPET Parepare and KAPET BimaKAPET Parepare was established based on Presidential Decree No.164 of
1998.It is located in South Sulawesi and comprises an area of around 6,905km2(11% of the total land area in South Sulawesi).The KAPET consists of themunicipality of Parepare and 4 regencies(Barru, Sidrap, Pinrang andEnrekang)with a total population of 976,063 people and population density of141 people per km2(Table 7).Infrastructure in the KAPET area includes sixports and 3,099.6km of roads. Of total road length, the conditions are 45.3%good,38.4% poor and 25.2% substandard.
Table7.Statistical summary of KAPET Parepare
Municipality/regency Parepare Barru Sidrap Pinrang Enrekang Total
Area(km2) 99.33 1174.72 1883.25 1961.77 1786.01 6905.07
Population(people) 108,132 151,240 246,084 309,876 160,731 976,063
Population density(people per km2) 1,089 129 131 158 90 141
Road length(km) 285.55 590.1 1,042 654.66 527.27 3,099.6
Ports 3 1 - 2 - 6
Source: Same as Table6,p.3,5.
Note: Based on KAPET Parepare data base for December2000.
The KAPET office is located in Parepare municipality, which is adminis-tered by the governor of South Sulawesi as chairman. All activities are man-aged by the vice chairman as executive/general director, assisted by fourrelated directors who supervise 15 divisions. According to data obtainedthrough an interview with the general director, KAPET Parepare employs 46people, including 10 local government officers(Perbantuan Pemda)and 36 con-tract employees. In terms of educational attainment, two employees have post-graduate training,35 employees have undergraduate degrees, eight employeesare senior high school graduates and one employee is a junior high schoolgraduate(Table 8).
Table8.Number of the Managing Bodies of KAPET Parepare employees
and educational background
Number of
employees
Education background
Post graduate UndergraduateHigh school
Senior Junior
Local government officer
(perbantuan pemda)
10 2 7 - 1
Contract officer 36 - 28 8 -
Source: The present author’s survey(May,2004).
Government Policy in Solving Uneven Regional Development 185

KAPET Parepare consists of 3,349 small-scale industries and 2,074 infor-mal sectors(54% of the SMEs with legal entity status, comprised of 37% co-operation,11% incorporation and 6% corporation).From Table 6,however, itcan be seen that the role and function of KAPET Parepare has not been favor-able for SMEs.
Market destinations for KAPET Parepare are classified into domestic,inter-island and international. Export activity is concentrated in one port har-bor in Parepare municipality, with Singapore as the main international desti-nation. To raise the level of both local and foreign investment, KAPET Pare-pare has implemented non-fiscal and fiscal incentives. Non-fiscal incentivesconsist of a one roof service program: simplified procedures for obtaininglicenses, land use, security in law, and safety. These involve each local govern-ment leader in conveying the annual program in the KAPET, and gatheringdata and saving funds for SMEs through Regional Budget Revenue andExpenditure. Fiscal incentives have been implemented as stated in the previ-ous section.
Like KAPET Parepare, KAPET Bima was also established through aPresidential Decree(No.166 of 1998).KAPET Bima is located in the easternpart of West Nusa Tenggara, exactly in the center of Sumbawa Island, whichconsists of the regencies of Bima and Dompu, and covers an area of 6,921.45km2 with a total population of 706,020 people and population density of 102people per km2.The infrastructure in KAPET Bima includes four small portharbors, one small airport, and 2,873.79km of total road length(Table 9).
Table9.Statistical summary of KAPET Bima
Dompu Bima Total
Area(km2) 2,324.55 4,596.90 6,921.45
Population(people in2002) 189,214 516,806 706,020
Population density(2002) 81 112 102
Road length(km) 1,963.27 910.52 2,873.79
Port harbors 2 2 4
Airports - 1 1
Source: Same as Table6,p.47,49.
Note: Based on Central of Bureau Statistics West Nusa Tenggara Office, Nusa Tenggara dalam angka 2002.
Unlike KAPET Parepare, KAPET Bima is operated from two offices, onelocated in Mataram as the central office and another located in Raba, Bima.KAPET Bima is administered by the governor of West Nusa Tenggara, but allactivities are represented by a vice chairman who also acts as an executivedirector, assisted by four related directors. The Managing Bodies of KAPETBima has 40 employees(including six persons as a professional team),includ-ing 10 local government officers(from Pemda and others),five pensioners, and25 contract employees(mostly pensioner). Of the total employees,15 peopleare assigned to the Mataram office and the others are at the Raba Bima office.KAPET Bima helps the government sector stimulate private investments with
Ersi S. Soenandar186

both non-fiscal incentives and fiscal incentives. In addition, KAPET Bima alsointends to push the development of local investment and SMEs. Based on areport obtained from the Ministry of Acceleration of Eastern Indonesia Devel-opment, the SMEs in KAPET Bima consist of 2,796 small-scale industries, ofwhich 2,033 SMEs are individual business. Moreover, as shown in Table 6,theexistence and functions of the KAPET still are not viewed as beneficial by theSMEs.
KAPET Bima provides some facilities to attract investment. Compared tothe other 11 KAPETs, however, it is still categorized as an abandoned KAPET.If compared to KAPET Parepare, which supports inter-island and interna-tional trade and provides a container port, KAPET Bima is involved only ininter-island trade and the products of the SME are still local market oriented.Moreover, the location of KAPET Parepare is directly connected to the capitalcity of South Sulawesi(Makasar),while KAPET Bima is located in distantsuburb area of Sumbawa Island. KAPET Parepare also benefits from theindustrial estate of KIMA(Kawasan Industri Makasar)in Makasar City.
Table10.Relationship between KAPETs and infrastructure
Province/regency KAPET Industrial Estate Port* International Airport
East Indonesia
W Kalimantan Khatulistiwa N Y N
S Kalimantan Batulicin N Y N
E Kalimantan Sasamba Y Y Y
C Kalimantan Das kakab N Y N
C Sulawesi Batui N N N
Se Sulawesi Bukari N N N
N Sulawesi Bitung N Y Y
S Sulawesi Parepare Y Y* Y
W Nusa Tenggara Bima N N N
E nusa Tenggara Mbay N Y N
Maluku Seram N Y N
Papua Biak N Y N
Source: Web site of Indonesia’s Investing Coodinating Board,
http: //www.bkpm.go.id/en/business, accessed date October10th,2004
Note: N: Unavailable Y: Available*Main port provided with large container capacity.
Table 10 shows the relationship between infrastructure and KAPETs. Forseveral regions in West Indonesia, the existence of industrial estates hasstunted economic growth and people’s incomes. With good social and physicalinfrastructure, the areas connected by industrial estates have faster growththan those with non-industrial estates. Therefore the KAPETs linked to theindustrial estates are much better managed than the other KAPETs. Of thetwelve KAPET locations in East Indonesia, few areas are reported to be func-
Government Policy in Solving Uneven Regional Development 187
tioning actively in serving the city and hinterlands, such as the KAPET inParepare(South Sulawesi),Sasamba and Bitung(Evans and Munir,2002,Sondakh 2003).
5. Conclusion
As a government policy for solving uneven regional development betweenWest and East Indonesia, this paper evaluates the current KAPETs perform-ance. Unsuccessful KAPET programs have been found in most regions, indi-cating that KAPETs have not been well managed consistently. In addition,KAPETs have created various efforts in each region, depending on the location,infrastructures and facilities. Inadequate human resources, both in qualityand quantity, also affect KAPET performance. Since investors tend to beattracted by good infrastructure, including transportation hubs, local govern-ments must assist their areas by providing sufficient infrastructure.
To push the development of East Indonesia, the government has in factundertaken a good policy by providing the Acceleration of Eastern IndonesiaDevelopment(PP-KTI)program, which covered establishment of the 12KAPETs to stimulate investment flow and small-scale industry growth in theregions. To develop the KAPETs the government must be committed and con-sistent in managing the KAPET program, by considering the professionalismof KAPET management. The central and local governments can hire profes-sional teams that are responsible to the government. For example, an expert ininvestment and business rule and strategy to help investors, both foreign anddomestic, and further to support SMEs in fostering their business. Only thencan the program be expected to increase per capita GRDP and bring equalityin income and development between West and East Indonesia.
Doctoral Student, Hokkaido University
AcknowledgmentsThe author gained enormously thoughtful comments and suggestions provided by Professor
Kensuke Miyamoto of Hokkaido University and Associate Professor Tetsuhiko Takai of HokkaidoUniversity on an earlier version of this paper.
ReferencesAkita, Takahiro and Rizal A. Lukman(1995),“Interregional inequalities in Indonesia: A Sectoral
Decomposition Analysis for1975‐92”,Bulletin of Indonesian Economic Studies,31�2,pp.61‐81.
Azis, Iwan J.(1990),“Inpres’ Role in the Reduction of Interregional Disparity”,Asian EconomicJournal , IV�2,pp.3‐27.
Azzoni, Carlos R.(2001),“Economic Growth and Regional Income Inequality in Brazil”,The An-nals of Regional Science,35,pp.133‐152.
Cai Fang, Dwen Wang, Yang Du(2002),“Regional Disparity and Economic Growth in China: TheImpact of Labor Market Distortions”, China Economic Review,13,pp.197‐212.
Central Bureau of Statistics(1999),Keadaan angkatan Kerja Indonesia August 1998,Jakarta.――(2001),Statistical Yearbook of Indonesia 2000,Jakarta.――(2002),Gross Regional Domestic Product Regencies/municipalities in Indonesia 1997-2000,
Ersi S. Soenandar188
Jakarta.Esmara, Hendra(1975),“Regional Income Disparities”, Bulletin of Indonesian Economic Stud-
ies,11�1,pp.41‐57.Evans, Hugh and Risfan Munir(2002),“Local Economic Development in Indonesia: Current Prac-
tice and Lesson to be Learned”, Center for International Policy, Planning and Development(CIPPAD),Working Paper,2.
Financial and Development Supervisory Board(2003),Risk Assessment Koordinasi PembangunanKawasan Timur Indonesia di Wilayah KAPET , Jakarta(Unpublished).
Fujita H. and Dapeng Hu(2001),“Regional Disparity in China:1985‐1994The Effect of Globali-zation and Economic Liberalization”, The Annals of Regional Science,35,pp.3‐37.
Garcia, G. Garcia and L. Soelistianingsih(1998),“Why Do Differences in Provincial Incomes Per-sist in Indonesia”, Bulletin of Indonesia Economic Studies,34�1,pp.95‐120.
Hanna, Donald P.(1994),“Indonesian Experience with Financial Sector Reform”, World Bank,Discussion Papers,237.
Herrmann-Pillath, Carsten, D. Kirchert and J. Pan(2002),“Disparities in Chinese EconomicDevelopment: Approaches on Different Levels of Aggregation”, Economic Systems,26�1,pp.31
‐54.Hill, Hal and A. Weidemann(1991),“Regional Development in Indonesia: Pattern and issue”, in
Hill ed., Unity and Diversity: Regional Economic Development in Indonesia since 1970, Singa-pore: Oxford University Press,pp.3‐54.
Hill, Hal(2000),Intra-country Regional Disparities,Paper Presented at the Second AsianDevelopment Forum, Singapore, June6‐8.
Kameo, D. and P. Rietvield(1987),“Regional Income Disparities in Indonesia: A Comment”, Ek-onomi dan Keuangan Indonesia,34�3,pp.286‐304.
Ministry of Acceleration of Eastern Indonesia Development(2003),Pekerjaan Study Pengemban-gan UKM dan Peranan di Wilayah KAPET Dalam Rangka Meningkatkan Peran Dalam Men-dorong Pertumbuhan Ekonomi dan Meningkatkan Pendapatan Masyarakat by PT. TrivanRosila Utama, Jakarta(Unpublished).
Soenandar, Ersi S.(2004),“The Shift of Indonesian Regional Income Distribution: A Case Studyof Special Region of Yogyakarta’s Economic Development”, Jurnal Ekonomi & Bisnis,4�2,pp.107‐127.
Sondakh, Lucky(2003),“An Economic Survey of Northern Sulawesi: Turning Weaknesses intoStrengths under Regional Autonomy”, Bulletin of Indonesian Economic Studies,39�3,pp.273‐302.
Song, Sunteng, G,.S-F. Chu, and R. Chao(2000),“Intercity Regional Disparity in China”, ChinaEconomic Review,11,pp.246‐261.
Takeda, Tetsuro. and R. Nakata(1998),“Regional Disparities in Indonesia”. OECF Journal of De-velopment Assistance,4�1,pp.193‐215.
Uppal, J.S and Budiono Sri Handoko(1986),“Regional Income Disparities in Indonesia”,Ekonomidan Keuangan Indonesia,34�3,pp.287‐304.
Various Decrees, web site of DP-KTI(http: //www.indonesiaeast.com/Perundangan.asp):Development Council for Eastern Indonesia(DP-KTI)Decree No.1 of2002 on“The National
Policy and Strategy of Acceleration of Development of Eastern Indonesia(Jakstranas PP-KTI)”.
Ministry of Finance(2000),Finance Minister Decree No.200/KMK.04/2000on“The Imple-mentation of Incentives in KAPET”, Jakarta.
Presidential Decree(Keppres)No.120of1993on“The DP-KTI(revised by Presidential DecreeNo.27/1994,No.54/1995,No.75/1998,No.173/1998)”.
____ No.55of2001on“The DP-KTI(revised by Presidential Decree No.44/2002)”.____ No.89of1996on“The KAPET(revised by Presidential Decree No.150/2000)”.____ No.90of1996on“The Establishment of KAPET Biak(revised by No.10/1998)”.____ No.11of1998on“The Establishment of KAPET Batulicin”.____ No.12of1998on“The Establishment of KAPET Samarinda, Sanga-sanga, Muara Jawa,
dan Balikpapan(Sasamba)”.____ No.13of1998on“The Establishment of KAPET Sanggau”.____ No.14of1998on“The Establishment of KAPET Manado-Bitung”.
Government Policy in Solving Uneven Regional Development 189

____ No.15of1998on“The Establishment of KAPET Mbay”.____ No.164of1998on“The Establishment of KAPET Parepare”.____ No.165of1998on“The Establishment of KAPET Seram”.____ No.166of1998on“The Establishment of KAPET Bima”.____ No.167of1998on“The Establishment of KAPET Batui”.____ No.168of1998on“The Establishment of KAPET Buton, Kolaka, and Kendari(Bukari)”.____ No.170of1998on“The Establishment of KAPET Daerah Airan Sungai Kahayan, Kapuas,and Barito(Das Kakab)”.(Website of DP-KTI, http: //www.indonesiaeast.com/Perundangan.asp)Presidential Instruction(Inpres)No.7of2002on“The Implementation of National Policy and
Strategy of Acceleration of Development of Eastern Indonesia(Jakstranas PP-KTI)”.(Web-site of DP-KTI, http: //www.indonesiaeast.com/Perundangan.asp)
Republic of Indonesia(1999),Law No.22of1999on“The Local Government”.(Website of DP-KTI, http: //www.indonesiaeast.com/Perundangan.asp)
____(1999),Law No.25 of 1999 on“The Fiscal Balance Between the Central Governmentand the Regions”.(Website of DP-KTI, http: //www.indonesiaeast.com/Perundangan.asp)
____(2000),Government Regulation(PP)No.20on“The Implementation of Taxation inKAPET(revised by Presidential Decree No.147of2000)”.(Website of DP-KTI, http: //www.indonesiaeast.com/Perundangan.asp)
Web site of Indonesia’s Investing Coodinating Board(Badan Koordinasi Penanaman Modal).(http: //www.bkpm.go.id/en/business).
Ersi S. Soenandar190
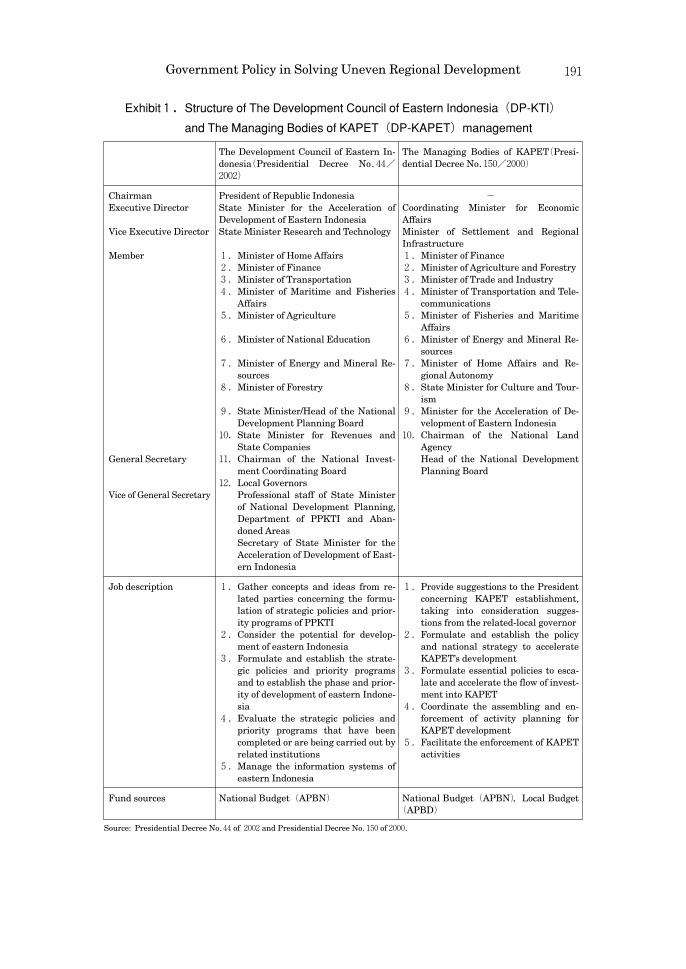
Exhibit1.Structure of The Development Council of Eastern Indonesia(DP-KTI)
and The Managing Bodies of KAPET(DP-KAPET)management
The Development Council of Eastern In-donesia(Presidential Decree No.44/2002)
The Managing Bodies of KAPET(Presi-dential Decree No.150/2000)
ChairmanExecutive Director
Vice Executive Director
Member
General Secretary
Vice of General Secretary
President of Republic IndonesiaState Minister for the Acceleration ofDevelopment of Eastern IndonesiaState Minister Research and Technology
1.Minister of Home Affairs2.Minister of Finance3.Minister of Transportation4.Minister of Maritime and Fisheries
Affairs5.Minister of Agriculture
6.Minister of National Education
7.Minister of Energy and Mineral Re-sources
8.Minister of Forestry
9.State Minister/Head of the NationalDevelopment Planning Board
10.State Minister for Revenues andState Companies
11.Chairman of the National Invest-ment Coordinating Board
12.Local GovernorsProfessional staff of State Ministerof National Development Planning,Department of PPKTI and Aban-doned AreasSecretary of State Minister for theAcceleration of Development of East-ern Indonesia
-Coordinating Minister for EconomicAffairsMinister of Settlement and RegionalInfrastructure1.Minister of Finance2.Minister of Agriculture and Forestry3.Minister of Trade and Industry4.Minister of Transportation and Tele-
communications5.Minister of Fisheries and Maritime
Affairs6.Minister of Energy and Mineral Re-
sources7.Minister of Home Affairs and Re-
gional Autonomy8.State Minister for Culture and Tour-
ism9.Minister for the Acceleration of De-
velopment of Eastern Indonesia10.Chairman of the National Land
AgencyHead of the National DevelopmentPlanning Board
Job description 1.Gather concepts and ideas from re-lated parties concerning the formu-lation of strategic policies and prior-ity programs of PPKTI
2.Consider the potential for develop-ment of eastern Indonesia
3.Formulate and establish the strate-gic policies and priority programsand to establish the phase and prior-ity of development of eastern Indone-sia
4.Evaluate the strategic policies andpriority programs that have beencompleted or are being carried out byrelated institutions
5.Manage the information systems ofeastern Indonesia
1.Provide suggestions to the Presidentconcerning KAPET establishment,taking into consideration sugges-tions from the related-local governor
2.Formulate and establish the policyand national strategy to accelerateKAPET’s development
3.Formulate essential policies to esca-late and accelerate the flow of invest-ment into KAPET
4.Coordinate the assembling and en-forcement of activity planning forKAPET development
5.Facilitate the enforcement of KAPETactivities
Fund sources National Budget(APBN) National Budget(APBN),Local Budget(APBD)
Source: Presidential Decree No.44of2002and Presidential Decree No.150of2000.
Government Policy in Solving Uneven Regional Development 191

Exhibit2.Depreciation and amortization calculation
Physical assets Useful life(years)
Straight line method(%)
Declining Balance method(%)
a. Non-building assets/Intangible assets :
Group I 2 50 100
Group II 4 25 50
Group III 8 12.5 25
Group IV 10 10 20
b. Building assets
Permanent group 10 10 0
Non-permanent group 5 20 0
Source: Republic of Indonesia(2000)and Ministry of Finance(2000).
Ersi S. Soenandar192