government of the gambia - fao.org
TRANSCRIPT
i
THE REPUBLIC OF THE GAMBIA Agricultural Statistics and Resources Economics Unit (ASRE)
Planning Services Unit (PSU) Ministry of Agriculture (MOA)
Banjul, The Gambia
Report of the
Agricultural Census
of
The Gambia
2011/2012
Volume 1: Background and Methodology
June 2012

ii
Table of Contents

iii
FOREWORD Since the 1990s the Government of the Gambia has been committed to sustainable human development and improved living standards of the people of the country, During this period, the Government has established a number of strategies and approaches to achieve these overarching objectives, including: a Vision 2020, Millennium Development Goals, Poverty Reduction Strategies, and very recently a Programme for Accelerated Growth and Employment. Each of these strategies recognized the major roles and contributions of the Agriculture and Natural Resources (ANR) Sector in achieving their respective objectives. Although the sector made impressive growth performances during the past two decades, there were indications more could be achieved from it, especially because of the increasing demands being placed on it to meet changing circumstances in the global economy, from climate change occurrences the national macro-economic environment. The Government recognized this increasing importance of the sector in its development agenda and declared the sector priority to achieve the objectives it has set for the country’s economic development and growth in the medium to long term. It however made effective policy analysis, planning, programming and monitoring conditional for the sector to receive appropriate support. The Ministry of Agriculture recognized the availability of reliable and updated statistics, data and information on the sector would enable it to meet the condition laid by the Government. In view of the paucity and unreliability of available essential agricultural statistics and data on the sector, and the urgency such resources are needed for resource mobilization and implementation of flagship frameworks being established by the Government, the Ministry made approaches to Development Partners to rehabilitate statistics, data and information on the ANR sector. FAO responded to the requests or assistance. With the collaboration of the Ministry and other Development agencies, (WFP and UNDP), FAO provided support and elaborated a number of strategies to carry out the rehabilitation process; chief among them, and the first to be planned was a country-wide Agricultural Census, especially since the last such Census on the sector was carried out 10 years ago. The other strategies include carrying out a (NASS), establishing a comprehensive Data Base of the sector, and also an effective Market Information Service, and building capacities in the Ministry for providing efficient services and producing reliable products in statistics, data and information on the ANR sector. Experienced international expertise fielded by FAO and UNDP teamed up with national counterparts of known competence to plan and implement the activity. Because of the limited resources available, there were limitations in sample size and time to administer the survey questionnaires.
iv
Like all such complex technical field operations involving non-technical people such as rural household members, and illiterate farmers, the Census encountered challenges which threatened its successful completion. Available resources were inadequate to resolve the challenges. Additional funds had to be sought from various sources including: FAO, UNDP, Aid in the Gambia, the Gambia Growth Competitiveness Project (GGCP), Ministry of Trade, Regional Integration and Employment (MOTIE). Such funds were used to field additional enumerators, intensify the sensitization campaign, and facilitate mobility and operations of field staff to enable them meet deadlines and ensure quality of their outputs. We are confident that the results of the Census will no doubt make a difference to the decision making process of many users of the ANR sector. Firstly, the Government itself and its institutions; secondly, Development Partners, private sector entities and investors and the human resources in the ANR sector itself. Furthermore, the results will add measurably to the process of harmonizing statistics and data on the ANR sector from the many sources engaged in producing the information in the country presently. Data bases will be established covering a wider range of variables which were hitherto not clearly identified, such as vulnerable groups, their structure, locations and conditions. Such information will enhance evidence-based prioritization which is needed in positioning the sector for development and investment. The successes achieved by this Agricultural Census are attributed, in a large measure, to the hard work of many people. The personal efforts and commitment of the Director General, Department of Agriculture, DOA, whose advice to the implementation of the census was extremely valuable; the Permanent Secretary, MOA, provided the main link between the Government and the FAO and other donors was extremely helpful in promoting the project; the Deputy Director of Planning Services, PSU, whose drive and initiative added to the clarity of purpose for the complex activities of the Census; the staff of the Technical Departments of DOA assisted greatly in collecting the required data. The Gambia Bureau of Statistics (GBOS) provided professional invaluable support in the design of the census; the field enumerators and supervisors sacrificed a lot, working under sometimes harsh and difficult terrain to obtain good results; the data entry and statistical clerks of Planning Services (PSU) demonstrated dedication to their duties, and contributed greatly to the reliability of the data and the ease of processing them. Various other staff of the Planning Services (PSU) too numerous to mention, provided support which facilitated the entire exercise. The Planning Services (PSU) is grateful for their co-operation and assistance and hereby offers its sincere thanks to all of them. Special thanks are due and are hereby conveyed to the international expertise whose professionalism and commitment to the project made the conception and execution of the Census framework possible: Dr. Babaganna Ahmadu, the FAO Representative to the Gambia; Mr. T.E.C Palmer , FAO Retiree consultant in Policy and programming, the principal adviser to the technical team of the Agricultural Census; Mr. James Chiria, the CFTC Agricultural Statistician and Mr. Odame Simmons, the Data processing expert, who were at the helm in formulating, developing and implementing the field programme of the Census; Mrs Sainabou

v
Gaye, the FAO national consultant coordinator of the day-to day activities of the TCP, who provided valuable advice in the planning, resource mobilisation and start-up of the activity; Ms Mariatou Njie, the FAO Assistant Representative, Programmes and Mrs Fatoumata Drammeh, Assistant FAO Representative, Finance and Administration, who facilitated the administrative procedures for the smooth take-off of the project. Finally, thanks are due above all, to those farmers and their families who so willingly provided the information for which they were asked. Without their co-operation, the census exercise could not have been successfully accomplished. It is the hope that the implementation of this study will be the precursor of many more such studies and/or related surveys which will serve to provide reliable statistical data and information as well as enable the development of key indicators that did not surface well in this study describe and reflect the socio-economic developments of the country.
Sait Drammeh
Director General
Department of Agriculture

vi
LIST OF ACRONYMS
AAITG Action Aid International the Gambia
AgHH Agricultural Household
ANR Agriculture and Natural Resources
CFTC Commonwealth Fund for Technical Cooperation
DOA Department Of Agriculture
EA Enumeration Area
FAO Food and Agriculture Organization
GAFSP Global Agricultural and Food Security Programme
GBOS Gambia Bureau of Statistics
GGCP Gambia Growth and Competiveness Project
GNAIP Gambia National Agricultural Investment Plan
GPS Global Positioning System
LGA Local Government Area
MOA Ministry Of Agriculture
PAGE Programme for Accelerated Growth and Employment
PSU Planning Services Unit
PrPS Probability Proportionate to Size
UNDP United Nations Development Programme
WFP World Food Programme

vii
EXECUTIVE SUMMARY
HOUSEHOLD AND HOLDING CHARACTERISTICS
Agricultural Households
The Gambia Census of Agriculture 2011/2012 estimated 82,027 agricultural households (AgHH)
representing 18.6% increase over the 69,409 AgHH estimated in 2001/2002. The breakdown by
sex of head of households was 74,633 (or 91%) male-headed and 7,394 (or 9%) female-headed
households. The majority (46%) of the holders were in the 45 – 65 age-category.
Members of Households
The number of family members living in agricultural households was estimated to be 861,739 of
which was a 17.3% increase over the 767,605 household members in 2001/2022. The largest
increase in the number of household members was 28.0% in the in 26 – 45 age-group for males
and 37. % for females in the 46 –65 age-groups There was a 10% increase in the number of
under-10 year old males but a 3.7% decrease for female children in the same age-group.
Relationship of members to household head
The three top most visible relationships of the members of the household to the head of
household are sons (28.7%) followed by daughters (19.3%), and spouses (14.5 %.). At the
regional level, West Coast Region recorded the highest (49.2%) of the house hold family
members being sons and daughters followed by NBR (47.4%).
Educational level of members
In comparison to the 2001/2 Census, there was an overall 44.5% increase in household members
of at least 5 yrs. About one-third (308,803 or 35.8%) of the members of the farmer’s household
reported having no formal education; while 283,845 (32.9%) had received Arabic Madrassa
education and 119,477 (13.9%) primary education
Occupation
There were a total of 541,259 family house hold members of age 10 years and above which 3.7%
more than as at the last was 2001/2 Census. For those categories of occupation for which
numbers were estimated in both censuses, the number of crop farmers increased by 87.6%,
artisans by 90.9% and those in public/civil service by 68.0% whereas the numbers in agro-
processing and unskilled labour decreased respectively by 80.0% by 56.2%.
Specifically from the 20011/12 census, the largest primary occupation at the national level was
farming (crop and livestock), employing 490,158 household family members or 90.56% of the
total population followed by civil/public servants with 19,489 (3.60%). However, at the regional
levels, West Coast Region recorded the highest number of household family members reporting
farming as their primary occupation with 126,266 (25.8%) household members or followed by
NBR with 94,810 (19.3%).

viii
As for the secondary occupation of the household members, out of the 152,195 household family
members, 78,255 (51.4%) were engaged in farming (crops and livestock) followed by trade
32,936 (21.6%), unskilled labour 18,552 (12.2%) civil/public servants 10,188 (6.7%)
respectively.
Marketing and Distribution Information
In general, farmers do sell some of their produce after harvest to meet other obligations in the
households. The census results showed that 47.4% of the households do sell part of their produce
while only 3.8% sells all the produce obtained from the fields.
At the regional level, 68.7% of the households in CRR (South) reported that they do not sell their
produce followed by CRR (North) with 58.0% while over 70% of the households in WCR
reported selling part of their produce followed by LRR with 60%.
As for the mode of transportation for household sales, horse/donkey cart and head loading were
the main forms of transport representing 85.9% and 8.8% respectively. CRR (South) reported the
most important form of transportation as horse/donkey cart (94.5%) followed by NBR (92.9%).
The bicycle /motor cycle was the least important form of transportation reported by WCR (3.3%)
and URR (2.6%)
Distance from household to point of sale and type of market
With regards to the distance from the household to the point of sale of produce, 62.2% of the
households reported that they travel more than one kilometer to sell their produce while 21.6%
reported traveling more than 2 kilometer to sell their produce and 16.3% travel more than 5 kms
to sell their produce.
At the regional levels, 67.5% of households in the URR reported traveling one to two kilometers
while 26.8% of households in CRR (South) reported traveling more than 2 kilometers’ to sell
followed by 25.3% from CRR (North). Also, 44.6% of households reported selling their produce
through private dealers while 35.5% reported selling at daily markets and only 19.9% reporting
selling to weekly markets.
Cooperatives, Marketing Societies and Banking Institutions
Regarding membership to farmers’ organizations, 33.6% of the households reported being
members of Government-assisted projects while only 2.6% reported household family members
being members of Commercial Banks. There were regional disparities with CRR (South)
recording the highest household members with membership to Government-assisted projects
(42.8%) followed by LRR (38.6%). LRR and CRR (South) reported 32.9% and 24.5%
respectively household family members belonging to Visacas

ix
As for support received from farmers’ organization, 28.6% of the households reported receiving
agricultural input/fertilizer assistance followed by low scheme (25.3%) while 12.4% from
unspecified source. Regionally, CRR (North) recorded the highest (57.0%) households receiving
assistance from low schemes followed by WCR (37.1%). It is noticeable that in NBR, 20.9%
and CRR South, 17.2% reported not receiving support from any of the specified sources.
Extension service was accessed by 77.9% of the household members while 22.1% got market
information services. Regionally, information through extension services was also common to all
the regions with CRR (North) reporting the highest (95.3%) access.
Revenues from Non-Farm Employment and Remittances
Non-farm employment and remittances are sources that contribute immensely towards household
income generation in the Gambia. A total of 13,852 household members received such income:
12,423 (89.7%) males and 1,429 (10.3%) females. For regional comparisons, 16.8% of the males
in West Coast received their income from trading compared to 67.1% of the women in the region
who also received their income from trading.
Horticulture Crops Grown
For nearly all horticultural crops, there was an increase in the number of agricultural households
engaged in horticulture compared to 2001/02 census. Nationwide, okra was grown by 63.1% of
the agricultural households followed by 56.5% growing hot pepper. There was also an increase
in the number of agricultural households engaged in planting tree crops compared to 2001/02.
The number of households growing avocado went up by 452.9%. It is notable that tree crops
such as oil-palm and sheer-butter are not as prominent as they used to be instead, grape fruit,
sour sopa and guava seem to have dominated in recent years.
Livestock and Poultry Owned
In comparison to the 2001/02 census, there was 11.2% increase in holdings reporting all cattle
and 23.3% increase in number of total cattle. Similar results were obtained for sheep and goats.
However, for poultry, the number of holdings reporting poultry dropped by 34.2% whiles the
number of (local) chicken increased by 219%.
Ndama Cattle: A total of 29, 533 households (36.4%) of all households in the Gambia reported
having 392, 287 ndama cattle (129,996 male and 262,292 female). This is over 95% of the total
cattle (including non-ndama cattle). Over 50% of the ndama cattle were under 1 to 4 years age-
group. It is notable that female ndama cattle constitute over 60% of the total ndama cattle. The
CRR (South) reported the largest ndama cattle population of 122,998 of which 70% are females
followed by NBR with 74,179. West Coast reported the least ndama cattle of 2,839.
Non-Ndama Cattle: At the national level 1,392 households reported having a total of 6,184
(1.5%) non-ndama cattle. The West Coast region reported the largest number of heads of non-
ndama cattle (2,839 heads: 759 male; 2,080 female) from 263 households while North Bank had
the largest number of households (689) reporting a total of 1687 non-ndama cattle (724 male;
963 female).

x
Cattle owned by women: A total of 53,131 head of cattle or 13.3% of total cattle (both ndama and
non-ndama) were reported to be owned by women with URR having the largest number of cattle
(17,372) owned by the women.
West African Dwarf Goats and Other Goats: A total of 49,506 households or 60.35% of the
total households in the Gambia reported having 296,939 West African dwarf goats of which
85.708 were males and 211,231 were females. Over 57% of the West African dwarf goats were
between ages 1 to 2 age-groups. Female goats constituted over 70% of the total West African
dwarf goats in the country. At the national level, a total of 1,417 households reported having a
total of 6,051 (2,086 male and 3,965 female or 2.0%) Non-West African dwarf goats while at the
regional level, NBR reported the largest number (2834) of non-west African dwarf goats.
Goats owned by women: A total of 124,789 goats were owned by women with URR reporting the
largest number of goats owned by women with a total of 31,625 (25.3%) of the total goats owned
by the women.
Djalonke sheep: A total of 28,606 households (34.9%) of all agricultural households in the
Gambia reported having 139,296 Djalonke sheep of which 47,558 were male and 91,738 female.
Over 42% of the Djalonke sheep are in the 2 year age-groups and the female Djalonke sheep
constituting over 65% of the total Djalonke Sheep in the country. CRR (South) reported the
largest Djalonke sheep population of 28,941 of which 20,888 are females followed by WCR with
26,278 Djalonke sheep. LRR reported the least Djalonke number (12,324).
Non-Djalonke sheep: Ccountry-wide, 1,392 households reported having a total of 4,686 (1,566
male and 3,120 female or 3.4%) of the Non–Djalonke sheep. NBR reported the largest number
(1,859) of non-Djalonke sheep and CRR (North) reported the least number (46)...
All sheep owned by women: Of all sheep, 41,766 or 29.0% were reported owned by women with
URR reporting having the largest number (12,569).
Donkeys and Horses: A total of 32,658 households (40%) of all households in the Gambia
reported having 57,580 donkeys (27,583 male and 29,997 female). Over 80% of the donkeys are
in the 2 years and above age-group. Female donkeys constituted over 43% of the total donkeys in
the country. The URR reported the largest donkey population of 18,227. As for horses, country-
wide 9,202 (11%) households reported having horses with a total number of 16,903 (7,505 male
and 9,398) horses. The Upper River Region reported 45% of the households owning horses
followed by North Bank Region (24%) and Central River Region North (14.5%). The West
Coast Region was least with 0.6% of the households reporting horses.
Donkeys and Horses owned by Women: The total number of donkeys and horses owned by
women was 2,274 representing 3.1% of the total number of donkeys and horses. Age-wise, 1,894
of the animals were 2 years and over representing 83.5% of the total owned by women. The
Upper River Region reported the highest number of 1,334 donkeys and horses owned by women
which is 59% of the total. These are significant revelations in the development of crop and
livestock production, as over the years all farming animals were owned and managed by men but
this trend has now change.

xi
Pig numbers: With regards to estimates of pig numbers, the national total was estimated 6,383 at
local pigs reported from 733 (0.9%) of all households; the 2011/12 did not capture many
households reporting exotic pigs. Ccompared to 2001/2002 agricultural census when 7,962 pigs
were estimated, this represents a 20% decline in local pig population in the country. WCR and
NBR regions were primarily the regions where pigs are reared with 76% of this total is in these
two regions and the rest are scatted between CRR North and South. Only 607 or 9.5% of the
local breed were reported owned by women.
Chicken and other poultry: 41% of all households reported rearing chicken and other poultry
types and 38% of this as the highest regional percentage of households is in West Coast Region
while the lowest percentage of 6% is in Central River Region North. The total number of chicken
reported was 1,870,376 as compared to 586,331 in 2001/2002 agricultural census representing a
219% increase with the largest chicken population (911,117) or 48.7% reported in West Coast
Region. This result may not be surprising due to the large commercial poultry activity in the
region. URR reported the least chicken population with 7.67%.
Livestock Products: 62.7% of all households reported selling live animals which could be a
resort to a coping strategy during difficult periods. The regional distribution shows that Upper
River Region recorded the highest percentage (87.0%) in sale of live animals followed by 74.4%,
66.1%, and 63.6% for Lower River Region, West Coast Region and Central River Region North
respectively, while the lowest percentage of 47.6% is recorded in Central River Region South.
FIELD CHARACTERISTICS, AREA AND PRODUCTION
Number and distribution of crop fields
The total number of fields cultivated was estimated at 491,202 which was an overall increase of
72.7% country-wide compared to that of 284,388 in 2001/02 census. The largest increases in
number of fields cultivated were in Central River North (135.7%) and Central River South
(128.4%).
Distribution of fields by main crop and region
Upland rice had the largest number of fields nation-wide with 89,699 fields or 18.3% of all the
fields in the country followed by 80,840 or 16.5% of fields under groundnuts (73/33). The
number of fields under Findo was the lowest (0.2%). Out of the eight major food crops
cultivated, the main staples in the country which are cereals were planted on 12. %, 11.1%, 4.1%
and 3.7% respectively of maize, early and late millet and sorghum totaling to 30.9%.Farmers are
now very much in o the cultivation of Nerica rice which has seen a 74% increase in area as
compared to 2010/2011 cropping season.
Distribution of fields by secondary crop and by previous season’s crop
The fields on which important or major crops are grown as secondary crops were very few since
95.6% of the fields on secondary crops were devoted to minor crops. When the previous season’s
crop in a given field is taken into account, the largest number 70,657 or 17.5% of all fields were
those where the previous crop was early millet

xii
Farm Fragmentation and Field Management
The fragmentation of the farm gives a measure of the intensity of agricultural activity. The
census results showed that 30.9% of the households cultivated between 1 to 2 fields with 58.9%
of the households in West Coast in this category. The households with 11 or more fields were
mostly in Central River North (21.6%) and Upper River Region (21.0%)
Males managed 53.3% of the fields while females managed 46.7% and regardless of sex, the
majority (48.8%) of field managers was in the 31–50 age-group. The pattern was similar across
the regions except to note that in Lower River Region, in this 31-50 age-group was the lowest
(11.4%) of managers who are male but highest (45.1%) who are female.
Quantity (kg) and of Source of Seed Used
Maize: The quantity of maize seed used by source in the Gambia totaled at 713,915 in CRR
South followed with the highest quantity relative to the regions with 158,825 whilst LRR
employed the least number of maize seeds used by source with 33,730.
Early millet: The quantity of early millet seeds used by source in the Gambia totaled at 1, 039,
837kg. NBR used the highest quantity relative to the regions with 418,247 whilst WCR used the
least number of early millet seeds used by source with 7870.
Late millet: Lower River Region used the smallest number of Late millet seeds (618 kegs), while
RRR used 154,771 kegs.
Sorghum: Lower River Region used 786 kgs of sorghum seeds and in Upper River Region, a
total of 215,146 kgs of sorghum seeds were used during this season. This is an indicator that
URR is the largest producer of sorghum and late millet.
Upland Rice: North Bank Region used the largest number of upland rice seeds followed by
Lower River Region (263, 025 kgs). The lowest quantity of seeds used was from Central River
Region North (16,623 kgs).
Swamp Rice: A total of 378,369 kgs was used by Central River Region South and 233,845kgs by
Central River Region North. North Bank Region used the lowest amount of seed (149,935kgs).
Groundnuts (73/33): Upper River Region used the largest number of new groundnuts (73/33)
seeds (1,205,414 kgs) followed by Central River Region North which used a total of 1,058,606
kgs. LRR used the smallest quantity of seeds of 85,013 kgs while CRR South used 882,154 kgs.
Groundnuts (28/208): North Bank Region used the largest total number of old groundnut seeds
of about 1.9 million kg. Upper River Region used a total of 1,065,365 kg of old groundnuts
seeds; the second largest Central River Region North used the lowest number of old g/nut seeds
(257965 kg).
Sesame: Lower River Region used the lowest amount (93kg) of seeds; NBR used 13,998 kg.

xiii
Findo: Central River Region South used the lowest quantity of findo seeds (360kg) while Upper
River Region used the highest amount of 2102 kgs.
Nerica: Nation-wide, 848,927 kg of Nerica seeds was used of which the main source was down-
produced (624,725kgs). North Bank Region farmer’s used the largest number of Nerica seeds of
285,563 kgs followed by Upper River Region (222,288 kgs).
Area under crop
The area under all crops was estimated to be 343,949 HA; an increase of 12.8% over that of the
last census when it was 304,856 HA. Crop-wise, the largest increases in area were realized in
Upland rice where area increased by 115% from 8,915 HA in 2001 to 19,198 HA in 2011 and in
Swampland Rice by 114% from 6,953 HA in 2001 to 14,852 in 2011.
Although area under new Groundnuts (73/33) increased by 52% from 36,109 HA to 55,006 HA,
that under old Groundnuts (28/206) decreased by 36% from 102,779 HA down to 65,397 HA.
Area under NERICA has grown in the period since the last census to 12,872 HA.
Crop Production
Compared to 2001/02, production increased for maize (12.1%), early millet (19.6%), upland rice
(59.4%), swampland rice (41.4%) and new groundnuts (15.5%) but decreased for late millet,
sorghum and old groundnuts (28/206) by 14.8%, 41.7% and 45.0% respectively.
Groundnuts (both types) had the highest production of 87,629 MT followed by early millet
(77,462 MT), maize (30,375 MT and NERICA (23,302 MT). The least production was for
Sesame (22 MT) from WCR. The highest production of maize was in NBR (6,993 MT) as well
as early millet (38,236 MT). Most NERCIA was produced in WCR (5,890 MT) followed by
URR (4,315 MT).
Land tenure and practices
The number of fields owned under community increased by 360% compared to that of the last
census of 2001/02 but that under others such as by permission or special arrangement has
decreased by 18.4%. At the national level, the family ownership dominated (49.2%) and for the
regional comparisons, the family ownership dominated in LRR (61.6%). Individual ownership
of fields accounted for 39.7% of the fields in CRR, 38.4% in WCR and 31.9% in URR.
On average, family owned fields have been used most (21.4 years), closely followed by
individually owned fields (20.8 years). On the other hand, borrowed and leased fields have been
used for shorter durations of 5.4 and 3.4 years respectively. These observations may have
implications on soil fertility and resting of land generally.
Agricultural power and machinery
On fields that use human power energy sources, most of the tools and implements used by the
farmers are still the basic ones and in all cases, the number of fields on which they were used
increased except for harrows with 54.4% drop. The predominance of the hoe is evident where it
is used on 90.2% of the fields. The regional pattern of use of the tools and implements is similar.

xiv
BASIC CONCEPTS AND DEFINITIONS USED IN THE CENSUS
The basic concepts and definitions used in this Report generally followed the guidelines set by
FAO during the 2000 FAO World Census of Agriculture Programme. However some were
developed as best suited to the situation in the Gambian situation and the more important
ones included:
Enumeration Area: An E.A. may be a single village or group of villages. Several E.A’s may also be within a single village or town (EA has a population of 500 people). For the purpose of Agricultural Census, the pre-determined number of sample EAs for the country as a whole are allocated to the districts, in proportion to their agricultural population.
Locality (Settlement): A locality is a village or town. No physical boundaries are given. So
the locality goes on and on until one reaches the outskirts of the village or town. An EA comprises of one or more localities depending on the size of the localities contained.
Alkalo: The head of a village or town Compound: A compound may be defined as a “roofless“ structure consisting
of a space enclosed or in some case not enclosed by walls and
containing one or more buildings or huts. There can be a
separate single structure which constitutes a compound by itself.
Sinkiro: A group of persons living together and eating together from the same pot regardless of whether they live in the same house.
Household: A group of individuals, usually related, that conduct work
activities (farming or non-farming) as a unit and pool their resources from their activities. A household may contain one or more sinkiros.
Head of the Household: The head of the household is the person (male or female) who is
acknowledged as such by all other members. Such a person is usually vested with the responsibility for the maintenance of the household and gives advice to other members on all matters of social and economic significance.
. Respondent: The person, who answers the question for the census, usually is
the holder.

xv
Agricultural Holder: The holder is the person (man, woman or youngster) who makes
the day-to-day decisions for the agricultural holding. A holder could be the owner, manager, senior partner, etc. but should be present at least 6 months per year.
Agricultural Holding: An agricultural holding is defined to include all the land that is
used wholly or partially for agricultural production under one technical or operational unit by one person alone or with others without regard to title, legal form, size or location. Non-crop agricultural units producing livestock and poultry are also considered as holdings, if the scope of the survey is extended to a count of livestock and poultry.
Agricultural Production: Agricultural production includes the growing, processing and
marketing of field crops, fruits and vegetables and the rearing of livestock, small ruminants (goats, sheep) and poultry/rabbits and their products.
Field: Piece of land, inter-cropped or planted in one or more crops. Field manager: The field manager is the person (man, woman or youngster) who
makes the day-to-day decisions for a particular part of the agricultural holdings (fields), without necessarily being the owner of that part.
Plot: Piece of land demarkated on a field for yield/density studies. Lummo: Local Weekly market for both whole and retail transactions of
agricultural and general merchandise
Irrigation: Watering of matured plants/trees using any method, such as watering cans, buckets and any other type of container.
Pruning: Pruning is a horticultural practice involving selective removal of
parts of a plant, such as branches, buds, or roots. It is the act of trimming, or removing what is superfluous which helps to stimulate flowering, hence produce plenty of fruits.
- 1 -
Chapter One Introduction
Background
Successive Governments of the Gambia since the late 1980s have demonstrated their
commitment to pursue sustainable human development and improved living standards of the
people of the country. Several approaches have been developed and are in various stages of
implementation to meet these long term objectives.
The Agriculture and Natural resources sector has been central in nearly all of these strategies,
for a number of reasons; the sector houses and provides livelihoods and income for the largest
percentage of the population (about 65-70 per cent); provides over 55 per cent of national the
food security requirements; contributes about 40% of exports and foreign exchange earnings of
the country.
With rapid increasing population of the country, changes in the global economy and climate
change development have placed increasing pressure on the Government to develop and
establish frameworks to address the demands emanating from these changes. The ANR sector
has been central in these frameworks essentially because of its measurable current roles and
contributions to economic and social development of the country, and more so because of its
tremendous potential to make even more significant contributions to meet the rising
challenges to sustainable economic growth of the country.
The Agriculture and Natural Resources (ANR) sector
A Policy has been established for the sector, and other sub sector polices are in various stages of endorsement and implementation, all of which are providing Vision and guidelines in the use, management and development of the sector and sub sectors. Furthermore, the Government has recently established flagship programmers for economic development, targeting food security, poverty reduction, employment, income, competitively and management of the natural resources of the country. These objectives are elaborated in the PAGE, GNAIP. Statistics, data and information on the ANR sector
Reliable statistics, data and information are invaluable to determine, plan programme and
monitor the nature and extent of use and management of the ANR sector for it to make
optimum contributions in achieving the objectives of the Frameworks such as mentioned above
being established for economic and social development of the country. Appropriate
information resources in quality and quantity, at disaggregated levels, by sub sectors and
activity are needed to facilitate effective implementation and monitoring and evaluation of
these Frameworks, as well as the optimum use and management of the ANR sector.

- 2 -
This suggests the need for a system that regularly produces precise agricultural statistics, data
and information on a regular basis at various levels. The Government recognizes the
inadequacies of its technical services in the Ministries associated with the ANR sector to
produce such products, and sought assistance from Development Partners to rehabilitate the
processes producing such services and products, in order to ensure reliability, quality and
timeliness of such resources. The assistance, led by FAO of the United Nations designed a
number of strategies for the rehabilitation process. The first and more complex of them is the
carrying out of a National Agricultural Census, especially since the last such Census was carried
out 10 years ago.
Objectives
The long-term objectives of The Gambia Census of Agriculture 20011/12 were:
a. Improvement of the capacity and capability in the to implement an agriculture census and thereby provide agricultural statistical data within the overall integrated agricultural statistical system;
b. Provision of national agricultural statistical indicators for assessing and monitoring of the implementation of agricultural development programmes and interventions;
c. Monitoring progress towards the Millennium Development Goals (MDGs); d. Poverty alleviation
The more specific objectives were:
a. Establishment of a viable sampling frames for agricultural surveys and censuses; b. Development and implementation of a national programme for an agricultural census
and an annual crop and livestock surveys to collect Food and Agricultural statistics; c. Improvement of skills and knowledge of field staff in agricultural statistical data
collection and compilation techniques and thereby develop the capability for undertaking agricultural censuses and surveys as well as compile relevant indicators;
d. Collection and accumulation of annual agricultural statistics; e. Establishment of an agricultural data bank; f. To provide data on the structure of agriculture, especially for small administrative units,
and to enable detailed cross tabulations and g. To provide data to use as benchmarks for current agricultural statistics
Scope and Coverage
For the purpose of 2011 Agricultural Census, four hundred (400) EAs were selected country-wide. The number of EAs allocated to a District within an Agricultural Administrative Region was in proportion to the total number of agricultural households (sampling frame) in that district as per the 2003 Gambia Housing and Population Census.
The EAs selected thus were the first-stage of sampling. All the households in the selected EA were listed in order to identify those engaged in agricultural and/or livestock activities i.e.

- 3 -
agricultural households (AgHH). At the second stage, five (5) AgHHs were sampled for subsequent more detailed enumeration on the following household demographic and farm (holding) characteristics:
Occupation of AgHH members
Field inventory by main crop and management
Marketing and distribution information
Revenues from non-farm employment and remittances
Livestock and poultry
Crop area and yield
Employment in agriculture
Land tenure and practices
Agricultural power and machinery
Field practices and storage facilities

- 4 -
Chapter Two
Census Organization and Preparation
Legal Basis
The census was conducted under the Authority of the Gambia Bureau of Statistics (GBOS) 2005 by virtue of which the confidentiality of information collected is not impaired. The MOA conducted the census in close collaboration with GBOS who provided the Statistical Frame comprising all Enumeration Areas (EAs) of the whole country. For the selected EAs, GBOS also provided the corresponding maps together with identification information. During the enumerator training, the Statistician General gave a presentation on the importance of data collection with particular emphasis on agricultural surveys.
Organisational Structure
Institutional setting
The census activity was hosted in the Planning Services Unit of the Department of Agriculture
(DOA), Ministry of Agriculture (MOA). A logical Framework was prepared to guide the
implementation of the Census from its planning through implementation, to processing, and
finalization.
Human Resources
The process included the use of a mix of national and international expertise as follows:
- A National Consultant Statistician (Retiree Statistician) led the preparation and startup of the field operations including Training of enumerators, field supervisors and holding of a Users/Producers Workshop; monitoring of the field activities, processing and preparation of the Report
- A National Consultant for Processing entry and tabulation of data - Staff of the MOA provided services as Enumerators, Field Supervisors for quality control;
Data Entry Clerks; Data Processors - The Gambia Bureau of Statistics (GBOS) provided professional and technical guidance to
the planning and carrying out of the Census, especially in alignment of the process with the national Statistics grid
- An International Agricultural Statistician, provided by the Commonwealth Secretariat provided technical advisory and supervisory service in the field operations of the Census, quality control.
- Entry and tabulation of the data obtained from the field operations, training officers of the Statistics Unit in various aspects on managing data;, preparation of the Report; provided technical support to the overall rehabilitation of management the Statistics Unit of the PSU, especially guiding the newly appointed Head of Statistics Unit of the Ministry

- 5 -
- An FAO Regional Statistician provided technical backstopping of the Census, especially providing advice on procedures, nature and scope of training, preparation of Reports, integration of the Census findings into data bases within and outside the country
Besides the staff at the headquarters, there was staff in the field comprising of 83 enumerators and 15 supervisors. The Census Data Processing Personnel included:
- 1 National Data Processing Consultant
- 1 UNV Data Processing Specialist
- 1 National Data Analyst
- 8 Data Entry Clerks
Census Materials and Equipment:
There were a number of materials and equipment used in census which included Forms, Manuals and other materials. The data were collected using seven structured questionnaire forms:
- Form 1 - Listing Questionnaire: which was used to list all the households in a sampled EA, identify those which at least an agricultural activity or had livestock (i.e. Agricultural Holdings);
- Form 2 - Household Questionnaire: which was used to collect data on the demographic characteristics of Household members as well as structural type of data on the Agricultural Holding;
- Form 3 - Area Measurement Questionnaire: which was used for collecting data on field areas using a GPS device;
- Form 4 - Harvest Questionnaire: was used for recording harvest from yield plots; - Form 5 - Village Questionnaire: was designed to collect community-level data; - Form 6 - Groundnut Questionnaire and - Form 7 - Mango Questionnaire.
Apart from the questionnaires, other materials included the Enumerator and Supervisor Instruction Manuals and record books for the field staff. A Tabulation Plan was prepared in conformity with recommendations of Food and Agriculture Organizations of the United Nations (FAO).
Funding Arrangements
The Government contribution was both in kind and cash in number of areas among them salaries of Headquarters Na and field staff to carry out the agricultural surveys in the project, vehicles and office premises. The project is being operated as an input into the Government’s National Agricultural Strategic Plan for the achievement of PRS II, MDGs (2015) and Vision 2020. The census activities were supported by various international development agencies which included the Food and Agriculture Organization (FAO), World Food Programme (WFP), African Development Bank (ADB), World Bank and United Nations Development Programme (UNDP).
- 6 -
Chapter Three
Sampling Frame and Design and Analytic Procedures
Sampling Frame
The Gambia Bureau of Statistics (GBOS) has defined an enumeration area (EA) for which it has a complete set of maps for all the entire country. The frame for the 2011 Agricultural Census Frame was obtained from GBOS and consisted of the 2003 Population total number of households was used as the measure of size (MOS). The primary sampling units in the sample selection were the EAs used in the 2003 Population Census.
For the West Coast Region, the frame was thoroughly examined and all the EAs in the non-agricultural communities (urban and some semi-urban) in Kombo North were removed. In this way, selection was entirely done using EAs within agricultural communities of the district where farming activity takes place.
Sampling Design
The sampling design used was a stratified two-stage with districts forming the strata and the first-stage units being the EAs selected systematically in proportion to the 2003 total number of households. The second stage-sampling units were the holders within EAs from which a systematic random sample of five (5) holders was selected for enumeration.
Sampling Size Background information from the 2011 Agricultural Census programme had indicated the
sampling error obtained for the early millet crop acreage was determined to be 12%. For a
country like The Gambia, experience has shown that if the number of households in the sample
is increased to about 2000 households or 4% of the total households in the country, this would
result in an acceptable sampling error of 2%.
Consequently, out of the total number of 2434 rural EAs in the country, four hundred (400 or 15%) were sampled. Such a sample was considered to be adequate for providing regional estimates with a reasonable degree of precision. Additionally, it was known from experience of the last agricultural census conducted in 2003 and the subsequent annual sample surveys that by providing adequate logistics (transportation facilities and incentive allowances), an enumerator workload that could be handled was about six EAs.

- 7 -
Sample Selection The required sample size of EAs was selected from each district with probabilities proportional to size (PPS), using the systematic sampling while agricultural households were selected with equal probability systematic sampling procedure.
- 8 -
Chapter Four
Field Organization and Operations
Introduction The experience gained from the last Gambia Agriculture Census of 2003 as well as that from the intervening national annual statistical surveys (NASS) helped a lot in planning the field organization. By good fortune, there was already on the ground about 70 members of staff from the Department of Planning who were conversant with field operations. Nevertheless, because of the increased workload, additional staff was brought in from Extension Service of the Ministry to supplement the field staff.
Training and Deployment of field staff A one-week training course was organized for 85 enumerators and other census field staff from 6th -12th June, 2011. This was held at the Jenoi Training Centre, some 200-km away from the head office in the capital city Banjul, The programme included five days of classroom instructions and two days for field practices. The Enumerator’s Reference Manuals and the Questionnaires Forms that had been developed were used during the training sessions.
The topics covered included undertaking agricultural censuses, familiarisation with the questionnaires and reporting forms, measurement techniques and use of census equipment. Special emphasis was placed on understanding the importance played by data in the planning process and techniques for capturing information. After this training that involved all field staff, another specialist one was held for the 32 supervisors and 10 statistical officers at the same venue. In the sessions, the supervisors’ overall knowledge of the census operations was upgraded. Emphasis was placed on the need for proper data quality control during the field operations. About one month later and just before field measurements started, a refresher course was held for the supervisors on use of GPS. The supervisors were also instructed on the administration of the Supervisors’ Control Forms to assist them in monitoring progress of field work and overall data quality control. After the training course, the field staffs were dispatched to their areas of work. They took with them the census equipment, questionnaires, maps and other supplies such as the record books needed for the field operations.
Data Collection Activities
The first census activity carried out by the Enumerators was the Enumeration Area Listing. Once in a selected EA, they contacted all heads of households. They recorded the names of the

- 9 -
household heads and asked them whether they had any agricultural operations or owned any livestock. In the process, Form 1: Household Listing Form was completed
The listing exercise enabled the agricultural households (AgHH) to be identified out of which five (5) were selected for the subsequent more detailed enumeration. The enumerators then visited and interviewed each of the sampled holders and in the process completing Form 2: Holding Questionnaire and so collecting information about their holding (farm) operations.
Area Measurement
After filling-in Form 2: Holding Questionnaire, the enumerator interviewed the farmer for information on the number and type of crop mixtures in his/her fields. The enumerator made an attempt to obtain the farmer’s estimate of production and where this was possible the information was recorded on Form 3: Field was completed.
Both the enumerator and the holder then walked around each field while the holder pointed out the boundaries of the field. The enumerator made a free-hand sketch of the field indicating the different crops growing in the field on the sketch. After that, he proceeded to measure the field using a Global Positioning System (GPS).
Crop Yield Estimation
The enumerator prepared a list of all the crops grown by the all the sample holders in the EA and passed the list to the supervisor. The supervisor compiled the lists and from each, he selected a sub-sample of two fields for each crop for crop-cut studies. On each sub-plot, the enumerator laid 5mx5m square plots (1/400th of a hectare) at harvest time and harvested the produce. In most cases such harvests were left with the farmer, who was advised to co-operate and not to interfere with them. However, where it was deemed necessary, the enumerators stored the plot harvests at their homes for drying and weighing. The produce was weighed after it had dried and was returned to the farmer. Together with other yield supporting information, the weights of the harvested produce from the plots were recorded on Form 4: Crop Yield Estimation.
Village Questionnaire
At the recommendation of the FAO for the 2010 World Census of Agriculture, community-level data were collected and for The Gambia, this was done by interviewing the village heads using the Village Questionnaire.
Groundnut and Mango Modules
The Gambia Growth and Competiveness Project (GCP) requested for information to be collected on the groundnut and mango modules for which Form 6: Groundnut Questionnaire and Form 7: Mango Questionnaire was used. A stand-alone Report on the Groundnut

- 10 -
Questionnaire Survey was prepared for these.
Field Supervision At every stage of the field operations, the enumerators submitted the completed questionnaires to their supervisors for review and verification. All records were kept to show the number of forms they expected to receive, the expected date of receipt as well as the number actually received and transmitted. Through this procedure, a strict check and control was ensured in monitoring progress of the work. The supervisors checked the work for completeness and accuracy. Unsatisfactory questionnaires are returned to the enumerators for correction. Three Supervisors’ Meetings were held: November 2011, January and March 2012 at Jenoi during which each and every completed questionnaire was checked as described next.
Data Quality Checks At the Jenoi meetings, four groups of the districts were formed to each of which one officer from Head Office, Banjul was assigned in-charge. For each of the Census Forms 2 to 7, taking one district in the group at a time, the group leader reviewed every questionnaire EA by EA and for all the five sampled holders in the EA. Where there was inconsistency such as when the number of Form 3: Area Questionnaires did not match the total number of fields as stated by the famer in the inventory section of Form 2: Holding Questionnaire, the group leader sought an explanation from the supervisor. When the explanation was not satisfactory, the questionnaire was returned to the enumerator for rectification. In this way, there was assurance that only adequately well completed questionnaires were brought to the Data Processing Office in Banjul. The above procedure for data quality check was facilitated by the use of the Supervisor’s Control Forms (SCF) that had been designed. These were used by the supervisors to ensure that each and every item recorded by the Enumerators in all the EAs under their supervision was checked. There were three parts: A, B and C to the Form (Annex xx) each with instructions on how to complete them and carrying the advice that the extent to which the pages will have been completed would assist them plan their itinerary. It turned out that those supervisors who closely followed these instructions found supervision less cumbersome than those who were not diligent in completing them.
The next chapter describes the reception and subsequent treatment of the questionnaires on arrival in Banjul Office to complete the picture of the flow of completed work from the field to the office.

- 11 -
Chapter Five
Data Processing, Analysis and Reporting
Introduction On arrival in Banjul office, each questionnaire or form is carefully registered and the total number received will be counted and recorded in the office receipt and control form. This form also shows the number of forms expected; thus a check is maintained in the office on the flow of completed work from the field to the office. At headquarters, the materials received from the field are checked, verified and cross-checked by a team of Senior Statisticians. The team of statisticians will check and reviewed the work done by the enumerators for accuracy in the filling of questionnaires and forms; implementation of the proper selection procedures; correct measurement of fields; etc. All major inconsistencies, inaccuracies, omissions and unsatisfactory work detected will be returned to the field for resolution and correction. After all satisfactory work (i.e. completed forms), and certification by the team, forms will be send to the Data Entry Receipt and Control of the Data Processing Unit for subsequent processing.
Census Data Processing
Ten (10) X86-based Dell Vostro 230 PCs with 2.0GB RAM and 285 GB Hard drive, with a
processor speed of 3.2GHz on MS Windows 7 were allocated to the Agricultural census data
processing. CSpro, Spss, Microsoft office were installed on these computers.
The main programs, Data Entry, Batch Edit/ Validation and Tabulations were developed by the
National Consultant, National Data Analyst and UNV Data Processing Specialist using CSPro
application from US Bureau of Census. The Data Entry clerks were trained to use the CSPro
application.
The census questionnaires were batched by Enumeration numbers and arranged in sequence of
Holder Number, Household Number and Plot Number for entry. During the batching, the field
records on the questionnaires were randomly checked before inputting the data into the
system as a defence to minimise incorrect data.
The census questionnaires layout, captions, and instructions were used to design the Data Entry
program so that the entry process will be easier, more error free and quick. Furthermore, error
controls were built in every stage of the data processing cycle. For example, Reasonableness
checks, Range checks and Data type checks were incorporated in the data entry program to
avoid field record and typographical errors during the entry stage.
- 12 -
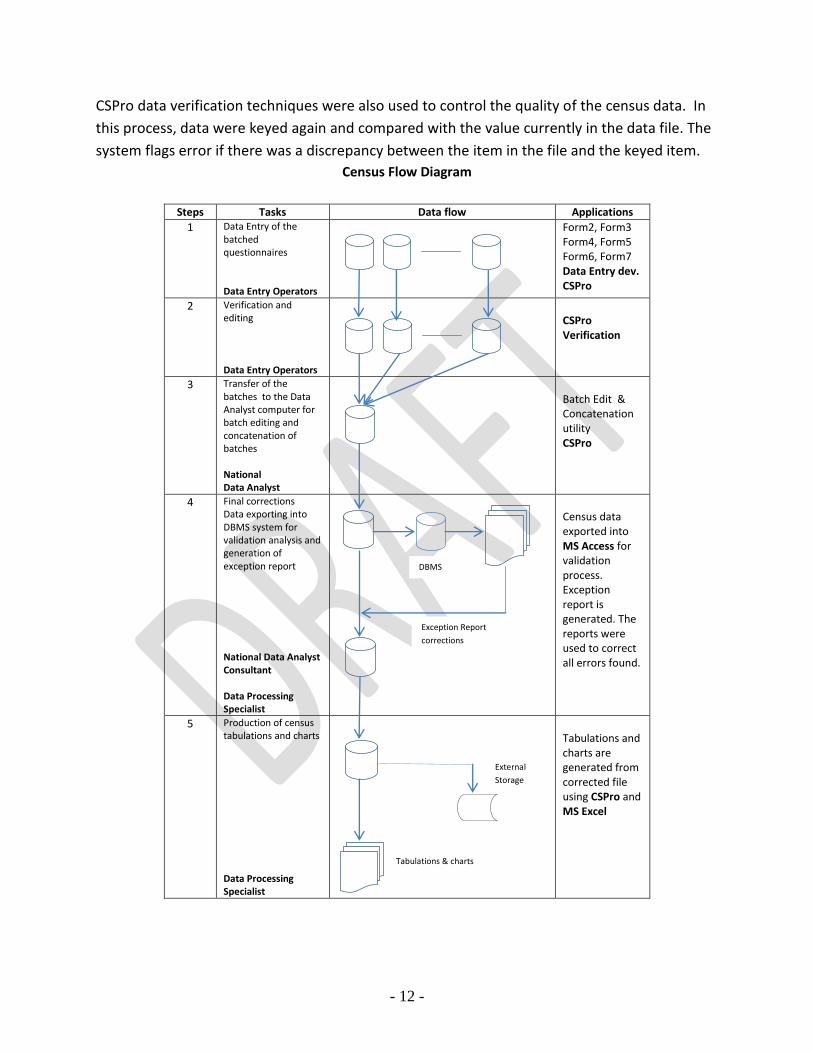
CSPro data verification techniques were also used to control the quality of the census data. In
this process, data were keyed again and compared with the value currently in the data file. The
system flags error if there was a discrepancy between the item in the file and the keyed item.
Census Flow Diagram
Steps Tasks Data flow Applications
1 Data Entry of the batched questionnaires Data Entry Operators
Form2, Form3 Form4, Form5 Form6, Form7 Data Entry dev. CSPro
2 Verification and editing Data Entry Operators
CSPro Verification
3 Transfer of the batches to the Data Analyst computer for batch editing and concatenation of batches National Data Analyst
Batch Edit & Concatenation utility CSPro
4 Final corrections Data exporting into DBMS system for validation analysis and generation of exception report National Data Analyst Consultant Data Processing Specialist
Census data exported into MS Access for validation process. Exception report is generated. The reports were used to correct all errors found.
5 Production of census tabulations and charts Data Processing Specialist
Tabulations and charts are generated from corrected file using CSPro and MS Excel
DBMS
Exception Report
corrections
Tabulations & charts
External
Storage

- 13 -
In addition, batch control methods and consistency checks were further applied to validate the
census data. CSPro batch edit and DBMS MS Access were used in this process. Error exceptions
reports were printed and were used to correct the data file (data flow diagram).
Two (2) IBM 120Gbytes external mass storage device were used to take backups on the census
data every week for disaster recovery purpose.
CSPro was used to produce most of the tabulations from the dummies designed by the census
technical committee. In some cases, excel was used to generate data charts.

- 14 -
Chapter Six Challenges Met, Conclusions and Recommendations
Challenges met during census
There were several challenges met during the implementation of the census activities among
which were:
Enumerator workload was not uniform which explains the wide differences in
questionnaire returns by district and region;
The renovation of the office accommodation of the Planning Services Unit delayed
certain activities such as installing of the computers and software which let the training of
data entry clerks to be differed;
Administrative (allowances) and logistic (mobility) matters raised by field staff made
some of them to refuse to work as there was delay in receiving their allowances;
Lack of mobility slowed down field work and hence overall progress;
There was laxity on the part of some field staff due to non-vigilance of their supervisors
In the past, the Department of Planning (DOP) had staffs that numbered about 70 who
were under the direct command of the DOP Administration. Due to decentralization there
was a shift in the chain of command whereby the Regional Directors now make the field
staff to get the work done. This impacted negatively on the speed and progress of the
census which had been scheduled to be completed by April, 2012 but extended beyond
this date by one month.
Conclusions and Recommendations
To be written after Evaluation Workshop

- 15 -
References To be compiled

- 16 -
Annex 1. Sampling frame and sample allocation of enumeration
areas (EAs) across census districts
Code District
Number* of households
from 2003 GPC Total number
of EAs Sampled number
of EAs
30 Kombo North 3,583 315 17
31 Kombo South 9,144 169 35
32 Kombo Central 3,716 118 15
33 Kombo East 3,939 52 18
34 Foni Brefet 1,646 28 7
35 Foni Bintang 1,677 60 8
36 Foni Kansala 1,478 56 7
37 Foni Bondali 724 32 4
38 Foni Jarrol 738 23 4
40 Kiang West 2,264 34 11
41 Kiang Central 1,200 29 6
42 Kiang East 801 22 4
43 Jarra West 2,005 28 8
44 Jarra Central 865 25 4
45 Jarra East 2,082 41 9
50 Lower Nuimi 4,313 83 20
51 Upper Niuimi 3,485 69 17
52 Jokadu 2,346 64 11
53 Lower Badibu 1,630 34 8
54 Central Badibu 2,177 48 10
55 Upper Badibu 3,463 130 21
60 Lower Saloum 1,623 56 5
61 Upper Saloum 1,623 85 7
62 Nianija 851 34 4
63 Niani 2,055 36 12
64 Sami 2,055 69 11
70 Niamina Dankunku 899 26 4
71 Niamina West 899 32 4
72 Niamina East 6,191 61 12
73 Fulladu West 3,861 164 32
80 Fulladu East 2,133 197 31
81 Kantura 2,095 59 11
82 Wulli 2,919 93 14
83 Sandu 1,476 62 9
Total 81,958 2,434 400 *These numbers were adjusted using the GBOS Publication Population Estimates and Projections (2003-2020), November 2011
- 17 -
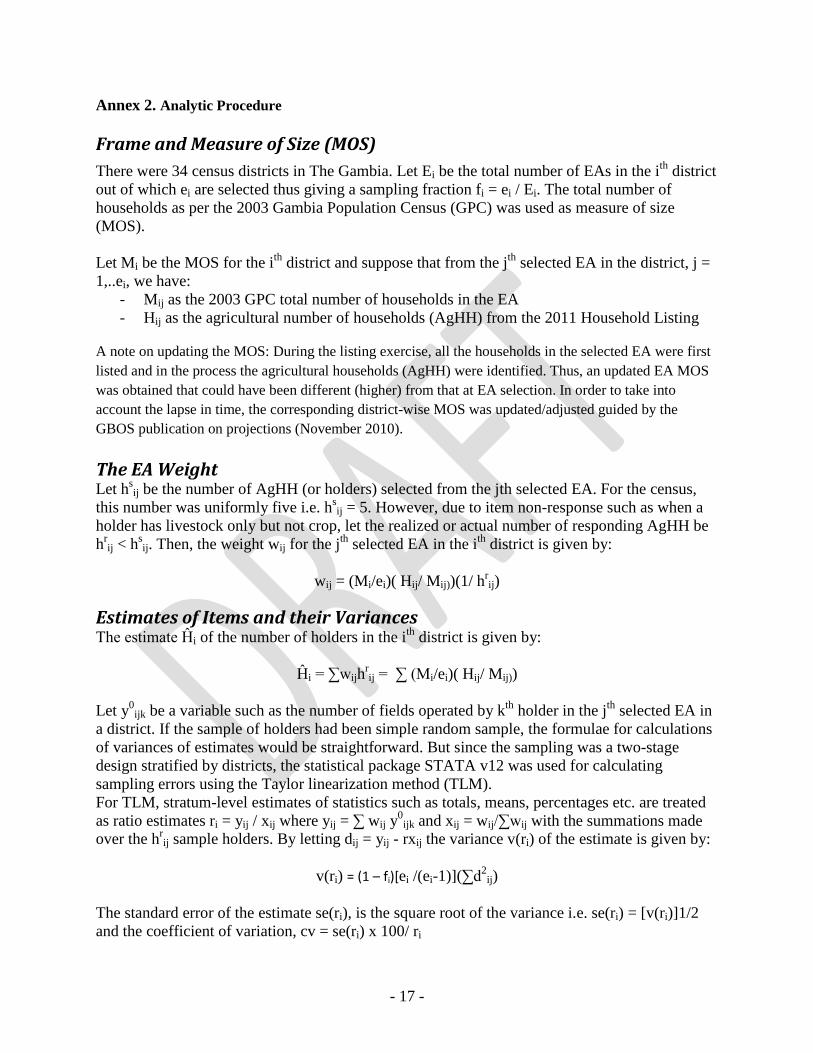
Annex 2. Analytic Procedure
Frame and Measure of Size (MOS)
There were 34 census districts in The Gambia. Let Ei be the total number of EAs in the ith
district
out of which ei are selected thus giving a sampling fraction fi = ei / Ei. The total number of
households as per the 2003 Gambia Population Census (GPC) was used as measure of size
(MOS).
Let Mi be the MOS for the ith
district and suppose that from the jth
selected EA in the district, j =
1,..ei, we have:
- Mij as the 2003 GPC total number of households in the EA
- Hij as the agricultural number of households (AgHH) from the 2011 Household Listing
A note on updating the MOS: During the listing exercise, all the households in the selected EA were first
listed and in the process the agricultural households (AgHH) were identified. Thus, an updated EA MOS
was obtained that could have been different (higher) from that at EA selection. In order to take into
account the lapse in time, the corresponding district-wise MOS was updated/adjusted guided by the
GBOS publication on projections (November 2010).
The EA Weight Let h
sij be the number of AgHH (or holders) selected from the jth selected EA. For the census,
this number was uniformly five i.e. hsij = 5. However, due to item non-response such as when a
holder has livestock only but not crop, let the realized or actual number of responding AgHH be
hrij < h
sij. Then, the weight wij for the j
th selected EA in the i
th district is given by:
wij = (Mi/ei)( Hij/ Mij))(1/ hrij)
Estimates of Items and their Variances The estimate Ĥi of the number of holders in the i
th district is given by:
Ĥi = ∑wijhrij = ∑ (Mi/ei)( Hij/ Mij))
Let y0
ijk be a variable such as the number of fields operated by kth
holder in the jth
selected EA in
a district. If the sample of holders had been simple random sample, the formulae for calculations
of variances of estimates would be straightforward. But since the sampling was a two-stage
design stratified by districts, the statistical package STATA v12 was used for calculating
sampling errors using the Taylor linearization method (TLM).
For TLM, stratum-level estimates of statistics such as totals, means, percentages etc. are treated
as ratio estimates ri = yij / xij where yij = ∑ wij y0
ijk and xij = wij/∑wij with the summations made
over the hrij sample holders. By letting dij = yij - rxij the variance v(ri) of the estimate is given by:
v(ri) = (1 – fi)[ei /(ei-1)](∑d2
ij)
The standard error of the estimate se(ri), is the square root of the variance i.e. se(ri) = [v(ri)]1/2
and the coefficient of variation, cv = se(ri) x 100/ ri
- 18 -
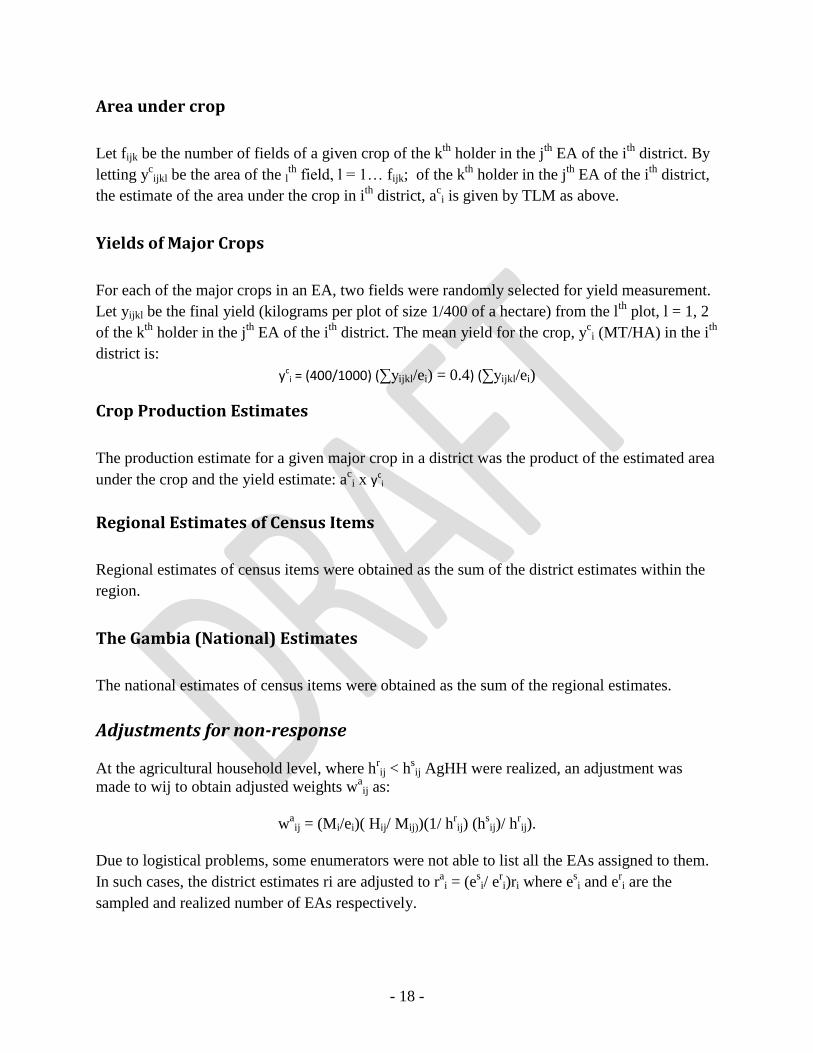
Area under crop
Let fijk be the number of fields of a given crop of the kth
holder in the jth
EA of the ith
district. By
letting ycijkl be the area of the l
th field, l = 1… fijk; of the k
th holder in the j
th EA of the i
th district,
the estimate of the area under the crop in ith
district, aci is given by TLM as above.
Yields of Major Crops
For each of the major crops in an EA, two fields were randomly selected for yield measurement.
Let yijkl be the final yield (kilograms per plot of size 1/400 of a hectare) from the lth
plot, l = 1, 2
of the kth
holder in the jth
EA of the ith
district. The mean yield for the crop, yci (MT/HA) in the i
th
district is:
yci = (400/1000) (∑yijkl/ei) = 0.4) (∑yijkl/ei)
Crop Production Estimates
The production estimate for a given major crop in a district was the product of the estimated area
under the crop and the yield estimate: aci x yc
i
Regional Estimates of Census Items
Regional estimates of census items were obtained as the sum of the district estimates within the
region.
The Gambia (National) Estimates
The national estimates of census items were obtained as the sum of the regional estimates.
Adjustments for non-response
At the agricultural household level, where hrij < h
sij AgHH were realized, an adjustment was
made to wij to obtain adjusted weights waij as:
waij = (Mi/ei)( Hij/ Mij))(1/ h
rij) (h
sij)/ h
rij).
Due to logistical problems, some enumerators were not able to list all the EAs assigned to them.
In such cases, the district estimates ri are adjusted to rai = (e
si/ e
ri)ri where e
si and e
ri are the
sampled and realized number of EAs respectively.

19
Annex 3 - Questionnaires
THE REPUBLIC OF THE GAMBIA Agricultural Statistics and Resources Economics Unit (ASRE)
Planning Services Unit (PSU) Ministry of Agriculture (MOA)
Banjul, The Gambia
Agricultural Census 2011
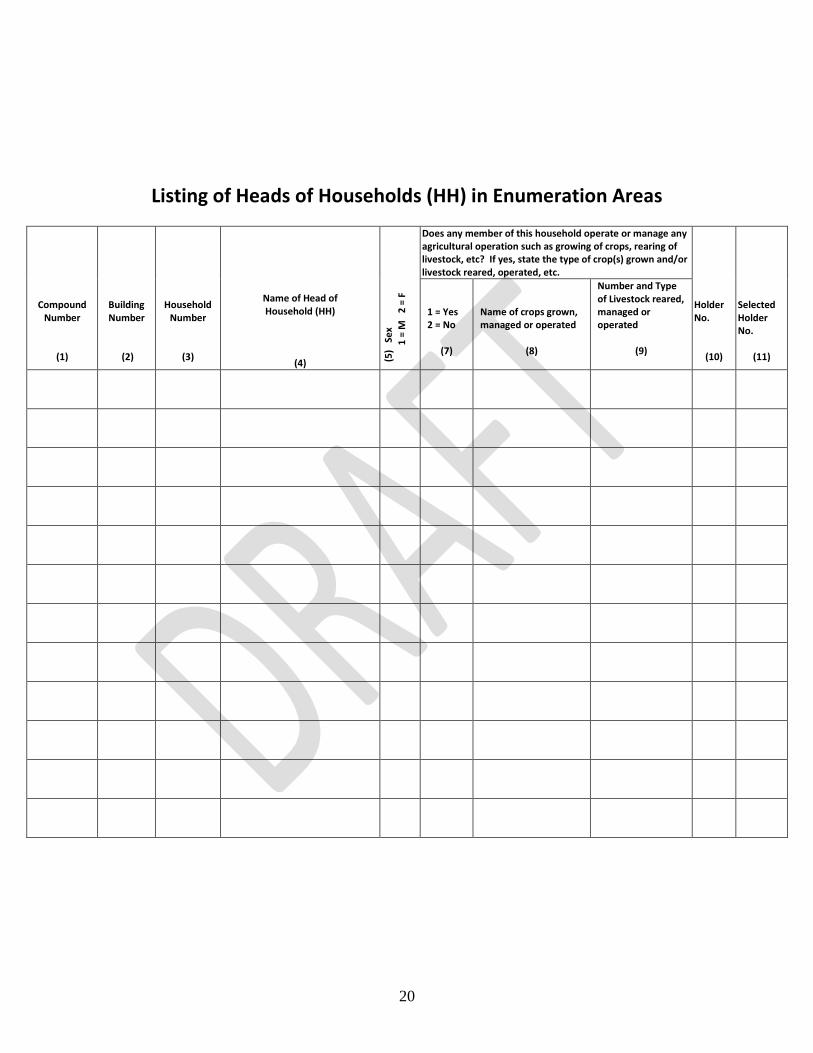
FORM 1 – Enumeration Area Listing Booklet -------------------------00000-------------------------
L.G.A. Name:__________________________ L.G.A. Code:____________ District Name:__________________________ District Code:____________ EA (Enumeration Area) Number:_____________ Total Number of Households:_________________
Name of Enumerator:_______________________________ Signature of Enumerator:_____________ Date Enumeration Completed:___________ Name of Enumerator:_______________________________ Signature of Enumerator:_____________ Date Enumeration Completed:___________
20
Listing of Heads of Households (HH) in Enumeration Areas
Compound Number
(1)
Building Number
(2)
Household Number
(3)
Name of Head of Household (HH)
(4) (5)
Sex
1 =
M
2 =
F
Does any member of this household operate or manage any agricultural operation such as growing of crops, rearing of livestock, etc? If yes, state the type of crop(s) grown and/or livestock reared, operated, etc.
Holder No.
(10)
Selected Holder No.
(11)
1 = Yes 2 = No
(7)
Name of crops grown, managed or operated
(8)
Number and Type of Livestock reared, managed or operated
(9)

21
THE REPUBLIC OF THE GAMBIA Agricultural Statistics and Resources Economics Unit (ASRE)
Planning Services Unit (PSU) Ministry of Agriculture (MOA)
Banjul, The Gambia
Agricultural Census 2011
FORM 2 – Holding Questionnaire This inquiry is authorized by the Statistics Act. It required that the questions are answered accurately and completely, and guarantees that the information provided would be treated as confidential
SECTION I – HOLDING IDENTIFICATION 1. EA No._____ 2. Holder Number:_____ 3. Street Name:________________ 4. Household Number:_____________ 5. Building Number:_________
6. SECTION I - LIST OF PERSONS IN THE HOUSEHOLD AND THEIR OCCUPATIONS. (List all members of the Holder’s household beginning with the holder, his/her spouse(s) and children followed by relatives, tenants, labourers and visitors. Also list the occupation of persons 10 years of age and above)
No.
List names of all household members in the following order: Household Head Spouse(s) with children Other relatives, servants, labourers, etc
(b)
Relation- ship of each person
to Head of Household
(c)
(d)
Sex
(M/F
)
M =
1,
F =
2
(e)
Edu
cati
on
(f)
Age
Occupation (g)
Primary Secondary
1
2
3
4
5
6
7
8
9
10
11
12
13
14
15 (c )
Codes for Relationship in HH 1 = Head 2 = Spouse 3 = Son 4 = Daughter 5 = Grandson 6 = Grand daughter 7 = Brother/Sister
(e) Codes for Education 0 = None 1 = Primary School 2 = Junior Secondary School (Grade 7 to 9) 3 = Senior Secondary School (Grade 10 – 12) 4 = University 5 = Agricultural Vocational Training 6 = Other Vocation Training
(g) Codes for Occupation 1 = Farmer(crop) 2= Farmer (Livestock) 3 = Fishing 4 = Agro-processing 5 = Trade 6 = Artisan 7 = Civil/Public Servant

22
8 = Labourer 9 = Other
7 = Non-Formal Education (Adult Literacy, etc) 8 = Arabic (Madrassa)
8 = Unskilled Labour 9 = Other
SECTION II – FIELD INVENTORY
7. How many fields are farmed by members of this holding? Give the sex and age of the Field Manager, main crops grown
this year and last years.
Field Order
(a)
Name of Field Manager
(b)
Age
Sex 1 = M 2 = F
(c)
Distance from compound in minutes walking 1 = 0 – 30 minutes 2 = 31 – 60 minutes 3 = >60 minutes (d)
Main Crop
(c )
Second Crop in Inter-cropping
(f)
Last year’s main crop …………..
(g)
1
2
3
4
5
6
7
8
9
10
CROP CODES: 1. = MAIZE 2. = E/MILLET 3. =. L/MILLET 4. = SORGHUM
5. = U/RICE 6. = S/RICE 7. = G/NUTS(old) 8. = G/NUT(new) 9. = SESAME 10 = FINDO
SECTION II – MARKETING AND DISTRIBUTION INFORMATION 8. List the following information in the holding (including the holder)
Household member’s number as listed in question 5
(a)
Sales of produce (part of) Produce 1 = All 2 = Part 3 = None
(b)
Type of Transportation 1 = Horse/Donkey Cart 2 = Foot (Head load) 3 = Bicycle/motorcycle 4 = Other motorized vehicle 5 = Boat or Canoe 6 = Other Specify_____
(c )
Distance from holding 1 = 0 – 1.9km 2 = 2 – 4.9km 3 = 5km+
(d)
Type of Market 1 = Daily 2 = Weekly 3 = Private dealer 4 = Other Specify___
(e)

23
SECTION III – PARTICIPATION IN COOPERATIVE OR ANY OTHER SIMILAR MARKETING SOCIETY, BANKING INSTITUTION (E.G. VISACAS, GAWFA AND NACCUG & THE LIKE)
9. List the following information in the holding (including the holder)
Household member’s number as listed in question 5 `
(a)
Member of Farmers Organisation/Cooperatives 1 = Yes 2 = No
(b)
Type of Farmers Organisation 1 = VISACAS 2 = GAWFA 3 = NACCUG/Credit Union 4 = NAWFA 5 = Farmers platform 6 = Government Assistance (project) 7 = Other NGO 8 = Banks 9 = Other (Specify_______)
(c)
Type of Assistance received 1 = Loan scheme 2 = Agric inputs(Seeds) 3 = Agric Inputs(Fertilizer) 4 = Agric tools 5 = Sale of produce 6 = Training 7 = Multiple 8 = Other (Specify______)
(d)
Type of Services Accessed 1 = Market Info. 2 = Credit 3 = Extension
(e)
SECTION IV – REVENUES FROM NON-FARM EMPLOYMENT AND REMITTANCES 10. Does the holding receive income from non-agriculture based activities/jobs and remittances?
Type of non-farm employment Code No. of holding members
Male Female
Trading 1
Artisan 2
Civil/Public Servant 3
Remittances 4
Other (Specify) 5
11. Is this holding managed entirely by the holder, a representative or by a hired manager? Enter the correct code and/or explain the type of arrangement_____________________
24
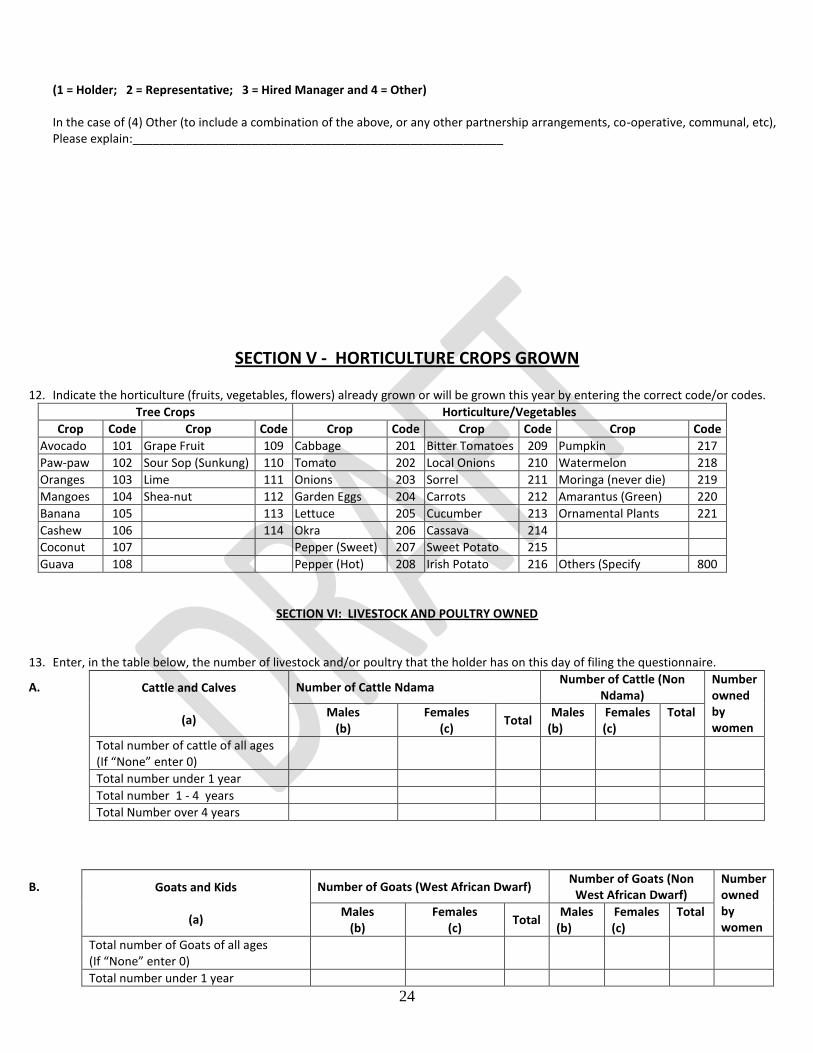
(1 = Holder; 2 = Representative; 3 = Hired Manager and 4 = Other) In the case of (4) Other (to include a combination of the above, or any other partnership arrangements, co-operative, communal, etc), Please explain:________________________________________________________
SECTION V - HORTICULTURE CROPS GROWN 12. Indicate the horticulture (fruits, vegetables, flowers) already grown or will be grown this year by entering the correct code/or codes.
Tree Crops Horticulture/Vegetables
Crop Code Crop Code Crop Code Crop Code Crop Code
Avocado 101 Grape Fruit 109 Cabbage 201 Bitter Tomatoes 209 Pumpkin 217
Paw-paw 102 Sour Sop (Sunkung) 110 Tomato 202 Local Onions 210 Watermelon 218
Oranges 103 Lime 111 Onions 203 Sorrel 211 Moringa (never die) 219
Mangoes 104 Shea-nut 112 Garden Eggs 204 Carrots 212 Amarantus (Green) 220
Banana 105 113 Lettuce 205 Cucumber 213 Ornamental Plants 221
Cashew 106 114 Okra 206 Cassava 214
Coconut 107 Pepper (Sweet) 207 Sweet Potato 215
Guava 108 Pepper (Hot) 208 Irish Potato 216 Others (Specify 800
SECTION VI: LIVESTOCK AND POULTRY OWNED
13. Enter, in the table below, the number of livestock and/or poultry that the holder has on this day of filing the questionnaire.
A. Cattle and Calves
(a)
Number of Cattle Ndama Number of Cattle (Non
Ndama) Number owned by women
Males
(b) Females
(c) Total
Males (b)
Females (c)
Total
Total number of cattle of all ages (If “None” enter 0)
Total number under 1 year
Total number 1 - 4 years
Total Number over 4 years
B. Goats and Kids
(a)
Number of Goats (West African Dwarf) Number of Goats (Non
West African Dwarf) Number owned by women
Males
(b) Females
(c) Total
Males (b)
Females (c)
Total
Total number of Goats of all ages (If “None” enter 0)
Total number under 1 year

25
Total number 1 - 2 years
Total Number over 2 years
C. Sheep and Lambs
(a)
Number of Sheep (Djalonke) Number of Sheep (Non Djalonke)
Number owned by women
Males
(b) Females
(c) Total
Males (b)
Females (c)
Total
Total number of Sheep of all ages (If “None” enter 0)
Total number under 1 year
Total number 1 - 2 years
Total Number over 2 years
D. Donkeys and Horses
(a)
Number of Donkeys Number Horses Number owned by women
Males
(b) Females
(c) Total
Males (b)
Females (c)
Total
Total number of Donkeys and Horses of all ages (If “None” enter 0)
Total number under 2 years of age
Total number 2 years of age and over
E. Pigs
(a)
Number of Pigs (Local) Number of Pigs (Exotic) Number owned by women
Males
(b) Females
(c) Total
Males (b)
Females (c)
Total
Total number of Donkeys and Horses of all ages (If “None” enter 0)
Total number under 2 years of age
Total number 2 years of age and over
F. Poultry, Rabbits and Others
Hens, Cocks Pullets and Chicks
(a)
Ducks and Ducklings
(b)
Other Poultry such as Turkeys, Guinea-Fowls, etc. (Specify)
(c )
Other Farm Animals such as Beehives, etc. (Specify)
(d)
Rabbits
(e)
Total Number
Total under 6 months XXXXXX XXXXXXXXX XXXXXXXX XXXXXX
6 months and over XXXXXX XXXXXXXXX XXXXXXXX XXXXXX
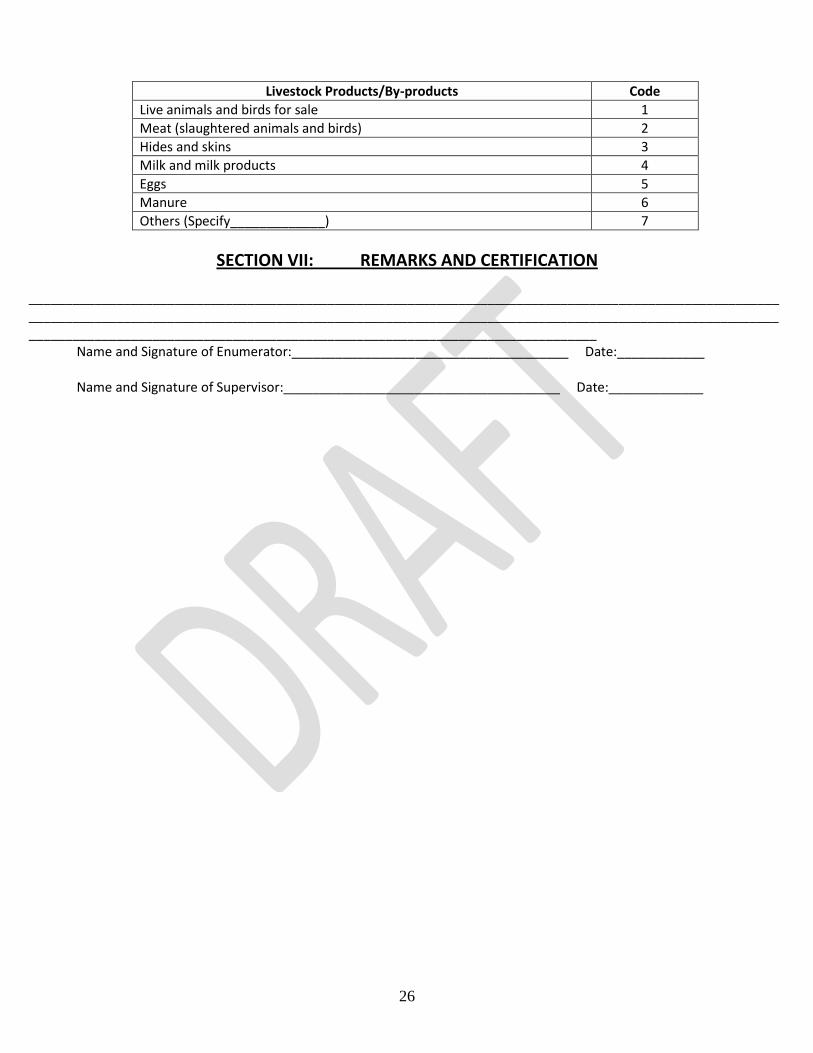
14. What livestock products/by-product do you usual produce for sale?
26
Livestock Products/By-products Code
Live animals and birds for sale 1
Meat (slaughtered animals and birds) 2
Hides and skins 3
Milk and milk products 4
Eggs 5
Manure 6
Others (Specify_____________) 7
SECTION VII: REMARKS AND CERTIFICATION ____________________________________________________________________________________________________________________________________________________________________________________________________________________________________________________________________________________________ Name and Signature of Enumerator:______________________________________ Date:____________ Name and Signature of Supervisor:______________________________________ Date:_____________

27
THE REPUBLIC OF THE GAMBIA Agricultural Statistics and Resources Economics Unit (ASRE)
Planning Services Unit (PSU) Ministry of Agriculture (MOA)
Banjul, The Gambia
Agricultural Census 2011
FORM 3 –Field Questionnaire This inquiry is authorized by the Statistics Act. It required that the questions are answered accurately and completely, and guarantees that the information provided would be treated as confidential
SECTION I: IDENTIFICATION
1. EA No._____ 2. Holding/Holder Number:__________ 3. Street Name:________________ 4. Household Number:_____________ 5. Building Number:_________
6 Indicate the Plot number, sex and age of the Field Manager, main crops grown this year and last year as indicated in the
field inventory. .
Field Order
(a)
Name of Field Manager
(b)
Age
Sex 1 = M 2 = F
(c)
Distance from compound in minutes walking 1 = 0 – 30 minutes 2 = 31 – 60 minutes 3 = >60 minutes (d)
Main Crop
(c )
Second Crop in Inter-cropping
(f)
Last year’s main crop …………..
(g)
CROP CODES: 1. = MAIZE 2. = E/MILLET 3. =. L/MILLET 4. = SORGHUM
5. = U/RICE 6. = S/RICE 7. = G/NUTS(old) 8. = G/NUT(new) 9. = SESAME 10 = FINDO 11= PHILLIPINE PINK 12 = NERICA 13. = ATM OTHER UPLAND VARIETY
SECTION III – FIELD PRACTICES 7. State the month and week the crop was planted (Circle the correct code or codes in the table below)
Month Planted
Code Week Planted Month Planted Code Week Planted
January 01 1 2 3 4 5 July 07 1 2 3 4 5
February 02 1 2 3 4 5 August 08 1 2 3 4 5
March 03 1 2 3 4 5 September 09 1 2 3 4 5
April 04 1 2 3 4 5 October 10 1 2 3 4 5
May 05 1 2 3 4 5 November 11 1 2 3 4 5
June 06 1 2 3 4 5 December 12 1 2 3 4 5

28
8 State the quantity (in Kilograms) of seed used for the crop planted______________________??? 9 State the source and quantity of seed used for this plot. (Circle the correct code or codes)???
Source of seed obtained Code Quantity
Own produced 1
Other farmers 2
NGO 3
Cooperative Society 4
Government Assistance 5
Other (Specify__________________) 6
10 Was seed dressing used for the seeds? 1 = Yes 2 =No
SECTION IVA – FIELD MEASUREMENTS 11. Length and bearing of field boundary – fill in the table below for each field using a compass, pole (for sight and
alignment) and a measuring tape. Always measure in a clockwise direction. Compass reading will be taken from both stations at each change of direction of the field boundary.
Row
(a)
Station Compass Bearings Length of Side
(e)
Cumulative Length
(f) From
(b) To (c )
Forward (d)

29
12. State the hectarage of the above field: From Calculator____________Ha Closing Error___________%

30
SECTION IV B: SKETCH MAP OF THE FIELD 13. Give rough sketch of the field planted.
SECTION V: EMPLOYMENT IN AGRICULTURE 14. Did you employ any labourers that are part of your household to work on your field? 1 = Yes 2 = No If yes complete the table below
Kind of work
done
(a)
Number of labourers employed
(b)
Month/ months of employment
(c )
Length of employ-ment (Number of days worked)
(d)
State the payment, if any
Cash paid per day
(e)
In kind (state and indicate number and/or units)
(f)
M
F
Up to D40
D41 to D60
D61 to D80
D81 to D100
Over D100
Clearing of Bush
Burning of Bush

31
Sowing/Planting
15. Did you employ any labourers that re not part of your household (temporary workers) to work on your field? 1 = Yes 2 = No If yes complete the table below
Kind of work done
(a)
Number of labourers employed
(b)
Month/months of employ-ment
(c )
Length of employment (Number of days worked)
(d)
State the payment, if any
Cash paid per day (e)
In kind (state and indicate number and/or units)
(f)
M
F
Up to D40
D41 to D60
D61 to D80
D81 to D100
Over D100
Clearing of Bush
Burning of Bush
Sowing/Planting
16. Did you employ any kafos to work on your field? 1 = Yes 2 = No If yes complete the table below
Kind of work done
(a)
Number of labourers employed
(b)
Month/months of employ-ment
(c )
Length of employment (Number of days worked)
(d)
State the payment, if any
Cash paid per day (e)
In kind (state and indicate number and/or units)
(f)
M
F
Up to D40
D41 to D60
D61 to D80
D81 to D100
Over D100
Clearing of Bush
Burning of Bush
Sowing/Planting

32
SECTION VI – LAND TENURE AND LAND PRACTICES
17. Under what arrangement are you entitled to use this field?
Land Tenure Code Since when used by you in years???
When 4-9, for how long in years???
Use the following for the improvements of the field 1 = Manure 2 = Fertiliser 3 = Crop Rotation 4 = Drainage 5 = Irrigation 6 – Other (Specify)
Community owned/Alkalo 1 XXXXXXXXXXXX
Family owned/Kabilo 2 XXXXXXXXXXXX
Individual owned (purchased/ inherited)
3 XXXXXXXXXXXX
Leased 4 XXXXXXXXXXXX
Rented 5
Borrowed 6
Squatter (strange farmer) 7
Special Permission 8
Other (Specify) 9
18. Did you pay a fee for this field this year? 1 = Yes 2 = No If yes, specify:
Type Unit Quantity
Money
Labour
Kind
SECTION VII – AGRICULTURAL POWER / MACHINERY 19. What tools and implements did you use to cultivate this farm? (Circle the correct code or codes in the table below)
Tool/Implement Code Tool/Implement Code
Hoe 1 Machete/Knives 7
Cutlass 2 Rake 8
Felling Axe 3 Seeder 9
Pickaxe 4 Weeder 10
Plough 5 Lifter 11
Harrow 6 Other (Specify) 12
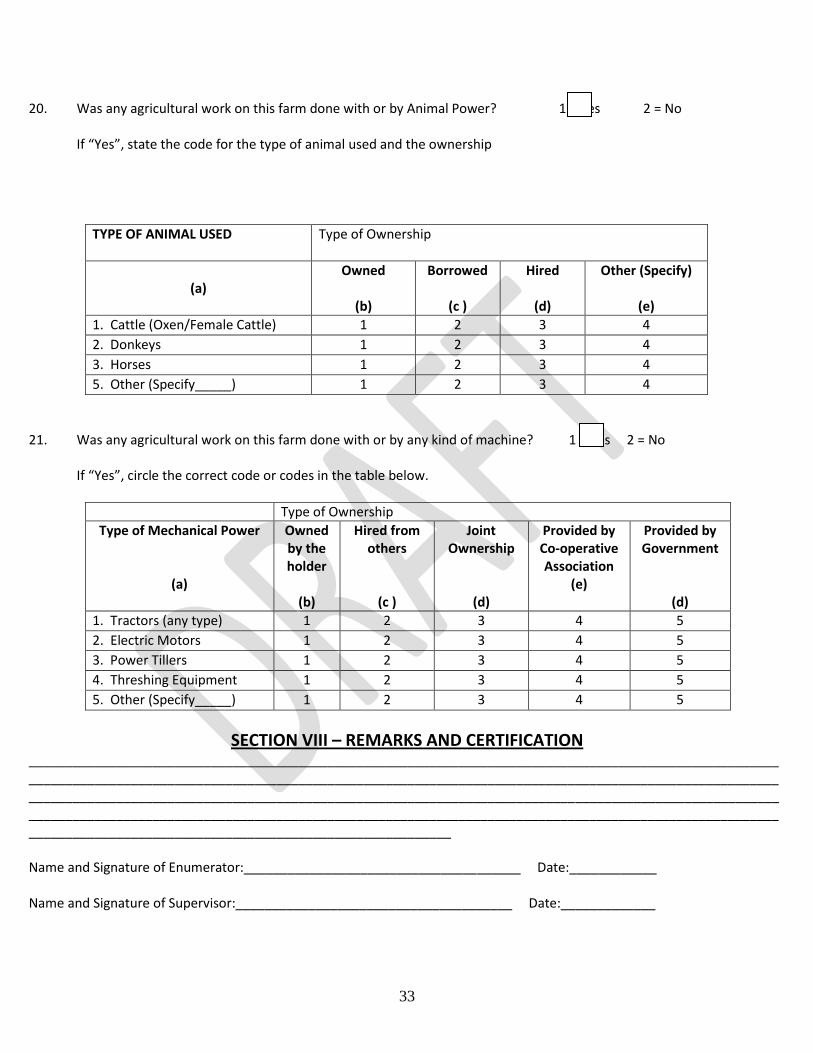
33
20. Was any agricultural work on this farm done with or by Animal Power? 1 = Yes 2 = No If “Yes”, state the code for the type of animal used and the ownership
TYPE OF ANIMAL USED
Type of Ownership
(a)
Owned
(b)
Borrowed
(c )
Hired
(d)
Other (Specify)
(e)
1. Cattle (Oxen/Female Cattle) 1 2 3 4
2. Donkeys 1 2 3 4
3. Horses 1 2 3 4
5. Other (Specify_____) 1 2 3 4
21. Was any agricultural work on this farm done with or by any kind of machine? 1 = Yes 2 = No If “Yes”, circle the correct code or codes in the table below.
Type of Ownership
Type of Mechanical Power
(a)
Owned by the holder
(b)
Hired from others
(c )
Joint Ownership
(d)
Provided by Co-operative Association
(e)
Provided by Government
(d)
1. Tractors (any type) 1 2 3 4 5
2. Electric Motors 1 2 3 4 5
3. Power Tillers 1 2 3 4 5
4. Threshing Equipment 1 2 3 4 5
5. Other (Specify_____) 1 2 3 4 5
SECTION VIII – REMARKS AND CERTIFICATION ______________________________________________________________________________________________________________________________________________________________________________________________________________________________________________________________________________________________________________________________________________________________________________________________________________________________________________________________________________________ Name and Signature of Enumerator:______________________________________ Date:____________ Name and Signature of Supervisor:______________________________________ Date:_____________

34
THE REPUBLIC OF THE GAMBIA
Agricultural Statistics and Resources Economics Unit (ASRE) Planning Services Unit (PSU)
Ministry of Agriculture (MOA) Banjul, The Gambia
Agricultural Census 2011
FORM 4 –YIELD PLOT QUESTIONNAIRE This inquiry is authorized by the Statistics Act. It required that the questions are answered accurately and completely, and guarantees that the information provided would be treated as confidential
SECTION I: IDENTIFICATION
1. EA No._____ 2. Holding/Holder Number:__________ 3. Name of Holder:________________________________ 4. Field Number:_____________ 5. Selected Ramdom Numbers used to lay out yield plot: First Ramdom Number ____ Second Ramdom Number___
SECTION II – YIELD DATA 6. For all crops grown and/or growing in the plot this agricultural season, provide the following information:
Name of Crops found
in plot
(a)
Code of Crops found in plot
(b)
Number of stands or stools of the crop found in the plot
(c)
On the day of harvest (i.e. before drying), state the Weight of the crop harvested in the plot
(d)
After drying 5 kilograms of produced saved, state the final weight
(e)
FOR ANY ECONOMIC (FRUIT?) TREES FOUND IN THE PLOT State the Name
(a) Code
(b) State the number of such trees
(c)
SECTION III – YIELD SUPPORT DATA

35
7. On what date did you start to complete this questionnaire?_______________________ 8. What is the suggested date for coming back to complete the harvesting
information?__________________ 9. For all crops grown and/or growing in the field this agricultural season, provide the following
information:
Name of Crops in
field
(a)
Code of crops in
field
(b)
Farmer’s estimate of production for each crop
(c)
Field Officer’s or Supervisor’s Estimate of Production for each crop
(d)
Enumerator’s estimate of production for each crop
(e)
10. For all crops grown and/or growing in the field this agricultural season, provide the following
information:
Name of Crops in field
(a)
Code of crops in field
(b)
Quantity of seeds of the crop planted
(c)
Quantity of this year’s crop that is
Already stored
(d)
To be stored
(e)
Already consumed
(f)
To be consumed
(g)
Already sold
(h)
To be sold (i)
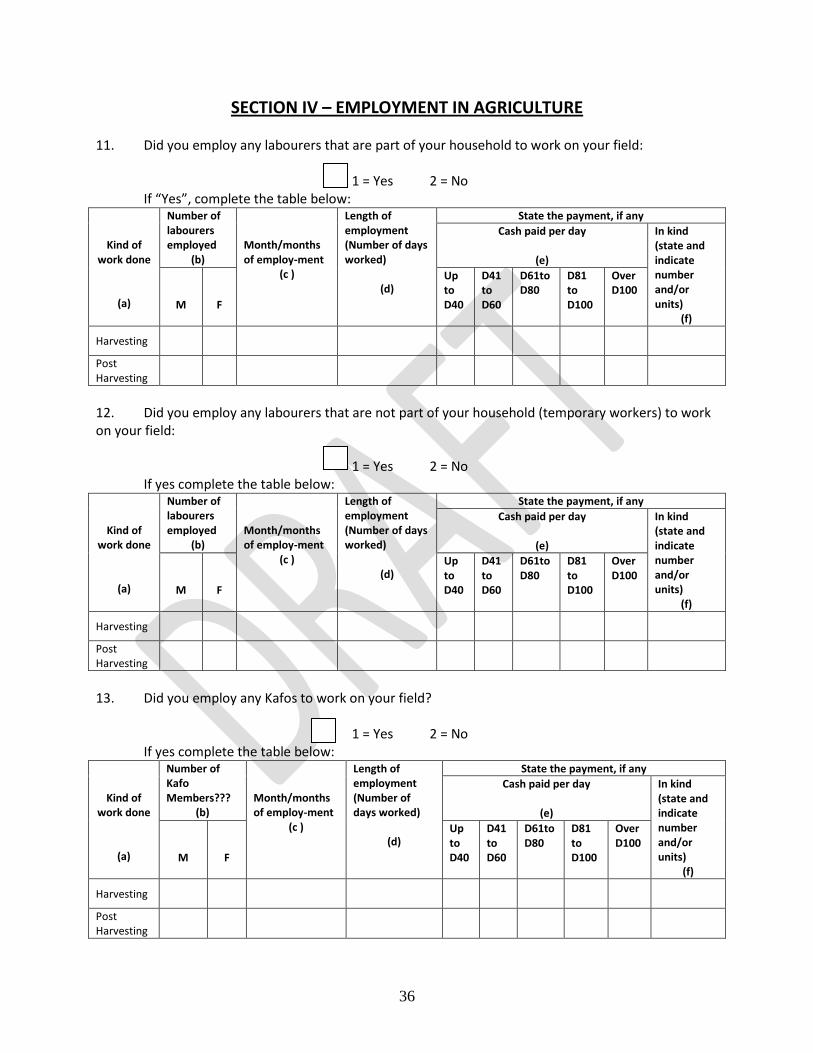
36
SECTION IV – EMPLOYMENT IN AGRICULTURE 11. Did you employ any labourers that are part of your household to work on your field: 1 = Yes 2 = No If “Yes”, complete the table below:
Kind of work done
(a)
Number of labourers employed
(b)
Month/months of employ-ment
(c )
Length of employment (Number of days worked)
(d)
State the payment, if any
Cash paid per day
(e)
In kind (state and indicate number and/or units)
(f)
M
F
Up to D40
D41 to D60
D61to D80
D81 to D100
Over D100
Harvesting
Post Harvesting
12. Did you employ any labourers that are not part of your household (temporary workers) to work on your field: 1 = Yes 2 = No If yes complete the table below:
Kind of work done
(a)
Number of labourers employed
(b)
Month/months of employ-ment
(c )
Length of employment (Number of days worked)
(d)
State the payment, if any
Cash paid per day
(e)
In kind (state and indicate number and/or units)
(f)
M
F
Up to D40
D41 to D60
D61to D80
D81 to D100
Over D100
Harvesting
Post Harvesting
13. Did you employ any Kafos to work on your field? 1 = Yes 2 = No If yes complete the table below:
Kind of work done
(a)
Number of Kafo Members???
(b)
Month/months of employ-ment
(c )
Length of employment (Number of days worked)
(d)
State the payment, if any
Cash paid per day
(e)
In kind (state and indicate number and/or units)
(f)
M
F
Up to D40
D41 to D60
D61to D80
D81 to D100
Over D100
Harvesting
Post Harvesting
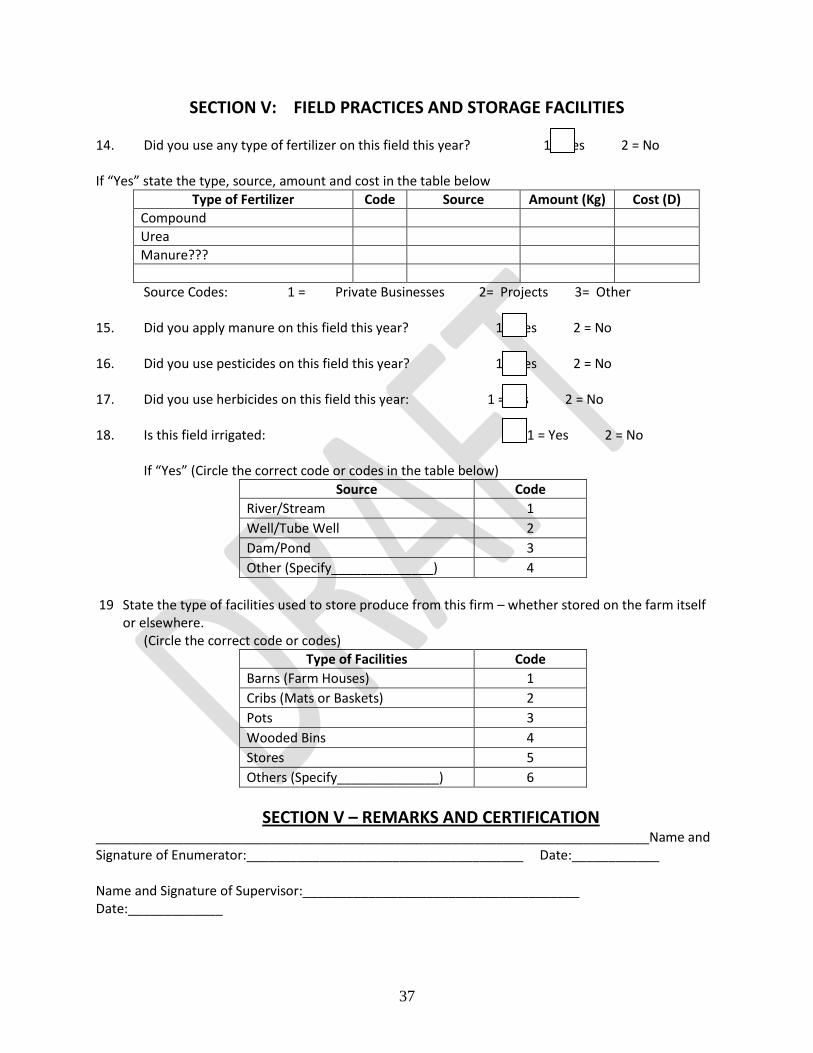
37
SECTION V: FIELD PRACTICES AND STORAGE FACILITIES 14. Did you use any type of fertilizer on this field this year? 1 = Yes 2 = No If “Yes” state the type, source, amount and cost in the table below
Type of Fertilizer Code Source Amount (Kg) Cost (D)
Compound
Urea
Manure???
Source Codes: 1 = Private Businesses 2= Projects 3= Other 15. Did you apply manure on this field this year? 1 = Yes 2 = No 16. Did you use pesticides on this field this year? 1 = Yes 2 = No 17. Did you use herbicides on this field this year: 1 = Yes 2 = No 18. Is this field irrigated: 1 = Yes 2 = No If “Yes” (Circle the correct code or codes in the table below)
Source Code
River/Stream 1
Well/Tube Well 2
Dam/Pond 3
Other (Specify______________) 4
19 State the type of facilities used to store produce from this firm – whether stored on the farm itself
or elsewhere. (Circle the correct code or codes)
Type of Facilities Code
Barns (Farm Houses) 1
Cribs (Mats or Baskets) 2
Pots 3
Wooded Bins 4
Stores 5
Others (Specify______________) 6
SECTION V – REMARKS AND CERTIFICATION ____________________________________________________________________________Name and Signature of Enumerator:______________________________________ Date:____________ Name and Signature of Supervisor:______________________________________ Date:_____________
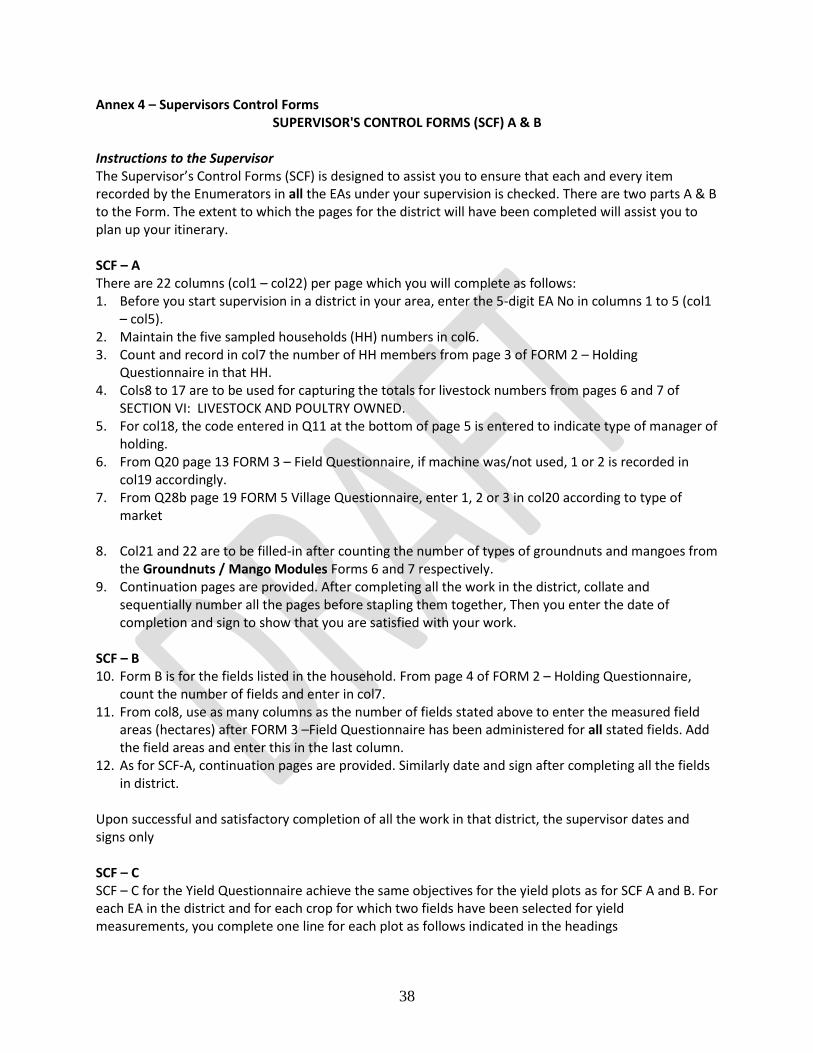
38
Annex 4 – Supervisors Control Forms SUPERVISOR'S CONTROL FORMS (SCF) A & B
Instructions to the Supervisor The Supervisor’s Control Forms (SCF) is designed to assist you to ensure that each and every item recorded by the Enumerators in all the EAs under your supervision is checked. There are two parts A & B to the Form. The extent to which the pages for the district will have been completed will assist you to plan up your itinerary. SCF – A There are 22 columns (col1 – col22) per page which you will complete as follows: 1. Before you start supervision in a district in your area, enter the 5-digit EA No in columns 1 to 5 (col1
– col5). 2. Maintain the five sampled households (HH) numbers in col6. 3. Count and record in col7 the number of HH members from page 3 of FORM 2 – Holding
Questionnaire in that HH. 4. Cols8 to 17 are to be used for capturing the totals for livestock numbers from pages 6 and 7 of
SECTION VI: LIVESTOCK AND POULTRY OWNED. 5. For col18, the code entered in Q11 at the bottom of page 5 is entered to indicate type of manager of
holding. 6. From Q20 page 13 FORM 3 – Field Questionnaire, if machine was/not used, 1 or 2 is recorded in
col19 accordingly. 7. From Q28b page 19 FORM 5 Village Questionnaire, enter 1, 2 or 3 in col20 according to type of
market 8. Col21 and 22 are to be filled-in after counting the number of types of groundnuts and mangoes from
the Groundnuts / Mango Modules Forms 6 and 7 respectively. 9. Continuation pages are provided. After completing all the work in the district, collate and
sequentially number all the pages before stapling them together, Then you enter the date of completion and sign to show that you are satisfied with your work.
SCF – B 10. Form B is for the fields listed in the household. From page 4 of FORM 2 – Holding Questionnaire,
count the number of fields and enter in col7. 11. From col8, use as many columns as the number of fields stated above to enter the measured field
areas (hectares) after FORM 3 –Field Questionnaire has been administered for all stated fields. Add the field areas and enter this in the last column.
12. As for SCF-A, continuation pages are provided. Similarly date and sign after completing all the fields in district.
Upon successful and satisfactory completion of all the work in that district, the supervisor dates and signs only SCF – C SCF – C for the Yield Questionnaire achieve the same objectives for the yield plots as for SCF A and B. For each EA in the district and for each crop for which two fields have been selected for yield measurements, you complete one line for each plot as follows indicated in the headings

- 1 -
Annex 4 SCF (contunied)
SUPERVISOR'S CONTROL FORM (SCF) A - HOUSEHOLD, LIVESTOCK INPUTS AND TCP MODULES
District___________________ Name of Supervisor ________________________ Date of Completion___________________ Signature of Supervisor ________________________
EA NO. Holder
No. Household members
Cattle
Goats and Kids
Sheep and
Lambs Donkeys Horses
Who is manager
of this holding?
Was a machnine used on
this farm? Type of market
No. of types of:
Total
Owned by
Women Total
Owned by
Women Total
Owned by
Women Total
Owned by
Women Total
Owned by
Women Groundnuts Mangoes
col1 col2 col3 col4 col5 col6 col7 col8 col9 col10 col11 col12 col13 col14 col15 col16 col17 col18 col19 col20 col21 col22
1
2
3
4
5
1
2
3
4
5

- 2 -
SUPERVISOR'S CONTROL FORM (SCF) B - FOR FIELD QUESTIONNAIRE
District________________________________________ Name of Supervisor ________________________________
Date of Completion___________________________________
Signature of Supervisor __________________________
EA NO. Holder No.
Fields
Area (hectares) of Fieldx:
Field1 Field2 Field3 Field4 Field5 Field6 Field7 Field8
Crop Code
Area Crop Code Area Crop Code Area Crop Code
Area Crop Code
Area Crop Code
Area Crop Code Area Crop Code Area
col1
col2
col3
col4
col5
col6 col7 col8 col9 col10 col11 col12 col13 col14 col15 col16 col17 col18 col19 col20 col21 col22 col23
1
2
3
4
5
1
2
3

- 3 -
SUPERVISOR'S CONTROL FORM (SCF) C - FOR YIELD QUESTIONNAIRE
District____________ Name of Supervisor ___________________ Date of Completion______________ Signature of Supervisor _______________________
EA NO. Holder
No. Field no
Name of Crops found
in plot Code of Crops found in plot
Number of stands (stool count) of the crop found in
the plot
On the day of harvest, state the Weight of the crop harvested in
the plot
After drying 5 kilograms of produced saved, state the
final weight
col1 col2 col3 col4 col5 col6 col7 col8 col9 col10 col11 col12