government financial reporting review
TRANSCRIPT

Government financial reporting review:Best practice examples from 2019-20

Chapter 1 Introduction 3
Chapter 2 Performance Reporting 5
Chapter 3 Accountability 32
Chapter 4 Financial Statements 51
Chapter 5 Further Links 62
Contents
Best Practice Examples 2019-20 2

Chapter 1- IntroductionWhy this publication?
• In April 2019 HM Treasury published the Government Financial Reporting Review.
• This included several examples of best practice in reporting taken from the 2017-18 central government annual reports and accounts (ARAs). A further report providing examples from 2018-19 best practice was also published.
• HM Treasury is committed to continue supporting ongoing improvements in financial reporting and this report outlines further examples of best practice, taken from the 2019-20 ARAs.
• The expectation is that these examples will be considered by those preparing ARAs across government.
Further guidance
The best practice examples outlined in this report have been chosen because they display some or all of these characteristics, including: increased transparency, increased accountability, accessibility, clear presentation (e.g. use of formatting/graphics) etc.
If you would like to suggest further examples of best practice in government ARAs to be considered then please contact HM Treasury ([email protected]).
Structure of publication
➢ This report is divided into three sections that broadly follow the structure of a departmental ARA required by the Financial Reporting Manual (FReM) as follows;
• Performance reporting
• Accountability information
• Financial information
Best Practice Examples 2019-20 3

Chapter 1- Introduction
Why is narrative reporting important?
• The narrative elements of government financial reports are crucial for meeting the needs of users.
• Narrative provides context and essential information to explain financial outcomes and performance against objectives.
Best Practice Examples 2019-20 4
What should accounts preparers consider in narrative reporting?
Information should be presented in a way that tells the story of an organisation in a fair, balanced and understandable way.
It is important to provide context, using several years of trend data where possible.
The layout and design choices can influence how a reader understands a report, and the use of infographics and diagrams
can be helpful in communicating important messages.
Clear and simple language makes reports easier for a wide range of users to understand.
It should be straightforward and accessible for users.
2019-20 ARAs challenges:
2019-20 was a challenging year for reporting due to the impact of the pandemic and that the timeliness of publication suffered for some ARAs. Due to the significance of it on reporting, we have specifically looked at this as an area in relation to: performance, risk and financial reporting.

Chapter 2 – Performance Reporting
Best Practice Examples 2019-20 5
What is required within the performance report?
• The performance report is required to have two sections: a ‘performance overview’ and a ‘performance analysis’.
• The performance overview is a short summary of the full story of an organisation and its performance over the period covered by the report.
• The performance analysis provides a detailed view.
Further information on the requirements can be founds within the 20-21 FReM (Government Financial Reporting Manual).
This chapter highlights some examples of best practice in performance reporting from departmental ARA’s.
What should accounts preparers consider in Performance Reporting?
Performance reporting must be fair, balanced and understandable.
It must be transparent including both achievements and where objectives have not been met, to build
trust.
It should be straightforward and accessible for users.

Performance Overview examples (1)
Best Practice Examples 2019-20 6
Figu
re 1
–C
abin
et O
ffic
e
Reporting Issue
The performance section must include a statement of the purposes and activities of an organisation in a clear and concise manner. This is important to the user, as it allows them to easily understand the entity’s strategic objectives.
Example and why this is best practice
The example on this slide from the Cabinet Office Annual Report and Accounts:
✓ provides a high-level overview of the strategic objectives of the department;
✓ Uses clear number formatting;
✓ Uses graphics and concise plain English to increase usability and makes the section more visually appealing.

Performance Overview (2)
Best Practice Examples 2019-20 7
Figu
re 2
–D
ep
artm
ent
for
Work
and P
ensi
ons
Example and why this is best practice
Similar to the previous slide, the example on this slide from the Department for Work and Pensions Annual Report and Account:
✓ provides a high-level overview of the strategic objectives of the department;
✓ Uses clear numbered formatting; and
✓ Uses graphics and concise plain English to increase usability and makes the section more visually appealing;
✓ Uses the same colour code when stating how they worked towards the objective.

Performance highlights examples (1)
Best Practice Examples 2019-20 8
Figure 3 – Department for EducationReporting Issue
The Government Financial Reporting Reviewalso emphasised the importance of reporting the annual performance highlights of an organisation. Providing an overview of performance over the course of a year increases the understandability and usability.
Example and why this is best practice
The example on this slide from the Department for Education Annual Report and Accounts:
✓ Provides a clear overview of the department’s activities throughout the year;
✓ Uses clear summary data, allowing users to easily understand performance outcomes;
✓ Uses a variety of graphics, making this section more visually appealing.

Performance Highlights (2)
Best Practice Examples 2019-20 9
Figu
re 4
–M
inis
try
of
Just
ice
Example and why this is best practice
Similar to the previous slide, this example from the Ministry of Justice Annual Report and Accounts:
✓ Provides a clear overview of the department’s activities throughout the year;
✓ Has a clear focus on summary data, allowing users to easily understand performance outcomes;
✓ Uses a variety of graphics, making this section more visually appealing.

High level financial information examples (1)
Best Practice Examples 2019-20 10
Reporting Issue
Entities should seek to tie in the performance analysis to other parts of the annual reports and accounts including the financial statements to reflect a holistic assessment of performance.
For example, linking the Statement of Outturn against Parliamentary Supply (SOPS) and the financial statements so as to provide a cohesive and consistent understanding of performance across the entire annual report and accounts.
Example and why this is best practice
The example on the next slide from the Department for Business, Energy and Industrial Strategy Annual Reports and Accounts:
✓ Outlines high level financial information in an engaging way with clear links to the financial statements;
✓ Differs the size of the bubbles to reflect the level of expenditure within the different areas, in comparison to the whole;
✓ Colour codes the expenditure according to whether it is within the core department, an executive agency or a partner organisation.

Best Practice Examples 2019-20 11
Figu
re 5
–D
ep
artm
ent
for
Busi
nes
s, E
nerg
y an
d
Indust
rial
Str
ateg
y

High level financial information (2)
Best Practice Examples 2019-20 12
Refer to Figure 6 from the Welsh Government for the next two additional best practice examples of presenting high level financial information.
Example and why this is best practice
Similar to the previous slide, this example from the Welsh Government Annual Reports and Accounts:
✓ Outlines high level financial information in an engaging way with clear links to the financial statements;
✓ Uses two different diagrams to show the revenue budget expenditure in comparison to capital budget expenditure;
✓ Includes various graphics to visualise the type of expenditure, which also eases the users understanding.

Best Practice Examples 2019-20 13
Figure 6 – Welsh Government

High level financial information (3)
Best Practice Examples 2019-20 14
Example and why this is best practice
Similar to the previous slide, this example from the Department for Transport Annual Report and Accounts:
✓ Outlines high level financial information in an engaging way with clear links to the financial statements;
✓ Includes various graphics for ease of understanding;
✓ Includes a colour scheme according to the area of expenditure.
Figu
re 7
–D
ep
artm
ent
for
Tran
sport

Trend data with commentary examples (1)
Best Practice Examples 2019-20 15
Reporting Issue
The FReM mandates that the performance analysis section of ARAs must include a prior year comparator for data presented, as this adds context for users. Data for years earlier than the prior year should also be included where available and where this provides relevant context. There is an expectation that trend data will build up over time as it becomes available.
Example and why this is best practice
The example on this slide from HM Revenues & Customs Annual Report and Accounts:
✓ Includes multiple-year trend data in the form of a colour coded bar chart on a specific performance metric;
✓ Provides detailed commentary in relation to the figures presented;
✓ Repeats this method of presenting data throughout the ARA for consistency to help the user.
Figu
re 8
–H
M R
eve
nues
& C
ust
om
s

Trend data with commentary (2)
Best Practice Examples 2019-20 16
Example and why this is best practice
Similar to the previous slide, the Food Standards Agency Annual Report and Accounts:
✓ Includes multiple-year trend data in the form of a colour coded bar chart;
✓ Has a link to the strategic priority of ‘Food Hyper-Sensitivity’, as it clearly shows what they have implemented to increase safety and how much they have spent;
✓ Adds context with both narrative and numbers, which gives users the best possible support to understand the story;
✓ Uses a variety of graphics, making this section more visually appealing.
Figu
re 9
–Fo
od S
tandar
ds
Agen
cy

Trend data with commentary (3)
Best Practice Examples 2019-20 17
Example and why this is best practice
Similar to the previous slide, the example on this slide from Whole of Government Accounts Annual Report and Accounts:
✓ Includes multiple-year trend data in the form of a bar chart on a specific performance metric;
✓ Pension liabilities is a key area of interest for the user of WGA and a significant liability for government, so more information has been provided specifically to show context for the user.
Figure 10 – Whole of Government Accounts
Please note that this example has been taken from the 2018-19 accounts, due to the timing of preparing the WGA.

Balanced reporting examples (1)
Best Practice Examples 2019-20 18
Reporting Issue
Departments are expected to report the status of progress against their Single Departmental Plan (SDPs) objectives in a fair, balanced and understandable way. [Note for 2020-21 departments are required to report against their strategic objectives].
Example and why this is best practice
The example on this slide from HM Revenues & Customs Annual Report and Accounts:
✓ Shows clearly performance against its public commitments, including where progress was not on track or where there was a risk to delivery;
✓ Uses a helpful RAG system to visually show status of each commitment at the year end;
✓ Gives a balanced and honest reflection, which provides trust and increases the value of the report to the user.
Figu
re 1
1 –
HM
Reve
nues
& C
ust
om
s

Best Practice Examples 2019-20 19
Figu
re 1
2 –
HM
Court
s an
d T
rib
unal
Serv
icesExample and why this is best practice
Similar to the previous slide, the example on this slide from HM Courts and Tribunal Services Annual Reports and Accounts:
✓ Breaks down the overall strategic priority of ‘systems, processes and technology’ into smaller business plan priorities with the use of colour, to clearly show users what elements have been achieved and what has not;
✓ Uses a table to show the progress the department has made against each Business plan priority;
✓ Builds transparency into reporting, which provides trust and increases the value of the report to the user.
Balanced reporting (2)

Figu
re 1
3–
Gove
rnm
ent
inte
rnal
audit a
gen
cy
Future plans examples (1)
Best Practice Examples 2019-20 20
Reporting Issue
Organisations should produce forward looking information as it increases the value of the narrative surrounding the current year’s performance including why decisions have been taken and how they contribute to future ambitions.
Example and why this is best practice
The example on this slide from the Government Internal Audit Agency Annual Report and Accounts:
✓ Clearly articulates the progress it has already made against the department’s vision and outlines the next steps for the years ahead;
✓ Uses plain English and visuals to map the stages involved.

Future plans (2)
Best Practice Examples 2019-20 21
Example and why this is best practice
Similarly, the example on this slide from the Food Standards Agency Annual Report and Accounts:
✓ Uses clear formatting to highlight each element involved in meeting the overall target;
✓ Sets out the planned period for the model to be developed within;
✓ Includes a range of graphics, making this section more visually appealing to users;
✓ The drivers for change that resulted in this model all link back to the department’s 4 strategic priorities. Fi
gu
re 1
4 –
Foo
d S
tandar
ds
Agency

Reporting against Single Departmental Plans example (1)
Best Practice Examples 2019-20 22
Example and why this is best practice
The example on this slide from the Ministry of Housing, Communities and Local Government Annual Report and Accounts:
✓ Provides quantitative data by using prior year comparators – both figures and percentages;
✓ Details the department’s overall aim and provides a clear explanation on the progress it has made.
Reporting Issue
Annual reports and accounts should report progress against the objectives set out in Single Departmental Plans [note for 2020-21 entities are required to report against their strategic objectives]. It is important that reporting is fair and balanced, showing instances where performance has been below expectation and goals previously set.
Figu
re 1
5 -
Min
istr
y of
Housi
ng C
om
munitie
s an
d L
oca
l Gove
rnm
ent

Reporting against Single Departmental Plans (2)
Best Practice Examples 2019-20 23
Example and why this is best practice
Similarly, the example on this slide from the Department for International trade Annual Report and Accounts:
✓ Provides a visual summary and an explanation on the key metrics used to monitor the departments performance against some of their SDPs;
✓ Used prior year comparators to show users the percentage changes (provides both increases and decreases, which builds transparency);
Figu
re 1
6 –
Dep
artm
ent
for
inte
rnat
ional
tra
de

Reporting activity by projects and key policies example (1)
Best Practice Examples 2019-20 24
Example and why this is best practice
The example on this slide from High Speed Two (HS2) Annual Report and Accounts:
✓ Uses a table to clearly outline the assessment of progress to date. This involved the contract, standard, and ratings of the different infrastructure projects;
✓ Provides a clear summary of the project supplemented with more detailed commentary elsewhere in the report.
Reporting Issue
As a key area of public interest, in order to effectively tell their story, entities should report on the performance of major projects they have responsibility for.
Figu
re 1
7 -
Hig
h S
peed
Tw
o (H
S2) Lt
d

Sustainability reporting examples (1)
Best Practice Examples 2019-20 25
Reporting Issue
Entities are expected to provide information on environmental matters, including the impact of the entity’s business on the environment. Departments shall report performance against sustainability targets, as set out in the Sustainability Reporting Guidance and provide a description of progress within the financial year.
Example and why this is best practice
The example on this slide from the Department for International Development Annual Report and Accounts:
✓ Uses individual graphs to clearly show how progress is being made against each Greening Government Commitment (GGC);
✓ Incorporates a RAG system to visually show to users what is on track and what is below target.
Figure 18 – Department for International Development

Sustainability reporting (2)
Best Practice Examples 2019-20 26
Example and why this is best practice
Similar to the previous slide, this example from the Food Standards Agency Annual Report and Accounts :
✓ Uses multi-year trend data to show both the amount of energy used by the department and the related expenditure;
✓ Builds transparency by providing users with data on the energy consumption by location;
✓ Provides commentary on the reason for the increase in energy use and plans to reduce it going forward.
Figure 19 – Food Standards Agency

Disclosures on the impact of COVID-19 examples (1)
Best Practice Examples 2019-20 27
Example and why this is best practice
The example on this slide from HM Revenues & Customs Annual Report and Accounts:
✓ Shows a clear focus on summary spend in response to the pandemic;
✓ Uses concise plain English to provide further detail on these support measures.
Additional reporting requirement
The government has undertaken a major programme of work to respond to the COVID-19 pandemic and entities are required to provide a balanced narrative of the impact of COVID-19 on activities and outcomes for 2020-21.
Therefore, they must reflect this in their performance reports, drawing on the full range of information they hold to offer insight into the use of public funds in the response, future objectives and risks and where these are expected to be significantly different in future reporting periods.
Figu
re 2
0 –
HM
Reve
nue
& C
ust
om
s

Disclosure on Covid-19 (2)
Best Practice Examples 2019-20 28
Example and why this is best practice
HMRC continues to detail the impact of the pandemic on its operations both as part of its immediate response and into the next reporting period. This summary:
✓ Uses a diagram to set out a clear timeline of events since the pandemic started in March 2020;
✓ Incorporates a colour scheme to provide users with a visual representation on the different areas of support measures that have been introduced.
✓ Goes beyond the minimum requirements by providing additional information after the end of the financial year, which recognises the importance of this data for users.
Figu
re 2
1 –
HM
Reve
nues
& C
ust
om
s

Disclosure on Covid-19 (3)
Best Practice Examples 2019-20 29
Example and why this is best practice
Similar to the previous slide, the example on this slide from The Water Services Regulation Authority Annual Report and Accounts:
✓ Uses an infographic to map the different responses made across the UK in relation to the pandemic;
✓ This is a visually appealing way of presenting the departments response, therefore increasing user engagement.
Figure 22 – The Water Services Regulation Authority
Further examples on the impact of Covid-19:• Risk reporting• Financial reporting

Disclosure on EU exit examples (1)
Best Practice Examples 2019-20 30
Example and why this is best practice
In this example the Department for Business, Energy and Industrial Strategy Annual Reports and Accounts:
✓ Has highlighted its major programmes to show users how it has responded to the UK leaving the EU;
✓ Provided detailed information on what mitigating activities were undertaken, in order to reduce identified risks;
✓ Uses Icons within the table to map the risk to the relevant departmental objective(s), which have already been highlighted earlier on in the report.
Figure 23 –Department for Business, Energy and Industrial Strategy
Additional reporting requirement
The government has undertaken major programmes of work to prepare for and deliver the UK’s exit from the EU. Entities must therefore reflect this in their performance reports, drawing on the full range of information they hold to provide a balanced narrative between performance, future objectives and risks, where details are known and expected to be significantly different in future reporting periods.

Disclosure on EU exit (2)
Best Practice Examples 2019-20 31
Example and why this is best practice
Similar to the previous slide, the e example on this slide from HM Revenue & Customs Annual Report and Accounts:
✓ Highlights the response the department has made in relation to preparing for the EU exit;
✓ Uses clear and simple language, which makes this section easier for a wide range of people to read;
✓ Provides a clear focus on summary data, which capture users attention.
Figu
re 2
4 –
HM
Reve
nue
& C
ust
om
s

Chapter 3 – Accountability Reporting
Best Practice Examples 2019-20 32
What is required within the Accountability Report?
• The accountability report is made up of three sections: A Corporate Governance Report; a Remuneration and Staff Report, and a Parliamentary Accountability and Audit Report.
• Entities should provide an overview of these sections and explain how they contribute to an entity’s accountability.
Further information can be found on this within the 20-21 FReM (Government Financial Reporting Manual).
This chapter highlights some examples of best practice in accountability reporting in departmental ARA’s.
What should accounts preparers consider in Accountability Reporting?
Meet key accountability requirements to Parliament, being the primary user of annual
report and accounts.
Disclosures should be presented in a way that meets the needs of users.
Ensure all disclosure requirements are met
within the report.

Risk reporting and Governance examples (1)
Best Practice Examples 2019-20 33
Example and why this is best practice
The example on this slide from the Department for Business, Energy and Industrial Strategy Annual Reports and Accounts:
✓ Presents the risks facing the organisation, alongside the risk direction (how the risk has developed throughout the year), severity and the mitigating activities being undertaken;
✓ Uses Icons within the table to map the risk to the relevant departmental objective(s), which have been highlighted earlier on in their annual report.
Reporting Issue
Risk reporting appears in both the performance and accountability reports in ARAs. The performance report should provide information on the risk profile of the organisation – the risks it faces, how risks have affected the organisation in achieving its objectives, how they have been mitigated and managed throughout the period and how this may affect future plans and performance.
Figure
25
–D
ep
artm
ent
for
Bu
sines
s, E
nerg
y an
d
Indust
rial
Str
ategy

Risk reporting and Governance (2)
Best Practice Examples 2019-20 34
Example and why this is best practice
This example from the Department for Education Annual Report and Accounts:
✓ Presents the risks facing the organisation;
✓ Graphically shows the risk direction and severity (how the risk has developed throughout the year);
✓ Sets out who owns each risk, and the mitigating activities being undertaken;
✓ Provides detail on the resulting risk from the mitigations.
Figure
26
–D
ep
artm
ent
for
Edu
cation

Best Practice Examples 2019-20 35
Risk reporting and Governance (3)
Reporting Issue
The accountability report should explain the responsibilities for risk management and internal control systems and the ongoing process and structures used to identify, evaluate and manage the principal and emerging risks faced.
Example and why this is best practice
The example on this slide from the Ministry of Defence Annual Report and Accounts:
✓ Effectively represents the Board using a clear organogram;
✓ Uses a colour scheme, allowing users to easily identify each committee to provide additional context.
Figure
27
–M
inis
try
of
Defe
nce

Best Practice Examples 2019-20 36
Risk reporting and Governance (4)
Example and why this is best practice
The slide continues the example from the MoD:
✓ Gives a brief description on the different responsibilities across the board;
✓ Includes detail on the discussions made throughout the year;
✓ Includes information on the frequency of meetings;
✓ Uses the same colour scheme as the organogram for ease of reference.
Figure 27a – Ministry of Defence

Risk reporting in relation to Covid-19 examples (1)
Best Practice Examples 2019-20 37
Example and why this is best practice
The example on this slide from the United Kingdom Atomic Energy Authority Annual Report and Accounts:
✓ Identifies the key risk factor(s) from the COVID-19 pandemic;
✓ Links the risks to the departments strategic priorities through coloured pie segments.
Additional reporting requirement
Departments should go beyond the minimum level of reporting wherever possible. To support parliamentary accountability, it is important that the ARAs demonstrate what departments have achieved with the resources made available to them.
Figure 28 – United Kingdom Atomic Energy Authority
Risk reporting in relation to Covid-19 (2)
Best Practice Examples 2019-20 38
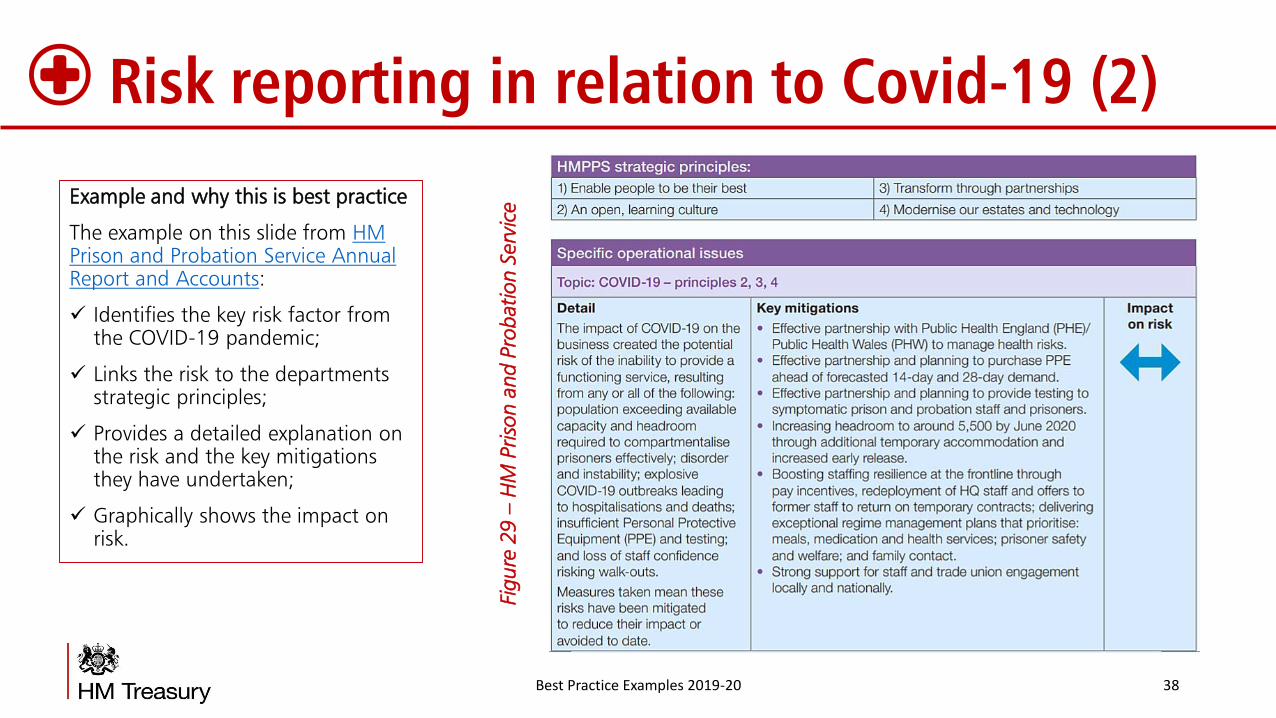
Example and why this is best practice
The example on this slide from HM Prison and Probation Service Annual Report and Accounts:
✓ Identifies the key risk factor from the COVID-19 pandemic;
✓ Links the risk to the departments strategic principles;
✓ Provides a detailed explanation on the risk and the key mitigations they have undertaken;
✓ Graphically shows the impact on risk.
Figure
29
–H
M P
riso
n a
nd P
rob
atio
n S
erv
ice

Risk reporting in relation to Covid-19 (3)
Best Practice Examples 2019-20 39
Example and why this is best practice
Similarly, the example on this slide from Network Rail Annual Report and Accounts:
✓ Clearly outlining strategies that have been implemented as a result of the pandemic;
✓ Providing detail on how each objective is managed/who is managing it;
✓ Using a variety of graphics, making this section more visually appealing.
Figu
re 3
0 –
Netw
ork
Rai
l
Further examples on the impact of Covid-19:• Performance reporting• Financial reporting

Remuneration disclosures examples (1)
Best Practice Examples 2019-20 40
Reporting Issue
The remuneration and staff report sets out the entity’s remuneration policy for directors, reports on how that policy has been implemented and sets out the amounts awarded to directors and where relevant, the link between performance and remuneration. In addition, the report provides details on remuneration and staff that Parliament and other users see as key to accountability.
Example and why this is best practice
The example on this slide from the Department for International trade Annual Report and Accounts:
✓ Provides information including a breakdown by headcount and detailed breakdown of spend category (Civil Servants, Ministers etc) in a clear format;
✓ Uses a prior year comparator to show changes. Figure
31
–D
ep
artm
ent
for
Inte
rnat
ional
Tr
ade

Remuneration disclosures (1a)
Best Practice Examples 2019-20 41
Example and why this is best practice
The example follows on from the previous slide, from the Department for International Trade (DIT):
✓ Provides information including a breakdown by headcount and detailed breakdown of spend category (Civil Servants, Ministers etc) in a clear format;
✓ Uses a prior year comparator to show changes.
Figu
re 3
1a –
Dep
artm
ent
for
Inte
rnat
ional
Tr
ade

Statement of Outturn Against Parliamentary Supply example (1)
Best Practice Examples 2019-20 42
Reporting Issue
The Statement of Outturn against Parliamentary Supply (SOPS) is unique to the public sector and shows the year end outturn against the Supply voted earlier in the year by Parliament. It is a key accountability statement, showing whether entities have operated within the limits (also termed control totals) which Parliament has provided statutory approval for. As part of the Statement of Outturn against Parliamentary Supply. It is important that variances between the Estimates and the actual spend of a department are explained clearly and effectively, and are linked to data elsewhere in the report to reflect a cohesive picture of performance.
Example and why this is best practice
The example on the next slide from the Department for Education Annual Report and Accounts:
✓ Includes a breakdown by budget type to show a clear comparison between the planned spend and the actual outturn of each estimate line;
✓ Provides a brief and understandable explanation for the variance within each Estimate line;
✓ Includes a graph to visually show the ‘year on year’ variance.

Statement of Outturn Against Parliamentary Supply (1a)
Best Practice Examples 2019-20 43
Figu
re 3
2–
Dep
artm
ent
for
Educa
tion
Diversity & Inclusion disclosures examples (1)
j
Best Practice Examples 2019-20 44
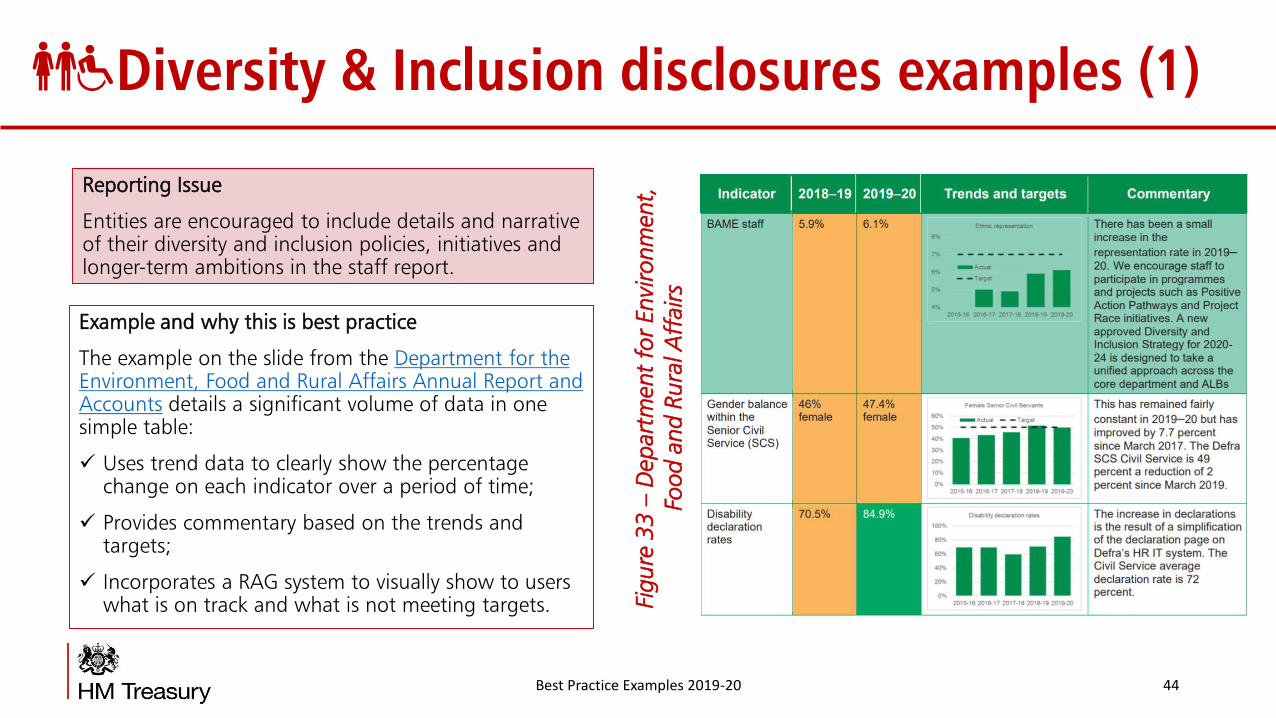
Reporting Issue
Entities are encouraged to include details and narrative of their diversity and inclusion policies, initiatives and longer-term ambitions in the staff report.
Example and why this is best practice
The example on the slide from the Department for the Environment, Food and Rural Affairs Annual Report and Accounts details a significant volume of data in one simple table:
✓ Uses trend data to clearly show the percentage change on each indicator over a period of time;
✓ Provides commentary based on the trends and targets;
✓ Incorporates a RAG system to visually show to users what is on track and what is not meeting targets. Fi
gu
re 3
3 –
Dep
artm
ent
for
Envi
ronm
ent,
Fo
od a
nd R
ura
l Aff
airs

Diversity & Inclusion (2)
Best Practice Examples 2019-20 45
Example and why this is best practice
Similar to the previous slide, the example on this slide from the Foreign & Commonwealth Office Annual Report and Accounts:
✓ Gives a visual overview of recruitment for the year;
✓ Provides the percentage recruited from each category of protected characteristics in a clear and visually appealing way;
✓ Uses clear formatting, allowing users to easily compare between the different recruitments.
Figu
re 3
4 –
Fore
ign a
nd C
om
monw
ealth
Off
ice

Diversity & Inclusion (3)
Best Practice Examples 2019-20 46
Example and why this is best practice
In this example, the Department for Work and Pensions Annual Report and Account:
✓ Uses multiple-year trend data to clearly show the percentage change of the participation in all pensions by each ethnic group over a period of time;
✓ The chart allows users to easily compare between the data.
Figure 35 – Department for Work and Pensions

Diversity & Inclusion (4)
Best Practice Examples 2019-20 47
Example and why this is best practice
Similarly, the example on this slide from Department for Work and Pensions Annual Report and Account:
✓ Uses multiple-year trend data to clearly show the increase in working-age disabled people over time;
✓ Provides brief, but sufficient commentary in relation to the figures the graph presents.
Figu
re 3
6 –
Dep
artm
ent
for
Work
and P
ensi
ons

Staff turnover disclosures example (1)
Best Practice Examples 2019-20 48
Reporting Issue
Parliament has shown particular interest in the level of staff turnover within government organisations. In response. entities will be required to disclose this information (on a comply or explain basis) from 2020-21 however, some organisations are already doing so. Where it is provided, information should give sufficient explanation and context.
Example and why this is best practice
The example on the slide from the Ministry of Justice Annual Report and Accounts:
✓ Includes the staff turnover percentage with a prior year comparator;
✓ Goes beyond the minimum requirements and includes the ‘Departmental turnover’ as well;
✓ Provides a brief, but sufficient explanation in regards to the data.
Figu
re 3
7 –
Min
istr
y of
Just
ice

Sickness absence disclosures example (1)
Best Practice Examples 2019-20 49
Reporting Issue
The staff report must include sickness absence information for all entities. It is important that the staff report disclosures are presented in a way that meets the needs of users.
Example and why this is best practice
The example on the slide from the Health and Safety Executive Annual Report and Accounts:
✓ Uses multi-year trend data on a line graph, to clearly show the average working days lost;
✓ Provides a brief, but sufficient explanation in regards to the data shown.
Figu
re 3
8 -
Heal
th a
nd S
afet
y Ex
ecu
tive

Accessible & transparent data example (1)
Best Practice Examples 2019-20 50
Reporting Issue
Different users of the annual reports and accounts have different accessibility requirements. Best practice is to provide both print friendly reports and web friendly reports online. Some users of government ARAs wish to extract and analyse the data that is contained within the report. All departments must publish the data from their core tables in Excel or an equivalent format to make it easier to collect and compare.
Example and why this is best practice
The example on the slide from the Foreign & Commonwealth Office Annual Report and Accounts:
✓ Provides both ‘web accessible’ and ‘print ready’ formats of the ARA;
✓ Has published their core tables alongside their reports.
Figu
re 3
9 –
Fore
ign &
Com
monw
ealth O
ffic
e
Chapter 4 – Financial Information
Best Practice Examples 2019-20 51
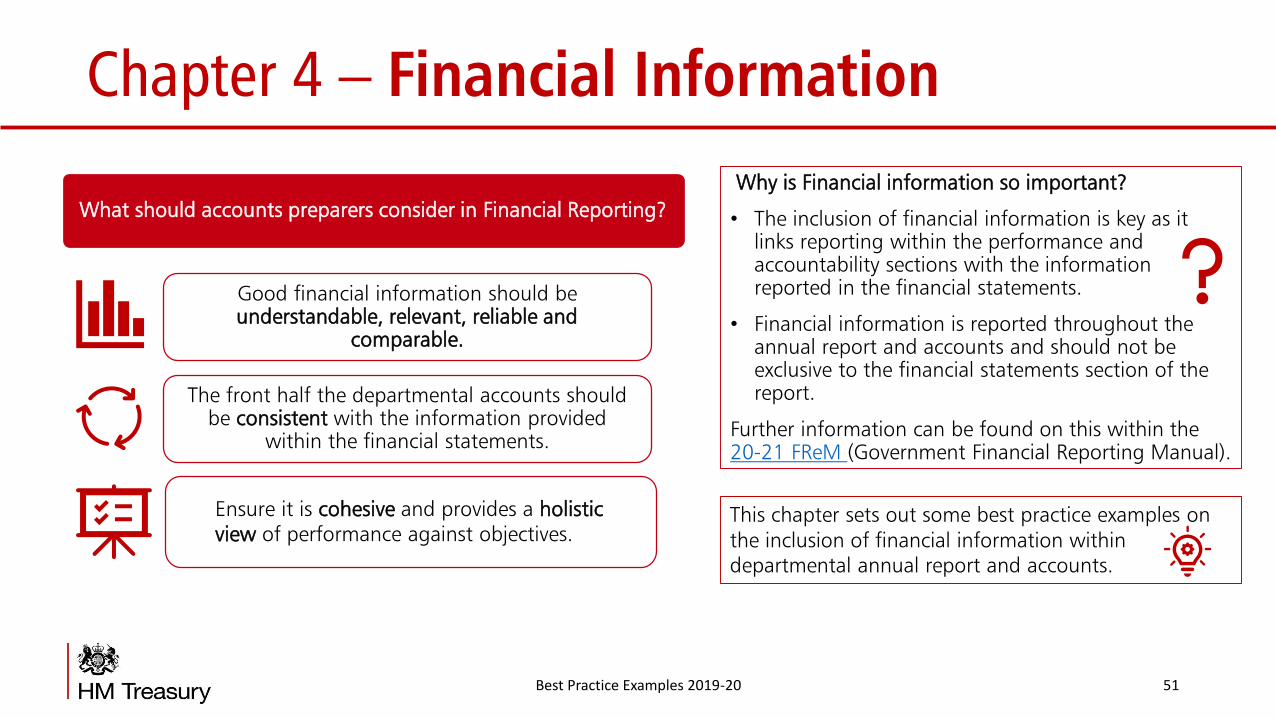
Why is Financial information so important?
• The inclusion of financial information is key as it links reporting within the performance and accountability sections with the information reported in the financial statements.
• Financial information is reported throughout the annual report and accounts and should not be exclusive to the financial statements section of the report.
Further information can be found on this within the 20-21 FReM (Government Financial Reporting Manual).
This chapter sets out some best practice examples on the inclusion of financial information within departmental annual report and accounts.
What should accounts preparers consider in Financial Reporting?
Good financial information should be understandable, relevant, reliable and
comparable.
The front half the departmental accounts should be consistent with the information provided
within the financial statements.
Ensure it is cohesive and provides a holistic view of performance against objectives.

Integrated financial reporting example (1)
Best Practice Examples 2019-20 52
Reporting Issue
Departments are encouraged to include key information from the financial statements in the performance report, including clear narrative and comparisons where appropriate.
Example and why this is best practice
The example on the slide from the Ministry of Housing, Communities and Local Government Annual Report and Accounts:
✓ Uses a graph to clearly present the Statement of Financial Position of the department;
✓ Provides users with the exact figure on each area of asset and liability;
✓ Gives useful explanations for each spend.
Figure 40 - Ministry of Housing Communities and Local Government

Financial reporting in relation to Covid-19 examples (1)
Best Practice Examples 2019-20 53
Additional reporting requirement
Departments must ensure that an analysis of COVID-19 related expenditure for 2019-20 is included within ARA’s, with details of the spend disaggregated by area and funding type. Departments should include an explanation on how funds were spent, what they were spent on, and the outcome achieved. This information will also be required in 2020-21.
Example and why this is best practice
The example on the slide from HM Treasury Annual Report and Accounts:
✓ Uses a table to summarise the support measures introduced;
✓ Includes the different costings for the interventions;
✓ Disaggregates the different areas of funding out, depending on their purpose.
Figure 41 – HM Treasury

Financial reporting in relation to Covid-19 (2)
Best Practice Examples 2019-20 54
Example and why this is best practice
The example on the slide from the Department for Transport Annual Report and Accounts:
✓ Uses a table to summarise the support measures introduced for each transport mode, with clear explanations;
✓ Includes the different costings for the measures;
✓ Includes the period of support, which provides users with a clearer insight.
Figu
re 4
2 –
Dep
artm
ent
for
Tran
sport
Further examples on the impact of Covid-19:• Performance reporting• Risk reporting

Infographics examples (1)
Best Practice Examples 2019-20 55
Reporting Issue
The use of infographics enhances the look and feel of annual reports and accounts. The use of these infographics is an effective way of communicating complicated information, and this is particularly true when presenting financial information.
Example and why this is best practice
The example on the slide from the Food Standards Agency Annual Report and Accounts:
✓ Displays financial information in an engaging and informative way;
✓ Uses clear formatting and a range of graphics, increasing usability and makes the section more visually appealing.
Figu
re 4
3 –
Food s
tandar
ds
agen
cy

Infographics (2)
Best Practice Examples 2019-20 56
Example and why this is best practice
Similar to the previous slide, the example on this slide from the Ministry of Justice Annual Report and Accounts:
✓ Displays financial information in an engaging and informative way;
✓ Allows users to easily compare the different expenditure across the departmental groups by using colour codes;
✓ Sums up information in a way that can better communicate messages and increase user engagement.
Figu
re 4
4 –
Min
istr
y of
Just
ice

Infographics (3)
Best Practice Examples 2019-20 57
Example and why this is best practice
Similar to the previous slide, the example on this slide from Whole of Government Accounts Annual Report and Accounts:
✓ Displays financial information in an engaging and informative way;
✓ Provides commentary based on the figures it presents;
✓ Sums up information in a way that can better communicate messages and increase user engagement.
Figu
re 4
5 –
Whole
of
Gove
rnm
ent
Acc
ounts
Please note that this example has been taken from the 2018-19 accounts, due to the timing of preparing the WGA.

IFRS 16 Leases examples (1)
Best Practice Examples 2019-20 58
Reporting Issue
The mandated adoption of IFRS 16 Leases is due from 2022-23. However, two departments were granted permission to adopt IFRS 16 early (DCMS and DfT) from 2019-20 due to specific circumstances affecting the groups.
Example and why this is best practice
The example on the slide from the Department for Transport Annual Report and Accounts:
✓ Provides a table which is divided into the different areas of leases the department has and clearly shows the figures for each (next page);
✓ Some useful commentary has also been included in relation to the figures presented.
Figure 46 – Department for Transport

IFRS 16 Leases examples (1)
Best Practice Examples 2019-20 59
Example and why this is best practice
The example on the slide from the Department for Transport (DfT):
✓ Provides a table which is divided into the different areas of leases the department has and clearly shows the figures for each;
✓ Some useful commentary has also been included in relation to the figures presented.
Figure 46a – Department for Transport

IFRS 16 Leases (2)
Best Practice Examples 2019-20 60
Example and why this is best practice
The example on the slide from the Department for Digital, Culture, Media and Sport Annual Report and Accounts:
✓ Uses a table to visually show the impact IFRS 16 has had on their financial statements, which is split out between the core department and departmental group (table is on next page);
✓ Provides detailed explanations regarding the implementation of IFRS 16.
Figure 47 – Department for Digital, Culture, Media and Sport (DCMS)

IFRS 16 Leases (2a)
Best Practice Examples 2019-20 61
Example and why this is best practice
The example on the slide from the Department for Digital, Culture, Media and Sport (DCMS):
✓ Uses a table to visually show the impact IFRS 16 has had on their financial statements, which is split out between the core department and departmental group;
✓ Provides detailed explanations regarding the implementation of IFRS 16. Fi
gu
re 4
7a –
Dep
artm
ent
for
Dig
ital
, C
ultu
re, M
edia
and S
port

Best Practice Examples 2019-20 62
Chapter 5 – Further links
1. The Building Public Trust Awards:https://www.pwc.co.uk/build-public-trust/the-building-public-trust-in-corporate-reporting-awards.html
2. Government Financial Reporting Reviewhttps://www.gov.uk/government/publications/the-government-financial-reporting-review
3. Government Financial Reporting Manual 2020-21https://www.gov.uk/government/publications/government-financial-reporting-manual-2020-21
4. Audit Scotland good practice note on improving the quality of central government annual report and accountshttps://www.audit-scotland.gov.uk/uploads/docs/um/gp_improving_quality_central_government_accounts.pdf
5. The ONS recently published guidance on producing effective graphs and tableshttps://gss.civilservice.gov.uk/wp-content/uploads/2017/01/GUIDANCE-document-Effective-charts-and-tables-in-official-statistics-Version-2.0-Jan2017.pdf

HM Treasury contacts
This document can be downloaded from www.gov.uk
If you require this information in an alternative format or have general enquiries about HM Treasury and its work, contact:
Correspondence Team
HM Treasury
1 Horse Guards Road
London
SW1A 2HQ
Tel: 020 7270 5000
Email: [email protected]
Best Practice Examples 2019-20 63