government finance statistics · government finance statistics ... as outlined in chapter 1,...
TRANSCRIPT
APPENDIX E
GOVERNMENT FINANCE STATISTICS
2006-07 Budget Paper No. 3 265 Appendix E

2006-07 Budget Paper No. 3 266 Appendix E

GOVERNMENT FINANCE STATISTICS
This appendix contains details of the operations of the ACT on a Government Finance Statistics presentation basis, as required under the Accrual Uniform Presentation Framework. The information relates to the 2005-06 estimated outcome and budget estimates for 2006-07 and the forward estimates.
Information on the components of these concepts and on the classification of entities is provided at Appendix A of this budget paper.
The GFS includes only those transactions over which a government exercises control under its legislative or policy framework.
GFS revenue differs from AAS revenue. GFS revenue includes all (mutually agreed) transactions that increase net worth. Revaluations, included in AAS revenue, are not considered mutually agreed transactions, so are excluded from GFS revenue. Included in this revaluations category are asset write-offs. Asset sales, which involve a transfer of a non-financial for a financial asset, are also excluded.
GFS expenses differ from AAS expenses. GFS expenses encompass all transactions that decrease net worth, including dividend and tax equivalent payments.
Classification changes
Since the 2005-06 Mid Year Review there have been two significant classification changes.
Firstly, the Land Development Agency has been reclassified from the general government sector to the public non-financial corporations sector from 2005-06. This revised classification recognises that the LDA operates commercially to earn profits on its land development activities. Consistent with this treatment, the LDA is now required to purchase land from the general government sector at market prices.
This classification is consistent with the classification of similar land development agencies in state government jurisdictions. The effect of the reclassification is to remove expenses incurred by the LDA from the general government sector. It also means that dividends and tax equivalents paid by the LDA are now recognised as GFS revenues.
However, land sales from the general government sector to the LDA are not classified as GFS revenues, but continue to be treated as asset sales.
This change in the sectoral classification of the LDA has the effect of improving the general government sector net operating balance by around $90 million per annum relative to the estimates published in the 2005-06 Mid Year Review.
The second classification change involves the treatment of underlying interest and dividends earnings on the Territory’s superannuation investments held in unit structures.
2006-07 Budget Paper No. 3 267 Appendix E

Previously, the ACT has treated these interest and dividends as other economic flows. However, these flows are in fact economic transactions and should therefore be classified as GFS revenues.
This classification change increases GFS revenues and improves the general government sector operating result by around $35 million per annum relative to the estimates published in the 2005-06 Mid Year Review.
Finally, there has been a reclassification of some employee expenses to nominal superannuation expenses. This change does not have a net effect on the general government sector net operating balance. However, it does increase the estimated nominal superannuation expense by around $110 million in 2006-07.
Comparison with state governments
As outlined in Chapter 1, caution should be exercised in comparing the estimates presented in this appendix with the GFS financial statements prepared by other jurisdictions. This is because there is an important difference in the way the ACT accounts for superannuation investment returns in its UPF statements relative to state governments.
In particular, Australian Accounting Standard 119, Employee Benefits, allows the expected property income on superannuation plan assets (assets held by an autonomous superannuation fund) to be treated as an offset when calculating the superannuation expense to be recognised in the income statement.
This treatment is widely adopted by Australian governments in preparing their GFS statements. It enures that the general government sector net operating balance implicitly incorporates the expected rate of return on assets held in superannuation funds to meet accumulated liabilities.
However, the ACT Government is precluded from holding assets in the defined benefit schemes applying to its employees and former employees (the PSS and CSS schemes). Instead, these assets are held in a separate statutory fund, the Superannuation Provision Account (SPA). The SPA is classified as part of the general government sector.
Consequently, the ACT does not account for these assets in the same way as governments that have partially funded superannuation schemes. While the ACT only records interest and dividend on its superannuation assets, state governments (which are able to invest assets in the actual superannuation schemes themselves) subtract the expected rate of return on their superannuation assets in the calculation of superannuation expenses.
As a result of this different treatment, the ACT’s net operating balance in the UPF statements presented in this appendix appears weaker than the corresponding results for state governments.
If the ACT was to apply the treatment provided for in AAS119, the general government sector net operating balance would improve by $70 million to $90 million per annum.
As discussed in Chapter 1, the ACT’s net operating balance must therefore be adjusted by this amount to provide a “like with like” comparison with state governments.
2006-07 Budget Paper No. 3 268 Appendix E
The ABS is currently reviewing the GFS accounting for superannuation by governments. The ACT will further consider its treatment of superannuation assets in the UPF statements following the completion of the ABS review.
2006-07 Budget Paper No. 3 269 Appendix E

General Government Sector Operating Statement
-1 Budget 1 2 32005-06 2006-07 2007-08 2008-09 2009-10
Est. Outc. Budget Estimate Estimate Estimate$'000 $'000 $'000 $'000 $'000
GFS RevenueTaxation Revenue 768,963 817,500 870,230 925,761 977,476Current grants and subsidies 1,106,839 1,162,843 1,216,044 1,271,562 1,323,485Capital Grants 61,838 78,568 71,052 71,091 80,370Sale of goods and services 303,625 327,528 349,802 362,869 376,214Interest income 106,193 98,282 84,877 83,707 95,603Other 253,449 246,927 251,514 285,444 309,149
Total revenue 2,600,907 2,731,648 2,843,519 3,000,434 3,162,297
less GFS Expenses Employee expenses 1,182,466 1,190,625 1,204,126 1,241,561 1,278,526Depreciation and amortisation 168,736 179,702 188,897 190,009 189,875Other operating expenses 733,041 760,650 796,250 836,992 887,349Nominal superannuation interest expense 143,882 168,176 182,935 197,426 212,041Other interest expenses 53,509 52,718 52,919 53,959 55,985Other property expenses 0 0 0 0Current transfers 500,486 538,469 532,296 542,376 558,106Capital transfers 14,773 -11,188 9,817 18,440 20,118
Total expenses 2,796,893 2,879,152 2,967,240 3,080,763 3,202,000
equals GFS net operating balance -195,986 -147,504 -123,721 -80,329 -39,703less
Net acquisition of non-financial assetsPurchases of non-financial assets 232,124 420,919 311,219 185,903 163,456Sales of non financial assets -2,644 -2,645 -2,645 -2,645 -2,645Land Revenue (accrual item) -79,335 -72,450 -73,500 -75,200 -83,350Depreciation -168,736 -179,702 -188,897 -190,009 -189,875Change in inventoriesOther movements in non-financial assetsTotal net acquisition of non-financial assets -18,591 166,122 46,177 -81,951 -112,414
equals GFS Net Lending/Borrowing (Fiscal Balance) -177,395 -313,626 -169,898 1,622 72,711
Reconciliation to 2006-07 Budget Papers
AAS Operating Result 120,491 -16,359 -11,662 73,167 147,384
Less Land Revenue (accrual item) 79,335 72,450 73,500 75,200 83,350Gains/Losses on non-financial assets 51,257 -13,086 -49,331 -25,566 -9,184Gains/Losses on financial assets 185,884 71,780 87,889 103,862 112,921
Reconciles to GFS net operating balance -195,986 -147,504 -123,721 -80,329 -39,703
2006-07 Budget Paper No. 3 270 Appendix E

Public Non-Financial Corporation Sector Operating Statement
-1 Budget 2005-06 2006-07
Est. Outc. Budget $'000 $'000
GFS RevenueTaxation Revenue 0 0Current grants and subsidies 86,227 75,996Capital Grants 40,978 37,924Sale of goods and services 269,070 294,421Interest income 7,414 6,783Other 11,715 4,949
Total revenue 415,404 420,073
less GFS Expenses Employee expenses 96,644 92,433Depreciation and amortisation 42,386 43,115Other operating expenses 258,837 287,913Nominal superannuation interest expense 0 0Other interest expenses 30,593 30,928Other property expenses 154,572 114,710Current transfers 15,706 29,362Capital transfers 49,261 56,873
Total expenses 647,999 655,334
equals GFS net operating balance -232,595 -235,261less
Net acquisition of non-financial assetsPurchases of non-financial assets 83,391 96,443Sales of non financial assets -215,875 -204,096Depreciation -42,386 -43,115Change in inventories 0 0Other movements in non-financial assets 0 0Total net acquisition of non-financial assets -174,870 -150,768
equals GFS Net Lending/Borrowing (Fiscal Balance) -57,725 -84,493
Reconciliation to 2006-07 Budget Papers
AAS Operating Result 122,026 79,284
Less Gains/Losses on non-financial assets 210,205 224,137Gains/Losses on financial assets 3,213 0Dividends Declared 141,203 90,408
Reconciles to GFS net operating balance -232,595 -235,261
2006-07 Budget Paper No. 3 271 Appendix E

Non-Financial Public Sector Operating Statement
-1 Budget 2005-06 2006-07
Est. Outc. Budget $'000 $'000
GFS RevenueTaxation Revenue 750,163 801,505Current grants and subsidies 1,107,276 1,163,481Capital Grants 31,166 40,657Sale of goods and services 545,233 579,552Interest income 79,129 70,731Other 127,154 116,971
Total revenue 2,640,121 2,772,897
less GFS Expenses Employee expenses 1,267,121 1,268,574Depreciation and amortisation 211,122 222,817Other operating expenses 824,631 886,373Nominal superannuation interest expense 143,887 168,181Other interest expenses 57,801 56,363Other property expensesCurrent transfers 431,448 475,638Capital transfers 16,367 5,265
Total expenses 2,952,377 3,083,211
equals GFS net operating balance -312,256 -310,314less
Net acquisition of non-financial assetsPurchases of non-financial assets 315,515 517,362Sales of non financial assets -218,519 -206,741Land Revenue (cash item) (a)Depreciation -211,122 -222,817Change in inventoriesOther movements in non-financial assetsTotal net acquisition of non-financial assets -114,126 87,804
equals GFS Net Lending/Borrowing (Fiscal Balance) -198,130 -398,118
Reconciliation to 2006-07 Budget Papers
AAS Operating Result 101,314 -27,483
Less Land Revenue (accrual item) (a)Gains/Losses on non-financial assets 224,473 211,051Gains/Losses on financial assets 189,097 71,780
Reconciles to GFS net operating balance -312,256 -310,314
2006-07 Budget Paper No. 3 272 Appendix E

General Government Sector Balance Sheet
-1 Budget 1 2 32005-06 2006-07 2007-08 2008-09 2009-10
Est. Outc. Budget Estimate Estimate Estimate$'000 $'000 $'000 $'000 $'000
AssetsFinancial Assets
Cash and deposits 76,379 71,909 71,179 75,896 77,830Advances paid 514,573 507,044 528,223 558,136 571,711Investments, loans and placements 2,545,144 2,472,685 2,599,476 2,936,138 3,340,662Other non-equity assets 176,657 229,958 234,328 234,504 251,280Equity 4,296,132 4,434,631 4,691,420 4,958,811 5,239,893Total financial assets 7,608,885 7,716,227 8,124,626 8,763,485 9,481,376
Non Financial AssetsLand and fixed assets 6,143,081 6,418,784 6,515,932 6,534,764 6,547,628Other non financial assets 108,694 143,774 144,466 145,557 154,934Total non financial assets 6,251,775 6,562,558 6,660,398 6,680,321 6,702,562
Total assets 13,860,660 14,278,785 14,785,024 15,443,806 16,183,938
LiabilitiesDeposits held 47,320 35,717 42,210 63,540 77,293Advances received 239,744 228,537 217,122 205,449 193,544Borrowing 703,347 681,148 691,784 731,432 759,695Superannuation liability (a) 2,924,800 3,181,475 3,433,495 3,687,666 3,950,620Other employee entitlements and provisions 278,740 295,484 314,148 333,982 353,979Other non-equity liabilities 299,128 297,343 294,326 298,240 301,852
Total liabilities 4,493,079 4,719,704 4,993,085 5,320,309 5,636,983
Net Worth 9,367,581 9,559,081 9,791,939 10,123,497 10,546,955
Net Financial Worth (b) 3,115,806 2,996,523 3,131,541 3,443,176 3,844,393Net Debt (including superannuation related investments) (c) -2,145,685 -2,106,236 -2,247,762 -2,569,749 -2,959,671Net Debt -343,930 -108,715 -61,902 -185,654 -368,134 (excluding superannuation related investments) (c) -343,930 -108,715 -61,902 -185,654 -368,134
(a) This line item consists of the total superannuation liability.(b) Net financial worth equals total financial assets minus total liabilities.(c) Net debt equals the sum of deposits held, advances received and borrowing, minus the sum of cash and
deposits, advances paid and investments, loans and placements
Reconciliation to 2006-07 Budget Papers
Budgeted Net Assets 5,071,471 5,124,470 5,103,148 5,167,315 5,309,699
plus Inclusion of PTE Equity in GFS Statements 4,296,110 4,434,611 4,688,791 4,956,182 5,237,256
Reconciles to GFS Net Worth 9,367,581 9,559,081 9,791,939 10,123,497 10,546,955
2006-07 Budget Paper No. 3 273 Appendix E
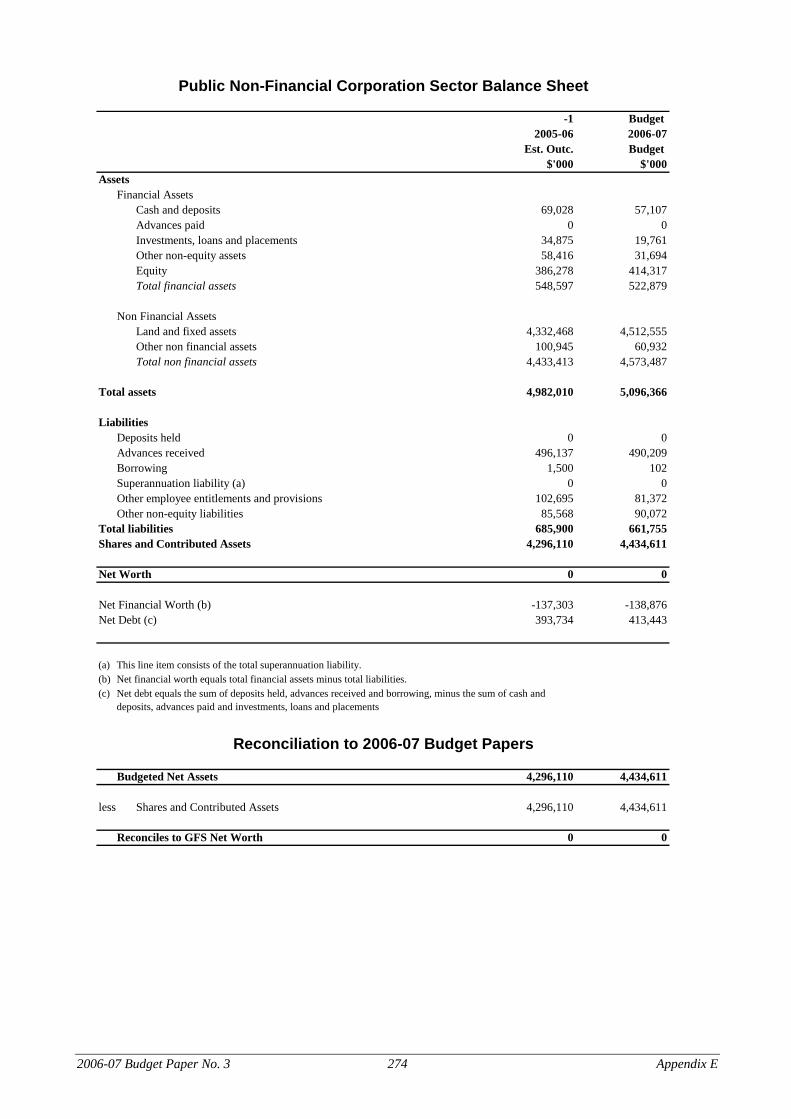
Public Non-Financial Corporation Sector Balance Sheet
-1 Budget 2005-06 2006-07
Est. Outc. Budget $'000 $'000
AssetsFinancial Assets
Cash and deposits 69,028 57,107Advances paid 0 0Investments, loans and placements 34,875 19,761Other non-equity assets 58,416 31,694Equity 386,278 414,317Total financial assets 548,597 522,879
Non Financial AssetsLand and fixed assets 4,332,468 4,512,555Other non financial assets 100,945 60,932Total non financial assets 4,433,413 4,573,487
Total assets 4,982,010 5,096,366
LiabilitiesDeposits held 0 0Advances received 496,137 490,209Borrowing 1,500 102Superannuation liability (a) 0 0Other employee entitlements and provisions 102,695 81,372Other non-equity liabilities 85,568 90,072
Total liabilities 685,900 661,755Shares and Contributed Assets 4,296,110 4,434,611
Net Worth 0 0
Net Financial Worth (b) -137,303 -138,876Net Debt (c) 393,734 413,443
(a) This line item consists of the total superannuation liability.(b) Net financial worth equals total financial assets minus total liabilities.(c) Net debt equals the sum of deposits held, advances received and borrowing, minus the sum of cash and
deposits, advances paid and investments, loans and placements
Reconciliation to 2006-07 Budget Papers
Budgeted Net Assets 4,296,110 4,434,611
less Shares and Contributed Assets 4,296,110 4,434,611
Reconciles to GFS Net Worth 0 0
2006-07 Budget Paper No. 3 274 Appendix E

Non-Financial Public Sector Balance Sheet
-1 Budget 2005-06 2006-07
Est. Outc. Budget $'000 $'000
AssetsFinancial Assets
Cash and deposits 98,087 93,299Advances paid 18,436 16,835Investments, loans and placements 2,580,019 2,492,446Other non-equity assets 166,667 192,374Equity 386,278 414,317Total financial assets 3,249,487 3,209,271
Non Financial AssetsLand and fixed assets 10,448,169 10,912,414Other non financial assets 181,314 176,381Total non financial assets 10,629,483 11,088,795
Total assets 13,878,970 14,298,066
LiabilitiesDeposits heldAdvances received 239,744 228,537Borrowing 704,847 681,250Superannuation liability (a) 2,924,885 3,181,558Other employee entitlements and provisions 345,237 349,340Other non-equity liabilities 296,676 298,300
Total liabilities 4,511,389 4,738,985
Net Worth 9,367,580 9,559,080
Net Financial Worth (b) -1,261,902 -1,529,714Net Debt (including superannuation related investments) (c) -1,751,951 -1,692,793Net Debt 49,804 304,728 (excluding superannuation related investments) (c) 49,804 304,728
(a) This line item consists of the total superannuation liability.(b) Net financial worth equals total financial assets minus total liabilities.(c) Net debt equals the sum of deposits held, advances received and borrowing, minus the sum of cash and
deposits, advances paid and investments, loans and placements
Reconciliation to 2006-07 Budget Papers
Budgeted Net Assets 9,367,580 9,559,080
2006-07 Budget Paper No. 3 275 Appendix E

General Government Sector Cash Flow Statement
-1 Budget 1 2 32005-06 2006-07 2007-08 2008-09 2009-10
Est. Outc. Budget Estimate Estimate Estimate$'000 $'000 $'000 $'000 $'000
Cash receipts from operating activitiesTaxes received 756,765 775,810 831,567 878,175 943,108Receipts from sales of goods and services 316,639 340,296 364,020 377,719 391,616Grants/subsidies received 1,166,586 1,234,346 1,282,613 1,336,892 1,383,929Interest 84,174 71,311 61,232 64,785 74,875Other receipts 342,423 307,773 314,073 336,881 354,086Total receipts 2,666,587 2,729,536 2,853,505 2,994,452 3,147,614
Cash payments for operating activitiesPayments for goods and services -1,626,077 -1,669,082 -1,703,027 -1,778,234 -1,880,805Grants and subsidies paid -537,945 -553,947 -569,192 -587,859 -605,468Interest paid -70,074 -67,744 -65,668 -65,394 -68,568Other payments -256,400 -252,046 -273,909 -276,802 -285,011Total payments -2,490,496 -2,542,819 -2,611,796 -2,708,289 -2,839,852
Net cash flows from operating activities 176,091 186,717 241,709 286,163 307,762
Net cash flows from investments in non-financial assets
Sales of non-financial assets 40,644 75,095 76,145 77,845 85,995less Purchases of non-financial assets (a) -232,124 -420,919 -311,219 -185,903 -163,456Net cashflows from investments in non-financial assets -191,480 -345,824 -235,074 -108,058 -77,461
Net cash flows from investments in financial assets for policy purposes (b) -19,096 -8,737 -30,841 -38,912 -18,576
Net cash flows from investments in financial assets for liquidity purposes -51,668 -13,493 -16,208 -13,047 -14,472
Net cash flows from financing activitiesAdvances received (net) -11,036 -11,207 -11,415 -11,672 -11,904Borrowing (net) -161 -27,062 8,965 29,398 14,662Deposits received (net)Other financing (net) -33,442 2,382Net cash flows from financing activities -44,639 -35,887 -2,450 17,726 2,758
Net increase (decrease) in cash held -130,792 -217,224 -42,864 143,872 200,011
Net cash from operating activities and investments in non financial assets -15,389 -159,107 6,635 178,105 230,301less Finance leases and similar arrangements (c)
Surplus (+) / deficit (-) (d) -15,389 -159,107 6,635 178,105 230,301(a) The ABS disaggregates this item into new and secondhand non-financial assets.(b) Includes equity acquisitions, disposals and privatisations (net).(c) Finance leases are shown with a negative sign as they are deducted in compiling the surplus/deficit.(d) Conceptually, the surplus/deficit aggregate contained in the cash flow statement is the same as the deficit measure
obtaines under the cash UPF. However, in practice, the process of deriving these aggregates differs so that the measures arenot directly comparable. Time series data created by splicing these measures together should therefore be used with caution.
2006-07 Budget Paper No. 3 276 Appendix E

Reconciliation to 2006-07 Budget Papers
Net Increase/(Decrease) in Cash -130,792 -217,224 -42,864 143,872 200,011
Add back items not included in calculationCash flows from investments in financial assets (policy purposes) (a) 19,096 8,737 30,841 38,912 18,576Cash flows from investments in financial assets (liquidity purposes) 51,668 13,493 16,208 13,047 14,472Advances received (net) 11,036 11,207 11,415 11,672 11,904Borrowing (net) 161 27,062 -8,965 -29,398 -14,662Deposits received (net) 0 0 0 0 0Other financing (net) 33,442 -2,382 0 0 0
Reconciles to GFS Surplus (+)/Deficit (-) -15,389 -159,107 6,635 178,105 230,301(a) The ABS disaggregates this item into new and secondhand non-financial assets.
2006-07 Budget Paper No. 3 277 Appendix E

Public Non-Financial Corporation Sector Cash Flow Statement
-1 Budget 2005-06 2006-07
Est. Outc. Budget $'000 $'000
Cash receipts from operating activitiesTaxes received 0 0Receipts from sales of goods and services 278,598 299,626Grants/subsidies received 121,022 113,920Interest 7,014 6,510Other receipts 70,094 54,770Total receipts 476,728 474,826
Cash payments for operating activitiesPayments for goods and services -367,668 -407,517Grants and subsidies paid -26,865 -23,652Interest paid -30,991 -31,288Other payments -42,349 -51,960Total payments -467,873 -514,417
Net cash flows from operating activities 8,855 -39,591
Net cash flows from investments in non-financial assets
Sales of non-financial assets 215,875 204,096less Purchases of non-financial assets (a) -83,391 -96,443Net cashflows from investments in non-financial assets 132,484 107,653
Net cash flows from investments in financial assets for policy purposes (b) 10,615 16,269
Net cash flows from investments in financial assets for liquidity purposes -9,904 13,128
Net cash flows from financing activitiesAdvances received (net) -14,659 -15,930Borrowing (net) 24,288 9,409Deposits received (net) 0 0Distribution paid -165,647 -104,339Other financing (net) 33,442 -2,382Net cash flows from financing activities -122,576 -113,242
Net increase (decrease) in cash held -113,010 -123,436
Net cash from operating activities and investments in non financial assets -24,308 -36,277less Finance leases and similar arrangements (c)
Surplus (+) / deficit (-) (d) -24,308 -36,277(a) The ABS disaggregates this item into new and secondhand non-financial assets.(b) Includes equity acquisitions, disposals and privatisations (net).(c) Finance leases are shown with a negative sign as they are deducted in compiling the surplus/deficit.(d) Conceptually, the surplus/deficit aggregate contained in the cash flow statement is the same as the deficit measure
obtaines under the cash UPF. However, in practice, the process of deriving these aggregates differs so that the measures arenot directly comparable. Time series data created by splicing these measures together should therefore be used with caution.
2006-07 Budget Paper No. 3 278 Appendix E

Reconciliation to 2006-07 Budget Papers
Net Increase/(Decrease) in Cash 19,474 -15,783
Add back items not included in calculationCash flows from investments in financial assets (policy purposes) (a) -10,615 -16,269Cash flows from investments in financial assets (liquidity purposes) 9,904 -13,128Advances received (net) 14,659 15,930Borrowing (net) -24,288 -9,409Deposits received (net) 0 0Other financing (net) -33,442 2,382
Reconciles to GFS Surplus (+)/Deficit (-) -24,308 -36,277(a) The ABS disaggregates this item into new and secondhand non-financial assets.
2006-07 Budget Paper No. 3 279 Appendix E

Non-Financial Public Sector Cash Flow Statement
-1 Budget 2005-06 2006-07
Est. Outc. Budget $'000 $'000
Cash receipts from operating activitiesTaxes received 756,931 775,548Receipts from sales of goods and services 553,207 599,057Grants/subsidies received 1,148,434 1,215,734Interest 56,710 42,564Other receipts 232,732 236,674Total receipts 2,748,014 2,869,577
Cash payments for operating activitiesPayments for goods and services -1,877,828 -1,908,852Grants and subsidies paid -444,225 -464,173Interest paid -58,410 -56,724Other payments -310,252 -324,591Total payments -2,690,715 -2,754,340
Net cash flows from operating activities 57,299 115,237
Net cash flows from investments in non-financial assets
Sales of non-financial assets 218,519 206,741less Purchases of non-financial assets (a) -315,515 -517,362Net cashflows from investments in non-financial assets -96,996 -310,621
Net cash flows from investments in financial assets for policy purposes (b) 1,860 1,602
Net cash flows from investments in financial assets for liquidity purposes -61,572 -365
Net cash flows from financing activitiesAdvances received (net) -11,036 -11,207Borrowing (net) -873 -27,653Deposits received (net)Other financing (net)Net cash flows from financing activities -11,909 -38,860
Net increase (decrease) in cash held -111,318 -233,007
Net cash from operating activities and investments in non financial assets -39,697 -195,384less Finance leases and similar arrangements (c)
Surplus (+) / deficit (-) (d) -39,697 -195,384(a) The ABS disaggregates this item into new and secondhand non-financial assets.(b) Includes equity acquisitions, disposals and privatisations (net).(c) Finance leases are shown with a negative sign as they are deducted in compiling the surplus/deficit.(d) Conceptually, the surplus/deficit aggregate contained in the cash flow statement is the same as the deficit measure
obtaines under the cash UPF. However, in practice, the process of deriving these aggregates differs so that the measures arenot directly comparable. Time series data created by splicing these measures together should therefore be used with caution.
2006-07 Budget Paper No. 3 280 Appendix E

Reconciliation to 2006-07 Budget Papers
Net Increase/(Decrease) in Cash -111,318 -233,007
Add back items not included in calculationCash flows from investments in financial assets (policy purposes) (a) -1,860 -1,602Cash flows from investments in financial assets (liquidity purposes) 61,572 365Advances received (net) 11,036 11,207Borrowing (net) 873 27,653Deposits received (net) 0 0Other financing (net) 0 0
Reconciles to GFS Surplus (+)/Deficit (-) -39,697 -195,384(a) The ABS disaggregates this item into new and secondhand non-financial assets.
2006-07 Budget Paper No. 3 281 Appendix E
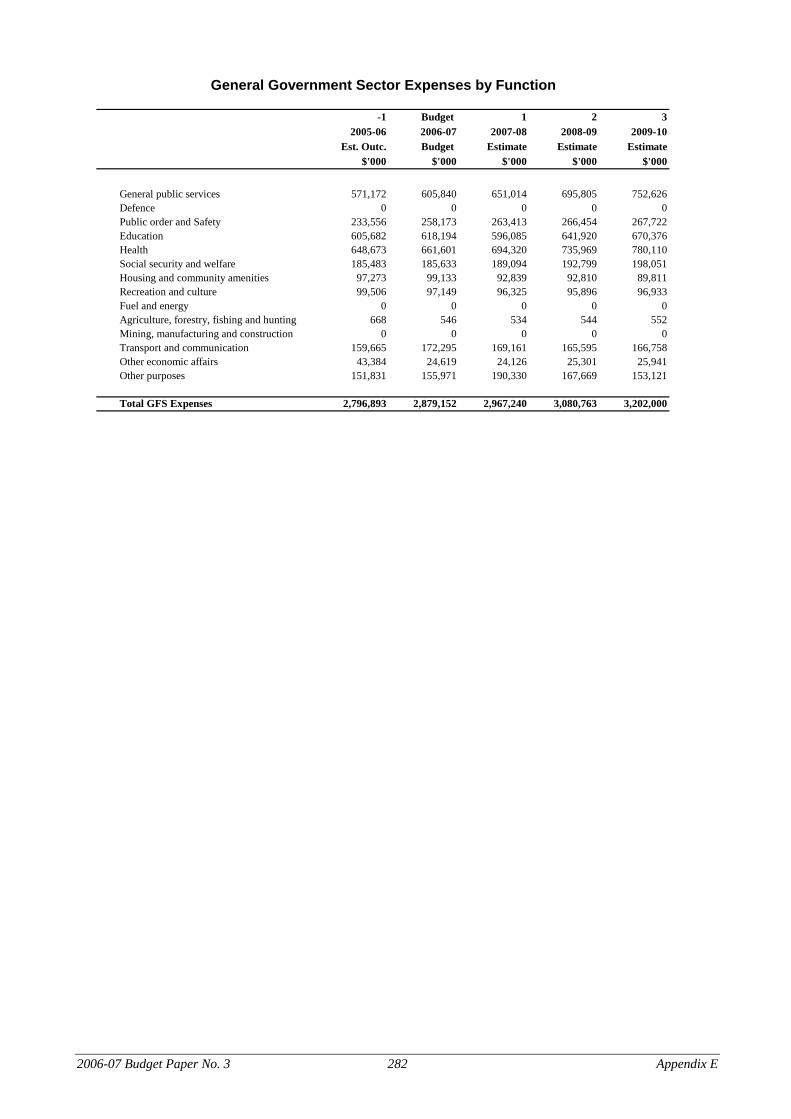
General Government Sector Expenses by Function
-1 Budget 1 2 32005-06 2006-07 2007-08 2008-09 2009-10
Est. Outc. Budget Estimate Estimate Estimate$'000 $'000 $'000 $'000 $'000
General public services 571,172 605,840 651,014 695,805 752,626Defence 0 0 0 0 0Public order and Safety 233,556 258,173 263,413 266,454 267,722Education 605,682 618,194 596,085 641,920 670,376Health 648,673 661,601 694,320 735,969 780,110Social security and welfare 185,483 185,633 189,094 192,799 198,051Housing and community amenities 97,273 99,133 92,839 92,810 89,811Recreation and culture 99,506 97,149 96,325 95,896 96,933Fuel and energy 0 0 0 0 0Agriculture, forestry, fishing and hunting 668 546 534 544 552Mining, manufacturing and construction 0 0 0 0 0Transport and communication 159,665 172,295 169,161 165,595 166,758Other economic affairs 43,384 24,619 24,126 25,301 25,941Other purposes 151,831 155,971 190,330 167,669 153,121
Total GFS Expenses 2,796,893 2,879,152 2,967,240 3,080,763 3,202,000
2006-07 Budget Paper No. 3 282 Appendix E
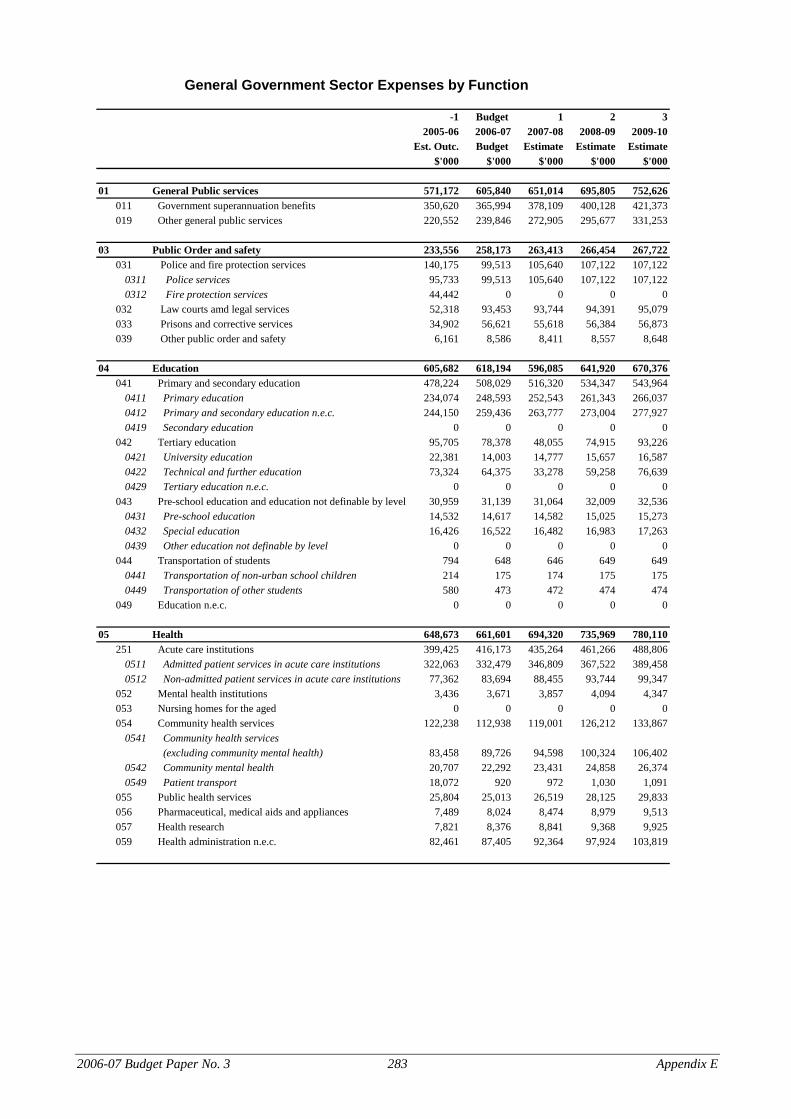
General Government Sector Expenses by Function
-1 Budget 1 2 32005-06 2006-07 2007-08 2008-09 2009-10
Est. Outc. Budget Estimate Estimate Estimate$'000 $'000 $'000 $'000 $'000
01 General Public services 571,172 605,840 651,014 695,805 752,626011 Government superannuation benefits 350,620 365,994 378,109 400,128 421,373019 Other general public services 220,552 239,846 272,905 295,677 331,253
03 Public Order and safety 233,556 258,173 263,413 266,454 267,722031 Police and fire protection services 140,175 99,513 105,640 107,122 107,122
0311 Police services 95,733 99,513 105,640 107,122 107,1220312 Fire protection services 44,442 0 0 0 0
032 Law courts amd legal services 52,318 93,453 93,744 94,391 95,079033 Prisons and corrective services 34,902 56,621 55,618 56,384 56,873039 Other public order and safety 6,161 8,586 8,411 8,557 8,648
04 Education 605,682 618,194 596,085 641,920 670,376041 Primary and secondary education 478,224 508,029 516,320 534,347 543,964
0411 Primary education 234,074 248,593 252,543 261,343 266,0370412 Primary and secondary education n.e.c. 244,150 259,436 263,777 273,004 277,9270419 Secondary education 0 0 0 0 0
042 Tertiary education 95,705 78,378 48,055 74,915 93,2260421 University education 22,381 14,003 14,777 15,657 16,5870422 Technical and further education 73,324 64,375 33,278 59,258 76,6390429 Tertiary education n.e.c. 0 0 0 0 0
043 Pre-school education and education not definable by level 30,959 31,139 31,064 32,009 32,5360431 Pre-school education 14,532 14,617 14,582 15,025 15,2730432 Special education 16,426 16,522 16,482 16,983 17,2630439 Other education not definable by level 0 0 0 0 0
044 Transportation of students 794 648 646 649 6490441 Transportation of non-urban school children 214 175 174 175 1750449 Transportation of other students 580 473 472 474 474
049 Education n.e.c. 0 0 0 0 0
05 Health 648,673 661,601 694,320 735,969 780,110251 Acute care institutions 399,425 416,173 435,264 461,266 488,806
0511 Admitted patient services in acute care institutions 322,063 332,479 346,809 367,522 389,4580512 Non-admitted patient services in acute care institutions 77,362 83,694 88,455 93,744 99,347
052 Mental health institutions 3,436 3,671 3,857 4,094 4,347053 Nursing homes for the aged 0 0 0 0 0054 Community health services 122,238 112,938 119,001 126,212 133,867
0541 Community health services (excluding community mental health) 83,458 89,726 94,598 100,324 106,402
0542 Community mental health 20,707 22,292 23,431 24,858 26,3740549 Patient transport 18,072 920 972 1,030 1,091
055 Public health services 25,804 25,013 26,519 28,125 29,833056 Pharmaceutical, medical aids and appliances 7,489 8,024 8,474 8,979 9,513057 Health research 7,821 8,376 8,841 9,368 9,925059 Health administration n.e.c. 82,461 87,405 92,364 97,924 103,819
2006-07 Budget Paper No. 3 283 Appendix E

General Government Sector Expenses by Function
-1 Budget 1 2 32005-06 2006-07 2007-08 2008-09 2009-10
Est. Outc. Budget Estimate Estimate Estimate$'000 $'000 $'000 $'000 $'000
06 Social Security 185,483 185,633 189,094 192,799 198,051061 Social Security 0 0 0 0 0062 Welfare services 177,270 185,633 189,094 192,799 198,051
0621 Family and children services 75,888 30,827 31,629 32,668 33,6120622 Welfare services for the aged 21,014 22,750 23,871 25,050 26,2950623 Welfare services for people with a disability 55,455 90,155 90,893 90,116 92,2190629 Wellfare services n.e.c. 24,914 41,901 42,702 44,965 45,925
069 Social security and welfare n.e.c. 8,213 0 0 0 0
07 Housing and Community Amenities 97,273 99,133 92,839 92,810 89,811071 Housing and community development 69,288 81,465 75,318 75,227 71,990
0711 Housing 37,109 42,732 41,470 41,245 37,7330712 Community development 32,179 38,733 33,848 33,982 34,257
072 Water supply 1,063 84 80 82 83073 Sanitation and protection of the environment 23,502 13,565 13,377 13,404 13,571079 Other community amenities 3,421 4,019 4,063 4,098 4,168
08 Recreation amd Culture 99,506 97,149 96,325 95,896 96,933081 Recreation facilities and services 69,967 60,404 59,923 59,101 59,844
0811 National parks and wildlife 19,660 10,686 10,088 9,092 9,1360819 Recreation facilities and services n.e.c. 50,307 49,719 49,835 50,009 50,707
082 Cultural facilities and services 26,591 22,061 21,779 21,983 22,327083 Broadcasting and film production 0 0 0 0 0089 Recreation and culture n.e.c. 2,949 14,683 14,623 14,811 14,763
09 Fuel and Energy 0 0 0 0 0091 Fuel affairs and services 0 0 0 0 0
0919 Coal/Petroleum/Nuclear affairs/Fuel affairs and services n.e.c. 0 0 0 0 0
0911 Gas 0 0 0 0 0092 Electricity and other energy 0 0 0 0 0
0921 Electricity 0 0 0 0 00929 Other energy 0 0 0 0 0
099 Fuel and energy n.e.c. 0 0 0 0 0
10 Agriculture, Forestry, Fishing and Hunting 668 546 534 544 552101 Agriculture 212 97 79 83 83102 Forestry, Fishing and Hunting 456 449 455 461 468
2006-07 Budget Paper No. 3 284 Appendix E
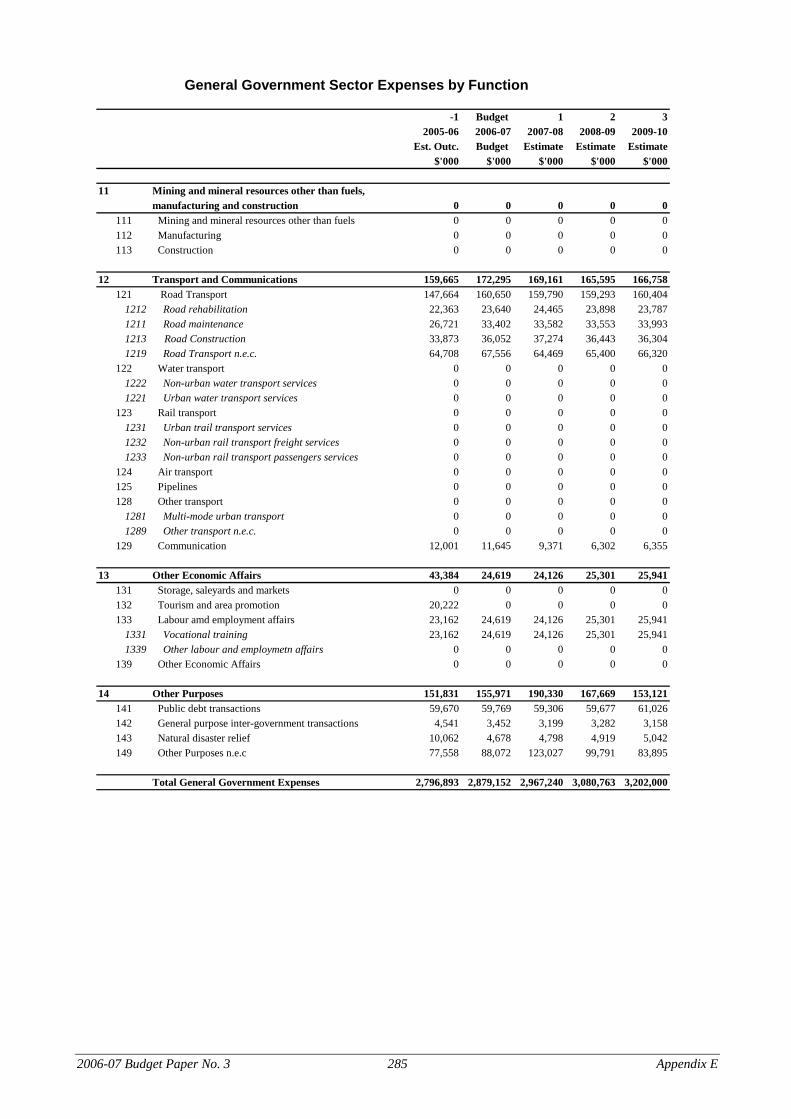
General Government Sector Expenses by Function
-1 Budget 1 2 32005-06 2006-07 2007-08 2008-09 2009-10
Est. Outc. Budget Estimate Estimate Estimate$'000 $'000 $'000 $'000 $'000
11 Mining and mineral resources other than fuels,manufacturing and construction 0 0 0 0 0
111 Mining and mineral resources other than fuels 0 0 0 0 0112 Manufacturing 0 0 0 0 0113 Construction 0 0 0 0 0
12 Transport and Communications 159,665 172,295 169,161 165,595 166,758121 Road Transport 147,664 160,650 159,790 159,293 160,404
1212 Road rehabilitation 22,363 23,640 24,465 23,898 23,7871211 Road maintenance 26,721 33,402 33,582 33,553 33,9931213 Road Construction 33,873 36,052 37,274 36,443 36,3041219 Road Transport n.e.c. 64,708 67,556 64,469 65,400 66,320
122 Water transport 0 0 0 0 01222 Non-urban water transport services 0 0 0 0 01221 Urban water transport services 0 0 0 0 0
123 Rail transport 0 0 0 0 01231 Urban trail transport services 0 0 0 0 01232 Non-urban rail transport freight services 0 0 0 0 01233 Non-urban rail transport passengers services 0 0 0 0 0
124 Air transport 0 0 0 0 0125 Pipelines 0 0 0 0 0128 Other transport 0 0 0 0 0
1281 Multi-mode urban transport 0 0 0 0 01289 Other transport n.e.c. 0 0 0 0 0
129 Communication 12,001 11,645 9,371 6,302 6,355
13 Other Economic Affairs 43,384 24,619 24,126 25,301 25,941131 Storage, saleyards and markets 0 0 0 0 0132 Tourism and area promotion 20,222 0 0 0 0133 Labour amd employment affairs 23,162 24,619 24,126 25,301 25,941
1331 Vocational training 23,162 24,619 24,126 25,301 25,9411339 Other labour and employmetn affairs 0 0 0 0 0
139 Other Economic Affairs 0 0 0 0 0
14 Other Purposes 151,831 155,971 190,330 167,669 153,121141 Public debt transactions 59,670 59,769 59,306 59,677 61,026142 General purpose inter-government transactions 4,541 3,452 3,199 3,282 3,158143 Natural disaster relief 10,062 4,678 4,798 4,919 5,042149 Other Purposes n.e.c 77,558 88,072 123,027 99,791 83,895
Total General Government Expenses 2,796,893 2,879,152 2,967,240 3,080,763 3,202,000
2006-07 Budget Paper No. 3 285 Appendix E

Commonwealth General Government Sector Taxes
-1 Budget 1 2 32005-06 2006-07 2007-08 2008-09 2009-10
Est. Outc. Budget Estimate Estimate Estimate$'000 $'000 $'000 $'000 $'000
Taxes on income, profits and capital gains 0 0 0 0 0Income and capital gains levied on individuals 0 0 0 0 0Income and capital gains levied on enterprises 0 0 0 0 0Income taxes levied on non-residents 0 0 0 0 0Total 0 0 0 0 0
Taxes on employers payroll and labour force 201,760 220,025 2,238,188 260,421 281,471Taxes on property 389,635 394,341 418,353 443,718 466,511Taxes on provision of goods and services Sales tax 0 0 0 0 0
Excises and levies 0 0 0 0 0Taxes on international trade 0 0 0 0 0Total 0 0 0 0 0
Taxes on use of goods and performance of activities 88,874 111,877 115,742 119,770 123,942
Total GFS Taxation Revenue 680,269 726,243 2,772,283 823,909 871,924
2006-07 Budget Paper No. 3 286 Appendix E

State and Territory General Government Sector Taxes
-1 Budget 1 2 32005-06 2006-07 2007-08 2008-09 2009-10
Est. Outc. Budget Estimate Estimate Estimate$'000 $'000 $'000 $'000 $'000
Taxes on employers payroll and labour force 201,760 220,025 238,188 260,421 281,471Taxes on property
Land taxes 58,098 63,776 65,966 68,211 70,512Stamp duties on financial and capital transactions 216 822 1,427 1,433 1,438financial institutions and capital transactions 2,814 2,986 3,168 3,362 3,567Financial institutions transaction taxes 3,105 3,209 0 0 0Other 325,402 323,548 347,792 370,712 390,994Total 389,635 394,341 418,353 443,718 466,511
Taxes on provision of goods and servicesExcises and levies 0 0 0 0 0Taxes on gambling 47,689 46,552 51,567 53,735 55,631Taxes on insurance 41,005 44,705 46,380 48,117 49,921Total 88,694 91,257 97,947 101,852 105,552
Taxes on use of goods and performance of activitiesMotor vehicles taxes 88,874 91,877 95,002 98,263 101,639Franchise taxes 0 0 0 0 0Other 0 20,000 20,740 21,507 22,303Total 88,874 111,877 115,742 119,770 123,942
Total GFS Taxation Revenue 768,963 817,500 870,230 925,761 977,476
2006-07 Budget Paper No. 3 287 Appendix E

Loan Council Allocation
The ACT’s Loan Council Allocation (LCA) agreed to at the 2006 Loan Council meeting was $159 million, based on an accrual Government Finance Statistics deficit of $163 million.
The nomination established a tolerance limit for the Budget-time estimate of between $103 million and $215 million (+/- 2 per cent of total public sector receipts).
The Budget-time estimate has been revised to $191 million, which his within the LCA nomination tolerance limit.
Loan Council Nomination
Budget-time Estimate
$m $m
General government sector deficit/(surplus) 179 159PNFC sector cash deficit/(surplus) -16 36Non-financial public sector cash deficit/(surplus) (a) 163 195Net cash flows from investments in financial assets for policy purposes (b) -2 -2Memorandum items (c) -6 -6
Loan Council Allocation 159 191
Tolerance Limit
Nomination – 2 per cent of public sector receipts ($2.685 billion) +/- $56 million.
Budget – 2 per cent of public sector receipts ($2.870 billion) +/- $57 million.
2006-07 Budget Paper No. 3 288 Appendix E