goulet bbp validation
TRANSCRIPT
BBP VALIDATION FOR PSA: FROM PARAMETERS TO GAUNTLET Christine Goulet

Large collaborative validation of simulations using the SCEC BroadBand Platform Driven by need of seismic hazard projects to supplement recorded datasets § South-Western U.S. utilities (SWUS) § PEER NGA-East project (new CENA hazard model) § PEER NGA-West projects
Quantitative validation for forward simulations in engineering problems § Short term goal: supplement recorded data for development of
ground motion models (GMMs=GMPEs) and hazard analyses § Long term goal: develop acceptance of simulations for
engineering design
Key focus: 5% damped elastic “average” PSA (f=0.1-100 Hz/ T=0.01-10 s)
2 SCEC Annual Meeting 2015

Validation Gauntlet Development
§ 1. Define application and key ground-motion parameters § 2. Implement validation parameters on appropriate
platform, generate plots and ASCII output § 3. Form an evaluation panel; evaluate the ground-motion
parameters § 4. Develop the gauntlet (evaluation panel activity,
performed outside the platform) § 5. Implement the gauntlet on the platform so it provides
fast feedback to model developers
3 SCEC Annual Meeting 2015

Key elements for (empirical) ground-motion model (GMM) development
§ Times series and frequency content (FAS) are “reasonable” § Visual inspection
PSA evaluation – using 50 source realizations § PART A: validation against recorded events
§ Evaluation of bias [ln(data)/ln(model)] using various approaches § Check that attenuation rate is consistent with observations § 13 events completed, ~40 stations/event
§ PART B: validation against existing GMMs in ranges where they are well constrained by data § PSA fits current state of knowledge in a broad sense, within a wide
acceptance range
SCEC Annual Meeting 2015 4

Evaluation products
§ Qualitative evaluation of velocity time series and Husid plot based on Arias intensity
Part A (comparison with recordings)
SIMULATED Vs30 = 863 m/s
RECORDED Vs30 = 822 m/s
5 SCEC Annual Meeting 2015

Evaluation products
6
Part A (comparison with recordings)
SCEC Annual Meeting 2015

Evaluation products § Bias as goodness-of-fit
measure for PSA and PGA § Average GOF with T for all
stations within an event
Period (s)
7
Part A (comparison with recordings)
SCEC Annual Meeting 2015

Evaluation products § Goodness-of-fit
measures for PSa and PGA § Average GOF with T for all
stations within an event § Average GOF for all
realizations (all stations)
Period (s)
8
Part A (comparison with recordings)
SCEC Annual Meeting 2015

Evaluation products § Goodness-of-fit
measures for PSa and PGA § Average GOF with T for all
stations within an event § Average GOF for all
realizations (all stations) § Average GOF with distance
(all realizations)
9
Part A (comparison with recordings)
SCEC Annual Meeting 2015

§ Goodness-of-fit measures for PSa and PGA § Average GOF with T for all
stations within an event § Average GOF for all
realizations (all stations) § Average GOF with distance
(all realizations) § Map of GOF (all
realizations)
Evaluation products
10
Part A (comparison with recordings)
SCEC Annual Meeting 2015

§ GOF plots also developed for § NGA-West1 (2008) GMPEs § SMSIM
Allows to see trends/event terms
Evaluation products
11
Part A (comparison with recordings)
SCEC Annual Meeting 2015

Evaluation – Part A
1. Comparison of PSA GOF for each event Mean bias Mean absolute bias
§ Failure threshold is ln(2)=0.69 § Thresholds of 0.5 and 0.35 were considered as passing criteria
Combined metric: mean and mean absolute bias § Used alone § Used with GMPEs
3. Evaluation of attenuation bias
§ Distance dependence slope of zero within 95% confidence interval
Evaluation Part A
12 SCEC Annual Meeting 2015

70-2
00 k
m
Evaluation Part A
SCEC Annual Meeting 2015 13

14
0.01 to 0.1 s 0.1 to 1 s 1 to 3 s More than3 s
0-5
km
5-20
km
20
-70
km
70-2
00 k
m
SCEC Annual Meeting 2015

Combined Metric & Comparison with GMPEs
CGOF = 12ln data
model( ) +12ln data
model( )
Evaluation Part A
15 SCEC Annual Meeting 2015

CGOF
16
0-5
km
5-20
km
20
-70
km
70-2
00 k
m
SCEC Annual Meeting 2015

Combined Metric & Comparison with GMPEs
CGOF = 12ln data
model( ) +12ln data
model( )
Evaluation Part A
17
CGOFNormalized =CGOFsims CGOFGMPE
SCEC Annual Meeting 2015

CGOFNormalized
18
0-5
km
5-20
km
20
-70
km
70-2
00 k
m
SCEC Annual Meeting 2015

ln SaobsSasyn
!
"#
$
%&= a+ b ⋅ ln R( )
Fit a line through distance binned GOF values
Determine whether slope b=0 lies within 95% confidence interval
Attenuation Bias Evaluation Part A
19 SCEC Annual Meeting 2015
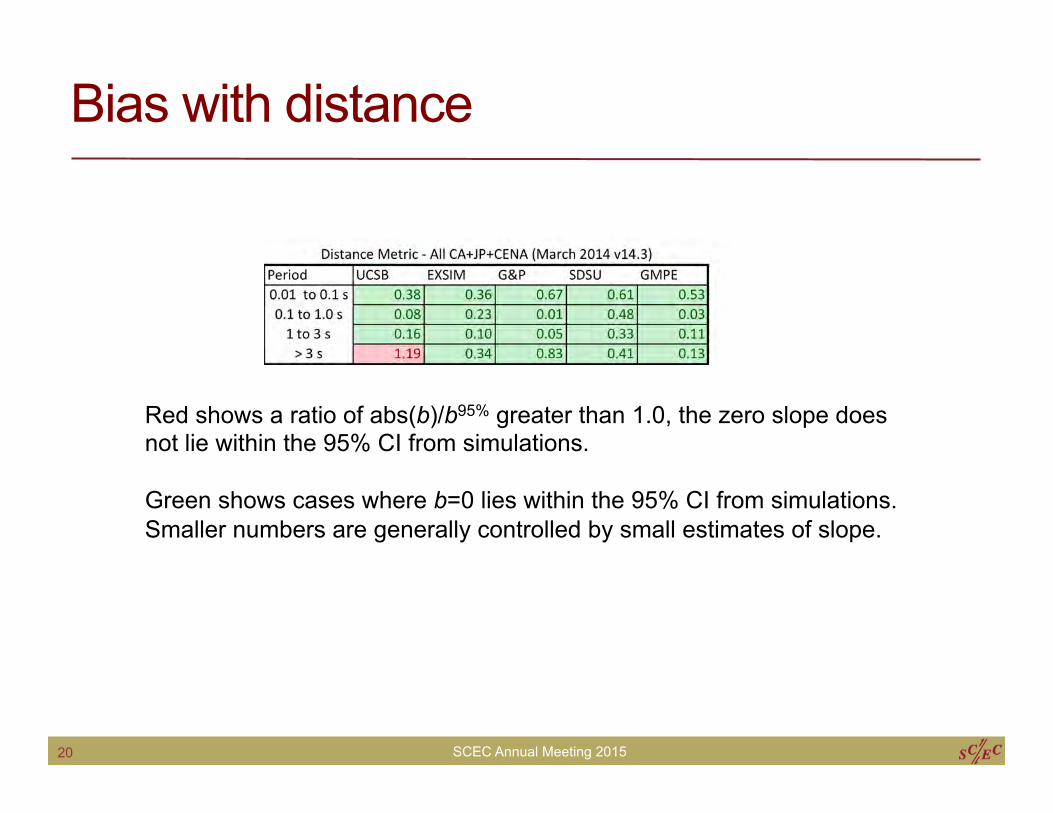
Bias with distance
Red shows a ratio of abs(b)/b95% greater than 1.0, the zero slope does not lie within the 95% CI from simulations. Green shows cases where b=0 lies within the 95% CI from simulations. Smaller numbers are generally controlled by small estimates of slope.
SCEC Annual Meeting 2015 20

Part B – Design and Evaluation criteria
21
§ Scenarios from NGA-West1&2 well constrained by data at 20 and 50 km Rrup § M5.5 REV § M6.2 SS § M6.6 SS & REV
§ 50 realizations of the source, WITH randomized hypocenter location for each
§ Simulations for two velocity models: NorCal and SoCal
Part B (comparison with GMPEs)
SCEC Annual Meeting 2015

Validation Gauntlet Development
§ 1. Define application and key ground-motion parameters § 2. Implement validation parameters on appropriate
platform, generate plots and ASCII output § 3. Form an evaluation panel; evaluate the ground-motion
parameters § 4. Develop the gauntlet (evaluation panel activity,
performed outside the platform) § 5. Implement the gauntlet on the platform so it provides
fast feedback to model developers
22 SCEC Annual Meeting 2015

Thank you!
SCEC Annual Meeting 2015 23

Summary of Simulated Events
Tottori
Niigata
Chino Hills
Landers
Loma Prieta
Northridge
Alum Rock
* Part B: 4 scenarios
Summary - Parts A and B
24
Saguenay Mineral
Riviere-du-Loup
Whittier
North Palm Springs
SCEC Annual Meeting 2015

Evaluation
§ Review panel § Douglas Dreger (Chair), UC Berkeley § Gregory Beroza, Stanford § Steven Day, SDSU § Christine Goulet, UC Berkeley § Thomas Jordan, USC § Paul Spudich, USGS § Jonathan Stewart, UCLA
§ Input for review § Modeler’s documentation and self-assessment § BBP results (parts A and B)
§ Part A: criteria based on binned GOF according to M (event), R, T § Part B: simple pass-fail
Evaluation
25 SCEC Annual Meeting 2015