google visualization
DESCRIPTION
Google VisualizationTRANSCRIPT

Using the Google Visualisation API with R:
googleVis-0.2.15 Package Vignette
Markus Gesmann∗, Diego de Castillo†
Contact: [email protected]
March 4, 2012
Abstract
The googleVis package provides an interface between R and the Google
Visualisation API. The Google Visualisation API offers interactive charts which
can be embedded into web pages. The best known of these charts is probably
the Motion Chart, popularised by Hans Rosling in his TED talks.
The functions of the googleVis package allow the user to visualise data
stored in R data frames with the Google Visualisation API without uploading
the data to Google. The output of a googleVis function is html code that
contains the data and references to JavaScript functions hosted by Google.
googleVis makes use of the internal R HTTP server to display the output
locally. A browser with Flash and Internet connection is required.
∗[email protected]†[email protected]
1

Contents
1 Introduction 4
1.1 Motivation . . . . . . . . . . . . . . . . . . . . . . . . . . . . . . . 4
1.2 Google Visualisation API . . . . . . . . . . . . . . . . . . . . . . . 4
2 The googleVis package 7
2.1 Installation . . . . . . . . . . . . . . . . . . . . . . . . . . . . . . . 7
2.2 Using the googleVis package . . . . . . . . . . . . . . . . . . . . 8
2.3 Motion Chart Example . . . . . . . . . . . . . . . . . . . . . . . . 9
2.4 Displaying gvis objects locally . . . . . . . . . . . . . . . . . . . . 15
2.5 Combining charts with gvisMerge . . . . . . . . . . . . . . . . . . 16
2.6 Setting options . . . . . . . . . . . . . . . . . . . . . . . . . . . . 17
2.6.1 Chart Editor . . . . . . . . . . . . . . . . . . . . . . . . . . 18
2.6.2 Dealing with apostrophes in column names . . . . . . . . . 19
3 Embedding googleVis in web sites 20
3.1 Integrating gvis objects in existing sites . . . . . . . . . . . . . . . 20
3.2 Using googleVis output with WordPress . . . . . . . . . . . . . . 20
3.3 Using googleVis output with Google Sites, Blogger, etc. . . . . . . 21
3.4 Embedding googleVis in web sites dynamically . . . . . . . . . . . 23
3.4.1 Using googleVis with R.rsp . . . . . . . . . . . . . . . . 23
3.4.2 Using googleVis with RApache and brew . . . . . . . . . 23
4 Using googleVis in presentations 25
5 Beyond R 26
5.1 Registering to catch events . . . . . . . . . . . . . . . . . . . . . . 26
6 Contact 27
6.1 Collaboration . . . . . . . . . . . . . . . . . . . . . . . . . . . . . 27
6.2 Citation . . . . . . . . . . . . . . . . . . . . . . . . . . . . . . . . 27
6.3 Training and consultancy . . . . . . . . . . . . . . . . . . . . . . . 28
2

References 29
3
1 Introduction
1.1 Motivation
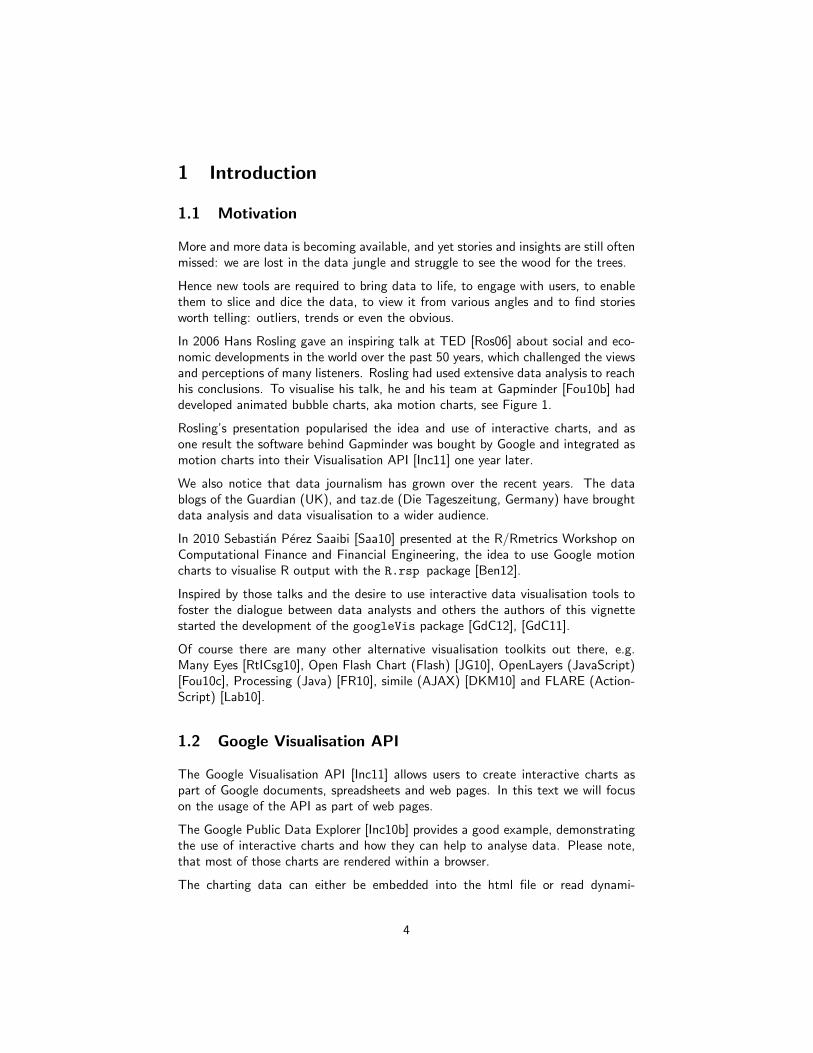
More and more data is becoming available, and yet stories and insights are still oftenmissed: we are lost in the data jungle and struggle to see the wood for the trees.
Hence new tools are required to bring data to life, to engage with users, to enablethem to slice and dice the data, to view it from various angles and to find storiesworth telling: outliers, trends or even the obvious.
In 2006 Hans Rosling gave an inspiring talk at TED [Ros06] about social and eco-nomic developments in the world over the past 50 years, which challenged the viewsand perceptions of many listeners. Rosling had used extensive data analysis to reachhis conclusions. To visualise his talk, he and his team at Gapminder [Fou10b] haddeveloped animated bubble charts, aka motion charts, see Figure 1.
Rosling’s presentation popularised the idea and use of interactive charts, and asone result the software behind Gapminder was bought by Google and integrated asmotion charts into their Visualisation API [Inc11] one year later.
We also notice that data journalism has grown over the recent years. The datablogs of the Guardian (UK), and taz.de (Die Tageszeitung, Germany) have broughtdata analysis and data visualisation to a wider audience.
In 2010 Sebastian Perez Saaibi [Saa10] presented at the R/Rmetrics Workshop onComputational Finance and Financial Engineering, the idea to use Google motioncharts to visualise R output with the R.rsp package [Ben12].
Inspired by those talks and the desire to use interactive data visualisation tools tofoster the dialogue between data analysts and others the authors of this vignettestarted the development of the googleVis package [GdC12], [GdC11].
Of course there are many other alternative visualisation toolkits out there, e.g.Many Eyes [RtICsg10], Open Flash Chart (Flash) [JG10], OpenLayers (JavaScript)[Fou10c], Processing (Java) [FR10], simile (AJAX) [DKM10] and FLARE (Action-Script) [Lab10].
1.2 Google Visualisation API
The Google Visualisation API [Inc11] allows users to create interactive charts aspart of Google documents, spreadsheets and web pages. In this text we will focuson the usage of the API as part of web pages.
The Google Public Data Explorer [Inc10b] provides a good example, demonstratingthe use of interactive charts and how they can help to analyse data. Please note,that most of those charts are rendered within a browser.
The charting data can either be embedded into the html file or read dynami-
4

Y-axisClick here to select indicators for the y-axis.
Lin / Log scaleX- and y-axis scales can be linear or logarithmic. A log scale can make it easier to see trends.
Play / StopClick Play/Stop to control the animation. (How the graph changes over time.)
TimeClick and drag to change year.
Speed of animationDrag to change the speed of the animation.
X-axisClick here to select indicators for the x-axis. You can also choose to display time on this axis.
Chart typeChange between bubble, bar and line chart.
ColourClick to choose another indicator for colour.
Select variablesClick boxes to select specific variables. (You can also click the bubbles.)
TrailsClick Trails to follow a selected country while the animation plays.
Size indicatorSelect the indicator which represents the size of the bubble
To zoom in:1. Put your mouse in the chart area.2. Hold down the left mouse button and draw a rectangle over the items that you want to zoom in.3. Release the left mouse button.4. In the menu that pops up, select 'Zoom in'.
To zoom out:Click the 'Zoom out' link above the zoom thumbnail in the right panel.
SettingsChange opacity of non selected items and further advanced settings
Adapted from www.gapminder.org, which used an original idea by wwww.juicygeography.co.uk
Figure 1: Overview of a Google Motion Chart. Screenshot of the output ofplot(gvisMotionChart(Fruits, idvar=’Fruit’, timevar=’Year’))
cally. The key to the Google Visualisation API is that the data is structured ina DataTable [Inc10c], and this is where the googleVis package helps, as it usesthe functionality of the RJSONIO package [Lan12] to transform R data frames intoJSON [JSO06] objects as the basis for a DataTable.
As an example we shall look at the html-code of a motion chart from Google’svisualisation gallery [Inc10a], which generates output similar to Figure 1:
1 <html>
2 <head>
3 <script type="text/javascript"
4 src="http://www.google.com/jsapi">
5 </script>
6 <script type="text/javascript">
7 google.load('visualization', '1',
8 {'packages':['motionchart']});
9 google.setOnLoadCallback(drawChart);
10 function drawChart() {
11 var data=new google.visualization.DataTable();
5
12 data.addColumn('string', 'Fruit');
13 data.addColumn('date', 'Date');
14 data.addColumn('number', 'Sales');
15 data.addColumn('number', 'Expenses');
16 data.addColumn('string', 'Location');
17 data.addRows([
18 ['Apples',new Date(1988,0,1),1000,300,'East'],
19 ['Oranges',new Date(1988,0,1),1150,200,'West'],
20 ['Bananas',new Date(1988,0,1),300,250,'West'],
21 ['Apples',new Date(1989,6,1),1200,400,'East'],
22 ['Oranges',new Date(1989,6,1),750,150,'West'],
23 ['Bananas',new Date(1989,6,1),788,617,'West']
24 ]);
25 var chart=new google.visualization.MotionChart(
26 document.getElementById('chart_div'));
27 chart.draw(data, {width: 600, height:300});
28 }
29 </script>
30 </head>
31 <body>
32 <div id="chart_div"
33 style="width:600px; height:300px;">
34 </div>
35 </body>
36 </html>
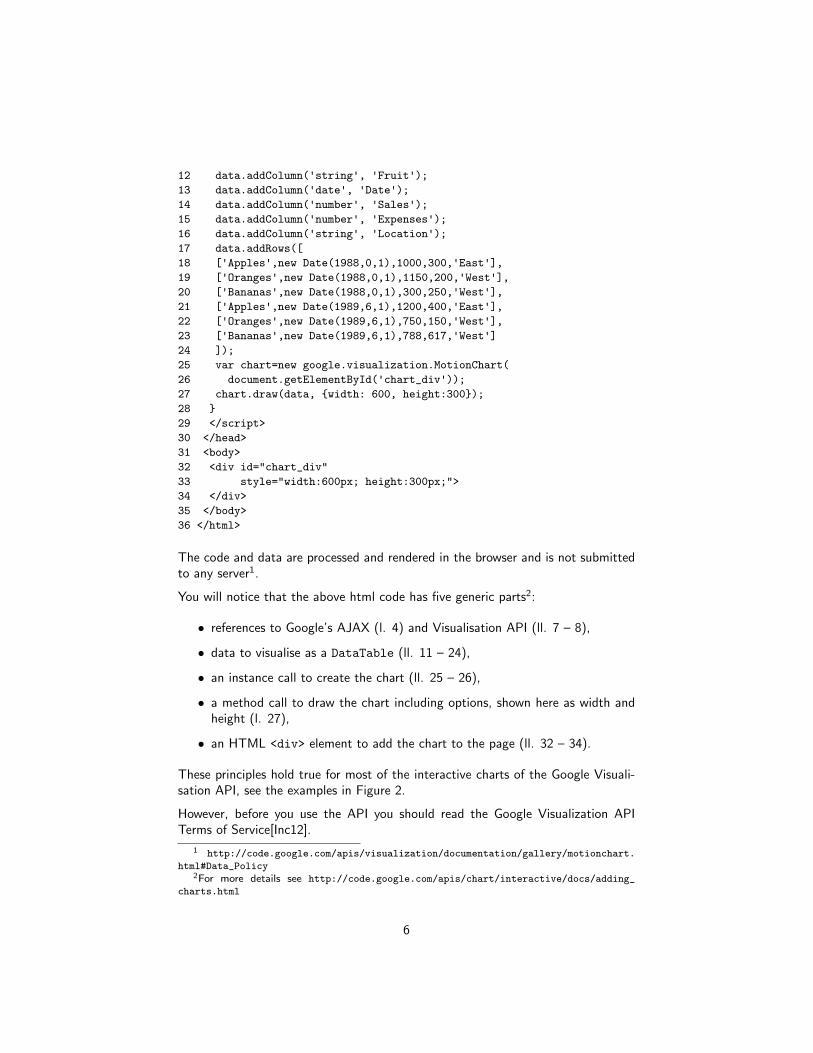
The code and data are processed and rendered in the browser and is not submittedto any server1.
You will notice that the above html code has five generic parts2:
• references to Google’s AJAX (l. 4) and Visualisation API (ll. 7 – 8),
• data to visualise as a DataTable (ll. 11 – 24),
• an instance call to create the chart (ll. 25 – 26),
• a method call to draw the chart including options, shown here as width andheight (l. 27),
• an HTML <div> element to add the chart to the page (ll. 32 – 34).
These principles hold true for most of the interactive charts of the Google Visuali-sation API, see the examples in Figure 2.
However, before you use the API you should read the Google Visualization APITerms of Service[Inc12].
1 http://code.google.com/apis/visualization/documentation/gallery/motionchart.
html#Data_Policy2For more details see http://code.google.com/apis/chart/interactive/docs/adding_
charts.html
6

2 The googleVis package
The googleVis package provides an interface between R and the Google Visuali-sation API. The functions of the package allow the user to visualise data stored inR data frames with the Google Visualisation API.
Version (0.2.15) of the package provides interfaces to Motion Charts, AnnotatedTime Lines, Maps, Geo Maps, Geo Charts, Intensity Maps, Tables, Gauges, TreeMaps, further Line, Bar, Bubble, Column, Area, Stepped Area, Combo, Scatter,Candlestick, Pie and Org Charts; see Figure 2 for some examples. All availablecharts types are listed on the project site3.
The output of a googleVis function is html code that contains the data andreferences to JavaScript functions hosted by Google. A browser with an Internetconnection is required to view the output, and for Motion Charts, Geo Maps andAnnotated Time Lines also Flash. The actual chart is rendered in the browser.
2.1 Installation
We can install googleVis in the usual way from CRAN, e.g.:
R> install.packages('googleVis')
The installation was successful if the command library(googleVis) gives youthe following message:
R> library(googleVis)
Welcome to googleVis version 0.2.15
Please read the Google API Terms of Use
before you use the package:
http://code.google.com/apis/terms/index.html
Type ?googleVis to access the overall documentation and
vignette('googleVis') for the package vignette.
You can execute a demo of the package via: demo(googleVis)
More information is available on the googleVis project web-site:
http://code.google.com/p/google-motion-charts-with-r/
Contact: <[email protected]>
To suppress the this message use:
suppressPackageStartupMessages(library(googleVis))
3http://code.google.com/p/google-motion-charts-with-r/wiki/GadgetExamples
7
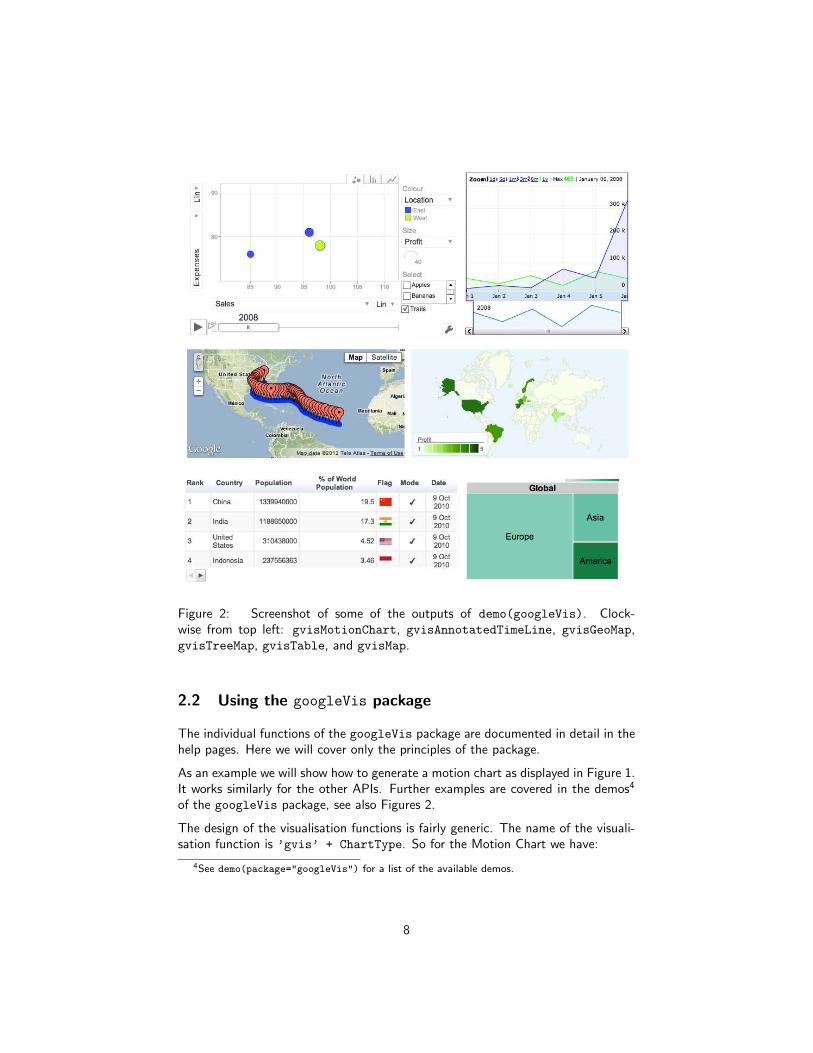
Figure 2: Screenshot of some of the outputs of demo(googleVis). Clock-wise from top left: gvisMotionChart, gvisAnnotatedTimeLine, gvisGeoMap,gvisTreeMap, gvisTable, and gvisMap.
2.2 Using the googleVis package
The individual functions of the googleVis package are documented in detail in thehelp pages. Here we will cover only the principles of the package.
As an example we will show how to generate a motion chart as displayed in Figure 1.It works similarly for the other APIs. Further examples are covered in the demos4
of the googleVis package, see also Figures 2.
The design of the visualisation functions is fairly generic. The name of the visuali-sation function is ’gvis’ + ChartType. So for the Motion Chart we have:
4See demo(package="googleVis") for a list of the available demos.
8
gvisMotionChart(data, idvar='id', timevar='date',
options=list(), chartid)
Here data is the input data.frame and idvar and timevar specify the columnnames of the id variable and time variable for the plot, while display options are setin an optional list, which we discuss in more detail on page 17. The options anddata requirements follow those of the Google Visualisation API and are documentedin the help pages, see
R> help('gvisMotionChart')
Wukpi"vjg"Iqqing"Xkuwcnkucvkqp"CRK"ykvj"T
Vjg"iqqingXku"eqpegrvズ Ejctvu<"ÒixkuÓ"-"EjctvV{rgズ Qwvrwv"qh"iqqingXku"ku"c"nkuv"qh"nkuvズ Urgekhke"rctvu"ecp"dg"gzvtcevgf."g0i0"vjg"fcvc"qt"ejctv
v{rg
jgcfgt
jvon
ejctv
hqqvgt
luJgcfgt
ecrvkqp
luFtcyEjctvluFkurnc{EjctvluEjctvluHqqvgtfkxEjctv
luFcvc
ejctvkf
ixku/qdlgev<
"fcvc"kp"T"""""
ixkuOqvkqpEjctv*fcvc."kfxct.""""vkogxct."qrvkqpu+
Æ"4233"Octmwu"Iguocpp."Fkgiq"fg"Ecuvknnq
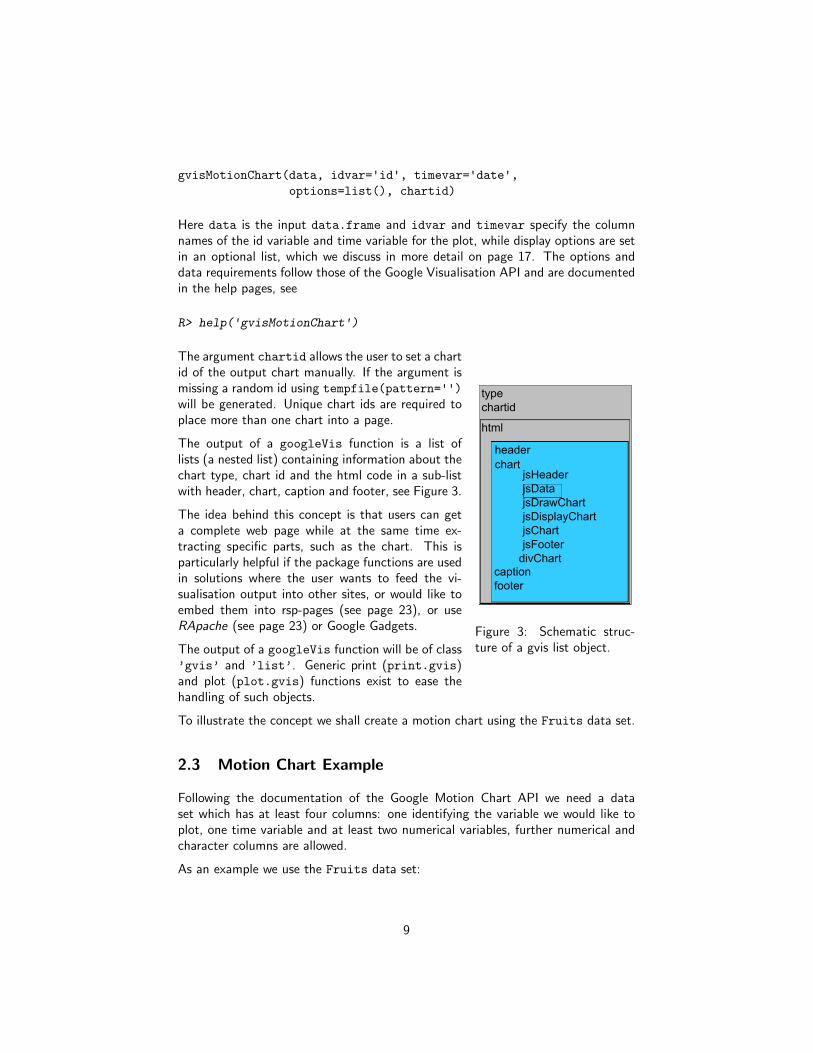
Figure 3: Schematic struc-ture of a gvis list object.
The argument chartid allows the user to set a chartid of the output chart manually. If the argument ismissing a random id using tempfile(pattern='')
will be generated. Unique chart ids are required toplace more than one chart into a page.
The output of a googleVis function is a list oflists (a nested list) containing information about thechart type, chart id and the html code in a sub-listwith header, chart, caption and footer, see Figure 3.
The idea behind this concept is that users can geta complete web page while at the same time ex-tracting specific parts, such as the chart. This isparticularly helpful if the package functions are usedin solutions where the user wants to feed the vi-sualisation output into other sites, or would like toembed them into rsp-pages (see page 23), or useRApache (see page 23) or Google Gadgets.
The output of a googleVis function will be of class’gvis’ and ’list’. Generic print (print.gvis)and plot (plot.gvis) functions exist to ease thehandling of such objects.
To illustrate the concept we shall create a motion chart using the Fruits data set.
2.3 Motion Chart Example
Following the documentation of the Google Motion Chart API we need a dataset which has at least four columns: one identifying the variable we would like toplot, one time variable and at least two numerical variables, further numerical andcharacter columns are allowed.
As an example we use the Fruits data set:
9

R> data(Fruits)
R> Fruits
Fruit Year Location Sales Expenses Profit Date
1 Apples 2008 West 98 78 20 2008-12-31
2 Apples 2009 West 111 79 32 2009-12-31
3 Apples 2010 West 89 76 13 2010-12-31
4 Oranges 2008 East 96 81 15 2008-12-31
5 Bananas 2008 East 85 76 9 2008-12-31
6 Oranges 2009 East 93 80 13 2009-12-31
7 Bananas 2009 East 94 78 16 2009-12-31
8 Oranges 2010 East 98 91 7 2010-12-31
9 Bananas 2010 East 81 71 10 2010-12-31
Here we will use the columns ’Fruit’ and ’Year’ as id and time variable respec-tively. However we could have used ’Date’ instead of ’Year’ as well.
R> M <- gvisMotionChart(Fruits, idvar="Fruit", timevar="Year")
The structural output of gvisMotionChart is a list of lists as described above
R> str(M)
List of 3
$ type : chr "MotionChart"
$ chartid: chr "MotionChartID2dba6a651a62"
$ html :List of 4
..$ header : chr "<!DOCTYPE html PUBLIC \"-//W3C//DTD XHTML 1.0
..$ chart : Named chr [1:7] "<!-- MotionChart generated in R 2.
.. ..- attr(*, "names")= chr [1:7] "jsHeader" "jsData" "jsDrawCh
..$ caption: chr "<div><span>Data: Fruits • Chart ID: <a h
..$ footer : chr "\n<!-- htmlFooter -->\n<span> \nR Under develo
- attr(*, "class")= chr [1:2] "gvis" "list"
The first two items of the list contain information about the chart type used andthe individual chart id:
R> M$type
[1] "MotionChart"
R> M$chartid
[1] "MotionChartID2dba6a651a62"
10
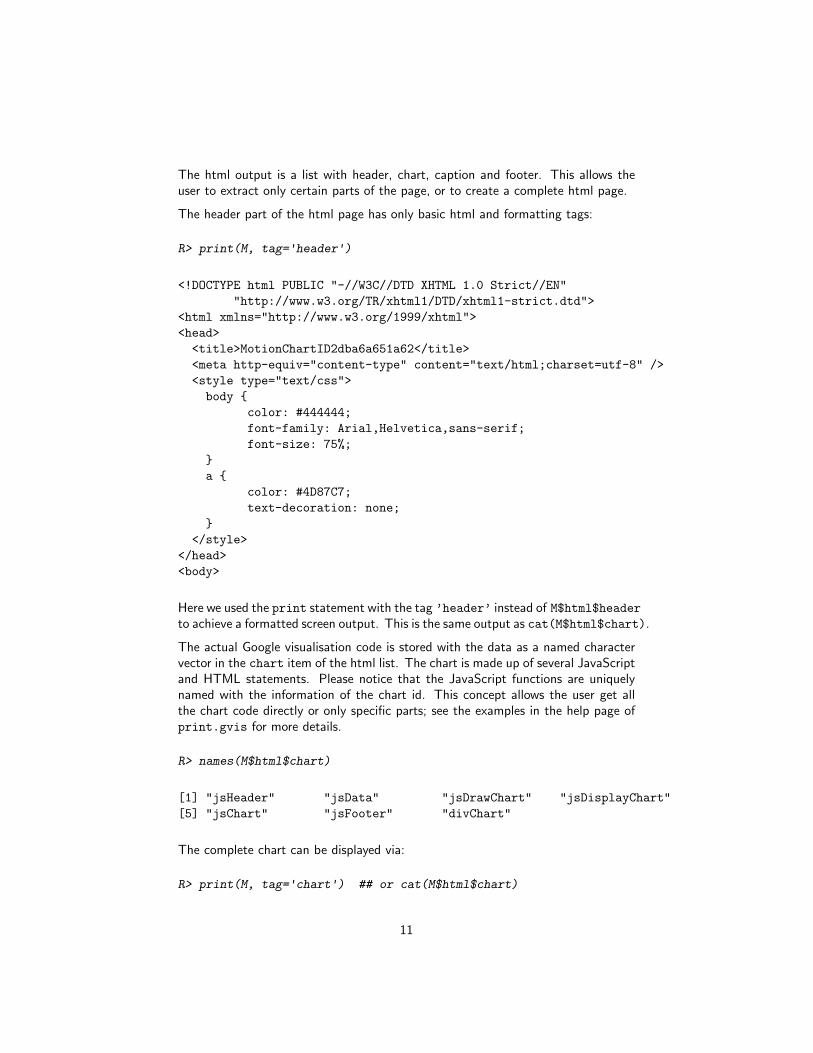
The html output is a list with header, chart, caption and footer. This allows theuser to extract only certain parts of the page, or to create a complete html page.
The header part of the html page has only basic html and formatting tags:
R> print(M, tag='header')
<!DOCTYPE html PUBLIC "-//W3C//DTD XHTML 1.0 Strict//EN"
"http://www.w3.org/TR/xhtml1/DTD/xhtml1-strict.dtd">
<html xmlns="http://www.w3.org/1999/xhtml">
<head>
<title>MotionChartID2dba6a651a62</title>
<meta http-equiv="content-type" content="text/html;charset=utf-8" />
<style type="text/css">
body {
color: #444444;
font-family: Arial,Helvetica,sans-serif;
font-size: 75%;
}
a {
color: #4D87C7;
text-decoration: none;
}
</style>
</head>
<body>
Here we used the print statement with the tag ’header’ instead of M$html$headerto achieve a formatted screen output. This is the same output as cat(M$html$chart).
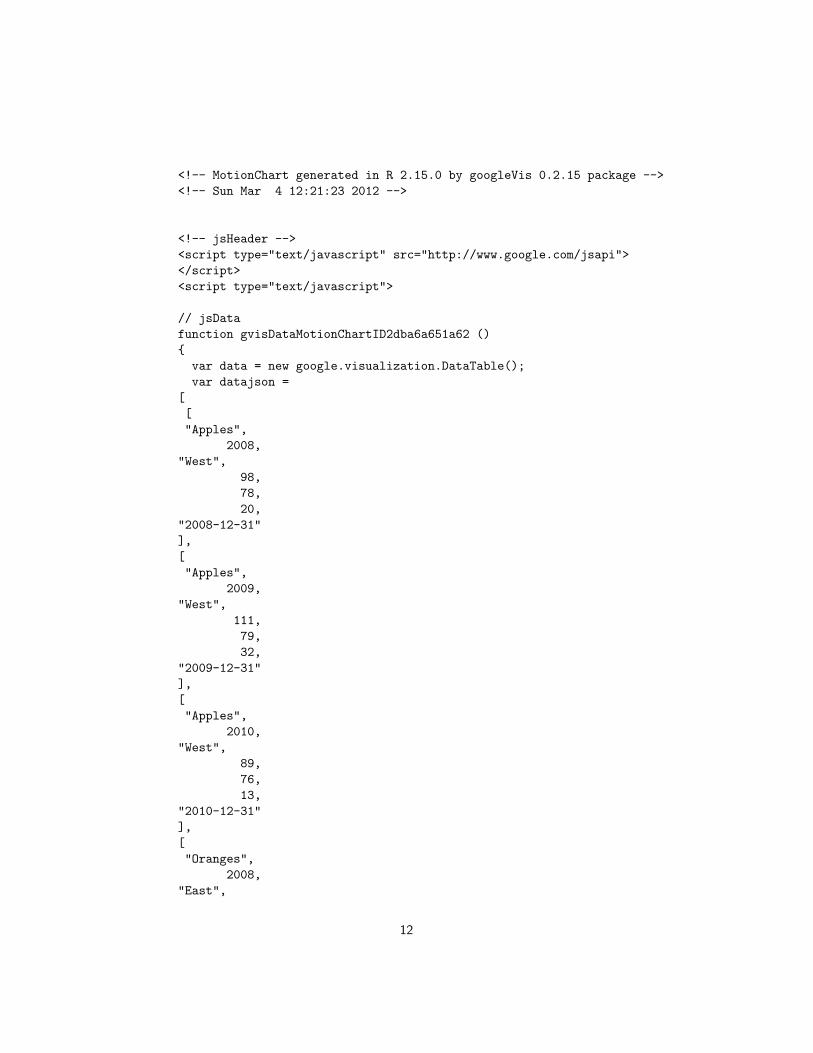
The actual Google visualisation code is stored with the data as a named charactervector in the chart item of the html list. The chart is made up of several JavaScriptand HTML statements. Please notice that the JavaScript functions are uniquelynamed with the information of the chart id. This concept allows the user get allthe chart code directly or only specific parts; see the examples in the help page ofprint.gvis for more details.
R> names(M$html$chart)
[1] "jsHeader" "jsData" "jsDrawChart" "jsDisplayChart"
[5] "jsChart" "jsFooter" "divChart"
The complete chart can be displayed via:
R> print(M, tag='chart') ## or cat(M$html$chart)
11
<!-- MotionChart generated in R 2.15.0 by googleVis 0.2.15 package -->
<!-- Sun Mar 4 12:21:23 2012 -->
<!-- jsHeader -->
<script type="text/javascript" src="http://www.google.com/jsapi">
</script>
<script type="text/javascript">
// jsData
function gvisDataMotionChartID2dba6a651a62 ()
{
var data = new google.visualization.DataTable();
var datajson =
[
[
"Apples",
2008,
"West",
98,
78,
20,
"2008-12-31"
],
[
"Apples",
2009,
"West",
111,
79,
32,
"2009-12-31"
],
[
"Apples",
2010,
"West",
89,
76,
13,
"2010-12-31"
],
[
"Oranges",
2008,
"East",
12

96,
81,
15,
"2008-12-31"
],
[
"Bananas",
2008,
"East",
85,
76,
9,
"2008-12-31"
],
[
"Oranges",
2009,
"East",
93,
80,
13,
"2009-12-31"
],
[
"Bananas",
2009,
"East",
94,
78,
16,
"2009-12-31"
],
[
"Oranges",
2010,
"East",
98,
91,
7,
"2010-12-31"
],
[
"Bananas",
2010,
"East",
81,
13

71,
10,
"2010-12-31"
]
];
data.addColumn('string','Fruit');
data.addColumn('number','Year');
data.addColumn('string','Location');
data.addColumn('number','Sales');
data.addColumn('number','Expenses');
data.addColumn('number','Profit');
data.addColumn('string','Date');
data.addRows(datajson);
return(data);
}
// jsDrawChart
function drawChartMotionChartID2dba6a651a62() {
var data = gvisDataMotionChartID2dba6a651a62();
var options = {};
options["width"] = 600;
options["height"] = 500;
var chart = new google.visualization.MotionChart(
document.getElementById('MotionChartID2dba6a651a62')
);
chart.draw(data,options);
}
// jsDisplayChart
function displayChartMotionChartID2dba6a651a62()
{
google.load("visualization", "1", { packages:["motionchart"] });
google.setOnLoadCallback(drawChartMotionChartID2dba6a651a62);
}
// jsChart
displayChartMotionChartID2dba6a651a62()
<!-- jsFooter -->
//-->
</script>
14

<!-- divChart -->
<div id="MotionChartID2dba6a651a62"
style="width: 600px; height: 500px;">
</div>
Similarly you can also access specific components of the chart, e.g.
R> cat(M$html$chart['jsChart']) # or print(M, 'jsChart')
// jsChart
displayChartMotionChartID2dba6a651a62()
A basic chart caption and html footer are the final items of the html list (output istruncated):
R> print(M, tag='caption')
<div><span>Data: Fruits • Chart ID: <a href="Chart_MotionCha
R> print(M, tag='footer')
<!-- htmlFooter -->
<span>
R Under development (unstable) (2012-02-03 r58258) • <a href
• <a href="http://code.google.com/apis/terms/index.html">Goo
</span></div>
</body>
</html>
2.4 Displaying gvis objects locally
To display the page locally, type:
R> plot(M) # returns invisibly the file name
The plot method for gvis-objects creates html files in a temporary folder using thetype and chart id information of the object and it will display the output using theR HTTP help web server locally, usually under http://127.0.0.1.
The chart caption provides a link to the chart code via the chart id for easy copyand paste.
The R command tempdir() will show you the path of the per-session temporarydirectory, in which the files were written. You can write the chart into a local htmlfile via the print command with the file argument, e.g.
15

R> print(M, file="myGoogleVisChart.html")
Please note that Flash charts5 may not work when loaded as a local file due tosecurity settings, and therefore require to be displayed via a web server. However,you can overcame this issue by changing your Flash security settings. Tony Breyalposted the following solution on stackoverflow.com:
1. Go to http://www.macromedia.com/support/documentation/en/flashplayer/help/settings_manager04.html
2. Click on the dropbox which says ’Edit location’ and choose ’add location’
3. Click ’browse for folder’
4. Choose the folder in which you saved your html file
5. Click OK
Now open your googleVis html file and it should display successfully.
2.5 Combining charts with gvisMerge
The function gvisMerge takes two gvis-objects and merges the underlying com-ponents into one page. The charts are aligned either horizontally or vertically nextto each other in an HTML table.
The output of gvisMerge is a gvis-object again. This allows us to apply the samefunction iteratively to create more complex chart layouts. The following example,see Figure 4, aligns a geo chart and table below each other, and combines the outputwith a motion chart to the right:
R> G <- gvisGeoChart(Exports, "Country", "Profit",
+ options=list(width=200, height=100))
R> T <- gvisTable(Exports,
+ options=list(width=200, height=270))
R> M <- gvisMotionChart(Fruits, "Fruit", "Year",
+ options=list(width=400, height=370))
R> GT <- gvisMerge(G,T, horizontal=FALSE)
R> GTM <- gvisMerge(GT, M, horizontal=TRUE,
+ tableOptions="bgcolor=\"#CCCCCC\" cellspacing=10")
R> plot(GTM)
5Currently the following charts require Flash: motion chart, geo map and annotated time line
16

Figure 4: Three charts combined with gvisMerge.
2.6 Setting options
Setting the various options of a googleVis objects can be a bit cumbersome atfirst. The options follow those of the Google Visualisation API and can be set via anamed list using the argument options. In the following example we create a linechart and set various options6, see the output in Figure 5.
R> df <- data.frame(country=c("US", "GB", "BR"),
+ val1=c(1,3,4), val2=c(23,12,32))
R> Line <- gvisLineChart(df, xvar="country", yvar=c("val1","val2"),
+ options=list(
+ title="Hello World",
+ titleTextStyle="{color:'red',
+ fontName:'Courier',
+ fontSize:16}",
+ backgroundColor="#D3D3D3",
+ vAxis="{gridlines:{color:'red', count:3}}",
+ hAxis="{title:'Country', titleTextStyle:{color:'blue'}}",
+ series="[{color:'green', targetAxisIndex: 0},
+ {color: 'orange',targetAxisIndex:1}]",
+ vAxes="[{title:'val1'}, {title:'val2'}]",
+ legend="bottom",
6Please refer to the help file of the individual googleVis functions, as the options can varyfrom chart to chart.
17
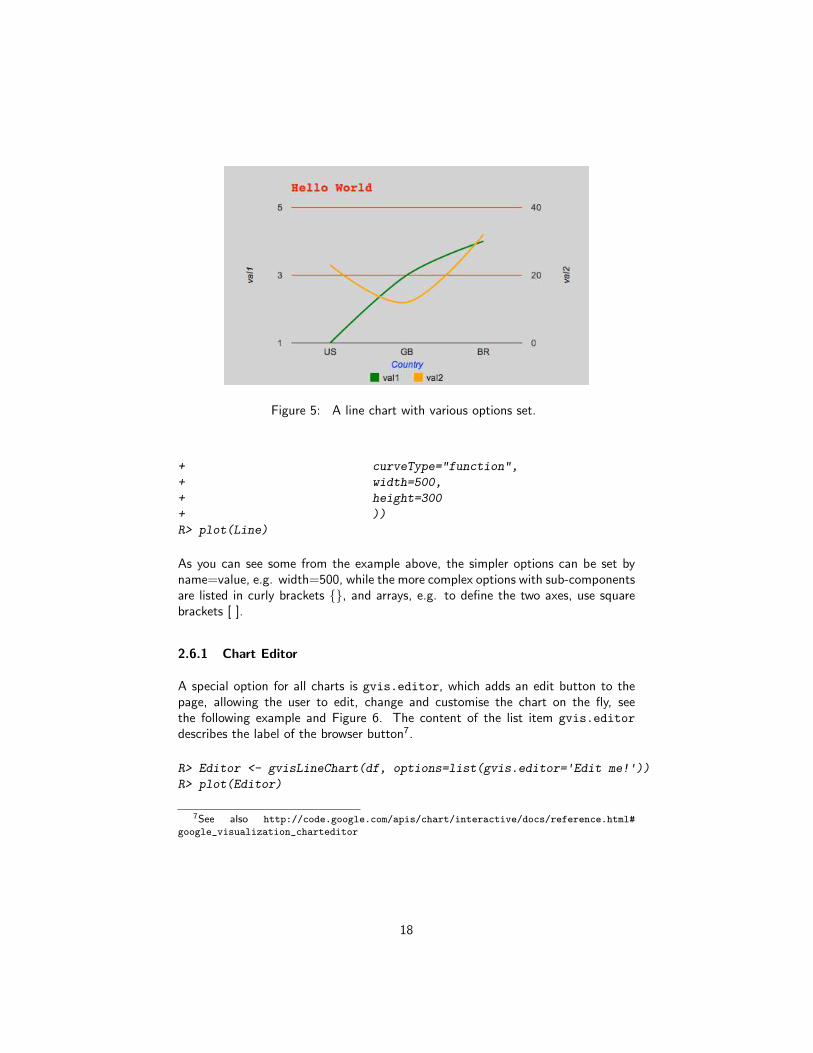
Figure 5: A line chart with various options set.
+ curveType="function",
+ width=500,
+ height=300
+ ))
R> plot(Line)
As you can see some from the example above, the simpler options can be set byname=value, e.g. width=500, while the more complex options with sub-componentsare listed in curly brackets {}, and arrays, e.g. to define the two axes, use squarebrackets [ ].
2.6.1 Chart Editor
A special option for all charts is gvis.editor, which adds an edit button to thepage, allowing the user to edit, change and customise the chart on the fly, seethe following example and Figure 6. The content of the list item gvis.editor
describes the label of the browser button7.
R> Editor <- gvisLineChart(df, options=list(gvis.editor='Edit me!'))
R> plot(Editor)
7See also http://code.google.com/apis/chart/interactive/docs/reference.html#
google_visualization_charteditor
18
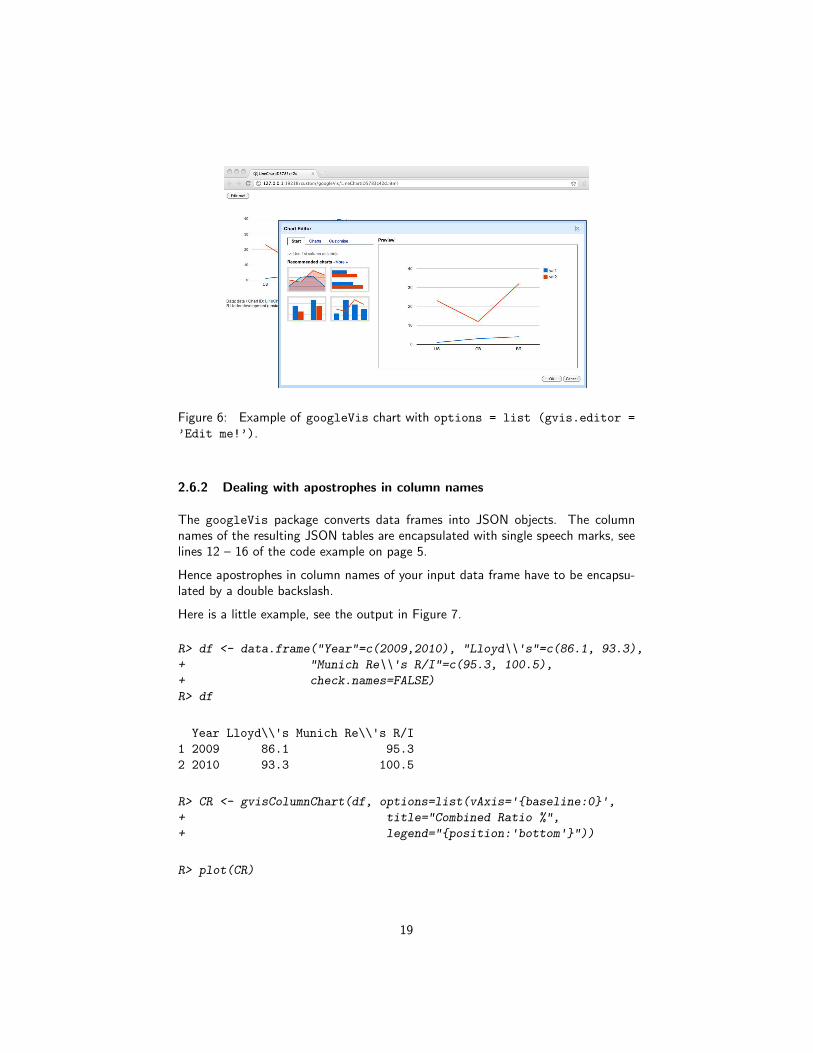
Figure 6: Example of googleVis chart with options = list (gvis.editor =
’Edit me!’).
2.6.2 Dealing with apostrophes in column names
The googleVis package converts data frames into JSON objects. The columnnames of the resulting JSON tables are encapsulated with single speech marks, seelines 12 – 16 of the code example on page 5.
Hence apostrophes in column names of your input data frame have to be encapsu-lated by a double backslash.
Here is a little example, see the output in Figure 7.
R> df <- data.frame("Year"=c(2009,2010), "Lloyd\\'s"=c(86.1, 93.3),
+ "Munich Re\\'s R/I"=c(95.3, 100.5),
+ check.names=FALSE)
R> df
Year Lloyd\\'s Munich Re\\'s R/I
1 2009 86.1 95.3
2 2010 93.3 100.5
R> CR <- gvisColumnChart(df, options=list(vAxis='{baseline:0}',
+ title="Combined Ratio %",
+ legend="{position:'bottom'}"))
R> plot(CR)
19

Figure 7: Visualising data with apostrophes in column names.
3 Embedding googleVis in web sites
3.1 Integrating gvis objects in existing sites
Suppose you have an existing web page and would like to integrate the output ofa googleVis function, such as gvisMotionChart. In this case you only need thechart output from gvisMotionChart. So you can either copy and paste the outputfrom the R console
R> print(M, 'chart') ## or cat(M$html$chart)
into your existing html page, or write the content directly into a file
R> print(M, 'chart', file='myfilename')
and process it from there.
3.2 Using googleVis output with WordPress
WordPress is a popular web software for creating websites and blogs. Here we givesome tips about the usage with googleVis output.
By default WordPress does not allow JavaScript code (and hence googleVis out-put) to be inserted into a page. However, additional plugins allow us to extend thefunctions of WordPress.
20

Figure 8: Including googleVis output in a WordPress blog entry.
One option of embedding JavaScript code inside a WordPress post is to use the“custom fields shortcode” plugin8. The plugin allows you to create a custom fieldfor the googleVis code, which can be referred to in your article.
Suppose you created a motion chart in R:
R> M <- gvisMotionChart(Fruits, "Fruit", "Year",
+ options=list(width=400, height=370))
Copy the chart code, e.g. from
R> print(M, 'chart')
and paste it into the value text area of a custom field in WordPress, e.g. with in-stance name Fruits. To include the motion chart into your article add [cf]Fruits[/cf]into the post, see Figure 8 for an illustration.
3.3 Using googleVis output with Google Sites, Blogger, etc.
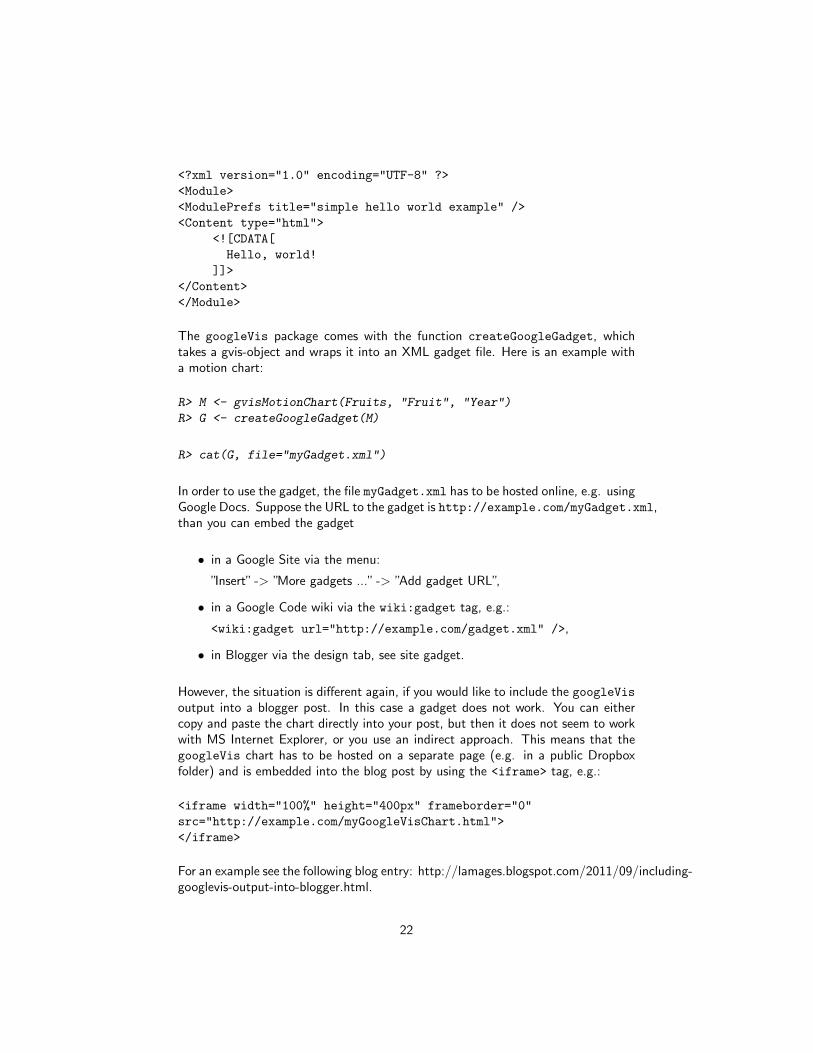
Google Charts can be used with other Google products such as Google Sites, Bloggeror Google Code wiki pages. However, in most cases the chart has to be embeddedas a Google Gadget. Google Gadgets are written in XML and can have HTMLand Javascript components. Here is an example of a ’Hello World’ program writtenusing Google Gadget technology from Wikipedia.
8http://wordpress.org/extend/plugins/custom-fields-shortcode
21
<?xml version="1.0" encoding="UTF-8" ?>
<Module>
<ModulePrefs title="simple hello world example" />
<Content type="html">
<![CDATA[
Hello, world!
]]>
</Content>
</Module>
The googleVis package comes with the function createGoogleGadget, whichtakes a gvis-object and wraps it into an XML gadget file. Here is an example witha motion chart:
R> M <- gvisMotionChart(Fruits, "Fruit", "Year")
R> G <- createGoogleGadget(M)
R> cat(G, file="myGadget.xml")
In order to use the gadget, the file myGadget.xml has to be hosted online, e.g. usingGoogle Docs. Suppose the URL to the gadget is http://example.com/myGadget.xml,than you can embed the gadget
• in a Google Site via the menu:
”Insert” -> ”More gadgets ...” -> ”Add gadget URL”,
• in a Google Code wiki via the wiki:gadget tag, e.g.:
<wiki:gadget url="http://example.com/gadget.xml" />,
• in Blogger via the design tab, see site gadget.
However, the situation is different again, if you would like to include the googleVisoutput into a blogger post. In this case a gadget does not work. You can eithercopy and paste the chart directly into your post, but then it does not seem to workwith MS Internet Explorer, or you use an indirect approach. This means that thegoogleVis chart has to be hosted on a separate page (e.g. in a public Dropboxfolder) and is embedded into the blog post by using the <iframe> tag, e.g.:
<iframe width="100%" height="400px" frameborder="0"
src="http://example.com/myGoogleVisChart.html">
</iframe>
For an example see the following blog entry: http://lamages.blogspot.com/2011/09/including-googlevis-output-into-blogger.html.
22
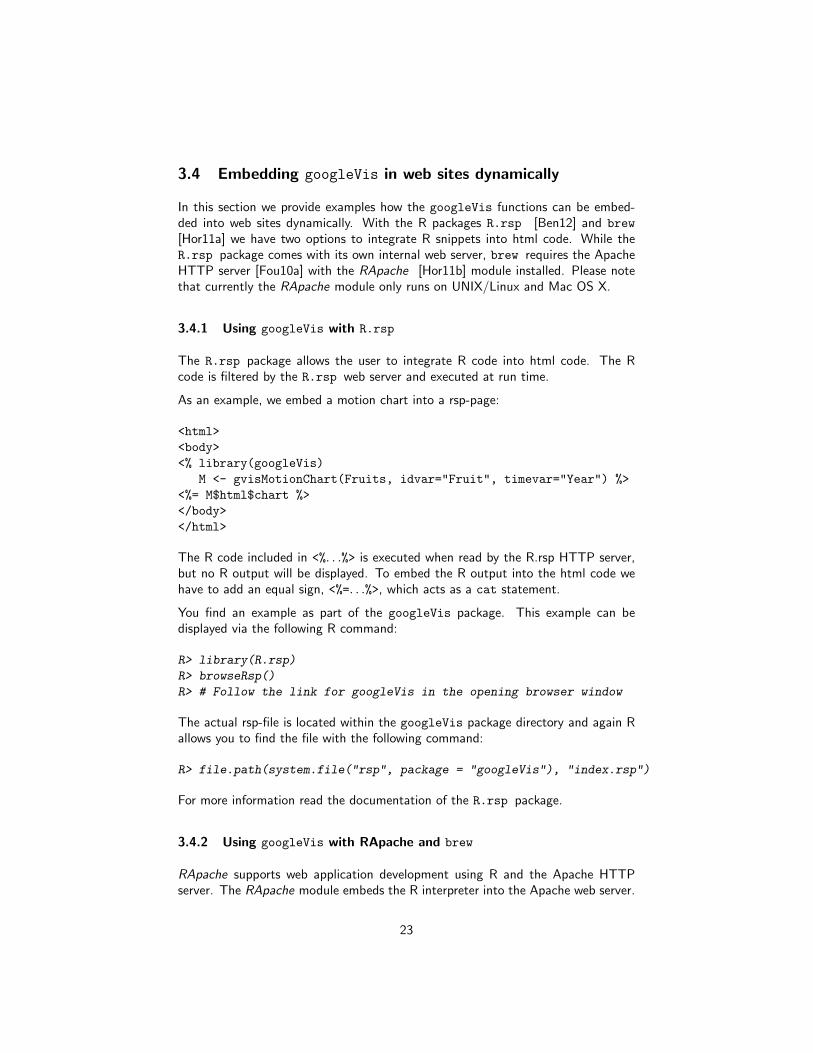
3.4 Embedding googleVis in web sites dynamically
In this section we provide examples how the googleVis functions can be embed-ded into web sites dynamically. With the R packages R.rsp [Ben12] and brew
[Hor11a] we have two options to integrate R snippets into html code. While theR.rsp package comes with its own internal web server, brew requires the ApacheHTTP server [Fou10a] with the RApache [Hor11b] module installed. Please notethat currently the RApache module only runs on UNIX/Linux and Mac OS X.
3.4.1 Using googleVis with R.rsp
The R.rsp package allows the user to integrate R code into html code. The Rcode is filtered by the R.rsp web server and executed at run time.
As an example, we embed a motion chart into a rsp-page:
<html>
<body>
<% library(googleVis)
M <- gvisMotionChart(Fruits, idvar="Fruit", timevar="Year") %>
<%= M$html$chart %>
</body>
</html>
The R code included in <%. . .%> is executed when read by the R.rsp HTTP server,but no R output will be displayed. To embed the R output into the html code wehave to add an equal sign, <%=. . .%>, which acts as a cat statement.
You find an example as part of the googleVis package. This example can bedisplayed via the following R command:
R> library(R.rsp)
R> browseRsp()
R> # Follow the link for googleVis in the opening browser window
The actual rsp-file is located within the googleVis package directory and again Rallows you to find the file with the following command:
R> file.path(system.file("rsp", package = "googleVis"), "index.rsp")
For more information read the documentation of the R.rsp package.
3.4.2 Using googleVis with RApache and brew
RApache supports web application development using R and the Apache HTTPserver. The RApache module embeds the R interpreter into the Apache web server.
23
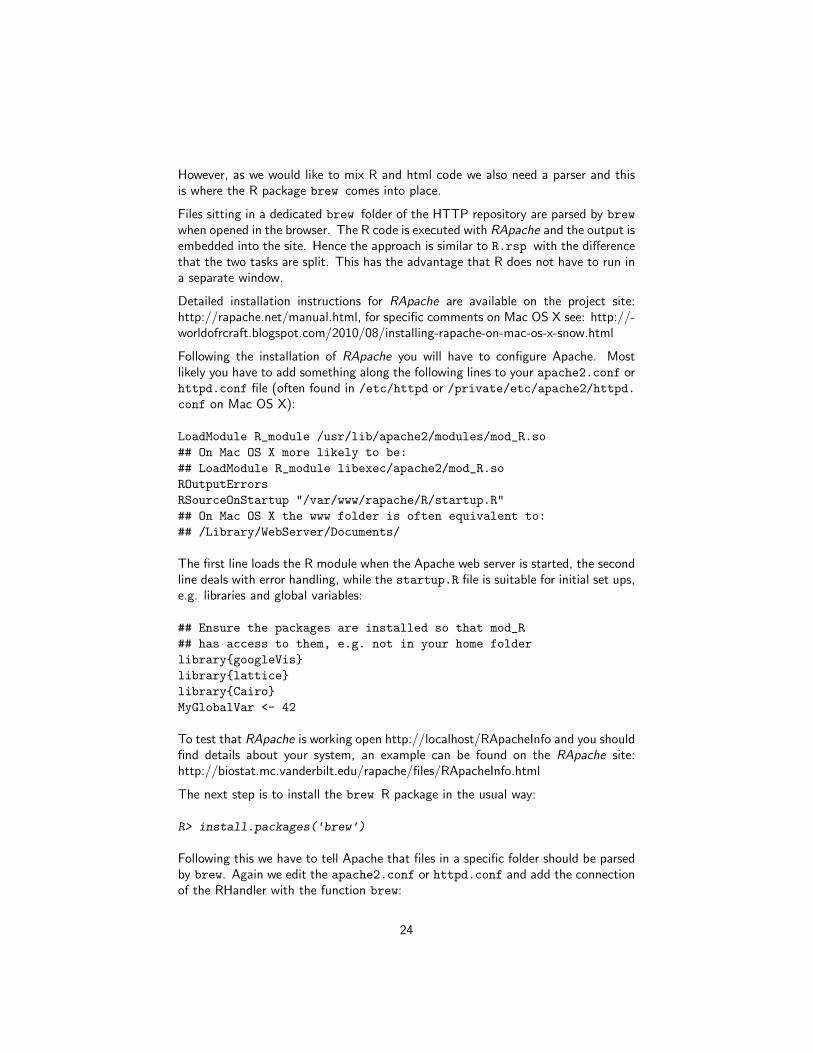
However, as we would like to mix R and html code we also need a parser and thisis where the R package brew comes into place.
Files sitting in a dedicated brew folder of the HTTP repository are parsed by brew
when opened in the browser. The R code is executed with RApache and the output isembedded into the site. Hence the approach is similar to R.rsp with the differencethat the two tasks are split. This has the advantage that R does not have to run ina separate window.
Detailed installation instructions for RApache are available on the project site:http://rapache.net/manual.html, for specific comments on Mac OS X see: http://-worldofrcraft.blogspot.com/2010/08/installing-rapache-on-mac-os-x-snow.html
Following the installation of RApache you will have to configure Apache. Mostlikely you have to add something along the following lines to your apache2.conf orhttpd.conf file (often found in /etc/httpd or /private/etc/apache2/httpd.conf on Mac OS X):
LoadModule R_module /usr/lib/apache2/modules/mod_R.so
## On Mac OS X more likely to be:
## LoadModule R_module libexec/apache2/mod_R.so
ROutputErrors
RSourceOnStartup "/var/www/rapache/R/startup.R"
## On Mac OS X the www folder is often equivalent to:
## /Library/WebServer/Documents/
The first line loads the R module when the Apache web server is started, the secondline deals with error handling, while the startup.R file is suitable for initial set ups,e.g. libraries and global variables:
## Ensure the packages are installed so that mod_R
## has access to them, e.g. not in your home folder
library{googleVis}
library{lattice}
library{Cairo}
MyGlobalVar <- 42
To test that RApache is working open http://localhost/RApacheInfo and you shouldfind details about your system, an example can be found on the RApache site:http://biostat.mc.vanderbilt.edu/rapache/files/RApacheInfo.html
The next step is to install the brew R package in the usual way:
R> install.packages('brew')
Following this we have to tell Apache that files in a specific folder should be parsedby brew. Again we edit the apache2.conf or httpd.conf and add the connectionof the RHandler with the function brew:
24

<Directory /var/www/rapache/brew>
## On Mac OS more likely to be something like:
## <Directory /Library/WebServer/Documents/rapache/brew>
SetHandler r-script
RHandler brew::brew
</Directory>
That’s all. Restart the HTTP daemon and you can start placing files in the brew
directory and access them via http://localhost/rapache/brew/filename, e.g.a file containing:
<html>
<body>
<h1>Fruits</h1>
<% library(googleVis)
M <- gvisMotionChart(Fruits, idvar="Fruit", timevar="Year") %>
<%= M$html$chart %>
</body>
</html>
You will notice that the brew syntax is very similar to rsp. For more informationread the documentation of the RApache module and brew package. You find twosimple examples of brew files in the googleVis package. Again the following Rcommand shows you the folder path:
R> system.file("brew", package = "googleVis")
4 Using googleVis in presentations
The Google Visualisation API is designed for web pages, so it should be no surprisethat it can be difficult or impossible to embed googleVis output in traditionalpresentation software like MS PowerPoint9, Google Docs, OpenOffice Impress orApple Keynote.
The easiest way is to include screen shots into the slide with links to the live webpages. But this approach requires the presenter to switch between applicationsduring her talk. This can be fun, but quite often it is not.
An alternative would be to build the presentation as a web page it self. TheJavaScript library deck.js [Tro11], a jQuery framework for creating HTML presenta-tions by Caleb Troughton, provides an elegant way of combining the slide paradigmwith web content such as YouTube videos or googleVis output. You find an ex-ample with googleVis charts on mages’s blog: http://lamages.blogspot.com/2011/11/interactive-presentations.html .
9For MS PowerPoint on MS Windows the pulg-in liveweb provides the functionality to insertweb pages into a PowerPoint slide and refresh the pages real-time during slide show.
25

Figure 9: googleVis presentation with deck.js: http://dl.dropbox.com/u/
7586336/blogger/deck.js/googleVis/index.html
5 Beyond R
In this section we present ideas which go beyond the usual coding in R and aresomewhat experimental.
5.1 Registering to catch events
Google visualisations can fire and receive events 10. It exposes the following twoJavaScript methods:
• google.visualization.events.trigger() fires an event,
• google.visualization.events.addListener() listens for events.
Here is an example of registering to receive the selection event from the Googledocumentation:
var table = new google.visualization.Table(document.getElementById('table_div'));
table.draw(data, options);
google.visualization.events.addListener(table, 'select', selectHandler);
function selectHandler() {
alert('A table row was selected');
}
We will only deal with this special case of a ’select’ event of the ’addListner’ method.This event is available for most visualisations and acts on user interactions, e.g. userselection clicks.
The ’addListener’ method expects JavaScript code, which can be embedded into agvis-object via options as (undocumented) parameter gvis.listener.jscode.
Here are some examples:
Look up the selected item in Wikipedia:
10http://code.google.com/apis/chart/interactive/docs/reference.html#addlistener
26

R> jscode <- "window.open('http://en.wikipedia.org/wiki/'
+ + data.getValue(chart.getSelection()[0].row,0)); "
R> J1 <- gvisGeoMap(Exports, locationvar='Country', numvar='Profit',
+ options=list(dataMode="regions", gvis.listener.jscode=jscode))
R> plot(J1)
In the same way we can use the code in other charts, e.g. org- or line chart:
R> plot(gvisOrgChart(Regions, options=list(gvis.listener.jscode=jscode)))
R> plot(gvisLineChart(Regions[,c(1,3)], options=list(gvis.listener.jscode=jscode)))
In the following more advanced example the selected value of a table is displayed ina message box:
R> jscode <- "
+ var sel = chart.getSelection();
+ var row = sel[0].row;
+ var text = data.getValue(row,1);
+ alert(text);
+ "
R> J2 <- gvisTable(Population, options=list(gvis.listener.jscode=jscode))
R> plot(J2)
For more details see the demo(EventListener) and Google Visualisation API Ref-erence.
6 Contact
6.1 Collaboration
Obviously, the package is work in progress and there are many other functions ofthe Google Visualisation API which are still untouched.
Please feel free to send us an email if you would like to be kept informed of newversions, or if you have any feedback, ideas, suggestions or would like to collaborate,our address is [email protected].
6.2 Citation
Please cite R and googleVis if you use it in your work or publications. Use
R> citation("googleVis")
and
27

R> citation()
for bib-entries and information on how to cite the software.
6.3 Training and consultancy
Please contact us if you would like to discuss tailored training or consultancy: [email protected]
References
[Ben12] Henrik Bengtsson. R.rsp: R server pages. http://CRAN.R-project.
org/package=R.rsp, 2012. R package version 0.7.1.
[DKM10] MacKenzie Smith (MIT Libraries) David Karger (MIT CSAIL). Simile:Semantic Interoperability of Metadata and Information in unLike Environ-ments. http://simile.mit.edu/, 2010.
[Fou10a] Apache Foundation. Apache HTTP Server 2.2. http://httpd.apache.org, 2010.
[Fou10b] Gapminder Foundation. Gapminder. http://www.gapminder.org,2010.
[Fou10c] Open Source Geospatial Foundation. Openlayers: Free maps for the web.http://www.openlayers.org/, 2010.
[FR10] Ben Fry and Casey Reas. Processing an open source programming lan-guage and environment to create images, animations, and interactions.http://processing.org/, 2010.
[GdC11] Markus Gesmann and Diego de Castillo. Using the Google VisualisationAPI with R. The R Journal, 3(2):40–44, December 2011.
[GdC12] Markus Gesmann and Diego de Castillo. googleVis: Using theGoogle Visualisation API with R. http://code.google.com/p/
google-motion-charts-with-r/, 2012. R package version 0.2.15.
[Hor11a] Jeffrey Horner. brew: Templating framework for report generation. http://CRAN.R-project.org/package=brew, 2011. R package version 1.0-6.
[Hor11b] Jeffrey Horner. RApache: Web application development with R andApache. http://www.rapache.net/, 2011.
[Inc10a] Google Inc. Google Motion Chart API. http://code.google.com/
apis/visualization/documentation/gallery/motionchart.html,2010.
28
[Inc10b] Google Inc. Google Public Data Explorer. http://www.google.com/
publicdata/home, 2010.
[Inc10c] Google Inc. Google Visualisation Reference. http://code.google.com/apis/visualization/documentation/reference.html, 2010.
[Inc11] Google Inc. Google Visualization API. http://code.google.com/apis/visualization/documentation/gallery.html, 2011.
[Inc12] Google Inc. Google API Terms of Service. http://code.google.com/
apis/terms/index.html, 2012.
[JG10] George Neusse John Glazebrook, Guenther Harrasser. Open flash chart.http://teethgrinder.co.uk/open-flash-chart/, 2010.
[JSO06] JSON.org. JSON. http://www.json.org/, 2006. RFC 4627 applica-tion/json.
[Lab10] UC Berkeley Visualization Lab. flare: Data visualisation for the web.http://flare.prefuse.org, 2010.
[Lan12] Duncan Temple Lang. RJSONIO: Serialize R objects to JSON, JavaScriptObject Notation. http://www.omegahat.org/RJSONIO/, 2012. R pack-age version 0.98-0.
[Ros06] Hans Rosling. TED Talk: Hans Rosling shows the best stats you’ve everseen. http://www.ted.com/talks/hans_rosling_shows_the_best_
stats_you_ve_ever_seen.html, 2006.
[RtICsg10] IBM Research and the IBM Cognos software group. Many eyes.http://services.alphaworks.ibm.com/manyeyes/page/Create_
a_Visualization.html, 2010.
[Saa10] Sebastian Perez Saaibi. R/RMETRICS Generator Tool for Google Mo-tion Charts. https://www.rmetrics.org/, 2010. Meielisalp, Lake ThuneSwitzerland, June 27 - July 1, 2010.
[Tro11] Caleb Troughton. deck.js: Modern HTML Presentations, 2011. jQueryframework for creating HTML presentations.
29