google analytics 0 to 90 in 40 minutes
DESCRIPTION
Abstract: You've done your best to get your dream website or web application up and running. Towards the end, you realize you've left analytics out of the equation and won't be able to figure out: How users are interacting with your site Where your users are coming from Which marketing channels are working The dropping-off point for your users Analytics is clearly a key piece of your online presence. In our webcast, you will learn how to get Google Analytics up and running on your site, along with the best practices for tracking events on your site or app. We will also take a look at key features that help marketers optimize media spend and help web masters discover problems with their sites early on. Takeaways from the webcast include: How to set up Google Analytics Useful reports & metrics in Google Analytics When to use event tracking A guide to conversion tracking About the Presenter: Ravish Kamath, Senior Director Products In his position, Ravish oversees and manages all engineering efforts and implementations for Regalix Labs. With a strong background in web development, product & business process management, community frameworks, and open source technologies, he is instrumental in managing several projects from idea to execution. Under his leadership, Regalix's online community ventures have developed highly engaged audiences and have gone on to become award-winning successes.TRANSCRIPT

© 2013 Regalix Inc. Confidential, All Rights Reserved
Google Analytics – 0 to 90 in 40 minutesRavish Kamath | Senior Director - Products
February 05 2013

© 2013 Regalix Inc. Confidential, All Rights Reserved 2
About Ravish
Senior Director - Products, responsible for customer success and driving product strategy at Regalix
8+ years of experience with leading Web 2.0 and Community Development projects for Fortune 500 customers
Evangelized and launched complianceonline.com (Winner of Forrester Groundswell Award in 2009)
Largest expert community of professionals 4M+ users, 60K SKUs, 5M+ search index, 400 trainings a month White Labeled by NASDAQ in 2007

© 2013 Regalix Inc. Confidential, All Rights Reserved 3
Problems you may have grappled with….
AcquisitionWhere am I getting my traffic from?
What traffic sources / geographies are working / not working?
What is my site’s conversion rate (i.e. did they like the experience enough to register or buy?)
Engagement
How are users interacting with my website?
Do users like your site enough to refer others?
RetentionAre my users coming back after the initial experience?

© 2013 Regalix Inc. Confidential, All Rights Reserved 4
This is where Analytics comes in
Google Analytics, Mixpanel, GoSquared, Kissmetrics are some of your options
Google Analytics is FREE
Setting it Up – Follow this link (if you need help, send us an email)

© 2013 Regalix Inc. Confidential, All Rights Reserved 5
Understanding Metrics and Dimensions
What is a metric? Measures data
Visits, Time on Site are examples of a metric
What is a Dimension? Describes data
Descriptive attribute of an object for example source, campaign of traffic are dimensions
Dimensions and Metrics are used in conjunction with one another
Dimensions are often associated with one or more metric

© 2013 Regalix Inc. Confidential, All Rights Reserved 6
Understanding the interface
1. Core Navigatio
n
3. Improve your productivity
0. Date Picker4. Once you understand Dimensions and Metrics
2. Data

© 2013 Regalix Inc. Confidential, All Rights Reserved 7
Standard Reports > Real-Time
Useful to track or view live traffic on site.
Provides number of users on the site, active pages, locations etc.
So when would you use this? Monitoring if users are active on your site
Monitor effects of a tweet / blog on your site
Monitor if a new campaign is sending you traffic
Verify if tracking code is working

© 2013 Regalix Inc. Confidential, All Rights Reserved 8
Standard Reports > Audience
Best report section to understand more about your audience
What can you know from this section? Location – In which countries do you have an audience?
Browser & OS – What browsers / Operating System does your audience use?
Behavior – Most important of the lot if you want to understand engagement and loyalty. Hence we are going to go deeper into this report!

© 2013 Regalix Inc. Confidential, All Rights Reserved 9
Standard Reports > Audience > Behavior > New Vs. Returning
Answers the key question of how many users are returning to your site? A good indicator of loyalty!

© 2013 Regalix Inc. Confidential, All Rights Reserved 10
Standard Reports > Audience > Behavior > Frequency & Recency
How many times does your audience come back? Healthier to have higher count for visit for subsequent visits The below report indicates that 77.63% of the visits where first time visits, with 11% making a second visit
and 3% making a third visit…Not a good indicator!

© 2013 Regalix Inc. Confidential, All Rights Reserved 11
Standard Reports > Audience > Behavior > Engagement
How long does your audience spend on your site? Is your traffic engaging with your site? Majority of visits in 0-10 second interval is bad Blogs / Content sites have 181+ seconds visit duration length

© 2013 Regalix Inc. Confidential, All Rights Reserved 12
Standard Reports > Traffic Sources > 1
Best report section to understand from where you are getting your users. In other words how do people find your site?
Use this report to evaluate effectiveness of Referrals
Direct Traffic
Organic
Social traffic
Custom Campaigns
When looking at a traffic source’s effectiveness, look at: Pages / Visit
Avg. Visit Duration
Bounce Rate
Revenue (Ecommerce Only)
Conversion Rate (Ecommerce Only)
Per Visit Value (Ecommerce Only)

© 2013 Regalix Inc. Confidential, All Rights Reserved 13
Standard Reports > Traffic Sources > Dimensions
Source – Who sent this user to your site? Google (Name of the search engine), google_analytics_newsletter (name of the newsletter), direct (users who typed your website URL directly)
Medium – Organic, cpc, referral or any custom name
Keyword – In case of organic and paid search traffic, the keywords visitors searched are usually captured (will be not provided in case the user is using SSL search)
Campaign – Name of the adwords campaign or the custom campaign you created
Content – In case of multiple call to actions in your content, use this field to tell which one was more effective.
Sample URL:
http://www.regalix.com?utm_source=feb_5_webinar&utm_medium=ppt&utm_campaign=ga_webinar

© 2013 Regalix Inc. Confidential, All Rights Reserved 14
Standard Reports > Traffic Sources > Sources > All Traffic
Understand where to focus your advertising and site optimization efforts The best kind of traffic is the free kind with a good Pages / Visit, Avg. Visit Duration & low Bounce Rate If you are an ecommerce site, use the Ecommerce link under Explorer to see revenue associated with
traffic sources

© 2013 Regalix Inc. Confidential, All Rights Reserved 15
Standard Reports > Traffic Sources > Sources > Referral Traffic
Which domains are referring most traffic to your site? Which page are they sending traffic to? To view this information, click “Landing Page” link highlighted
below Check if your expected traffic sources are present. Also check for the unexpected ones!

© 2013 Regalix Inc. Confidential, All Rights Reserved 16
Standard Reports > Traffic Sources > Sources > Search
Breakdown of Organic Vs. Paid Search traffic Again evaluate effectiveness of traffic against number of visits, visit duration, bounce rate / Revenue
dimensions
© 2013 Regalix Inc. Confidential, All Rights Reserved 17
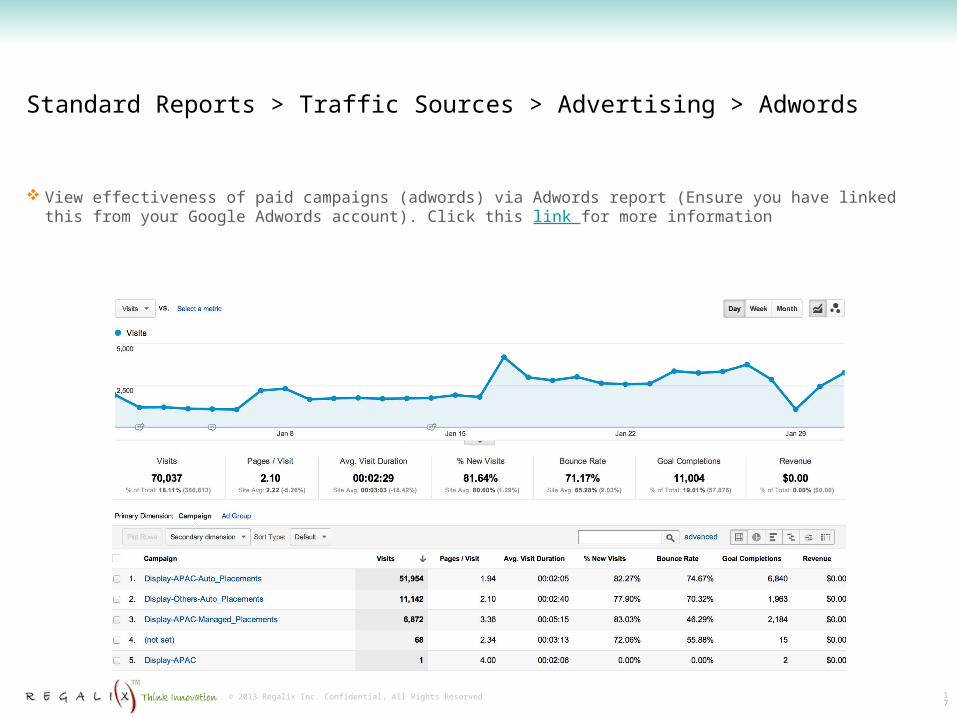
Standard Reports > Traffic Sources > Advertising > Adwords
View effectiveness of paid campaigns (adwords) via Adwords report (Ensure you have linked this from your Google Adwords account). Click this link for more information

© 2013 Regalix Inc. Confidential, All Rights Reserved 18
Standard Reports > Content
Use these reports to improve your site content, navigation ( and speed as well).
Use this report to evaluate Popular Pages
Pages that have high bounce rate (focus on rewriting these pages)
How users are interacting with elements on your website (can be done via events)
When looking at a page’s effectiveness, look at: Bounce Rate (anything above 45% is a red flag)
Exit Rate (important to know the difference between Bounce Rate Vs. Exit Rate)

© 2013 Regalix Inc. Confidential, All Rights Reserved 19
Standard Reports > Content > Site Content > All Pages
Understand pages which have the highest page views, avg. time on page and low bounce rates. These are your best performing pages
Work on improving the remaining pages

© 2013 Regalix Inc. Confidential, All Rights Reserved 20
Standard Reports > Content > Events
Use Event Tracking to track user interactions with specific elements on your web page.
For Example:How many users clicked Download CSV Vs. Download KML? (refer screenshot)
Use Event Tracking to track user interactions for such purposes. In the given example, the hyperlinks in the HTML will be coded as shown below:
<a href=“domain.com” onClick=“_gaq.push(['_trackEvent', ’Download', ”Download CSV", ”CSV");”>Download CSV</a>
<a href=“domain.com” onClick=“_gaq.push(['_trackEvent', ’Download', ”Download KML", ”KML");”>Download KML</a>
The event above depends on three different elements:
Category – What type of object do you want to track. In this case we want to track the Download button
Action – What action do you want to record? In this case we want to track click on CSV Vs. KML links

© 2013 Regalix Inc. Confidential, All Rights Reserved 21
Standard Reports > Content > In-Page Analytics
Visually Assess how users are interacting with your site Are my key messages appearing above the fold? Are my call to actions working? What are users clicking on my site?

© 2013 Regalix Inc. Confidential, All Rights Reserved 22
Standard Reports > Conversions
Completion of an activity on your site that is important for your business. For example: a registration or a successful transaction / purchase.
You must define goals in order to track conversions. Lets see how!

© 2013 Regalix Inc. Confidential, All Rights Reserved 23
Standard Reports > Content > In-Page Analytics
Visually Assess how users are interacting with your site Are my key messages appearing above the fold? Are my call to actions working? What are users clicking on my site?
Name of your goal
Goal will be reached when user reaches a specific URL Destination
URL of the page which should trigger the goal
Series of pages the user navigates to reach the goal page. Used in
ecommerce sites to track shopping cart funnels

© 2013 Regalix Inc. Confidential, All Rights Reserved 24
Standard Reports > Conversions > Path Length
How many visits did it take a visitor to convert? The below report gives us an insight – 23% of visitors convert on first visit, 48% convert after 12+ visits Think about it, its not about the first visit!
© 2013 Regalix Inc. Confidential, All Rights Reserved 25
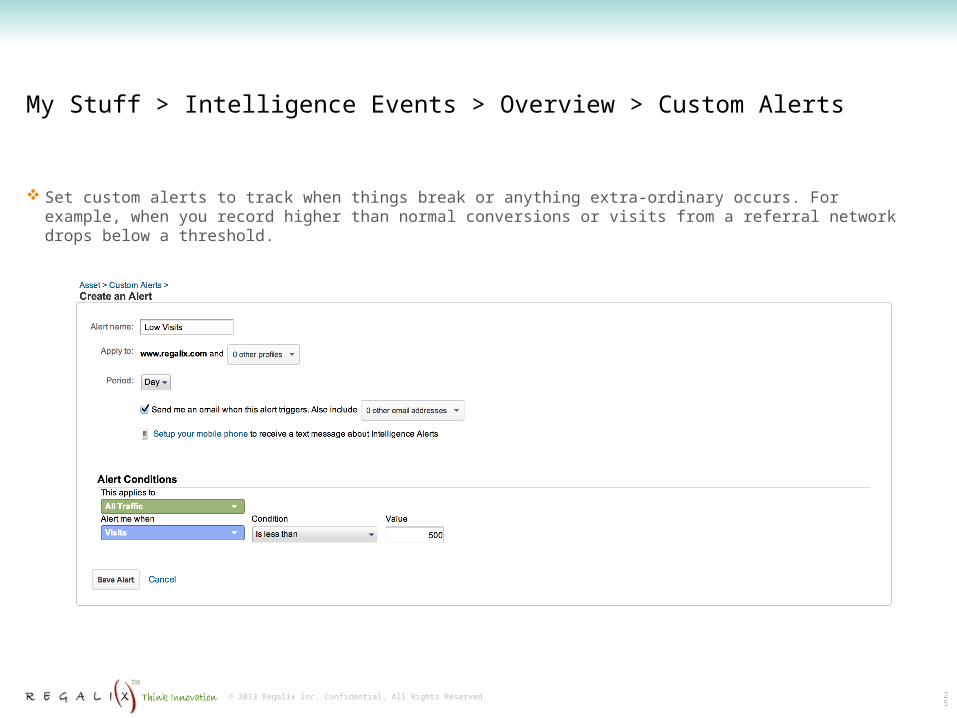
My Stuff > Intelligence Events > Overview > Custom Alerts
Set custom alerts to track when things break or anything extra-ordinary occurs. For example, when you record higher than normal conversions or visits from a referral network drops below a threshold.

© 2013 Regalix Inc. Confidential, All Rights Reserved 26
In Summary
Use Real time report to understand:Monitor effects of a tweet / blog on your site
Monitor if a new campaign is sending you traffic
Verify if tracking code is working
Use Audiences Report to understand: Where are your users located?
What is your sites engagement and loyalty?
Use Traffic Sources Report to understand:How people are finding your site?
How effective are these sources?
Use Content Report to understand:How users are interacting with content and navigation on your site?
Use Conversions Report to understand:Are the business objectives being met?

© 2013 Regalix Inc. Confidential, All Rights Reserved 27
Few other reports that may help you
Content Efficiency Analysis Report (by Avinash Kaushik)
Social Media Performance Dashboard (by Avinash Kaushik)
Ecommerce Traffic Report

© 2013 Regalix Inc. Confidential, All Rights Reserved 28
Get in Touch
Forefront of InnovationDigital Marketing ServicesTechnology Enabled ServicesRegalix Labs
Multi-disciplinary Leadership Team & Strong Advisory Board, 175+ Team
Fortune 500 and Venture Backed Customers (B2B and B2C)
Global Operations: HQ in Silicon Valley, 4 Offices
Industry Recognition
visit: www.regalix.com
For a free evaluation of your google analytics setup, please get in touch with Nick, [email protected]
If you have any questions about this webinar please feel free to get in touch with the speaker Ravish Kamath, [email protected]