goldman sachs industrials & materials conference€¦ · a strong, global company delivering...
TRANSCRIPT

www.lyondellbasell.com
Goldman Sachs Industrials & Materials ConferenceThomas AebischerEVP& CFO
May 15, 2019
1

www.lyondellbasell.com
The statements in this presentation relating to matters that are not historical facts are forward-looking statements. These forward-looking statements are based upon assumptions of management which are believed to be reasonable at the time made and are subject to significant risks and uncertainties. Actual results could differ materially based on factors including, but not limited to, the business cyclicality of the chemical, polymers and refining industries; the availability, cost and price volatility of raw materials and utilities, particularly the cost of crude oil, natural gas, and associated natural gas liquids; competitive product and pricing pressures; labor conditions; our ability to attract and retain key personnel; operating interruptions (including leaks, explosions, fires, weather-related incidents, mechanical failure, unscheduled downtime, supplier disruptions, labor shortages, strikes, work stoppages or other labor difficulties, transportation interruptions, spills and releases and other environmental risks); the supply/demand balances for our and our joint ventures’ products, and the related effects of industry production capacities and operating rates; our ability to achieve expected cost savings and other synergies; our ability to successfully execute projects and growth strategies; any proposed business combination, the expected timetable for completing any proposed transactions and the receipt of any required governmental approvals, future financial and operating results, benefits and synergies of any proposed transactions, future opportunities for the combined company; legal and environmental proceedings; tax rulings, consequences or proceedings; technological developments, and our ability to develop new products and process technologies; potential governmental regulatory actions; political unrest and terrorist acts; risks and uncertainties posed by international operations, including foreign currency fluctuations; and our ability to comply with debt covenants and service our debt. Additional factors that could cause results to differ materially from those described in the forward-looking statements can be found in the “Risk Factors” section of our Form 10-K for the year ended December 31, 2018, which can be found at www.LyondelBasell.com on the Investor Relations page and on the Securities and Exchange Commission’s website at www.sec.gov.
The illustrative results or returns of growth projects are not in any way intended to be, nor should they be taken as, indicators or guarantees of performance. The assumptions on which they are based are not projections and do not necessarily represent the Company’s expectations and future performance. You should not rely on illustrated results or returns or these assumptions as being indicative of our future results or returns.
This presentation contains time sensitive information that is accurate only as of the date hereof. Information contained in this presentation is unaudited and is subject to change. We undertake no obligation to update the information presented herein except as required by law.
Reconciliations for our non-GAAP measures can be found in the Appendix to this presentation or on our website at www.LyondellBasell.com/investorrelations.
Cautionary Statement
2

www.lyondellbasell.com
LyondellBasell A Strong, Global Company Delivering Outstanding Performance
3
(1) Enterprise value means market capitalization plus preferred equity (non-controlling interests), total debt and minority interest less cash and cash equivalents and short term investments as of March 31, 2019.
(2) Source IHS Markit, LYB. 2018 ranking as of December 31, 2018
GLOBAL
Manufacturing in 24 countries and our products are sold in more than 100 countries
$40 billon enterprise value(1)
LEADING(2)
OLEFINS & POLYOLEFINSExpanded polypropylene compounds capacity in China, India and EuropeBuilding the first world-scale Hyperzone HDPE plantAcquired A. Schulman
INTERMEDIATES & DERIVATIVESBuilding the world’s largest PO/TBA plant
GROWING
Producer ofpolyethylene in
Europe
POLYETHYLENE
ETHYLENE
Producer ofpolypropylene in
N. America and Europe
POLYPROPYLENE
PROPYLENE
Producer ofpropylene oxide
in the world
PROPYLENE OXIDE
PROPYLENE

www.lyondellbasell.com
DeliveringResults
AdvancingGrowth
CapturingOpportunity
LyondellBasell in 2018
4
1. Free operating cash flow yield is the ratio of the net cash provided by operating activities minus sustaining (maintenance and HSE) capital expenditures as of December 31, 2018.
$ 4.7 billionNet Income
$ 6.9 billionEBITDA
14.1%Free Operating
Cash Flow Yield(1)
27%Return on Invested
Capital
Completed acquisition of A. Schulman
Premium PolyolefinRecycling JV with Suez
Building the first world scale Hyperzone HDPE plant
Building the world’s largest PO/TBA plant
Evaluation ofBraskem opportunity
Capturing margin from improved markets and contracting in I&D
Creating value from innovation by licensing
and deploying technology
Opportunistic share repurchases
totaling $1.9 billion

www.lyondellbasell.com
0.22 0.21 0.21 0.18 0.19
0.10
0.20
0.30
0.40
0.50
0.60
0.70
0.80
2015 2016 2017 2018 1Q19
LyondellBasell – An Industry Leader in Safety Performance
5
Source: American Chemistry Council (ACC), LYB. ACC data includes all available periods. Number of hours worked includes employees and contractors. Data includes safety performance from the acquisition of A. Schulman from August 21, 2018 forward.
ACC Average
Ferrara, Italy
Injuries per 200,000 Hours Worked

www.lyondellbasell.com
LYB Portfolio Diversity Increases Earnings Resiliency
6
EPSUSD per share
Segment EBITDA
LyondellBasell Profitability
Stable:
Global portfolio
Improved:
I&D performance
Technology revenue
Growing:
A. Schulman synergy
Technology licensing
2,000
4,000
$6,000
2017 2017 2018 2018 1Q 19 LTM 1Q 19 LTM
2017 2018 1Q19 LTM
USD, millions
O&P - AM O&P - EAI APSI&D Refining Technology
4
8
12
16
$20
2,000
4,000
6,000
8,000
$10,000
2017 2018 1Q19LTM2017 2018 1Q19 LTM
EBITDAUSD, millions
EBITDA EPS

www.lyondellbasell.com
70%
75%
80%
85%
90%
95%
100%
50
100
150
200
250
2015 2017 2019 2021 2023
ton, millions
Capacity
Demand
Effective Operating Rate - 1Q19 Forecast
70%
75%
80%
85%
90%
95%
100%
50
100
150
200
250
300
350
2015 2017 2019 2021 2023 2025
ton, millions
Capacity
Demand
Effective Operating Rate - 1Q19 Forecast
Industry Capacity Additions Serving Strong Global Demand
7
Global Ethylene Supply & Demand
Source: IHS Markit, Wood Mackenzie, LYB estimates, effective operating rate assuming 6% industry downtime for ethylene and 8% for polyethylene. Based on 2019 updated balances.
Global Polyethylene Supply & Demand
Balanced Market Balanced Market

www.lyondellbasell.com
LyondellBasell’s Hyperzone HDPE Technology A New Platform for Growth
8
1.1 billion pounds per year
Estimated investment: ~$725 million
Start-up: 3Q 2019
Estimated EBITDA(1): $170 - $210 million/year
(1) For the purpose of this slide, estimated EBITDA for Hyperzone Polyethylene is volume times average 2014-2018 margins.
La Porte, Texas

www.lyondellbasell.com
Advancing Our Leading PO/TBA Technology and Market Position
9
Value-driven growth supported by advantaged feedstocks and technology
(1) For the purpose of this slide, estimated EBITDA for Propylene Oxide / TBA is volume times 2014-2018 average margins.
1.0 billion pounds Propylene Oxide, 2.2 billion pounds TBA
Estimated investment: ~$2.4 billion Groundbreaking: August 2018 Start-up: 2021
Estimated EBITDA(1): $400 - $450 MM/year

www.lyondellbasell.com
2
4
6
8
$10
5
10
15
20
$25
Jun-19 Dec-19 Jun-20 Dec-20 Jun-21 Dec-21
ULSD - Brent,USD per bbl
Brent - DubaiUSD per bbl
Improved reliability since 2017
Full capability to meet Tier 3 gasoline sulfur specifications
Poised to benefit from January 2020 IMO marine fuel oil sulfur regulations
Refining: Margin Outlook Improving for the Balance of 2019
10
EBITDA
Refining Spreads(1)
Refinery Outlook
(1) Note: Light Louisiana Sweet (LLS) is the referenced light crude. Maya is the referenced heavy crude oil. USGC RBOB is the referenced U.S. Gulf Coast unleaded gasoline future. USGC ULSD is the U.S. Gulf Coast diesel future. Data represents quarterly, monthly and April 23, 2019 month-to-date average per Platts.
(2) Source: NYMEX as of February 4, 2018
Indicative Forward Curves(2)
ULSD – Brent
Brent – Dubai
50
100
150
$200
2017 2018 1Q19 LTM
USD, millions
-5
510152025
$30
1Q17 2Q17 3Q17 4Q17 1Q18 2Q18 3Q18 4Q18 1Q19 Apr 19
USD per bbl
LLS-Maya USGC RBOB - LLS USGC ULSD - LLS

www.lyondellbasell.com
Circular Steam Project – Advancing a Sustainable Solution
11
Reduces energy to support a sustainable economy
Contributes to Dutch government CO2 reduction targets
Reduces operating cost structure
Rotterdam, The Netherlands

www.lyondellbasell.com
Strong, Consistent Cash Generation
12
Cash From Operating Activities
Cash From Operating Activities as a Percent of Average Enterprise Value(3)
(1) Free Operating Cash Flow = cash from operating activities – sustaining (maintenance and HSE) capital expenditures. (2) Total liquidity includes cash and cash equivalents, restricted cash and restricted cash equivalents, short term investments, repurchase agreements, and availability under our Three-Year
Team Loan due 2022, Senior Revolving Credit Facility and our receivables facilities as of the end of each period presented.(3) Source: CapIQ, LYB. Cash from operating activities is as of the end of each period presented. Average enterprise value means average market capitalization plus preferred equity, total
debt and minority interest less cash and cash equivalents and short term investments. Market capitalization is based upon the average daily closing share price for the respective period. Preferred equity (redeemable non-controlling interests), total debt, minority interest, cash and cash equivalents and short-term investments are as of the last day of the respective period.
■ 1Q19 LTM Free Operating Cash Flow(1): $4.1 B
■ 1Q19 LTM Sustaining Capex: $1.0 B
■ 1Q19 Ending Total Liquidity(2): $8.4 B
0%
3%
6%
9%
12%
15%
18%
LYB WLK HUN DOW EMN CE DD
2014 2015 2016 2017 2018 1Q19 LTM
1,0002,0003,0004,0005,0006,000
$7,000
2015 2016 2017 2018 1Q19 LTM
USD, millionsFree Operating Cash Flow Sustaining Capex

www.lyondellbasell.com
Cash Generation Funding Growth Investments and Shareholder Returns
13
2018 Cash from Operating Activities: $5.5 B
Growing through investment: $2.1 B in capex Acquired A. Schulman
Returning value to shareholders: $3.4 B in dividends & share repurchases 19.2 million shares repurchased
2,000
4,000
6,000
8,000
$10,000
2014 2014 2015 2015 2016 2016 2017 2017 2018 20182014 2015 2016 2017 2018
USD, millions
Cash from Operating Activities Dividends Capex Share Repurchases M&A

www.lyondellbasell.com
Sources 2013-2018 Uses Priority
Cash From Operating Activities
Balance Sheet
Capacity
Optional
Mandatory
Our Capital Deployment Strategy Remains Consistent
14
BaseCAPEX
Dividends
Growth CAPEX
ShareRepurchase
Balance Sheet
Capacity
2019-2023 Uses
BaseCAPEX
Dividends
Growth CAPEX
ShareRepurchase
Inorganic Opportunities
Note: Graphic for illustrative purposes only.
M&A
www.lyondellbasell.com
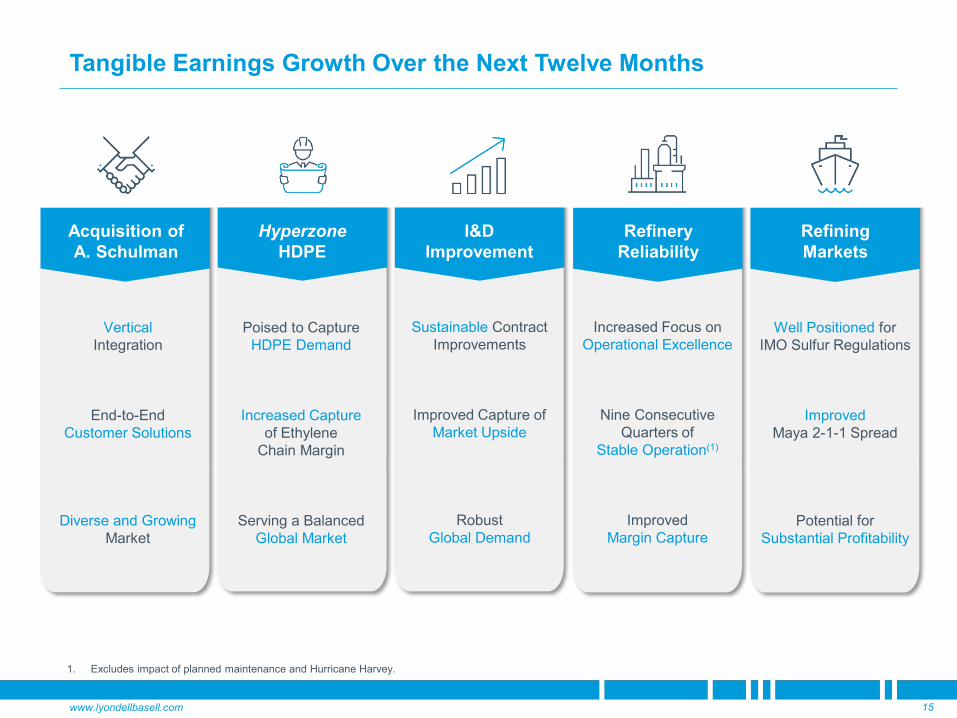
Tangible Earnings Growth Over the Next Twelve Months
15
HyperzoneHDPE
Refinery Reliability
I&D Improvement
VerticalIntegration
End-to-End Customer Solutions
Diverse and Growing Market
Poised to Capture HDPE Demand
Increased Capture of Ethylene
Chain Margin
Serving a BalancedGlobal Market
Acquisition of A. Schulman
Sustainable Contract Improvements
Improved Capture of Market Upside
Robust Global Demand
Increased Focus on Operational Excellence
Nine Consecutive Quarters of
Stable Operation(1)
ImprovedMargin Capture
Well Positioned for IMO Sulfur Regulations
Improved Maya 2-1-1 Spread
Potential for Substantial Profitability
Refining Markets
1. Excludes impact of planned maintenance and Hurricane Harvey.

www.lyondellbasell.com
Strategic Goals to Guide our Growth
16
Leverage Core Strengths: Safe & reliable operations Cost discipline Global reach and broad portfolio
Advance Profitable Growth: Focus on advantaged and
differentiated products and markets
Capture Opportunities: Consistent with LYB strengths Create tangible value
To Deliver Consistent
Top-Quartile TSR
MAINTAIN INVESTMENT-GRADE CREDIT RATING

www.lyondellbasell.com
Appendix
17

www.lyondellbasell.com
50
100
150
200
250
300
1990 1995 2000 2005 2010 2015 2020Est.
lb., billions
PE PP
Global Macro Trends - Demographics Driving Demand
18
2018 Polyolefins Consumption
World PE and PP Demand
Source: IHS Markit and LyondellBasell estimates.1. China polyolefin trade deficit is production less domestic demand.
China Polyolefin Trade Deficit(1)
’90 – ’18 PE: 4.4%PP: 6.5%
’13 – ’18 PE: 4.5%PP: 5.6%
’17 – ‘18PE: 5.5%PP: 5.3%
Annual Upper/Middle Class Household Growth
(2019-2022)
PE
PP
~4% China
~6% India
-40
-30
-20
-10
PE PPlb., billions2018 2023
India
Southeast Asia
Northeast Asia
W. EuropeN. America
20
40
60
80
100
10 20 30 40 50 60GDP per capita, USD thousands
Consumption, lb per capita

www.lyondellbasell.com
Majority of New N. American Industry Capacity Already in the Market
19
2016-2019: N. America Capacity Startups(1)
(1) Source: IHS Markit and LYB estimates.(2) Source: IHS Markit and LYB estimates. Polyethylene domestic demand growth is 1Q19 LTM compared to 1Q18 LTM. Data is actual for 2017-2018 and a forecast for
1Q19.
2016-2019: Polyethylene Trade(1)
Ethylene units are running well
New PE capacity is in the market
PE exports are expected to increase
Status & Impact of New Capacity
1Q19 LTM : Strong Operations and Markets(2)
Ethylene Effective
Operating Rate
Polyethylene Domestic
Demand Growth
U.S. & Canada 91% 6.0%
Northeast Asia 99% 7.4%
Europe 94% 0.6%
100
200
Net Exports Net Imports
lb., billions
North America ChinaAsia ex. China EuropeMiddle East Rest of World
~ 75% of 19 Blbs of Polyethylene
~ 70% of 24 Blbs of Ethylene

www.lyondellbasell.com
0.0
0.5
1.0
1.5
2.0
2.5
$3.0
O&P - EAI O&P - Americas Advanced PolymerSolutions
USD, billions
A. Schulman Olefins, PE & PP PPC, Catalloy & PB-1
2
4
6
8
10
12
14
16
O&P - EAI O&P - Americas Advanced PolymerSolutions
lbs., billions
A. Schulman Olefins, PE & PP PPC Catalloy & PB-1
Advanced Polymer Solutions: Creating a New Platform for Growth
20
2017 Sales Volume(1)
A. Schulman ~ 2.4 Blb
LyondellBasell ~ 3.4 Blb▪ PP Compounds▪ Catalloy▪ PB-1
Product shift to new segment
Catalloy & PB-1
2017 EBITDA(2)
EBITDA shift to new segment
PPC, Catalloy & PB-1
A. Schulman ~ $200 MM
LyondellBasell ~ $440 MM▪ PP Compounds▪ Catalloy▪ PB-1
(1) 2017 sales volume represents LyondellBasell’s third party olefins, polyethylene, polypropylene, polypropylene compounds, Catalloy and polybutene-1 sales for the twelve-month period ended December 31, 2017. A. Schulman was acquired on August 21, 2018. A. Schulman information was obtained from publicly available quarterly release data and management estimate for the twelve-month period ended November 30, 2017.
(2) A. Schulman EBITDA is adjusted EBITDA based on publicly available quarterly release data for the twelve-month period ended November 30, 2017.

www.lyondellbasell.com
Advanced Polymer Solutions: A New Segment Focusing on Broad and Attractive Markets
21
Masterbatch
Engineered Composites
Specialty Powders
Engineered Plastics
Custom Performance
Colors
Polypropylene Compounds
Polybutene-1
Catalloy
Advanced PolymersCompounding & Solutions

www.lyondellbasell.com
This presentation makes reference to certain “non-GAAP” financial measures as defined in Regulation G of the U.S. Securities Exchange Act of 1934, as amended. The non-GAAP measures we have presented include EBITDA. We report our financial results in accordance with U.S. generally accepted accounting principles, but believe that certain non-GAAP financial measures, such as EBITDA and earningsprovide useful supplemental information to investors regarding the underlying business trends and performance of the company's ongoing operations and are useful for period-over-period comparisons of such operations. Non-GAAP financial measures should be considered as a supplement to, and not as a substitute for, or superior to, the financial measures prepared in accordance with GAAP.
EBITDA, as presented herein, may not be comparable to a similarly titled measure reported by other companies due to differences in the way the measure is calculated. We calculate EBITDA as income from continuing operations plus interest expense (net), provision for (benefit from) income taxes, and depreciation & amortization. EBITDA should not be considered an alternative to profit or operating profit for any period as an indicator of our performance, or as an alternative to operating cash flows as a measure of our liquidity.
While we also believe that free operating cash flow (FOCF) and free operating cash flow yield (FCF Yield) are measures of profitability commonly used by investors to evaluate performance, free operating cash flow and free operating cash flow yield, as presented herein, may not be comparable to similarly titled measures reported by other companies due to differences in the way the measures are calculated. For purposes of this presentation, free operating cash flow means net cash provided by operating activities minus sustaining (maintenance and HSE) capital expenditures. Free operating cash flow yield means the ratio of free operating cash flow to market capitalization.
Additionally, total liquidity, enterprise value and the ratio of cash from operating activities to average enterprise value are measures that provide an indicator of value to investors. For purposes of this presentation, total liquidity includes cash and cash equivalents, restricted cash and restricted cash equivalents, short term investments, repurchase agreements, and availability under our Three-Year Team Loan due 2022, Senior Revolving Credit Facility and our receivables facilities. Enterprise value means market capitalization plus preferred equity (redeemable non-controlling interests), total debt and non-controlling interests less cash and cash equivalents and short term investments. The ratio of cash from operating activities to average enterprise value means cash from operating activities divided by average enterprise value. Average enterprise value means average market capitalization plus preferred equity (redeemable non-controlling interests), total debt and non-controlling interests less cash and cash equivalents and short term investments.
Reconciliations for our non-GAAP measures can be found on our website at www.lyondellbasell.com/investorrelations.
Information Related to Financial Measures
22

www.lyondellbasell.com
Enterprise Value
23
Calculation of LYB Enterprise Value (EV)
In Million of Dollars except for common shares outstandingCommon shares outstanding, March 31, 2019 370,326,103 Multiplied by:Closing share price, March 31, 2019 $ 84.08 Market capitalization $ 31,137 Add:Current maturities of long-term debt 5 Short-term debt 2,377 Long-term debt 7,522 Less: Cash and cash equivalents 339 Short-term investments 423 Net debt 9,142 Redeemable non-controlling interests 116 Non-controlling interests 22 Enterprise value 40,417$

www.lyondellbasell.com
EBITDA by Segment to EBITDA
24
Last Twelve Months Ended
March 31,In Millions of Dollars 2016 2017 2018 2019Segment EBITDA: Olefins & Polyolefins - Americas 2,788$ 2,899$ 2,762$ 2,522$ Olefins & Polyolefins - EAI 1,729 1,927 1,163 1,040 Intermediates & Derivatives 1,333 1,490 2,011 1,915 Advanced Polymer Solutions 427 438 400 425 Refining 72 157 167 89 Technology 262 223 328 355 Other (9) - 36 36 Total EBITDA 6,602$ 7,134$ 6,867$ 6,382$
For the Years Ended December 31,
Reconciliation of Segment EBITDA to EBITDA

www.lyondellbasell.com
Net Income to EBITDA
25
Reconciliation of Net Income to EBITDA
Last Twelve Months Ended
March 31,In Millions of Dollars 2016 2017 2018 2019
Net income 3,837$ 4,877$ 4,690$ 4,276$ Loss from discontinued operations 10 18 8 8 Income from continuing operations 3,847 4,895 4,698 4,284 Provision for income taxes 1,386 598 613 513 Depreciation and amortization 1,064 1,174 1,241 1,264 Interest expense, net 305 467 315 321 EBITDA 6,602$ 7,134$ 6,867$ 6,382$
For the Years Ended December 31,

www.lyondellbasell.com
Free Operating Cash Flow to Net Cash Provided by Operating Activities
26
Reconciliation of Free Operating Cash Flow to Net Cash Provided by Operating Activities
Last Twelve Months Ended
March 31,
In Millions of Dollars 2015 2016 2017 2018 2019Free operating cash flow $ 5,027 $ 4,497 $ 4,187 $ 4,419 $ 4,086 Add: Sustaining (maintenance and HSE) capital expenditures 815 1,109 1,019 1,052 1,036 Net cash provided by operating activities 5,842$ 5,606$ 5,206$ 5,471$ 5,122$
For the Years Ended December 31,

www.lyondellbasell.com
Free Cash Flow Yield
27
Calculation of Free Operating Cash Flow Yield
Year Ended
In Millions of Dollars (except share data)December 31,
2018Net cash provided by operating activities $ 5,471 Less: Sustaining (maintenance and HSE) capital expenditures 1,052 Free operating cash flow $ 4,419
Divided by:
Market capital:Common stock outstanding 375,696,661 Closing share price, end of period $ 83.16 Market capital $ 31,243
Free operating cash flow yield 14.1%
www.lyondellbasell.com
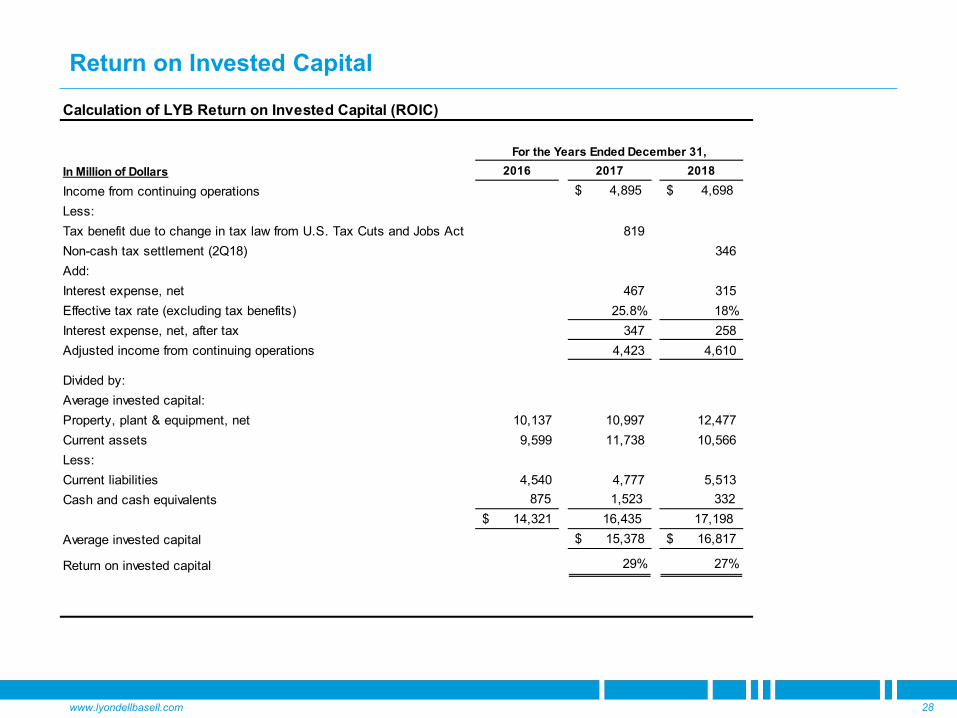
Return on Invested Capital
28
Calculation of LYB Return on Invested Capital (ROIC)
In Million of Dollars 2016 2017 2018Income from continuing operations $ 4,895 $ 4,698 Less: Tax benefit due to change in tax law from U.S. Tax Cuts and Jobs Act 819 Non-cash tax settlement (2Q18) 346 Add:Interest expense, net 467 315 Effective tax rate (excluding tax benefits) 25.8% 18%Interest expense, net, after tax 347 258 Adjusted income from continuing operations 4,423 4,610
Divided by:Average invested capital:Property, plant & equipment, net 10,137 10,997 12,477 Current assets 9,599 11,738 10,566 Less:Current liabilities 4,540 4,777 5,513 Cash and cash equivalents 875 1,523 332
$ 14,321 16,435 17,198 Average invested capital $ 15,378 $ 16,817
Return on invested capital 29% 27%
For the Years Ended December 31,

www.lyondellbasell.com
Cash and Liquid Investments and Total Liquidity
29
In Millions of DollarsMarch 31,
2019Cash and cash equivalents and restricted cash and cash equivalents $ 358 Short-term investments 423 Repurchase agreements 534
Cash and liquid investments 1,315 Availibility under Three-Year Term Loan 4,000 Availability under Senior Revolving Credit Facility 2,240 Availability under U.S Receivables Facility 797
Total liquidity $ 8,352
Components of Cash and Liquid Investments and Total Liquidity

www.lyondellbasell.com
Dividends and Share Repurchases
30
In Millions of Dollars 2014 2015 2016 2017 2018Dividends $ 1,403 $ 1,410 $ 1,395 $ 1,415 $ 1,554 Repurchases of ordinary shares 5,788 4,656 2,938 866 1,854 Total 7,191$ 6,066$ 4,333$ 2,281$ 3,408$
Schedule of Spending for Dividends and Share Repurchases
For the Years Ended December 31,

www.lyondellbasell.com
Cash from Operating Activities as a Percent of Average Enterprise Value
31
Cash from Operating Activities as a Percent of Average Enterprise ValueLast Twelve
Months EndedMarch 31,
In Millions of Dollars, except share amounts 2014 2015 2016 2017 2018 2019Cash from operating activities $ 6,048 $ 5,842 $ 5,606 $ 5,206 $ 5,471 $ 5,122
Average enterprise value:Common shares outstanding 486,969,402 440,150,069 404,046,331 394,512,054 375,696,661 370,326,103 Daily average closing price $ 93.66 $ 91.47 $ 81.00 $ 92.00 105.57 99.41Market capitalization 45,610 40,261 32,728 36,295 39,662 36,814
Current maturities of long-term debt 4 4 2 2 5 5 Short-term debt 346 353 594 68 885 2,377 Long-term debt 6,695 7,671 8,385 8,549 8,497 7,522
Less:Cash and cash equivalents 1,031 924 875 1,523 332 339 Short-term investments 1,593 1,064 1,147 1,307 892 423 Net debt 4,421 6,040 6,959 5,789 8,163 9,142
Redeemable non-controlling interests 116 116 Non-controlling interests 30 24 25 1 23 22 Average enterprise value 50,061$ 46,325$ 39,712$ 42,085$ 47,964$ 46,094$
Cash from operating activities as a percent of enterprise value 12% 13% 14% 12% 11% 11%
For the Years Ended December 31,