goldman sachs industrials and materials conference
TRANSCRIPT

PUBLIC
Goldman Sachs Industrials and Materials Conference
May 11, 2021

PUBLIC| Copyright ©2021 Rockwell Automation, Inc. |
THIS PRESENTATION INCLUDES GUIDANCE AND OTHERSTATEMENTS RELATED TO THE EXPECTED FUTURE RESULTS OFTHE COMPANY AND ARE THEREFORE FORWARD-LOOKINGSTATEMENTS. ACTUAL RESULTS MAY DIFFER MATERIALLY FROMTHOSE PROJECTIONS DUE TO A WIDE RANGE OF RISKS ANDUNCERTAINTIES, MANY OF WHICH ARE BEYOND OUR CONTROL,INCLUDING THE SEVERITY AND DURATION OF THE IMPACTS OFTHE COVID-19 PANDEMIC AND EFFORTS TO MANAGE IT ON THEGLOBAL ECONOMY, LIQUIDITY AND FINANCIAL MARKETS, DEMANDFOR OUR HARDWARE AND SOFTWARE PRODUCTS, SOLUTIONSAND SERVICES, OUR SUPPLY CHAIN, OUR WORK FORCE, OURLIQUIDITY AND THE VALUE OF THE ASSETS WE OWN, AS WELL ASTHOSE RISKS AND UNCERTAINTIES THAT ARE LISTED IN OUR SECFILINGS.
THIS PRESENTATION ALSO CONTAINS NON-GAAP FINANCIALINFORMATION AND RECONCILIATIONS TO GAAP ARE INCLUDED INTHE APPENDIX. ALL INFORMATION SHOULD BE READ INCONJUNCTION WITH OUR HISTORICAL FINANCIAL STATEMENTS.
Safe Harbor Statement
2 2

3PUBLIC | Copyright ©2020 Rockwell Automation, Inc. |
Our strategy is to bring the Connected Enterprise to life
We integrate control and
information across the enterprise
to help industrial companies and
their people be more productive
and sustainable.
24k Employees: more than half outside the U.S.
SERVING CUSTOMERS FOR 117 YEARS
At a glance $6.3B 2020sales
BY REGION BY SEGMENT
EMEA20%
North America
59%
Asia Pacific
14%
Latin America7%
BY INDUSTRY
Global
100+Number of countries
Total shareowner return
World’s Most Ethical Companies
ProcessDiscrete
Hybrid~40%
~35%~25%
Intelligent Devices
$2.9B
Software and Control
$1.7B
100
800
2008 2020
Rockwell AutomationS&P 500 Index
The 50 best places to work for innovators
Lifecycle Services
$1.7B

PUBLIC| Copyright ©2021 Rockwell Automation, Inc. |
Q2 FY21 Results Highlights
4
▪ Record orders of $2B; total backlog up over 30% YOY
▪ Reported sales up 5.6% YOY; acquisitions contributed 1.9%
▪ Organic sales up 1.3% YOY– Information Solutions & Connected Services (IS/CS) orders and sales up double digits YOY, led by
strong IS software growth– Strength in Food & Beverage, e-Commerce, Life Sciences and Semiconductor
▪ Annual Recurring Revenue (ARR) up double digits
▪ Segment margin flat YOY, with higher sales offset by reinstatement of incentive compensation
▪ Adjusted EPS of $2.41, down (2)% YOY and better than expected– EPS performance driven by higher sales, favorable mix and timing of spend– Includes ~$0.45 headwind from higher incentive compensation
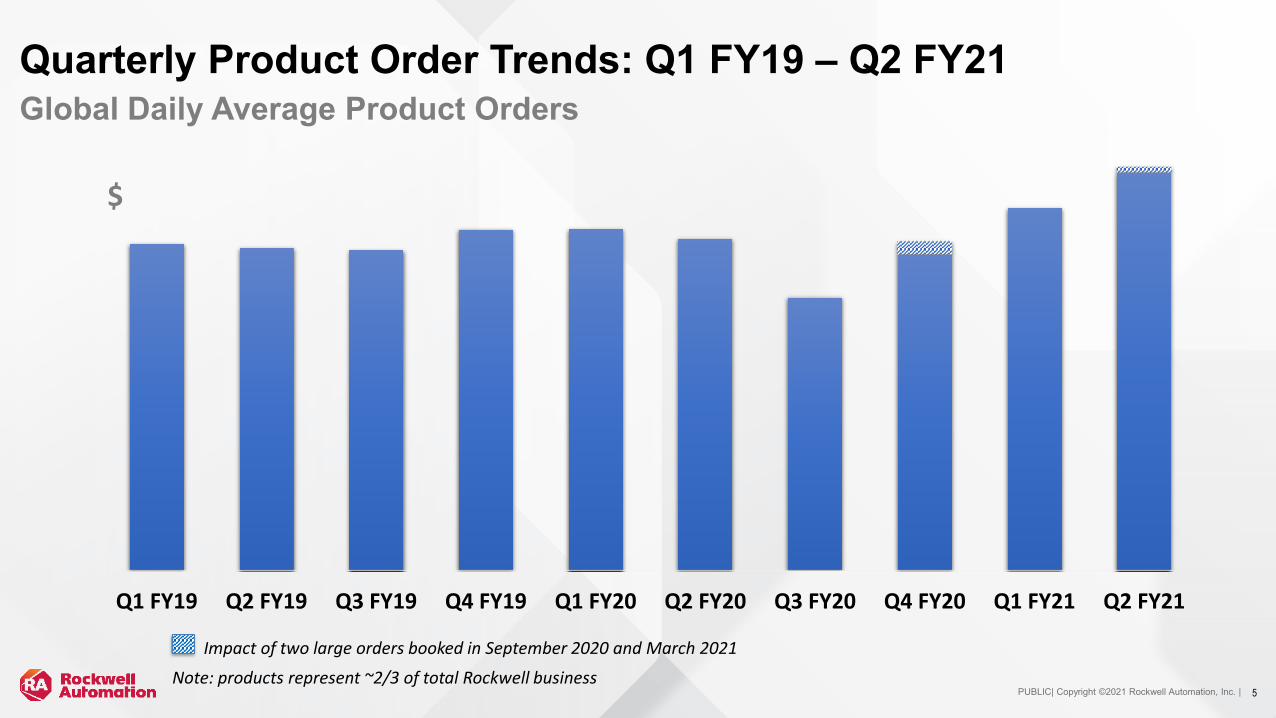
Continued significant orders momentum
PUBLIC| Copyright ©2021 Rockwell Automation, Inc. | 5
Impact of two large orders booked in September 2020 and March 2021
Quarterly Product Order Trends: Q1 FY19 – Q2 FY21Global Daily Average Product Orders
Note: products represent ~2/3 of total Rockwell business
Q1 FY19 Q2 FY19 Q3 FY19 Q4 FY19 Q1 FY20 Q2 FY20 Q3 FY20 Q4 FY20 Q1 FY21 Q2 FY21
$

6PUBLIC | Copyright ©2020 Rockwell Automation, Inc. |
Financial Framework
Framework for long-term profitable growthTargeting double-digit Adjusted EPS growth
FY16
$5.9B sales Core growth at 2x IPHistorical growth at 1.8x of IP 2000 - 2019
Process technology
Automation software portfolio
New visualization offerings
High-performance drives
Independent Cart Technology
Double-digit growth in IS/CSFactoryTalk Innovation Suite
Cybersecurity technology and expertise
Value-added services
1%+ from inorganic growthSensia Digital Oilfield JV
Emulate 3D Simulation Software
Priorities:• Information Solutions / Connected Services• Process expertise • Europe and Asia market access
$9B+ sales• 30-35% earnings conversion at mid-single-digits organic growth
• EPS growth > sales growth• FCF yield > (WACC + risk
premium) by years 3-5• FCF conversion ~100%• ROIC>20%• Discipline around leverage

7PUBLIC | Copyright ©2020 Rockwell Automation, Inc. |
Nobody is better positioned to help customers drive productivity and build resiliencyROK Well Aligned to Long-Term Growth Trends
+ ++MaintainOperate
F l e x i b i l i t yDesignA g i l i t y S a f e t y & S e c u r i t y
• Design lines to run multiple products and packaging sizes for consumer preferences
• Virtually build and test control systems to reduce prototypes
• Simulate throughput scenarios under various market conditions
• Faster time to market with a modular and scalable control platform
• Optimize production workflows to allow social distancing
• Manage supply chains in real time to quickly align inventory levels with changing demand
• Enable secure remote operations to reduce human contact points
• Reduce on-site maintenance needs through predictive analytics
• Deploy augmented reality and virtual training to resolve complex issues and accelerate onboarding
• Monitor critical assets remotely
Lifecycle ServicesC o n s u l t i n g P r o f e s s i o n a l S e r v i c e s C o n n e c t e d S e r v i c e s M a i n t e n a n c e S e r v i c e s

8PUBLIC | Copyright ©2020 Rockwell Automation, Inc. |
More ways to win
Intelligent Devices
• New High-Performance Drives to serve a $5B market
• Disruptive Independent Cart Motion Technology
• Global Leader in Safety
Software & Control Lifecycle Services
• Fastest growing, highest margin segment• New Logix process controller• Strategic digital twin wins• Successful PTC partnership,
exciting new acquisitions• New Cloud-native SaaS offerings in
FY21, including Fiix acquisition
Share gains in core platforms
High-single-digit growth in FY21,
Double-digit ARR growth
100% services attach rate on every large project
Earning our value19%
5-year annualized TSR; leads peer group
100%+ free cash flow conversion
last 9 years
36%average ROIC over last 5 years
• Expertise to insure positive business outcomes
• Digital transformation consulting services• Fast-growing OT cybersecurity business

9PUBLIC | Copyright ©2020 Rockwell Automation, Inc. | PUBLIC| Copyright ©2021 Rockwell Automation, Inc. |
Updated FY21 Guidance
9
April Guidance
January Guidance
Sales Midpoint ~ $7.0B ~ $6.9B
Reported Growth Range 9.0% - 12.0% 8.5% - 11.5%
Organic Growth Range 5.5% - 8.5% 4.5% - 7.5%
Inorganic Growth ~ 1.5% ~ 1.5%
Currency Translation ~ 2.0% ~ 2.5%
Segment Operating Margin ~ 19.5% ~ 19.5%
Adjusted Effective Tax Rate ~ 14% ~ 14%
Adjusted EPS1 $8.95 - $9.35 $8.70 - $9.10
Free Cash Flow as a % of Adjusted Income ~ 100% ~ 100%
Note: As of April 28, 2021
1 This compares to fiscal 2020 Adjusted EPS of $7.87 under the new definition. A reconciliation of fiscal 2020 diluted EPS to Adjusted EPS in the new definition is included on page 25.

PUBLIC| Copyright ©2021 Rockwell Automation, Inc. |
% of FY21 Sales
FY21vs. FY20 Assumptions at Guidance Midpoint
B/(W) vs. Jan Guidance
~ 25% Up ~15% Automotive up ~10% Semiconductor up mid teens e-Commerce up strong double digits
+
FY21 Organic Industry Segment Outlook
10
Discrete
Hybrid
Process
Note: Organic sales growth rates depicted above exclude the impact of acquisitions and currency. Arrows reflect positive/negative directional growth vs prior year
Note: Guidance as of April 28, 2021
~ 45% Up ~10% Food & Beverage up ~10% Life Sciences up ~20% Tire up mid teens
+
~ 30% Down mid single digits
Oil & Gas down mid teens Mining/Aggregates/Cement up high
single digits Chemicals up mid single digits
-

Appendix Supplemental Financial Information and Reconciliations to Non-GAAP Measures
11

PUBLIC| Copyright ©2021 Rockwell Automation, Inc. | 12
Q2 FY21 Results: Summary($ in millions, except per share amounts) Q2 2021 Q2 2020Total Sales $ 1,776.1 $ 1,681.3Total segment operating earnings $ 390.1 $ 371.5Purchase accounting depreciation and amortization (13.1) (9.5)Corporate and other (30.4) (17.7)Non-operating pension and postretirement benefit cost (7.0) (8.6)Change in fair value of investments1 190.9 (144.8)Interest (expense) income, net (22.8) (23.5)Income tax provision (97.4) (37.5)Net income $ 410.3 $ 129.9Net (loss) income attributable to noncontrolling interests (4.7) (2.3)Net income attributable to Rockwell Automation $ 415.0 $ 132.2AdjustmentsNon-operating pension and postretirement benefit cost, net of tax 5.0 6.2Change in fair value of investments1 (190.9) 144.8Tax effect of change in fair value of investments1 46.1 —Purchase accounting depreciation and amortization attributable to Rockwell Automation 10.1 6.5Tax effect of purchase accounting depreciation and amortization attributable to Rockwell Automation (2.5) (1.6)Adjusted Income $ 282.8 $ 288.1Adjusted EPS $ 2.41 $ 2.47
Average Diluted Shares 117.1 116.6
1Primarily relates to the change in value of our investment in PTC.

PUBLIC| Copyright ©2021 Rockwell Automation, Inc. | 13
Free Cash FlowThree Months Ended Six Months Ended
($ in millions) Q2 2021 Q2 2020 Q2 2021 Q2 2020Net Income $ 410 $ 130 $ 1,001 $ 445Depreciation/Amortization 46 42 90 84Change in fair value of investments1 (191) 145 (581) 74Retirement Benefits Expense 30 32 60 63Receivables/Inventory/Payables (50) (12) (155) (95)Compensation and Benefits 55 (61) 63 (99)Pension Contributions (10) (10) (19) (17)Income Taxes (40) (62) 33 (79)Other (1) 13 103 73Cash Flow From Operations 249 217 595 449Capital Expenditures (25) (19) (52) (57)Free Cash Flow $ 224 $ 198 $ 543 $ 392Adjusted Income $ 283 $ 288 $ 562 $ 540Free Cash Flow as a % of Adjusted Income 79 % 69 % 97 % 73 %
1Primarily relates to the change in value of our investment in PTC.

PUBLIC| Copyright ©2021 Rockwell Automation, Inc. | 14
Reconciliation to Non-GAAP Measures
Organic Sales($ in millions)
Three Months Ended March 31,2021 2020
Sales(a)Effect of
Acquisitions(e)
Effect ofChanges inCurrency(d)
OrganicSales(b) Sales(c)
Reported Sales Growth
(Decline)(a)/(c)
Acquisition Growth
(Decline)(e)/(c)
Currency Growth
(Decline) (d)/(c)
Organic Growth (Decline)(b)/(c)
North America $ 1,065.7 $ (13.4) $ (6.4) $ 1,045.9 $ 1,022.1 4.3% 1.3% 0.7% 2.3%EMEA 354.8 (18.7) (26.2) 309.9 333.6 6.4% 5.6% 7.9% (7.1)%Asia Pacific 246.9 — (14.8) 232.1 200.8 23.0% —% 7.4% 15.6%Latin America 108.7 (0.1) 6.0 114.6 124.8 (12.9)% 0.1% (4.8)% (8.2)%
Total $ 1,776.1 $ (32.2) $ (41.4) $ 1,702.5 $ 1,681.3 5.6% 1.9% 2.4% 1.3%
Three Months Ended March 31,2021 2020
Sales(a)Effect of
Acquisitions(e)
Effect ofChanges inCurrency(d)
OrganicSales(b) Sales(c)
Reported Sales Growth
(Decline)(a)/(c)
Acquisition Growth
(Decline)(e)/(c)
Currency Growth
(Decline) (d)/(c)
Organic Growth (Decline)(b)/(c)
Intelligent Devices $ 850.2 $ — $ (20.0) $ 830.2 $ 785.0 8.3% —% 2.5% 5.8%Software & Control 502.3 (17.3) (11.7) 473.3 448.2 12.1% 3.9% 2.6% 5.6%Lifecycle Services 423.6 (14.9) (9.7) 399.0 448.1 (5.5)% 3.3% 2.2% (11.0)%
Total $ 1,776.1 $ (32.2) $ (41.4) $ 1,702.5 $ 1,681.3 5.6% 1.9% 2.4% 1.3%

PUBLIC| Copyright ©2021 Rockwell Automation, Inc. | 15
Reconciliation to Non-GAAP MeasuresSegment Operating Margin($ in millions) Three Months Ended
March 31, 2021 March 31, 2020Sales
Intelligent Devices (a) $ 850.2 $ 785.0Software & Control (b) 502.3 448.2Lifecycle Services (c) 423.6 448.1
Total sales (d) $ 1,776.1 $ 1,681.3Segment operating earnings
Intelligent Devices (e) $ 202.0 $ 180.7Software & Control (f) 149.8 136.8Lifecycle Services (g) 38.3 54.0
Total segment operating earnings1 (h) 390.1 371.5Purchase accounting depreciation and amortization (13.1) (9.5)Corporate and other (30.4) (17.7)Non-operating pension and postretirement benefit cost (7.0) (8.6)Change in fair value of investments 190.9 (144.8)Interest (expense) income, net (22.8) (23.5)Income before income taxes (i) $ 507.7 $ 167.4
Segment operating margin:Intelligent Devices (e/a) 23.8 % 23.0 %Software & Control (f/b) 29.8 % 30.5 %Lifecycle Services (g/c) 9.0 % 12.1 %
Total segment operating margin1 (h/d) 22.0 % 22.1 %Pretax margin (i/d) 28.6 % 10.0 %
1Total segment operating earnings and total segment operating margin are non-GAAP financial measures. We excludepurchase accounting depreciation and amortization, corporate and other, non-operating pension and postretirementbenefit cost, gains and losses on investments, the $70 million legal settlement in fiscal 2021, certain corporate initiatives,interest (expense) income - net and income tax provision because we do not consider these costs to be directly related tothe operating performance of our segments. We believe total segment operating earnings and total segment operatingmargin are useful to investors as measures of operating performance. We use these measures to monitor and evaluatethe profitability of our operating segments. Our measures of total segment operating earnings and total segmentoperating margin may be different from measures used by other companies.

PUBLIC| Copyright ©2021 Rockwell Automation, Inc. | 16
Reconciliation to Non-GAAP MeasuresAdjusted Income, Adjusted EPS, and Adjusted Effective Tax Rate($ in millions, except per share amounts) Three Months Ended
March 31, 2021 March 31, 2020Net Income attributable to Rockwell Automation $ 415.0 $ 132.2
Non-operating pension and postretirement benefit cost 7.0 8.6Tax effect of non-operating pension and postretirement benefit cost (2.0) (2.4)Change in fair value of investments (190.9) 144.8Tax effect of change in fair value of investments 46.1 —Purchase accounting depreciation and amortization attributable to Rockwell Automation 10.1 6.5Tax effect of purchase accounting depreciation and amortization attributable to Rockwell Automation (2.5) (1.6)
Adjusted Income $ 282.8 $ 288.1
Diluted EPS $ 3.54 $ 1.13Non-operating pension and postretirement benefit cost 0.06 0.08Tax effect of non-operating pension and postretirement benefit cost (0.02) (0.02)Change in fair value of investments (1.63) 1.24Tax effect of change in fair value of investments 0.39 —Purchase accounting depreciation and amortization attributable to Rockwell Automation 0.09 0.06Tax effect of purchase accounting depreciation and amortization attributable to Rockwell Automation (0.02) (0.03)
Adjusted EPS $ 2.41 $ 2.46
Effective Tax Rate 19.2 % 22.4 %Tax effect of non-operating pension and postretirement benefit cost 0.1 0.2Tax effect of change in fair value of investments (2.9) (10.2)Tax effect of purchase accounting depreciation and amortization attributable to Rockwell Automation 0.3 0.2
Adjusted Effective Tax Rate 16.7 % 12.6 %
Non-operating pension and postretirement benefit cost(in millions) Three Months Ended
March 31, 2021 March 31, 2020Interest cost $ 31.8 $ 34.5Expected return on plan assets (60.7) (61.2)Amortization of prior service credit (1.0) (1.0)Amortization of net actuarial loss 37.1 37.1Settlements (0.2) (0.7)Non-operating pension and postretirement benefit cost $ 7.0 $ 8.7

PUBLIC| Copyright ©2021 Rockwell Automation, Inc. | 17
Reconciliation to Non-GAAP MeasuresReturn On Invested Capital($ in millions)
Twelve Months EndedMarch 31,
2021 2020(a) ReturnNet income $ 1,578.6 $ 714.8Interest expense 97.5 105.7Income tax provision 263.9 165.0Purchase accounting depreciation and amortization 46.7 27.7
Return 1,986.7 1,013.2
(b) Average invested capitalShort-term debt 141.0 260.9Long-term debt 1,975.6 1,950.6Shareowners’ equity 1,475.3 974.3Accumulated amortization of goodwill and intangibles 952.3 898.1Cash and cash equivalents (725.7) (831.0)Short-term and long-term investments (0.6) (79.8)
Average invested capital 3,817.9 3,173.1
(c) Effective tax rateIncome tax provision 263.9 165.0Income before income taxes $ 1,842.5 $ 879.8
Effective tax rate 14.3 % 18.8 %(a) / (b) * (1-c) Return On Invested Capital 44.6 % 25.9 %

PUBLIC| Copyright ©2021 Rockwell Automation, Inc. |
Reconciliation to Non-GAAP MeasuresFiscal 2021 Guidance($ in billions, except per share amounts)
Organic Sales Fiscal 2021 GuidanceOrganic sales growth 5.5% - 8.5%Inorganic sales growth ~ 1.5%Foreign currency impact ~ 2.0%Reported sales growth 9.0% - 12.0%
Segment Operating MarginTotal sales (a) $ ~ 7.0Total segment operating earnings (b) ~ 1.4(Income)/costs not allocated to segments ~ (0.4)Income before income taxes (c) $ ~ 1.8Total segment operating margin (b/a) ~ 19.5 %Pretax margin (c/a) ~ 25.5 %Adjusted Effective Tax RateEffective tax rate ~ 15.4 %Tax effect of non-operating pension and postretirement benefit cost ~ 0.2 %Tax effect of change in fair value of investments1 ~ (1.8)%Tax effect of purchase accounting depreciation and amortization attributable to Rockwell Automation ~ 0.2 %Adjusted Effective Tax Rate ~ 14.0 %
Adjusted EPS(2)
Diluted EPS $12.53 - $12.93Non-operating pension and postretirement benefit cost 0.24Tax effect of non-operating pension and postretirement benefit cost (0.07)Change in fair value of investments1 (4.96)Tax effect of change in fair value of investments1 0.95Purchase accounting depreciation and amortization attributable to Rockwell Automation 0.34Tax effect of purchase accounting depreciation and amortization attributable to Rockwell Automation (0.08)Adjusted EPS $8.95 - $9.35
1The actual year-to-date adjustments, which are based on PTC's share price at March 31, 2021, are used for guidance, as estimates ofthese adjustments on a forward-looking basis are not available due to variability, complexity and limited visibility of these items.2Fiscal 2021 guidance based on Adjusted Income attributable to Rockwell, which includes an adjustment for Schlumberger's non-controllinginterest in Sensia.
18

PUBLIC| Copyright ©2021 Rockwell Automation, Inc. | 19
New Definition of Adjusted Income and Adjusted EPS• Beginning in fiscal 2021, Rockwell is changing its definition of Adjusted Income and Adjusted EPS
• New definition will also exclude the impact of purchase accounting depreciation and amortization expense attributable to Rockwell Automation and the related tax effects of such exclusion
• The definition of Adjusted Effective Tax Rate is also changing to correspond to the purchase accounting items now being excluded from Adjusted Income
Fiscal 2020 Q2 2021 Fiscal 2021Results Results Guidance
Diluted EPS $ 8.77 $ 3.54 $12.53 - $12.93Non-operating pension and postretirement benefit cost 0.32 0.06 0.24Tax effect of non-operating pension and postretirement benefit cost (0.09) (0.02) (0.07)Change in fair value of investments1 (1.32) (1.63) (4.96)Tax effect of change in fair value of investments1 — 0.39 0.95Purchase accounting depreciation and amortization attributable to Rockwell Automation 0.25 0.09 0.34Tax effect of purchase accounting depreciation and amortization attributable to Rockwell Automation (0.06) (0.02) (0.08)
Adjusted EPS2 $ 7.87 $ 2.41 $8.95 - $9.35
Effective Tax Rate 9.9 % 19.2 % ~ 15.4%Tax effect of non-operating pension and postretirement benefit cost 0.6 0.1 ~ 0.2Tax effect of change in fair value of investments1 1.5 (2.9) ~ (1.8)Tax effect of purchase accounting depreciation and amortization expense attributable to Rockwell Automation 0.4 0.3 ~ 0.2
Adjusted Effective Tax Rate 12.4 % 16.7 % ~ 14.0%
1The actual year-to-date adjustments, which are based on PTC's share price at March 31, 2021, are used for guidance, as estimates of these adjustments on a forward-looking basis are not available due to variability, complexity and limited visibility of these items.2Fiscal 2021 guidance based on Adjusted Income attributable to Rockwell, which includes an adjustment for Schlumberger's non-controlling interest in Sensia.

20PUBLIC | Copyright ©2020 Rockwell Automation, Inc. | PUBLIC
Thank youGoldman Sachs Industrials and Materials Conference
May 11, 2021