goal 8 promote sustained, inclusive and sustainable economic … · · 2016-06-281| page goal 8...
TRANSCRIPT

1| P a g e
Goal 8 Promote sustained, inclusive and sustainable economic growth, full and productive employment and decent work for all
(Updated on 7 March 2016)
Table of Contents
Target 8.1 Sustain per capita economic growth in accordance with national circumstances and, in particular, at least 7 per cent gross domestic product growth per annum in the least developed countries. ................................................................ 2
Target 8.2 Achieve higher levels of economic productivity through diversification, technological upgrading and innovation, including through a focus on high-value-added and labour-intensive sectors. .................................................. 3
Target 8.3 Promote development-oriented policies that support productive activities, decent job creation, entrepreneurship, creativity and innovation, and encourage the formalization and growth of micro-, small- and medium-sized enterprises, including through access to financial services. .......................................................................................... 5
Target 8.4 Improve progressively, through 2030, global resource efficiency in consumption and production and endeavour to decouple economic growth from environmental degradation, in accordance with the 10-year framework of programmes on sustainable consumption and production, with developed countries taking the lead. ................................. 7
Target 8.5 By 2030, achieve full and productive employment and decent work for all women and men, including for young people and persons with disabilities, and equal pay for work of equal value. .......................................................... 10
Target 8.6 By 2020, substantially reduce the proportion of youth not in employment, education or training. .................. 12
Target 8.7Take immediate and effective measures to eradicate forced labour, end modern slavery and human trafficking and secure the prohibition and elimination of the worst forms of child labour, including recruitment and use of child soldiers, and by 2025 end child labour in all its forms. ........................................................................................................ 13
Target 8.8 Protect labour rights and promote safe and secure working environments for all workers, including migrant workers, in particular women migrants, and those in precarious employment. .................................................................. 15
Target 8.9By 2030, devise and implement policies to promote sustainable tourism that creates jobs and promotes local culture and products. ............................................................................................................................................................. 46
Target 8.10 Strengthen the capacity of domestic financial institutions to encourage and expand access to banking, insurance and financial services for all. ................................................................................................................................ 50
Target 8.a Increase Aid for Trade support for developing countries, in particular least developed countries, including through the Enhanced Integrated Framework for Trade-Related Technical Assistance to Least Developed Countries. ... 53
Target 8.b By 2020, develop and operationalize a global strategy for youth employment and implement the Global Jobs Pact of the International Labour Organization. .................................................................................................................... 54

2| P a g e
Target 8.1 Sustain per capita economic growth in accordance with national circumstances and, in particular, at least 7 per cent gross domestic product growth per annum in the least developed countries. Indicator 8.1.1: Annual growth rate of real GDP per capita No metadata received on current indicator formulation.

3| P a g e
Target 8.2 Achieve higher levels of economic productivity through diversification, technological upgrading and innovation, including through a focus on high-value-added and labour-intensive sectors.
Indicator 8.2.1: Annual growth rate of real GDP per employed person From ILO: Definitionandmethodofcomputation
Thisindicatorisameasureoflabourproductivitygrowth,whichiscomputedastheannualgrowthrateof: Gross Domestic Product (GDP) at market prices for the aggregate economy divided by totalemployment.Employmentreferstotheaveragenumberofpersonswithoneormorepaidjobsduringtheyear.
Rationaleandinterpretation
Economicgrowthinacountrycanbeascribedeithertoincreasedemploymentortomoreproductiononaveragebythosewhoareemployed.Thelattereffectcanbedescribedthroughstatisticsonlabourproductivityandtherebyitisakeymeasureofeconomicandlabourmarketperformance.
Sourcesanddatacollection
GDPfiguresbasedonNationalAccountsandemploymentfiguresonHouseholdsurveys.
Disaggregation
Disaggregationbyeconomicsectorisfeasible.Nosexdisaggregation.
Commentsandlimitations
DespitecommonprinciplesthataremostlybasedontheUnitedNationsSystemofNationalAccounts,there are still significant problems in international consistency of national accounts estimates, inparticularforeconomiesoutsidetheOECD.This includes:1)differenttreatmentofoutputinservicessectors:2)differentproceduresincorrectingoutputmeasuresforpricechanges,inparticulartheuseofdifferentweightingsystemsinobtainingdeflators;3)differentdegreeofcoverageofinformaleconomicactivities in developing economies and of the underground economy in developed (industrialized)economies in national accounts. As in the case of output estimates, the employment estimates aresensitivetounder‐coverageofinformalorundergroundactivities.
Genderequalityissues
Thisindicatorisnotrelevantforidentifyinggenderequalityissues.
Dataforglobalandregionalmonitoring
TheILOproducesglobaland(flexible)regionalestimatesoflabourproductivitygrowth.
Responsibleentities
ILO.

4| P a g e
Currentdataavailability
TheILOhasdatafor124countries.

5| P a g e
Target 8.3 Promote development-oriented policies that support productive activities, decent job creation, entrepreneurship, creativity and innovation, and encourage the formalization and growth of micro-, small- and medium-sized enterprises, including through access to financial services. Indicator 8.3.1: Proportion of informal employment in non-agriculture employment, by sex From ILO: Definition and method of computation The share of informal employment in total non-agriculture employment refers to employment in informal jobs expressed as a percentage of total non-agriculture employment. Informal employment comprises persons who in their main or secondary jobs were: (a) Own-account workers, employers and members of producers’ cooperatives employed in their own informal sector enterprises. The informal nature of their jobs follows directly from the characteristics of the enterprise; (b) Own-account workers engaged in the production of goods exclusively for own final use by their household (e.g. subsistence farming or do-it-yourself construction of own dwellings), if covered; (c) Contributing family workers, irrespective of whether they work in formal or informal sector enterprises. The informal nature of their jobs is due to the fact that contributing family workers usually do not have explicit, written contracts of employment, and that usually their employment is not subject to labour legislation, social security regulations, collective agreements, etc.; (e) Employees holding informal jobs, whether employed by formal sector enterprises, informal sector enterprises, or as paid domestic workers by households. Employees are considered to have informal jobs if their employment relationship is, in law or in practice, not subject to national labour legislation, income taxation, social protection or entitlement to certain employment benefits (paid annual or sick leave, etc.) for reasons such as: non-declaration of the jobs or the employees; casual jobs or jobs of a limited short duration; jobs with hours of work or wages below a specified threshold (e.g. for social security contributions); employment by unincorporated enterprises or by persons in households; jobs where the employee’s place of work is outside the premises of the employer’s enterprise (e.g. outworkers without employment contract); or jobs, for which labour regulations are not applied, not enforced, or not complied with for any other reason. Operational criteria used by countries to define informal jobs of employees include lack of coverage by social security system, lack of entitlement to paid annual or sick leave, or lack of written employment contract. Rationale and interpretation This is considered an important indicator regarding the quality of employment in an economy, and is relevant to developing and developed countries alike. A decreasing share of informal employment indicates progress as regards the proportion of persons employed that generally lack basic social or legal protections or employment benefits, whether they work in the formal sector, informal sector, or households. Sources and data collection Household surveys (LFS, HIES, LSMS, Integrated HH surveys, etc.). Disaggregation Data are available by sex. Comments and limitations Given that informal employment is a job-based concept and encompasses those jobs that generally lack basic social or legal protections or employment benefits, which may be found in the formal sector, informal sector or households, the preferred official national data source for this indicator is a household-based labour force survey including the necessary questions specifically designed to capture all the relevant information. Other household surveys with an appropriate employment module including questions targeting informal employment can also be used to obtain the required data. This has a clear impact on data availability, since such collections are not necessarily in place in all countries. Also, given its relatively low volatility, the frequency of data collection and dissemination for the share of informal employment could be less than that required for other key labour market indicators. Furthermore, as informal employment is comprised of several component categories defined by status in employment and type of production unit, it would always be best to analyse this indicator along with statistical information on the levels and changes of its components, since the conclusions might vary significantly depending on these. Gender equality issues As this indicator is disaggregated by sex, it is well-suited for analysis of gender equality issues. Data for global and regional monitoring The ILO does not currently produce global and regional estimates on informal employment. Supplementary information and references For details, refer to the Resolution concerning statistics of employment in the informal sector, available at:

6| P a g e
http://www.ilo.org/global/statistics-and-databases/standards-and-guidelines/resolutions-adopted-by-international-conferences-of-labour-statisticians/WCMS_087484/lang--en/index.htm ; the Guidelines concerning a statistical definition of informal employment, available at http://www.ilo.org/wcmsp5/groups/public/---dgreports/---stat/documents/normativeinstrument/wcms_087622.pdf ; and the ILO manual Measuring informality: A statistical manual on the informal sector and informal employment, available at: http://www.ilo.org/wcmsp5/groups/public/---dgreports/---dcomm/---publ/documents/publication/wcms_222979.pdf Handbook on Measuring Quality of Employment: A Statistical Framework. (UNECE- CES) http://www.unece.org/fileadmin/DAM/stats/documents/ece/ces/2015/4_Add.2_Rev1_Guidelines_on_QoEmployment.pdf Responsible entities ILO. Current data availability The ILO has data on the share of informal employment for 62 countries.

7| P a g e
Target 8.4 Improve progressively, through 2030, global resource efficiency in consumption and production and endeavour to decouple economic growth from environmental degradation, in accordance with the 10-year framework of programmes on sustainable consumption and production, with developed countries taking the lead. Indicator 8.4.1: Material footprint, material footprint per capita, and material footprint per GDP Indicator 8.4.2: Domestic material consumption, domestic material consumption per capita, and domestic material consumption per GDP From UNEP (both indicators): Indicators
Domestic Material Consumption (DMC) per-capita Material Footprint (MF) per capita Goal and targets addressed
Goal 12 Ensure sustainable consumption and production patterns Target 12.2 By 2030, achieve the sustainable management and efficient use of natural resources
Definition and method of computation
Domestic Material Consumption (DMC) is a standard material flow accounting (MFA) indicator and reports the apparent consumption of materials in a national economy. It is calculated as direct imports (IM) of material plus domestic extraction (DE) of materials minus direct exports (EX) of materials measured in metric tonnes. DMC measures the amount of materials that are used in economic processes. It does not include materials that are mobilized the process of domestic extraction but do not enter the economic process. DMC is based on official economic statistics and it requires some modelling to adapt the source data to the methodological requirements of the MFA. The accounting standard and accounting methods are set out in the EUROSTAT guidebooks for MFA accounts in the latest edition of 2013. MFA accounting is also part of the central framework of the System of integrated Environmental‐Economic Accounts (SEEA). Material footprint (MF) is the attribution of global material extraction to domestic final demand of a country. It is calculated as raw material equivalent of imports (RMEIM) plus domestic extraction (DE) minus raw material equivalents of exports (RMEEX). For the attribution of the primary material needs of final demand a global, multi‐regional input‐output (MRIO) framework is employed. The attribution method based on I‐O analytical tools is described in detail in Wiedmann et al. 2015. It is based on the EORA MRIO framework developed by the University of Sydney, Australia (Lenzen et al. 2013) which is an internationally well‐established and the most detailed and reliable MRIO framework available to date.
Rational and interpretation
DMC reports the amount of materials that are used that are used in a national economy. DMC is a territorial (production side) indicator. DMC also presents the amount of material that needs to be handled within an economy, which is either added to material stocks of buildings and transport infrastructure or used to fuel the economy as material throughput. DMC describes the physical

8| P a g e
dimension of economic processes and interactions. It can also be interpreted as long‐term waste equivalent. Per‐capita DMC describes the average level of material use in an economy – an environmental pressure indicator ‐ and is also referred to as metabolic profile. Material footprint of consumption reports the amount of primary materials required to serve final demand of a country and can be interpreted as an indicator for the material standard of living/level of capitalization of an economy. Per‐capita MF describes the average material use for final demand. DMC and MF need to be looked at in combination as they cover the two aspects of the economy, production and consumption. The DMC reports the actual amount of material in an economy, MF the virtual amount required across the whole supply chain to service final demand. A country can, for instance have a very high DMC because it has a large primary production sector for export or a very low DMC because it has outsourced most of the material intensive industrial processes to other countries. The material footprint corrects for both phenomena.
Sources and data collection
Data is available from different national or international datasets in the domain of agriculture, forestry, fisheries, mining and energy statistics. International statistical sources for DMC and MF include the IEA, USGS, FAO and COMTRADE databases.
Disaggregation The DMC indicator can be disaggregated into imports, domestic extraction and exports by a large number of material follow categories. At the highest level of aggregation biomass, fossil fuels, metal ores and non‐metallic minerals are distinguished. DMC is usually reported for 11 material categories, DE for 44 material categories. The MF indicator can be disaggregated to four main material categories, a varying number of economic sectors whose expenditure require materials and to three domestic final demand sectors (household consumption, government consumption and capital investment) and foreign final demand (i.e. exports). UNEP has available to it data for a four material categories (biomass, fossil fuels, metal ores, non‐metallic minerals) disaggregation of the MF of consumption, for 192 countries. These are currently being made available through the http://www.uneplive.org/materialwebsite.
Comments and limitations
DMC cannot be disaggregated to economic sectors which limits its potential to become a satellite account to the System of National Accounts (SNA).
Data for global and regional monitoring
UNEP is publishing a global material flow dataset which includes the DMC indicator. DMC is available for about 180 countries, the seven UNEP world regions and the world for the time period 1970 – 2010. Data is available at the UNEP online data platform UNEP Live http://www.uneplive.org/material.
Supplementary information
Material footprint is also referred to as Raw Material Consumption (RMC). The DMC indicator and MF indicator are used by EUROSTAT, the government of Japan, the UNEP Office for Asia and the Pacific and the OECD for monitoring their policy efforts in the domains of Sustainable Consumption and Production (SCP), resource Efficiency and Green Economy.
References EUROSTAT (2013). Economy‐wide material flow accounts. Compilation guide 2013. Wiedmann, T., H. Schandl, M. Lenzen, D. Moran, S. Suh, J. West, K. Kanemoto, (2013) The Material Footprint of Nations, Proc. Nat. Acad. Sci. Online before print. Lenzen, M., Moran, D., Kanemoto, K., Geschke, A. (2013) Building Eora: A

9| P a g e
Global Multi‐regional Input‐Output Database at High Country and Sector Resolution, Economic Systems Research, 25:1, 20‐49.

10| P a g e
Target 8.5 By 2030, achieve full and productive employment and decent work for all women and men, including for young people and persons with disabilities, and equal pay for work of equal value. Indicator 8.5.1: Average hourly earnings of female and male employees, by occupation, age and persons with disabilities From ILO: Definition and method of computation The gender wage gap measures the relative difference between the average hourly earnings for men and the average hourly earnings for women. It is computed as the difference between the gross average hourly earnings of male and female employees expressed as percentage of gross average hourly earnings of male employees. Earnings refers to regular remuneration received from employers, in cash and in kind, and includes direct wages and salaries for time worked or work done, remuneration for time not worked (e.g. paid annual leave), as well as bonuses and gratuities that are regularly received. It excludes contributions paid by employers to social security and pension schemes in respect of their employees, benefits received by employees under these schemes, and severance and termination pay. Rationale and interpretation The gender wage gap measures the extent to which the wages of men differ from those of women and therefore directly addresses the target of "equal pay for work of equal value". When the gender pay gap equals “0”, it denotes equality of earnings. Positive values reflect the extent to which women’s earnings fall short of those received by men, where a value closer to “100” denotes more inequality than a value closer to “0”. Negative values reflect the extent to which women’s earnings are higher than men’s. Sources and data collection Household surveys (LFS, HIES, LSMS, Integrated HH surveys, etc.), Establishment surveys, Administrative records. Disaggregation Data are available by gender and occupation. Comments and limitations The gender wage gap is calculated for paid employees only, as earnings data are typically available for employees. Hence, the gender pay gap does not cover large numbers of own-account workers or employers, especially in the informal sector where income differences between men and women may be larger. The gender pay gap does not capture either income differences between the sexes that result from uneven access to paid employment. For instance, when men are over-represented among paid employees (with relatively high incomes) and women are over-represented among the self-employed in the informal sector (with relatively low incomes), the overall gap in incomes is likely to be greater than what can be captured by the gender wage gap. Gender equality issues As this indicator provides a direct comparison of wages between men and women, it is well-suited for analysis of gender equality issues. Data for global and regional monitoring The ILO has estimates of wages for the world as a whole and by regional groupings, although these are not currently disaggregated by gender. Supplementary information and references For details, refer to the Resolution concerning an integrated system of wage statistics, available at: http://www.ilo.org/wcmsp5/groups/public/---dgreports/---stat/documents/normativeinstrument/wcms_087496.pdf Decent Work Indicators: ILO Manual - Second Version, available at: www.ilo.org/wcmsp5/groups/public/---dgreports/---stat/documents/publication/wcms_223121.pdf Responsible entities ILO. Current data availability The ILO has data on hourly earnings and gender wage gap for 66 countries.

11| P a g e
Indicator 8.5.2: Unemployment rate, by sex, age and persons with disabilities From ILO: Definition and method of computation The unemployment rate is calculated by dividing the total number of unemployed (for a country or a specific group of workers) by the corresponding labour force, which itself is the sum of the total persons employed and unemployed in the group. Persons in unemployment are defined as all those of working age who were not in employment, carried out activities to seek employment during a specified recent period and were currently available to take up employment given a job opportunity. Rationale and interpretation Information on unemployment by age illustrates the different dimensions of the lack of jobs for people of a given age group. For example, in a country where the youth unemployment rate is high and the ratio of the youth unemployment rate to the adult unemployment rate is close to one, it may be concluded that the problem of unemployment is not specific to youth, but is country-wide. The problem of unemployment is unequally distributed when, in addition to a high youth unemployment rate, the proportion of youth unemployment in total unemployment is high. In this case, employment policies might usefully be directed towards easing the entry of young people into the world of work. Sources and data collection Household surveys (LFS, HIES, LSMS, Integrated HH surveys, etc.), Official estimates, Administrative records. Disaggregation Data are available by gender and age. Comments and limitations There are a variety of issues affecting cross-country comparability, including but not limited to different sources, measurement differences, conceptual variation, survey coverage and collection methodology. Gender equality issues Information on unemployment by sex shows the difficulty to enter the labour market by gender, revealing in some cases a harder situation for women, which is directly linked to a country's social and cultural aspects and traditions. Data for global and regional monitoring The ILO has estimates of the unemployed (number and rate) disaggregated by sex and age (youth and adult) for the world as a whole and by (flexible) regional groupings. The global and regional estimates are based on both real and imputed values. Supplementary information and references For details, refer to the Resolution concerning statistics of work, employment and labour underutilization, available at http://www.ilo.org/wcmsp5/groups/public/---dgreports/---stat/documents/normativeinstrument/wcms_230304.pdf Responsible entities ILO. Current data availability The ILO has data for 224 countries.

12| P a g e
Target 8.6 By 2020, substantially reduce the proportion of youth not in employment, education or training. Indicator 8.6.1: Proportion of youth (aged 15-24 years) not in education, employment or training From ILO: Definition and method of computation The NEET is defined as the percentage of youth (15-24 years old) who are not in employment and not in education or training. Rationale and interpretation NEET provides a measure of youth who are outside the educational system, not in training and not in employment, and thus serves as a broader measure of potential youth labour market entrants than youth unemployment. A high NEET rate as compared with the youth unemployment rate could mean that a large number of youth are discouraged workers, or do not have access to education or training. A high NEET rate among females as compared with males is often an indication of gender imbalances, with female youth engaged in household chores such as washing clothes, cooking, cleaning and taking care of siblings. Sources and data collection Household surveys (LFS, HIES, LSMS, Integrated HH surveys, etc.), Administrative records. Disaggregation Data are available by gender. Comments and limitations In practice, many national statistics offices apply definitions of youth which differ from the international standard. Gender equality issues As this indicator is disaggregated by sex, it is well-suited for analysis of gender equality issues. Data for global and regional monitoring The ILO does not currently produce global and regional estimates for NEET. Supplementary information and references Decent Work Indicators: ILO Manual - Second Version http://www.ilo.org/wcmsp5/groups/public/---dgreports/---stat/documents/publication/wcms_223121.pdf Responsible entities ILO. Current data availability The ILO has data for 88 countries.

13| P a g e
Target 8.7 Take immediate and effective measures to eradicate forced labour, end modern slavery and human trafficking and secure the prohibition and elimination of the worst forms of child labour, including recruitment and use of child soldiers, and by 2025 end child labour in all its forms. Indicator 8.7.1: Proportion and number of children aged 5-17 years engaged in child labour, by sex and age From ILO: Definition and method of computation The term child labour reflects the engagement of children in prohibited work and, more generally, in types of work to be eliminated as socially and morally undesirable as guided by national legislation, the ILO Minimum Age Convention, 1973 (No. 138), and the Worst Forms of Child Labour Convention, 1999 (No. 182), their respective supplementing Recommendations (Nos 146 and 190), and the United Nations Convention on the Rights of the Child. The statistical measurement framework for child labour is structured around (i) the age of the child; (ii) the productive activities by the child, including their nature and the conditions under which these are performed, and the duration of engagement by the child in such activities. For the purpose of statistical measurement, children engaged in child labour include all persons aged 5 to 17 years who, during a specified time period, were engaged in one or more of the following categories of activities: (a) worst forms of child labour, (as described in paragraphs 17–30, 18th ICLS resolution); (b) employment below the minimum age, (as described in paragraphs 32 and 33 of the 18th ICLS resolution); and (c) hazardous unpaid household services, (as described in paragraphs 36 and 37 of the 18th ICLS resolution), applicable where the general production boundary is used as the measurement framework. Rationale and interpretation To monitor the progress against the target 8.7. Indicator is straightforward to interpret, as it gives the headcount of child labourers at national, regional and global levels. Sources and data collection Household surveys (Child Labour Surveys, Mixed Surveys, LFS, HIES, LSMS, Integrated HH surveys, etc.). Disaggregation National estimates: Total and by age group, gender, area of residence, sector and status in employment Global estimates: Total and by country, region, sector, sex, age group and national income level. Comments and limitations The indicator is limited in terms of capturing the worst forms of child labour other than hazardous. Gender equality issues The indicator permits the separate monitoring progress by sex, in turn permitting the evolution of gender disparities in child labour. Data for global and regional monitoring Data for global and regional monitoring are available through nationally-representative national household surveys. UNICEF maintains a global database on this issue and supports data collection for this indicator through MICS. Supplementary information and references ILO-IPEC (2013). Making progress against child labour. Global estimates and trends 2000-2012. International Labour Office, International Programme on the Elimination of Child Labour (IPEC) - Geneva: ILO, 2013. http://www.ilo.org/wcmsp5/groups/public/---ed_norm/---ipec/documents/publication/wcms_221513.pdf Diallo, Y., Etienne, A., and Mehran, F. (2013). Global child labour trends 2008 to 2012. International Labour Office, International Programme on the Elimination of Child Labour (IPEC) - Geneva: ILO, 2013. http://www.ilo.org/ipec/Informationresources/WCMS_IPEC_PUB_23015/lang--en/index.htm 18th ICLS resolution http://www.ilo.org/wcmsp5/groups/public/---dgreports/---stat/documents/normativeinstrument/wcms_112458.pdf Responsible entities ILO.

14| P a g e
From UNICEF: Definition and method of computation This indicator provides the proportion of children aged 5-17 years who are engaged in child labour. It is calculated by dividing the number of children aged 5-17 years who are reported to have been engaged in child labour in the past week by the total number of children aged 5-17 in the population. Rationale and interpretation Children around the world are routinely engaged in paid and unpaid forms of work that are not harmful to them. However, children are considered to be involved in child labour when they are either too young to work or are involved in activities harmful to their health and development. Children’s involvement in hazardous work can compromise their physical, mental, social and educational development. The issue of child labour is guided by three main international conventions: ILO Convention No. 138 concerning minimum age for admission to employment and Recommendation No. 146 (1973); ILO Convention No. 182 concerning the prohibition and immediate action for the elimination of the worst forms of child labour and Recommendation No. 190 (1999); and the United Nations Convention on the Rights of the Child (Article 32), including its Optional Protocol on the sale of children, child prostitution and child pornography. These conventions frame the concept of child labour and form the basis for child labour legislation enacted by countries that are signatories. As per the 2008 Resolution concerning Statistics of Child Labour, the operation definition of child labour is based on number of hours spent working and working conditions, and encompasses both engagement in economic activities as well as household chores. Sources and data collection Household surveys such as UNICEF-supported MICS, DHS and ILO-supported SIMPOC have been collecting data on this indicator in low- and middle-income countries since around 2000. Many countries also produce national labour estimates and reports that often include data on child labour and/or employment among children. Disaggregation Data are available by age, sex, place of residence and wealth quintiles. Comments and limitations There are existing tools and mechanisms for data collection that countries have implemented to monitor the situation with regards to this indicator. It is recognized that the target is broader and inclusive of more concepts than just child labour but it is recommended that the indicator should be focused on hazardous work since there is currently no solid or internationally agreed methodologies for collecting information on the worst forms of child labour or the involvement of children in armed conflicts. The proposed indicator will be indicative of progress towards achieving the target. Gender equality issues As this indicator is disaggregated by sex, it is well-suited for analysis of gender equality issues. Data for global and regional monitoring UNICEF has estimates for the percentage of children aged 5-17 years who are engaged in child labour disaggregated by age, sex, place of residence and wealth quintile for the world as a whole and by (flexible) regional groupings. The global and regional estimates are based on available data from 114 countries. Supplementary information and references UNICEF website on child labour data: http://data.unicef.org/child-protection/child-labour.html Responsible entities UNICEF, ILO

15| P a g e
Target 8.8 Protect labour rights and promote safe and secure working environments for all workers, including migrant workers, in particular women migrants, and those in precarious employment.
Indicator 8.8.1: Frequency rates of fatal and non-fatal occupational injuries, by sex and migrant status
From ILO: Definition and method of computation An occupational injury refers to any personal injury, disease or death resulting from an occupational accident, which is an unexpected and unplanned occurrence, including acts of violence, arising out of or in connection with work which results in one or more workers incurring a personal injury, disease or death. A fatal occupational injury is the result of an occupational accident where death occurred within one year from the day of the accident, whereas non-fatal occupational injuries entail a loss of working time. The frequency rates of fatal and non-fatal occupational injury are calculated as the number of new cases of fatal and non-fatal occupational injury during the reference year respectively, divided by the total number of hours worked by the workers in the reference group during the reference year, multiplied by 1'000'000. The time lost due to occupational injuries refers to the total number of calendar days during which those persons temporarily incapacitated due to occupational injuries were unable to work, excluding the day of the accident, up to a maximum of one year. Rationale and interpretation Occupational safety and health at work are vital components of decent work. The frequency rates of fatal and non-fatal occupational injuries and the time lost due to occupational injuries provide an indication of the extent to which workers are protected from work-related hazards and risks, and present information that is essential for planning preventive measures. Possible under-reporting of occupational injuries should be kept in mind when interpreting the data, and proper systems should be put in place to ensure the best reporting and data quality. Sources and data collection Household surveys (LFS, HIES, LSMS, Integrated HH surveys, etc.), Official estimates, Establishment surveys, Administrative records. Disaggregation Data are currently available by gender (as well as by economic activity and occupation), but not by migrant status. However, as the target is explicit in this dimension, countries increasingly should be compiling information to allow this disaggregation. Comments and limitations Because data quality issues may be present, it may be more relevant to analyze indicator trends rather than levels. When measured over a period of time, the data can reveal progress or deterioration in occupational safety and health, and thus point to the effectiveness of prevention measures. This indicator is volatile and strong annual fluctuations may occur due to unexpected but significant accidents or national calamities. The underlying trend should therefore be analysed. Gender equality issues As this indicator is disaggregated by sex, it is well-suited for analysis of gender equality issues. Data for global and regional monitoring The ILO does not currently produce global and regional estimates on occupational injuries. Supplementary information and references For further details, refer to the Resolution concerning statistics of occupational injuries (resulting from occupational accidents), available at http://www.ilo.org/global/statistics-and-databases/standards-and-guidelines/resolutions-adopted-by-international-conferences-of-labour-statisticians/WCMS_087528/lang--en/index.htm Responsible entities ILO. Current data availability The ILO has data on the frequency rates of fatal occupational injuries for 117 countries; on the frequeny rates of non-fatal occupational injuries for 89 countries; and on the time lost due to occupational injuries for 107 countries. The breakdown by migrant status is not currently available.

16| P a g e
From Global Migration Working Group: Indicator Frequency rates of fatal and non-fatal occupational injuries and time lost due to
occupational injuries, by sex, disaggregated reporting by migratory status (citizenship status or nativity status)
OWG targets addressed
8.8 Protect labour rights and promote safe and secure working environment of all workers, including migrant workers, particularly women migrants, and those in precarious employment
Rationale TBC Method of computation
TBC Disaggregated reporting by migratory status (citizenship status or nativity status)
Data sources and number of countries for which data is currently available
Labour force surveys, administrative records
Responsible entity
National Statistical Offices; Ministry of Labour, Ministry of Health
Other targets for which this indicator is relevant
10.7 facilitate orderly, safe, regular and responsible migration and mobility of people, including through implementation of planned and well-managed migration policies
Comments Much could be covered by introducing new questions into existing surveys, but in some instances new surveys might be needed. Administrative records may need to be adjusted to distinguish between migrants and non-migrants.
Indicator 8.8.2: Increase in national compliance of labour rights (freedom of association and collective bargaining) based on International Labour Organization (ILO) textual sources and national legislation, by sex and migrant status
New Indicators of Labour Rights: Method and Results
David Kucera and Dora Sari
[Version: 10 November 2015]
1. Introduction
In order to undertake statistical analysis on the relationship between international labour standards
and foreign direct investment and international trade, Kucera (2002, 2007) developed a method for
constructing country‐level indicators of trade union rights (LR). The method was based on the coding of
violations in textual sources and endeavored to apply the definitions of LR embodied in ILO Conventions 87
on Freedom of Association and Protection of the Right to Organize and 98 on Right to Organize and
Collective Bargaining. In spite of its limitations, the method continues to be fairly‐widely used among
researchers. In their survey of indicators of LR, Peels and Develtere (2008) write:
From this overview, we conclude that so far the Kucera dataset on FACB [freedom of association and
collective bargaining] rights is the best option if one wants to measure the policy involvement of
trade unions. The main reasons are its extensive country coverage, its focus on FACB rights and more

17| P a g e
in particular on de facto FACB rights, and the high transparency in methodology (Peels and Develtere,
2008, p. 341).
In his survey of related indicators done for the US Department of Labor, Barenberg provides useful
criticisms of Kucera’s method and concludes:
In any event, Kuceraʼs methodology stands as the leading effort to measure compliance with
freedom of association and collective bargaining rights…in light of social scientistsʼ use of the
methodology. The American Political Science Review, as recently as November 2009, published an
article by Greenhill et al., using Kuceraʼs methodology in modeling the trade‐based diffusion of labor
rights (Greenhill, et al., 2009). For another use of Kuceraʼs methodology by poli cal scien sts, see
Mosley, et al. (2007) (Barenberg, 2010, p. 56).
In an effort to address some of the shortcomings of Kucera’s method, Sari and Kucera (2011)
developed an alternative coding scheme which provides the foundation for our new method. Among the
most important differences with Kucera’s method are the following:
Coding nine rather than just three textual sources, making full use of textual sources available through the ILO’s supervisory system as well as coding national legislation.
Distinct evaluation criteria for violations of LR in law (de jure) and in practice (de facto).
Greater emphasis on violations of LR regarding due process.
Greater emphasis on violations of LR committed against trade union officials.
Eliminating catch‐all evaluation criteria.
Following from the prior four points, an increase in the number of evaluation criteria from 37 to 108.
More comprehensive definitions of what constitutes a violation of each of the evaluation criteria.
The use of the so‐called Delphi method of expert consultation to derive the weights for each of the evaluation criteria.
Perhaps most fundamentally, whereas Kucera’s method was the work of an economist with essentially no legal knowledge, our new method was developed in equal measure by a labour lawyer and an economist working in close collaboration, with the coding was done by labour lawyers rather than economists.
Another novel characteristic of the new indicators is that they are accompanied by a website, at the
Center for Global Workers’ Rights at Penn State University.1 The website facilitates access to the indicators
and the manipulation of these indicators (given that different user’s may wish to construct alternative
versions of the indicators) as well as access to the coding itself and the text on which the coding is based,
thus lending itself to legal as well as statistical analysis.
Regarding the main elements of our new method, the next sections of this paper address its key
premises, the 108 evaluation criteria, the textual sources coded, the use of the Delphi method to derive
weights, and the rules for converting the coded information into normalized indicators ranging in value from
0 to 10 (best and worst possible scores, respectively). This is followed by a description of the coding results
and indicators for 2012 as well an assessment of where we stand and intend to go. Two other main elements
of the method are the definitions of each evaluation criteria and the general and source‐specific coding rules.
1 Available at: http://tur.la.psu.edu/

18| P a g e
Our discussion of these elements is, unavoidably, quite lengthy and technical and so are are addressed in a
separate companion paper.2
2. Key premises
The key premises on which we endeavoured to base the indicators are: (i) definitional validity – the
extent to which the evaluation criteria and their corresponding definitions accurately reflect the phenomena
they are meant to measure; (ii) transparency – how readily a coded violation can be traced back to any given
textual source; and (iii) inter‐coder reliability – the extent to which different evaluators working
independently are able to consistently arrive at the same results.
Definitional validity. As these are meant to be indicators of international LR, the 108 evaluation
criteria and their corresponding definitions are directly based on the ILO Constitution, ILO Conventions No.
87 and 98 and the related ILO jurisprudence.3 Given that the ILO supervisory system is also guided by these
definitions, this facilitates the act of coding itself given our heavy reliance on ILO textual sources produced
by the supervisory system.
Transparency. A key rationale for the large number of evaluation criteria is to eliminate catchall
evaluation criteria for violations of LR not elsewhere coded, that is, violations for which there is not an
explicit evaluation criteria. This addresses a criticism of Kucera’s (2002, 2007) and Sari and Kucera’s (2009)
prior work on these issues (Barenberg, 2010). More generally, the aim was to avoid pigeon‐holing violations
that are not of similar character or severity. (And after all, the coding can always be aggregated up into
various clusters of evaluation criteria, depending on the user’s interest.) This level of detail also facilitates
the transparency of the method, in that very specific violations can be readily traced back to individual
textual sources. This is made possible by the coding itself, in which violations are coded with the letters “a”
through “i,” with each letter standing for one of the nine textual sources coded, as discussed below.
Inter‐coder reliability. We endeavored to develop clear and comprehensive coding rules as well as
definitions for each of the evaluation criteria with the aim of making the indicators reproducible. We
informally assessed inter‐coder reliability in the process of training two lawyers (sequentially and
independently of each other) to do the coding and in double‐checking their coding, which resulted in a
number of revisions to the coding rules and definitions. This process led us to believe the method is indeed
highly reproducible. In our view, the extent of inter‐coder reliability depends not on the clarity or
comprehensiveness of the method as such, but on the coders being sufficiently well‐trained and in particular
with being sufficiently well‐versed in the coding rules and definitions as to be able to apply them consistently.
That is, coders must develop a detailed working knowledge of what constitutes compliance with
2 Available at: http://tur.la.psu.edu/docs/Coding%20Rules.pdf
3 The related ILO jurisprudence is: Digest of Decisions and Principles of the Freedom of Association Committee of the
Governing Body of the ILO (ILO, 2006); Freedom of Association and Collective Bargaining: General Survey of the Reports
on the Freedom of Association and the Right to Organise Convention (No. 87), 1948, and the Right to Organise and
Collective Bargaining Convention (No. 98) (ILO, 1994); General Survey on the Fundamental Conventions Concerning
Rights at Work in Light of the ILO Declaration on Social Justice for a Fair Globalization, 2008 (ILO, 2012).

19| P a g e
international LR as defined by the ILO. In having a large number of evaluation criteria and corresponding
definitions, we were mindful that there is a fine line between being exhaustive and exhausting. Yet this is
less daunting than it may seem when one considers the branching relationship among these evaluation
criteria, discussed in the next section of this paper. Still, a concern is this regard is that coding errors may
creep in as a result of the ambiguous wording of textual sources or indeed simple fatigue. This is one of the
issues we intend to address in the fuLRe with formal statistical tests of inter‐coder reliability (e.g, Hayes and
Krippendorff, 2007).
3. The 108 evaluation criteria
Table 1 enumerates the 108 evaluation criteria and groups them into categories. The five broader
categories are: I. “Fundamental civil liberties,” II. “Right of workers to establish and join organizations,”
III. “Other union activities,” IV. “Right to collective bargaining,” and V. “Right to strike.” These categories are
themselves split into violations of LR in law and in practice, yielding 10 categories all together (represented
in the table as Ia, Ib, etc.). In other words, most of the evaluation criteria representing violations in law have
a partner representing violations in practice, and vice versa.
Violations in law refer to national legislation that is not in conformity with LR as defined by the ILO as well as to actions taken on the basis of such legislation.
Violations in practice refer to acts committed and in violation of the existing national legislation that is in conformity with LR as defined by the ILO.
[Insert Table 1 about here]
In addition to facilitating an assessment of the relative prevalence of violations in law and in practice
for any given evaluation criteria or cluster of evaluation criteria, the split between violations in law and in
practice enables more nuanced analyses of how the causes and effects of LR violations may differ in law and
in practice, as well as how changes in law may be reflected in changes in practice over time. Aside from
these analytical advantages, the rough doubling of evaluation criteria by splitting them into violations in law
and in practice makes their sizeable number more tractable for both coders and users. Such branching
relationships among the evaluation criteria extend to two additional types of evaluation criteria
addressing “Lack of guarantee of due process and/or justice” and “Violations committed against trade union
officials.”
The evaluation criteria “Lack of guarantee of due process and/or justice” are incorporated into the
10 categories of evaluation criteria as the last‐listed evaluation criteria within each, with the exception of
category on “Fundamental civil liberties in practice” (Ib). This is based on the premise that the exercise of LR
depends on their effective protection defined in terms of fair and sufficiently prompt fair trials by an
independent and impartial judiciary. Under the category of “Fundamental civil liberties in practice,” on the
other hand, these evaluation criteria are attached to each of the six more specific evaluation criteria (EC 6, 9,
12, 15, 18 and 21). This emphasis on fundamental civil liberties in practice is meant to reflect the emphasis
of the CEACR and CFA, in particular their view that a free and independent trade union movement can
develop only to the extent that fundamental human rights are respected and where in the event of
violations, measures are taken to identify, bring to trial and convict the guilty parties (ILO, 2006, Paras. 33
and 51). In addition, these criteria are attached to “Anti‐union discriminatory measures” (EC 43) and “Acts of
interference of employers and/or public authorities” (EC 46) under the category of “Right of workers to

20| P a g e
establish and join organizations in practice” (IIb), motivated by Article 3 of ILO Convention 98 which states
that “Machinery appropriate to national conditions shall be established, where necessary, for the purpose of
ensuring respect for the right to organise...”.
The evaluation criteria “Violations committed against trade union officials” are attached to the first
five of the six more specific evaluation criteria (EC 6, 9, 12, 15 and 18) under the category of “Fundamental
civil liberties in practice” (Ib) (EC 21 does not apply here). In addition, this criterion is attached to “Anti‐union
discriminatory measures” (EC 43) under the category of “Right of workers to establish and join organizations
in practice” (IIb) as well as to “Use of excessive sanctions in case of legitimate and peaceful strikes” (EC 106)
under the category of “Right to strike in practice” (Vb). The emphasis on trade union officials is motivated by
the view that violations against them are particularly damaging to the exercise of LR.
For those interested in the comparison, we constructed a correspondence table (available on
request) between the 37 evaluation criteria used by Kucera (2002, 2007) and 108 evaluation criteria of our
new method, which shows that the latter can be largely mapped onto the former.
4. Textual sources
Kucera’s (2002, 2007) method was based on the coding of three recurring reports: The ILO’s Report
on the Committee on Freedom of Association, the International Trade Union Confederation’s (ITUC) Annual
Survey of Violations of Trade Union Rights, and the US State Department’s Country Reports on Human Rights
Practices. Yet the more textual sources the better, to the extent that these provide additional credible
information consistent with the ILO’s definition of LR. Moreover, additional sources need to be produced on
a regular basis to minimize biases over time and be publically available so that the indicators are
reproducible.
The principle of more being better holds all the more strongly insofar as the use of a given textual
source offsets potential biases in the indicators resulting from the use of other textual sources. Such biases
can result not because information in the sources themselves is biased, but because of asymmetries
between the availability of information for different countries and types of LR violations. Of particular
concern are biases that may arise between countries that have and have not ratified ILO Conventions 87 and
98 (ratifying and non‐ratifying countries hereafter) as well as between LR violations in law and in practice.
Some ILO sources only apply to ratifying countries and while it is not possible to collect all relevant
information for LR violations in practice, one can – with doggedness and translation help – do so for LR
violations in national legislation itself, if not for actions taken on the basis of such legislation.4
On these grounds, the present method makes use of five additional ILO textual sources: Reports of
the Committee of Experts on the Application of Conventions and Recommendations; Reports of the
Conference Committee on the Application of Standards; Country Baselines Under the ILO Declaration Annual
Review; Representations under Article 24 of the ILO Constitution; and Complaints under Article 26 of the ILO
Constitution.
The method also codes relevant national legislation for non‐ratifying countries. We regard the
coding of national legislation as particularly important to offset information asymmetries between ratifying
and non‐ratifying countries as regards LR in law (at the same time noting our intention to code national
legislation for ratifying countries in the fuLRe). Note that we define ratifying countries as those that have
4 For example, about two-thirds of cases brought before the Committee on Freedom of Association in recent years originate from in Latin America, suggesting that workers’ organizations in these countries are more actively rely on this mechanism.

21| P a g e
ratified both Conventions 87 and 98, in which case its national legislation is not coded at present. Non‐
ratifying countries, on the other hand, fall into two categories, those that have ratified neither 87 and 98 and
those that have ratified only one of these Conventions. If a country has ratified only 87, its national
legislation is coded for violations pertaining to 98, as violations under 87 fall under the remit of the ILO’s
Committee of Experts as well as Committee on the Application of Standards. Similarly, if a country has
ratified only 98, its national legislation is coded for violations pertaining to 87. Note that for federal states,
we only code federal‐level legislation. A useful example of how labour standards indicators can be
constructed for jurisdictions within federal states is provided by Block and Roberts, who constructed such
indicators for the 50 states of the US and the 13 Provinces and Territories of Canada (Block and Roberts,
2000; Block, 2007).
The nine textual sources are recapitulated in Table 2, along with the associated letters by which they
are coded as well as whether these sources pertain to ratifying countries, non‐ratifying countries, or both.
Some of these textual sources may be regarded by some users as less credible than others. To accommodate
such concerns, the project’s website enables the scores for any given country to be automatically re‐
calculated by deselecting any source or combination of sources.
[Insert Table 2 about here]
5. Using the Delphi Method to Construct Evaluation Criteria Weights
Kucera’s (2002, 2007) method of constructing LR indicators assigned weights of 1, 1.25, 1.5, 1.75 or 2
to each of 37 evaluation criteria, based solely one non‐lawyer’s impressionistic sense of what constituted
more or less severe LR violations. Clearly, one could do better, and the use of the Delphi method to
construct evaluation criteria weights represents our efforts to do so (Cf. Cuhls, 2005; Hsu and Sandford, 2007
for more on the Delphi method). To our knowledge, ours is the first use of the Delphi method to construct
weights for the construction of statistical indicators.
Our application of the Delphi method involved two rounds of surveys conducted via email of
internationally‐recognized experts in labour law having knowledge of the ILO’s supervisory system and
particular knowledge of international LR as defined by the ILO. Regional representation was another
consideration. Experts remained anonymous with respect to each other throughout the process. Initial
invitations to participate were sent to 37 experts, of whom 18 initially agreed to participate and of whom 14
went through both survey rounds. Of these 14 experts, 13 were lawyers and one a political scientist, with
five based in Western Europe, one in Eastern Europe, three in the US, two in Latin America, two in Asia and
one in Africa.
Experts were asked to provide ratings of 1, 2, 3, 4 or 5 for each of the evaluation criteria, in response
to the following question:5
The Survey asks one overriding question: On a scale of 1 to 5, how would you rate the 108
evaluation criteria in terms of the severity of their impact on the development of a free and
5 Given their expertise on these issues, experts were not provided with the full definitions for each of the evaluation
criteria, but rather with a set of clarifying footnotes (available on request). Experts were also invited to make overall
comments as well as comments on each of the evaluation criteria.

22| P a g e
independent trade union movement, voluntary collective bargaining and the exercise of trade union
rights? (With 1 indicating least severe and 5 indicating most severe.) The severity of each of these
violations depends, of course, on how frequently it occurs. For the purposes of responding to the
survey, however, we ask experts to consider each violation in its own right independently of the
frequency with which it might occur. Put in other words, the weights are meant to compare any
single violation represented by a given evaluation criteria against any single violation represented by
other evaluation criteria.
After having received the first round of replies, the average first round ratings among the experts for
each evaluation criteria were sent back to each of the experts alongside their first round ratings. Experts
were invited to make changes, if they wished, to their first round ratings. Final ratings used to construct the
weights were the average second round ratings among the experts for each evaluation criteria.
Main results of the two rounds of surveys are shown in Table 1. Consistent with the logic of the
Delphi method, there was considerable convergence in the experts’ ratings in the second round. As the table
shows, variation in the experts’ ratings as measured by standard deviations declined for 103 of 108 of the
evaluation criteria, remained the same for three (EC 6, 38 and 77), and increased (slightly) for only two (EC
26 and 98). As for variation in final ratings across the evaluation criteria, these ranged in value from 2.79 (EC
63, 74 and 90) – considerably higher than the possible minimum rating of 1 – to 5 (EC 1, 6, and 7). The
average value among these final ratings is correspondingly high, at 4.03. From the point of view of the
experts, that is, all of the 108 evaluation criteria represent LR violations of at least moderate severity. For
the purposes of constructing indicators, it is worth noting that the less variation there is in ratings among the
evaluation criteria, the closer weighted indicators are to equally‐weighted indicators.
These ratings are not the weights themselves, however. The ratings can be converted into weights
using different ranges of minimum and maximum weighting and rating values. For our purposes, we follow
Kucera (2002, 2007) and let minimum and maximum weighting values range from 1 to 2, based on possible
minimum and maximum rating values ranging from 1 to 5, shown in the last column of Table 1. This is, in
effect, a relatively light weighting scheme. For the purposes of statistical analysis, though, it is useful to test
the sensitivity of findings with respect to alternative weighting schemes.
6. Applying the weights, normalization and default scores
The raw coding uses the letters “a” through “i” (again, with each letter corresponding to one of the
nine textual sources) to represent coded violations of LR for each evaluation criteria, yielding a column of
108 cells for any given country and year. In order to apply the weights, any cell containing one or more
letters is assigned a value of 1 and any blank cell for which there are no coded violations is assigned a value
of 0, creating a binary coding column. As with Kucera (2002, 2007), the number of letters in a cell does not
affect the construction of the binary coding column, in order to avoid double‐counting given that the textual
sources commonly reference each other. The cells of the column of weights is then multiplied by
corresponding cells of the binary coding column, and summing across the cells of the resultant column yields
a weighted non‐normalized score for any given country and year. A hypothetical example is provided in
Table 3, showing only those evaluation criteria with coded violations. In this example, 24 evaluation criteria
are coded. Applying the weights yields a non‐normalized score of 42.3 and a normalized score of 4.5, based
on the rules describe next.
[Insert Table 3 about here]

23| P a g e
As Kucera (2002, 2007) only coded one point in time, normalization was done with respect to the
maximum observed value, taking the score for the country with the worst weighted non‐normalized score as
the maximum. This is problematic, however, when normalizing over time, given that the maximum observed
value can change. We addressed this by looking at the roughly one‐third of countries having the most coded
violations of LR for the years 2000, 2005, 2009 and 2012 and calculating for them the weighted non‐
normalized score for these same four years. The highest weighted non‐normalized score for several
countries hovered around 80. As such, we decided to assign 95 as the maximum weighted non‐normalized
score, roughly equal to one‐half the hypothetically possible maximum weighted non‐normalized score of
189.7 (that is, the sum of weights across all 108 evaluation criteria). On this basis, the non‐normalized score
for any given country and year is normalized to range in value from 0 to 10, the best and worst possible
scores respectively. In the fuLRe, if any country should receive a non‐normalized score of greater than 95,
this will be capped at 95, yielding a normalized score of 0.6
We also construct separate LR indicators in law and in practice following similar rules and yielding
indicators ranging in value from 0 to 10 as the best and worst possible scores. Here again, we looked at the
roughly one‐third of countries having the most coded violations of LR for four years going back to 2000 and
calculating the weighted non‐normalized scores. For both LR in law and in practice, the highest weighted
non‐normalized scores were about 50. We decided to apply a proportionate buffer in normalizing the LR in
law and LR in practice indicators as the overall LR indicator, assigning 60 as the maximum weighted non‐
normalized score. Again, should any country in the fuLRe receive a non‐normalized score of greater than 60,
this will be capped at 60, yielding a normalized score of 0.7 One could apply similar rules to construct
indicators for other clusters of evaluation criteria, for example, focusing just on categories IIa and IIb on the
right of workers to establish and join organization.8
In addition, the method applies the notion that general prohibitions in law imply general prohibitions
in practice (though not vice versa). In terms of coding, this means that the direct coding of “General
prohibition of the right to establish and join organizations” in law (EC 23) automatically triggers the coding of
“General prohibition of the development of independent workers' organizations” in practice (EC 36); the
direct coding of “General prohibition of the right to collective bargaining” in law (EC 62) automatically
triggers the coding of the “General prohibition of collective bargaining” in practice (EC 73); and, finally, the
direct coding of “General prohibition of the right to strike” in law (EC 84) automatically triggers the coding of
the “General prohibition of strikes” in practice (EC 96). Given that the general prohibition of the
development of independent workers’ organizations implies the general prohibition of collective bargaining
(though not vice versa), similar coding rules apply. That is, the direct coding of EC 23 automatically triggers
6 The formula is thus: (x*10/95), where x = the weighted non-normalized score for a given country and year and is capped at 95. 7 The formula is thus: (x*10/60), where x = the weighted non-normalized score for either evaluation criteria in law or in practice for a given country and year and is capped at 60.
8 One of our reasons for having the overall LR indicator as well as the in law and in practice indicators range between 0
and 10 was to facilitate the direct comparison of the magnitude coefficient estimates in econometric analysis.
Depending on users’ interests, however, one could alternatively normalize the in law and in practice indicators as well
as other categories of indicators by assigning 95 as the maximum weighted non‐normalized score for each component,
in which case the indicators for the full set of components (across all 108 evaluation criteria) would sum to the overall
LR rights indicator, leaving aside for the moment the default score rules discussed below.

24| P a g e
the coding of EC 62 and EC 73 (as well as EC 36, as noted) and the direct coding of EC 36 automatically
triggers the coding of EC 73.
Similar to Kucera (2002, 2007), there is one deviation from the above normalization rules. That is, a
“default” worst possible score of 10 is given for all‐encompassing violations of LR, that is, for “General
prohibition of the right to establish and join organizations” in law (EC 23), “General prohibition of the
development of independent workers' organizations” in practice (EC 36), “General prohibition of the right to
collective bargaining” in law (EC 62), and “General prohibition of collective bargaining” in practice (EC 73).
These rules applies both for the overall LR indicator as well as the LR indicators in law and in practice.
One of the advantages of applying the default score rules is that this enables us to partly address a
source of information bias in the textual sources. For in many cases, the textual sources read like an
insurance assessor’s report on an automobile damaged in an accident. For a minor accident, the report will
address the specifics of surface damage. For a moderately serious accident, the report will additionally
address such issues as damage to the frame, axles and engine. When an automobile is totally beyond repair
– analogous to general prohibitions in our case – the insurance assessor’s report can be most brief and not
explicitly refer to the damage that would be reported in a minor or moderately serious accident, even
though such damage has occurred. Similarly, our reading of the textual sources suggests to us that the lack
of reporting of other less sweeping violations when general prohibitions occur does not mean that these
other violations do not occur, but rather that they are underreported because the sources do not trouble to
report them.9 While one could test the sensitivity of findings of statistical analysis by using indicators that do
not apply the default score rules, we provide evidence in the next section that applying these rules better
enables the indicators to capLRe the LR situation in a country.
7. Coding results and LR indicators
Moving on the main results of our coding, Table 4 shows the distribution of (unweighted) coded
violations for 183 countries for 2012 broken out by the five broader categories (in rows) as well as all
violations, violations in law and violations in practice (in columns).10 In total, 2,862 violations were coded –
an average of 15.6 violations per country – with about 60 percent of these violations in law (1,688 in law
compared to 1,174 in practice). Note that this is based on the binary coding not the raw coding by letters “a”
through “i” (illustrated by the example in Table 3) so as to avoid double‐counting between sources.11
Whether we look at all violations, violations in law or violations in practice, we see that the largest share of
violations was under category II, the “Right of workers to establish and join organizations,” making up 36.5
percent of all violations, 34.4 percent of violations in law and 39.5 percent of violations in practice. The more
striking difference between violations in law and practice are for category I, “Fundamental civil liberties,”
making up only 2.7 percent of violations in law but fully 22.7 percent of violations in practice; and category V,
the “Right to strike,” making up 30.0 percent of violations in law and 9.3 percent of violations in practice.
9 This type of information bias also affects the distribution of coded violations, described in Table 4 and Figure 1 below.
10 There were 185 ILO member states in 2012. However, we did not include Somalia and South Sudan as no information
was available for them in the textual sources from the ILO supervisory bodies or ITUC, verifiable laws were not
accessible, and the ILO’s Country Baselines and US State Department’s Country Reports did not provide codable
information.
11 Based on the non-binary coding, the number of letters under which violations were coded for 2012 was considerably higher, at 5,193.

25| P a g e
[Insert Table 4 about here]
A more detailed look at the coded violations is provided by Figure 1, which shows their distribution
across all 108 evaluation criteria. The 10 evaluation criteria with the most coded violations (ranging from 77
to 114 coded violations, as shown in the figure) and the categories under which they fall are as follows:
IIa. Right of workers to establish and join organizations in law
EC 25: Exclusion of other workers from the right to establish and join organizations
EC 26: Previous authorization requirements
EC 31: Lack of adequate legal guarantees against anti‐union discriminatory measures
IIb. Right of workers to establish and join organizations in practice
EC 43: Anti‐union discriminatory measures in relation to hiring, during employment (e.g. transfers and downgrading) and dismissal
EC 46: Acts of interference of employers and/or public authorities
IIIa. Other union activities in law
EC 51: Infringements of the right to freely elect representatives
IVa. Right to collective bargaining in law
EC 65: Exclusion of other workers from the right to collective bargaining
IVb. Right to collective bargaining in practice
EC 80: Acts of interference in collective bargaining
Va. Right to strike in law
EC 86: Exclusion of other workers from the right to strike
EC 92: Excessive prerequisites required for exercising the right to strike
Also worth noting is that six of the 108 evaluation criteria were never coded, at least for 2012.
Following the format above, these are:
Ia. Fundamental civil liberties in law
EC 4: Excessive prohibitions/restrictions on trade union rights in the event of state of emergency
Ib. Fundamental civil liberties in practice
EC 21: Excessive prohibitions/restrictions on trade union rights in the event of state of emergency
EC 22: Lack of guarantee of due process and/or justice re violation no. 21
IIIb. Other union activities in practice
EC 60: Lack of guarantee of due process and/or justice re violations nos. 56‐60
Vb. Right to strike in practice
EC 99: Exclusion/restriction based on the objective and/or type of the strike
EC 101: Lack of compensatory guarantees accorded to lawful restrictions on the right to strike

26| P a g e
Regarding general prohibitions of categories of LR, the coding results show that such sweeping
restrictions are not infrequent.12 There are 14 coded violations for: “General prohibition of the right to
establish and join organizations” in law (EC 23) as well as “General prohibition of the right to collective
bargaining” in law (EC 62, the same 14 countries as EC 23); 18 coded violations for “General prohibition of
the development of independent workers' organizations” in practice (EC 36) as well as “General prohibition
of collective bargaining” in practice (EC 73, the same 18 countries as EC 36); 6 coded violations for “General
prohibition of the right to strike” in law (EC 84) and 17 coded violations for “General prohibition of strikes” in
practice (EC 96).
[Insert Figure 1 about here]
Even leaving aside the indicators, such coding results – particularly at the country level – may have
useful research and policy applications in their own right. Regarding research, for example, it would seem
worthwhile to analyse the variation in coded violations across evaluation criteria, addressing how and why
this differs among countries and over time. Regarding policy, such results may usefully inform initiatives to
improve LR in a country, providing a quick but detailed overview of the problems occurring based on
information that is otherwise spread among multiple of textual sources. Combined with our companion
website, the coding by textual sources also serves as an index to these textual sources, enabling rapid access
to the relevant passages within each. For example, one line of inquiry we are interested in pursuing is to
estimate the share of workers in a country for which LR rights are applicable, based on the text underlying
the coding of the 12 evaluation criteria referring to the exclusion of certain categories of workers from
different aspects of LR protection (that is, EC 24, 25, 37, 38, 64, 65, 75, 76, 85, 86, 97 and 98).
Moving on the indicators themselves, our three main indicators of LR overall, in law and in practice
are shown in Appendix Table 1. The correlation coefficient (Pearson) between LR in law and LR in practice is
moderately strong, at 0.73.13 Taking the indicators at face value, the absence of a stronger correlation means
that stronger LR in law does not necessarily go hand in hand with stronger LR in practice. As noted above,
our indicators can facilitate analysis of the relationship between the two as they become available over time,
addressing such questions as the extent to which improvements in LR in law leads to improvement in
practice.
We next look at the correlations between our three LR indicators with other indicators addressing
broader but related concepts. These are the Freedom House (FH) political rights and civil liberties indexes,
the associational and organizational rights component of the FH civil liberties index, the Polity IV Polity2
index and the CIRI empowerment rights index. The FH political rights index is based on a set of questions
broken down into three categories, electoral process, political pluralism and participation, and functioning of
government. The FH civil liberties index is based on a set of questions broken down into four categories,
freedom of expression and belief, associational and organizational rights, rule of law, and personal
autonomy and individual rights. Under associational and organizational rights, one question relates directly
12 The definitions for EC 23, 36, 62 and 73 are primarily based on the “Resolution concerning the independence of the
trade union movement,” adopted by the International Labour Conference in 1952. Coded violations are generally in
regard to situations of state monopoly imposed either in law or in practice in countries where political power is
controlled by a single party.
13 This remains the same when dropping nine countries from the sample for reasons noted below.

27| P a g e
to trade unions: “Are there free trade unions and peasant organizations or equivalents, and is there effective
collective bargaining?” (Freedom House, 2012).
Polity IV’s Polity2 index is based on the competitiveness and openness of executive recruiting,
constraints on chief executives, the competitiveness of political participation and the regulation of
participation, and so addresses similar issues as the FH political rights index (Marshall et al., 2011). Finally,
The CIRI empowerment rights index addresses several aspects of democracy and human rights, namely,
electoral self‐determination, freedom of speech, freedom of assembly and association, freedom of foreign
movement, freedom of domestic movement, freedom of religion, and workers’ rights (Cingranelli and
Richards, 2010).
[Insert Table 5 about here]
Table 5 shows four sets of correlation coefficients between our LR indicators and these related
indicators. Regarding the signs of correlation coefficients, note that the FH political rights and civil liberties
indexes are scaled like our LR indicators, such that higher values mean weaker rights, whereas the other
three indicators are scaled in reverse. Panel A includes all 183 countries and applies the default score rules;
Panel B also includes all 183 countries but does not apply the default score rules; Panel C – which we think
most relevant – drops nine countries from the sample and like Panel A applies the default score rules; and
Panel D drops the same nine countries from the sample but does not apply the default score rules. First note
that the correlation coefficients in Panel A are consistently higher than the corresponding values in Panel B
and likewise that those in Panel C are consistently higher than the corresponding values in Panel D (with the
gaps particularly wide for the LR in practice indicator). In our view, this suggests the preferability of applying
the default score rules.
In constructing his indicators, Kucera (2002, 2007) dropped nine countries from the sample on the
grounds that their implausibly favourable scores primarily reflected a large degree of information bias,
specifically an underreporting of violations. This was based on a comparison with the FH indexes as well as
whether country profiles were available in the ITUC’s annual reports. Given our greater reliance on other
textual sources, we dropped nine countries simply based on whether the overall LR indicator was 5.0 or less
than the FH civil liberties index after rescaling the FH index to also range from 0 to 10 as the best and worst
possible scores, respectively.14 That is, we drop those nine countries for which the FH civil liberties index
suggests a much worse situation than do our indicators. Comparing Panel C to Panel A, the correlation
coefficient is inevitably higher for FH civil liberties but is also higher for the other related indicators. For the
overall LR indicator, correlation coefficients in Panel C range between 0.65 and 0.74, larger than comparable
correlation coefficients for Kucera’s method as well as Teitelbaum’s alternative to this method, evaluating
the mid‐1990s (Kucera, 2007, p. 155; Teitelbaum, 2010, p. 470).15 For the purposes of statistical analysis and
14 These countries are Afghanistan, Chad, Congo, Côte d'Ivoire, Gabon, Gambia, Kyrgyzstan, Tajikistan and Yemen.
15 Teitelbaum (2010) applied item response theory analysis (analogous to factor analysis for continuous variables) to Kucera’s binary coding for the mid-1990s to construct an alternative LR indicator. This indicator is based on a reduced set of evaluation criteria, dropping five criteria that are argued by Teitelbaum to not relate to the underlying concept of LR, among these – strikingly – general prohibitions of the right to establish and join unions as well as general prohibitions of collective bargaining. Teitelbaum’s alternative indicator is also based on weights derived from variation in the coding itself as well as on different default score rules. While we find this approach certainly worth consideration, we are also concerned that it is too mechanically-based on the pattern of coded violations for a given point in time rather than more longstanding considerations based on the judgement of experts in the ILO and academia and also does not

28| P a g e
more generally, we thus think it preferable to drop these nine countries from the sample. In constructing a
dataset over time for the purposes of panel data analysis, one needs of course to be mindful of maintaining
a consistent sample of countries when using such filters to arrive at reduced samples, given that countries
may cross relevant thresholds in some years but not others.
The broader but related indicators produced by FH, Polity IV and CIRI can serve as useful
complements to our LR indicators in statistical analysis, providing robustness checks in alternative
specifications (including as possible interacting variables) and guiding the filtering of reduced samples
particularly with respect to the underreporting of LR violations.16 Given the alternative methods of
construction of these related indicators, their use as complements to our indicators is all the more important
given that the underreporting of violations is a likely to be a significant source of information bias for any
indicator based solely on the coding of reported violations. This is likely to be particularly problematic in less
open societies, creating not merely random noise in the data but systematically biased data. We reLRn to
these points in our concluding section.
Shown in Figure 2 are regional averages of the LR indicators – overall, in law and in practice – based
on country groupings used in the ILO’s Global Employment Trends (ILO, 2014), dropping nine countries from
the sample for reasons noted above, and applying the default score rules.17 For 2012, the region with the
lowest (best) scores are the Developed Economies & EU (1.3 for LR overall) and with the highest (worst)
scores the Middle East & North Africa (7.1 for LR overall). Among the developing regions, Latin America &
Caribbean and Sub‐Saharan Africa have the lowest (best) scores (3.2 and 3.4 for LR overall, respectively),
with South Asia and East & South‐East Asia & Pacific having middling scores (5.4 and 4.4 for LR overall,
respectively). Three regions have substantially higher LR in law than LR in practice scores: South Asia, East &
South‐East Asia & Pacific and Middle East & North Africa. Taking the indicators at face value, it appears then
that LR in law are more problematic than problems LR in practice in these regions. The opposite holds in just
one region: Central & South‐Eastern Europe (non‐EU) & Commonwealth of Independent States (CIS), which
has substantially higher scores for LR in practice than LR in law.
[Insert Figure 2 about here]
8. Taking stock and looking ahead
adequately account for the possibility of information bias in the textual sources. In our view, our derivation of weights based on our survey of internationally-recognized experts (in our new method) is considerably more transparent and so in keeping with our key premises, as well as more readily conveyed to a wide range of users. Moreover, by basing our evaluation criteria directly on relevant ILO Conventions and jurisprudence (in both old and new methods) and all the accumulated knowledge that went into developing them, we believe that our evaluation criteria do indeed reflect the underlying concept of LR. In particular, Teitelbaum’s finding that general prohibitions of the right to establish and join unions as well as general prohibitions of collective bargaining are not related to the underlying concept of LR appears to us to be largely the result of information bias in the textual sources, as discussed above in the context of our default score rules. 16 A useful example is provided by Teitelbaum (2010), who drops all countries from the sample that experienced state failure in the mid-1990s, based on the Polity IV dataset. Note that Polity IV classifies only three countries as failed states in 2012: Haiti, Libya and Mali. 17 In these sources, there are nine major country groupings, based on a combination of level of development and geography – one development grouping: (Developed Economies and European Union) and eight geographic groupings: Central & South-Eastern Europe (non-EU) & Commonwealth of Independent States (CIS); East Asia; South-East Asia & the Pacific; South Asia; Latin America & the Caribbean; the Middle East; North Africa; and Sub-Saharan Africa. Each country appears in only one group. For our analysis, East Asia and South-East Asia & the Pacific were merged into one group as was Middle East and North Africa. Note that an alternative version of Figure 2 based on all 183 countries is available on request, but is broadly similar to the figure shown.

29| P a g e
In our introduction, we noted how our new method addresses a number of shortcomings of earlier
efforts, yet limitations remain. There is an important limitation intrinsic to any indicator based solely on the
coding of violations, in that such an approach does not account for the latent, underlying rights context in
which these violations occur. Kucera described this problem as follows: “There are clearly cases…when
observed violations are a reflection of a vibrant trade union movement and, conversely, where violations are
not observed and indeed do not occur because the trade union movement is suppressed and under threat”
(2007, p. 162). In an effort to partially address this limitation, we coded not just LR violations but also
instances of LR progress noted in the textual sources, based on our 108 evaluation criteria plus two broad
additional evaluation criteria, “Labour law reform” and “Promotional activities.” For 2012, we coded 352
instances of progress, 104 referring to “Labour law reform,” 80 referring to “Promotional activities,” and the
remaining 168 instances referring to the 108 evaluation criteria used to code violations.
It was our hope to incorporate the coding of progress into the construction of the indicators. In our
judgement, however, instances of LR progress are not systematically enough reported for such purposes.
This results in two potential types of information bias, one between ratifying and non‐ratifying countries and
the other between worse and better performing countries, in that more information is available on instances
of progress for non‐ratifying and worse performing countries. This seems to result in part from the fact that
it is only the Country Baselines Under the ILO Declaration Annual Review that specifically requests non‐
ratifying countries to report on “Promotional activities” and “Special initiatives/Progress.” While the form
submitted for the Reports of the Committee of Experts on the Application of Conventions and
Recommendations asks Governments to provide information on any new legislative or other measures
affecting the application of the Conventions (which explains the high number of coding for “Labour law
reform”), in general the sources are more inclined to address progress in response to previously
documented violations. Such concerns particularly apply to the Reports of the Conference Committee on the
Application of Standards, the Representations under Article 24 of the ILO Constitution, and the Complaints
under Article 26 of the ILO Constitution, where the pre‐condition for these three reports is severe violations
of trade union rights.
As such, we leave incorporation of the coding of progress into the indicators as a possible fuLRe
development, until such time as the textual sources (or additional sources) adequately reflect progress.18 Still,
the underlying rights context would remain a concern even with the coding of progress, which is why we
believe that analyses based on our indicators would be usefully complemented by broader rights indicators
constructed by different methods, such as those produced Freedom House, Polity IV and CIRI. Of course, the
progress of countries regarding LR is capLRed by the method as it stands, insofar as fewer or less severe
violations occur over time.
Another limitation is that while our new method uses a weighting scheme to account for differences
in the severity of violations across the evaluation criteria, it does not account for differences in the severity
of violations within any given evaluation criteria, particularly regarding violations in practice. For example,
the methods treat the dismissal of one thousand workers for union activities the same as the dismissal of a
single worker. We endeavoured to address this by coding the severity of reported violations for the following
seven evaluation criteria, with severity in this sense defined in terms of whether the violations were
“widespread and/or systematic”:
EC 6: Killing or disappearance of trade unionists in relation to their trade union activities
EC 9: Other violent actions against trade unionists in relation to their trade union activities 18 In spite of its limitations, we nonetheless believe that our coding of progress as it stands provides useful background information, and so we make it available on request.

30| P a g e
EC 12: Arrest, detention, imprisonment, charging and fining of trade unionists in relation to their trade union activities
EC 15: Infringements of trade unionists’ basic freedoms
EC 18: Attacks against trade unions’ and trade unionists' premises and property
EC 21: Excessive prohibitions/restrictions on trade union rights in the event of state of emergency
EC 43: Anti‐union discriminatory measures in relation to hiring, during employment (e.g. transfers and downgrading) and dismissal
In practical terms, such coding meant adding an additional row under each of these evaluation
criteria, in which severity within the corresponding evaluation criteria is coded with letters representing the
textual sources just as for our other coding. Note that the first six of these evaluation criteria fall under
“Fundamental civil liberties in practice” (Ib) and the last under “Right of workers to establish and join
organizations in practice” (IIb), but it would be possible to extend such coding to most other evaluation
criteria addressing violations in practice. In our view, however, we did not feel we could code severity within
evaluation criteria with sufficient consistency to assure a reasonable degree of inter‐coder reliability. This is,
of course, a testable proposition, and as part of our fuLRe testing of inter‐coder reliability of the method as it
stands, we also plan to test for the inter‐coder reliability of the coding of severity within evaluation criteria.
We also leave as desired fuLRe developments the coding of national legislation for all countries in
our sample, not just non‐ratifying countries (regarding ILO Conventions 87 and 98), as well as the coding and
construction of indicators for years before and after 2012. In constructing indicators over time, we aim to be
mindful of possible biases that can result from changes in the quality of reporting, especially given that our
textual sources focus on LR violations rather than instances of progress. We are particularly concerned that
improved reporting – as evidenced by the increased word count of textual sources over time – can create
the false impression of LR worsening when they may in fact be stable or improving, or at least worsening by
less than the indicators suggest. An analogous problem may arise one we begin coding national legislation
for ratifying countries. For the purposes of econometric analysis, such biases can be addressed to an extent
by the inclusion in estimates of time‐related independent variables, but particular caution may be required
when interpreting face value changes in the LR indicators themselves.

31| P a g e
References
Barenberg, M. 2010. “LiteraLRe Review and Bibliography for Research project: Refining the NAS‐ILAB Matrix”,
U.S. Department of Labor, Bureau of International Labor Affairs Department of Labor (ILAB).
Block, R., Roberts, K. 2000. “A Comparison of Labour Standards in the US and Canada”, Industrial Relations
55(2):273‐307.
Block, R. 2007. “Indicators of Labour Standards: An Overview and Comparison”, in D. Kucera (ed.): Qualitative indicators of labour standards: Comparative methods and applications (Dordrecht, Springer), pp. 27-56.
Cingranelli, D., Richards, D. 2010. “The Cingranelli and Richards (CIRI) Human Rights Data Project”, Human
Rights Quarterly 32(2):401‐424. http://www.humanrightsdata.com/ ,
http://www.humanrightsdata.com/p/data‐documentation.html Accessed September 27, 2015.
Cuhls, K. 2005. Delphi surveys. Teaching material for UNIDO Foresight Seminars.,
http://www.unido.org/fileadmin/import/16959_DelphiMethod.pdf Accessed September 27, 2015.
Freedom House. 2012. Freedom in the World: Aggregate and Subcategory Scores.
https://www.freedomhouse.org/report/freedom‐world‐aggregate‐and‐subcategory‐scores#.UuErFLQo71I
Accessed September 27, 2015.
Greenhill, B., Mosley, L., Prakash, A., 2009. “Trade‐based Diffusion of Labor Rights: A Panel Study, 1986–
2002”, American Political Science Review 103(4): 669‐690.
Hayes, A. F., Krippendorff, K. 2007. “Answering the call for a standard reliability measure for coding data”. Communication Methods and Measures, 1(1):77-89.
Hsu, C., Sandford, B. A. 2007. “The Delphi Technique: Making Sense of Consensus, Practical Assessment”, Research & Evaluation 12(10):1-8.
International Labour Office (ILO). 2014. Global Employment Trends 2014: The risk of a jobless recovery.
Geneva. ILO.
—. 2006. Freedom of Association, Digest of decisions and principles of the Freedom of Association Committee of the Governing Body of the ILO, fifth (revised) edition, Geneva.
Kucera, D. 2002. “Core Labour Standards and Foreign Direct Investment”, in International Labour Review, 141(1-2):31-69.
—. 2007. “Measuring Trade Union Rights by Violations of These Rights”, in D. Kucera (ed.): Qualitative indicators of labour standards: Comparative methods and applications (Dordrecht, Springer), pp. 145-82.
Marshall, M. G., Gurr, T.R., Jaggers, K. 2014. Polity™ IV Project, Political Regime Characteristics and
Transitions, 1800‐2013, Dataset Users’ Manual. Vienna, VA: Center for Systemic Peace.

32| P a g e
http://www.systemicpeace.org/inscr/p4manualv2013.pdf http://www.systemicpeace.org/inscrdata.html
Accessed September 27, 2015.
Mosley, L., Uno, S. 2007. “Racing to the Bottom or Climbing to the Top? Economic Globalization and
Collective Labor Rights”, Comparative Political Studies 40(8): 923–948.
Peels, R., Develtere, P. 2009. “Civil Society Involvement in International Development Cooperation: In Search for Data”, Social Indicators Research 93:331–349
Sari, D., Kucera, D. 2011. Measuring progress towards the application of freedom of association and
collective bargaining rights: A tabular presentation of the findings of the ILO supervisory system, Working
Paper No. 99. Geneva. ILO.
Teitelbaum, E. 2010. “Measuring Trade Union Rights through Violations Recorded in Textual Sources: An Assessment”, in Political Research Quarterly, 63(2):461-474.
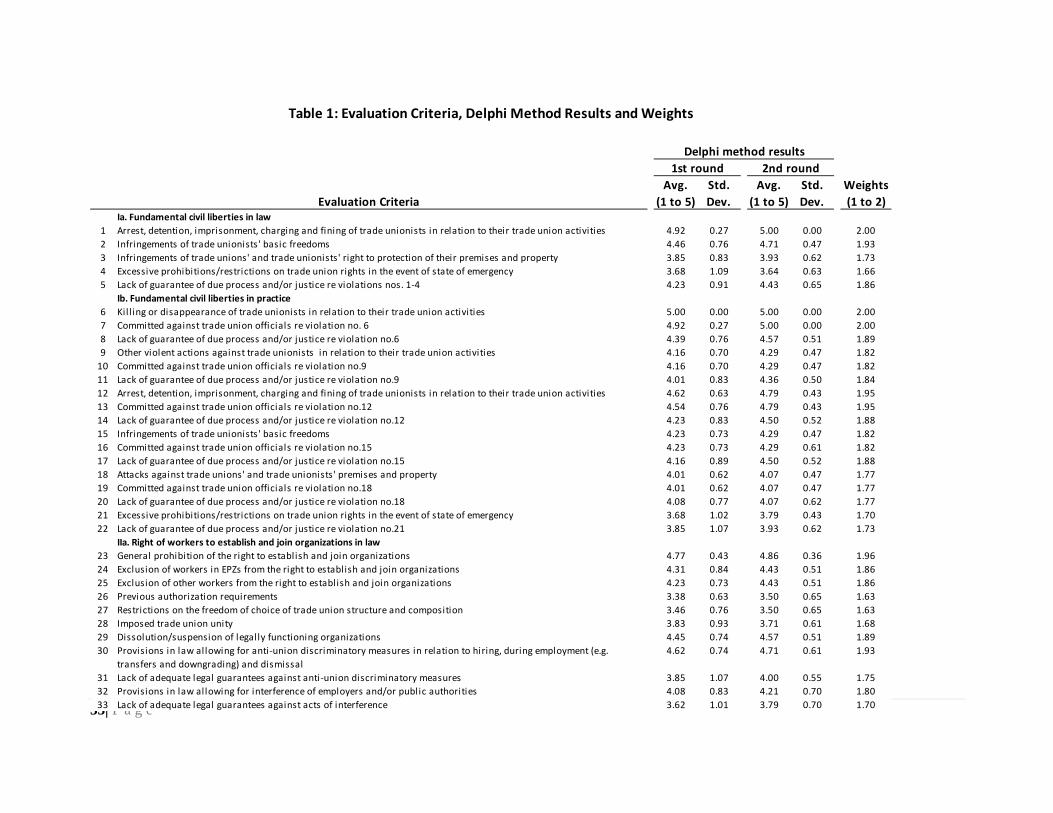
33| P a g e
Avg. Std. Avg. Std. Weights
(1 to 5) Dev. (1 to 5) Dev. (1 to 2)Ia. Fundamental civil liberties in law
1 Arrest, detention, imprisonment, charging and fining of trade unionists in relation to their trade union activities 4.92 0.27 5.00 0.00 2.00
2 Infringements of trade unionists' basic freedoms 4.46 0.76 4.71 0.47 1.93
3 Infringements of trade unions' and trade unionists' right to protection of their premises and property 3.85 0.83 3.93 0.62 1.73
4 Excessive prohibitions/restrictions on trade union rights in the event of state of emergency 3.68 1.09 3.64 0.63 1.66
5 Lack of guarantee of due process and/or justice re violations nos. 1‐4 4.23 0.91 4.43 0.65 1.86
Ib. Fundamental civil liberties in practice
6 Kill ing or disappearance of trade unionists in relation to their trade union activities 5.00 0.00 5.00 0.00 2.00
7 Committed against trade union officials re violation no. 6 4.92 0.27 5.00 0.00 2.00
8 Lack of guarantee of due process and/or justice re violation no.6 4.39 0.76 4.57 0.51 1.89
9 Other violent actions against trade unionists in relation to their trade union activities 4.16 0.70 4.29 0.47 1.82
10 Committed against trade union officials re violation no.9 4.16 0.70 4.29 0.47 1.82
11 Lack of guarantee of due process and/or justice re violation no.9 4.01 0.83 4.36 0.50 1.84
12 Arrest, detention, imprisonment, charging and fining of trade unionists in relation to their trade union activities 4.62 0.63 4.79 0.43 1.95
13 Committed against trade union officials re violation no.12 4.54 0.76 4.79 0.43 1.95
14 Lack of guarantee of due process and/or justice re violation no.12 4.23 0.83 4.50 0.52 1.88
15 Infringements of trade unionists' basic freedoms 4.23 0.73 4.29 0.47 1.82
16 Committed against trade union officials re violation no.15 4.23 0.73 4.29 0.61 1.82
17 Lack of guarantee of due process and/or justice re violation no.15 4.16 0.89 4.50 0.52 1.88
18 Attacks against trade unions' and trade unionists' premises and property 4.01 0.62 4.07 0.47 1.77
19 Committed against trade union officials re violation no.18 4.01 0.62 4.07 0.47 1.77
20 Lack of guarantee of due process and/or justice re violation no.18 4.08 0.77 4.07 0.62 1.77
21 Excessive prohibitions/restrictions on trade union rights in the event of state of emergency 3.68 1.02 3.79 0.43 1.70
22 Lack of guarantee of due process and/or justice re violation no.21 3.85 1.07 3.93 0.62 1.73
IIa. Right of workers to establish and join organizations in law
23 General prohibition of the right to establish and join organizations 4.77 0.43 4.86 0.36 1.96
24 Exclusion of workers in EPZs from the right to establish and join organizations 4.31 0.84 4.43 0.51 1.86
25 Exclusion of other workers from the right to establish and join organizations 4.23 0.73 4.43 0.51 1.86
26 Previous authorization requirements 3.38 0.63 3.50 0.65 1.63
27 Restrictions on the freedom of choice of trade union structure and composition 3.46 0.76 3.50 0.65 1.63
28 Imposed trade union unity 3.83 0.93 3.71 0.61 1.68
29 Dissolution/suspension of legally functioning organizations 4.45 0.74 4.57 0.51 1.89
30 Provisions in law allowing for anti‐union discriminatory measures in relation to hiring, during employment (e.g.
transfers and downgrading) and dismissal
4.62 0.74 4.71 0.61 1.93
31 Lack of adequate legal guarantees against anti‐union discriminatory measures 3.85 1.07 4.00 0.55 1.75
32 Provisions in law allowing for interference of employers and/or public authorities 4.08 0.83 4.21 0.70 1.80
33 Lack of adequate legal guarantees against acts of interference 3.62 1.01 3.79 0.70 1.70
Table 1: Evaluation Criteria, Delphi Method Results and Weights
Evaluation Criteria
Delphi method results
1st round 2nd round

34| P a g e
34 Infringements of the right to establish and join federations/confederations/international organizations 3.85 0.77 3.93 0.73 1.73
35 Lack of guarantee of due process and/or justice re violations nos. 23‐34 3.93 1.11 4.21 0.58 1.80
IIb. Right of workers to establish and join organizations in practice
36 General prohibition of the development of independent workers' organizations 4.54 0.65 4.71 0.61 1.93
37 Exclusion of workers in EPZs from the right to establish and join organizations 4.31 0.63 4.36 0.50 1.84
38 Exclusion of other workers from the right to establish and join organizations 4.39 0.51 4.43 0.51 1.86
39 Previous authorization requirements 3.77 0.70 3.79 0.43 1.70
40 Restrictions on the freedom of choice of trade union structure and composition 3.62 0.74 3.79 0.58 1.70
41 Imposed trade union unity 3.91 0.80 3.79 0.70 1.70
42 Dissolution/suspension of legally functioning organizations 4.58 0.52 4.79 0.43 1.95
43 Anti‐union discriminatory measures in relation to hiring, during employment (e.g. transfers and downgrading) and
dismissal
4.23 0.91 4.29 0.73 1.82
44 Committed against trade union officials re violation no. 43 4.39 0.65 4.57 0.51 1.89
45 Lack of guarantee of due process and/or justice re violation no. 43 3.93 1.18 4.21 0.58 1.80
46 Acts of interference of employers and/or public authorities 3.85 0.83 4.00 0.68 1.75
47 Lack of guarantee of due process and/or justice re violation no. 46 3.85 1.14 4.07 0.73 1.77
48 Infringements of the right to establish and join federations/confederations/international organizations 3.83 0.80 4.14 0.53 1.79
49 Lack of guarantee of due process and/or justice re violations nos. 36‐48 3.93 1.11 4.07 0.62 1.77
IIIa. Other union activities in law
50 Infringements of the right to freely draw up constitutions and internal rules and administration 3.54 0.85 3.50 0.76 1.63
51 Infringements of the right to freely elect representatives 3.93 0.96 4.21 0.80 1.80
52 Infringements of the right to freely organize and control financial administration 3.46 0.94 3.36 0.93 1.59
53 Infringements of the right to freely organize activities/programmes 3.99 0.83 4.21 0.43 1.80
54 Prohibition of all political activities 3.62 1.34 3.93 0.92 1.73
55 Lack of guarantee of due process and/or justice re violations nos. 50‐54 4.00 1.24 4.29 0.73 1.82
IIIb. Other union activities in practice
56 Infringements of the right to freely draw up constitutions and internal rules and administration 3.92 0.77 4.00 0.55 1.75
57 Infringements of the right to freely elect representatives 4.16 0.70 4.29 0.61 1.82
58 Infringements of the right to freely organize and control financial administration 3.92 0.66 3.86 0.53 1.71
59 Infringements of the right to freely organize activities/programmes 4.07 0.96 4.14 0.77 1.79
60 Prohibition of all political activities 3.69 1.33 3.79 1.05 1.70
61 Lack of guarantee of due process and/or justice re violations nos. 56‐60 3.85 1.17 4.14 0.86 1.79
IVa. Right to collective bargaining in law
62 General prohibition of the right to collective bargaining 4.69 0.61 4.71 0.47 1.93
63 Insufficient promotion of collective bargaining 2.77 0.97 2.79 0.70 1.45
64 Exclusion of workers in EPZs from the right to collective bargaining 4.23 0.83 4.43 0.51 1.86
65 Exclusion of other workers from the right to collective bargaining 4.15 0.77 4.29 0.47 1.82
66 Exclusion/restriction of subjects covered by collective bargaining 3.46 0.85 3.71 0.61 1.68
67 Compulsory arbitration accorded to collective bargaining 3.62 0.93 3.79 0.58 1.70
68 Excessive requirements and/or lack of objective, pre‐established and precise criteria for the determination/recognition
of trade unions entitled to collective bargaining
3.23 0.99 3.36 0.74 1.59
69 Acts of interference in collective bargaining 3.62 1.08 3.64 0.93 1.66
70 Violations of collective agreements 3.68 1.16 3.57 0.85 1.64
71 Infringements of the consultation with workers' organizations 3.46 1.02 3.43 0.94 1.61
72 Lack of guarantee of due process and/or justice re violations nos. 62‐71 3.54 1.45 3.93 0.92 1.73

35| P a g e
IVb. Right to collective bargaining in practice
73 General prohibition of collective bargaining 4.54 0.65 4.57 0.51 1.89
74 Insufficient promotion of collective bargaining 2.92 0.83 2.79 0.70 1.45
75 Exclusion of workers in EPZs from the right to collective bargaining 4.08 0.77 4.29 0.61 1.82
76 Exclusion of other workers from the right to collective bargaining 4.08 0.66 4.36 0.50 1.84
77 Exclusion/restriction of subjects covered by collective bargaining 3.38 0.50 3.36 0.50 1.59
78 Compulsory arbitration accorded to collective bargaining 3.69 0.93 3.71 0.47 1.68
79 Excessive requirements and/or lack of objective, pre‐established and precise criteria for the determination/recognition
of trade unions entitled to collective bargaining
3.62 0.84 3.57 0.76 1.64
80 Acts of interference in collective bargaining 3.77 0.97 3.57 0.85 1.64
81 Violations of collective agreements 4.07 0.88 3.93 0.73 1.73
82 Infringements of the consultation with workers' organizations 3.54 0.85 3.36 0.84 1.59
83 Lack of guarantee of due process and/or justice re violations nos. 73‐82 3.85 1.23 3.86 0.86 1.71
Va. Right to strike in law
84 General prohibition of the right to strike 4.62 0.74 4.79 0.43 1.95
85 Exclusion of workers in EPZs from the right to strike 4.08 1.23 4.36 0.74 1.84
86 Exclusion of other workers from the right to strike 4.16 0.89 4.29 0.73 1.82
87 Exclusion/restriction based on the objective and/or type of the strike 2.77 1.25 2.86 0.95 1.46
88 Provisions in law allowing for the suspension and/or declaration of i l legality of strikes by administrative authority 3.16 0.89 3.36 0.63 1.59
89 Lack of compensatory guarantees accorded to lawful restrictions on the right to strike 3.08 1.12 3.21 0.97 1.55
90 Infringements of the determination of minimum services 2.77 0.70 2.79 0.43 1.45
91 Compulsory arbitration accorded to strikes 3.54 1.22 3.57 0.94 1.64
92 Excessive prerequisites required for exercising the right to strike 3.54 0.85 3.86 0.53 1.71
93 Acts of interference during the course of strike action 3.31 1.07 3.43 0.65 1.61
94 Imposing excessive sanctions in case of legitimate strikes 4.08 1.07 4.29 0.73 1.82
95 Lack of guarantee of due process and/or justice re violations nos. 84‐94 4.08 1.17 4.21 0.89 1.80
Vb. Right to strike in practice
96 General prohibition of strikes 4.62 0.63 4.71 0.47 1.93
97 Exclusion of workers in EPZs from the right to strike 4.08 0.86 4.36 0.63 1.84
98 Exclusion of other workers from the right to strike 4.16 0.58 4.29 0.61 1.82
99 Exclusion/restriction based on the objective and/or type of the strike 3.08 1.14 3.21 0.80 1.55
100 Suspension and/or declaration of i l legality of strikes by administrative authority 3.77 0.70 3.79 0.58 1.70
101 Lack of compensatory guarantees accorded to lawful restrictions on the right to strike 3.17 0.90 3.36 0.74 1.59
102 Infringements of the determination of minimum services 3.08 0.73 3.07 0.62 1.52
103 Compulsory arbitration accorded to strikes 3.54 0.76 3.43 0.65 1.61
104 Excessive prerequisites required for exercising the right to strike 3.54 0.76 3.71 0.61 1.68
105 Acts of interference during the course of strike action 3.54 0.94 3.57 0.76 1.64
106 Imposing excessive sanctions in case of legitimate strikes 4.08 0.92 4.29 0.61 1.82
107 Committed against trade union officials re violation no. 106 4.08 0.92 4.21 0.70 1.80
108 Lack of guarantee of due process and/or justice re violations nos. 96‐107 3.93 1.11 4.07 0.83 1.77
Average 3.92 0.85 4.03 0.62 1.76

36| P a g e
Coding
letter
Ratifying
countries
(Both C. 87
& C. 98)
Non‐
ratifying
countries
Reports of the Committee of Experts on the Application of Conventions and Recommendations a X
Reports of the Conference Committee on the Application of Standards b X
Country Baselines under the ILO Declaration Annual Review c X
Representations under Article 24 of the ILO Constitution d X
Complaints under Article 26 of the ILO Constitution e X
Reports of the Committee on Freedom of Association f X X
National legislation g X
Annual Survey of Violations of Trade Union Rights h X X
Country Reports on Human Rights Practices i X X
Table 2: Textual Sources

37| P a g e
Textual
coding
Binary
coding Weights
Binary
coding x
WeightsIa. Fundamental civil liberties in law
2 Infringements of trade unionists' basic freedoms i 1 1.93 1.93
Ib. Fundamental civil liberties in practice
6 Kill ing or disappearance of trade unionists in relation to their trade union activities fhi 1 2.00 2.00
9 Other violent actions against trade unionists in relation to their trade union activities fhi 1 1.82 1.82
12 Arrest, detention, imprisonment, charging and fining of trade unionists in relation to their trade union activities hi 1 1.95 1.95
IIa. Right of workers to establish and join organizations in law
25 Exclusion of other workers from the right to establish and join organizations ahi 1 1.86 1.86
31 Lack of adequate legal guarantees against anti‐union discriminatory measures a 1 1.75 1.75
34 Infringements of the right to establish and join federations/confederations/international organizations abhi 1 1.73 1.73
IIb. Right of workers to establish and join organizations in practice
39 Previous authorization requirements fhi 1 1.70 1.70
44 Committed against trade union officials re violation no. 43 hi 1 1.89 1.89
45 Lack of guarantee of due process and/or justice re violation no. 43 hi 1 1.80 1.80
IIIa. Other union activities in law
51 Infringements of the right to freely elect representatives ah 1 1.80 1.80
52 Infringements of the right to freely organize and control financial administration ahi 1 1.59 1.59
54 Prohibition of all political activities ahi 1 1.73 1.73
IIIb. Other union activities in practice
58 Infringements of the right to freely organize and control financial administration fhi 1 1.71 1.71
61 Lack of guarantee of due process and/or justice re violations nos. 56‐60 f 1 1.79 1.79
IVa. Right to collective bargaining in law
69 Acts of interference in collective bargaining a 1 1.66 1.66
76 Exclusion of other workers from the right to collective bargaining abhi 1 1.84 1.84
80 Acts of interference in collective bargaining hi 1 1.64 1.64
Va. Right to strike in law
87 Exclusion/restriction based on the objective and/or type of the strike af 1 1.46 1.46
88 Provisions in law allowing for the suspension and/or declaration of i l legality of strikes by administrative authority ahi 1 1.59 1.59
94 Imposing excessive sanctions in case of legitimate strikes afhi 1 1.82 1.82
Vb. Right to strike in practice
105 Acts of interference during the course of strike action hi 1 1.64 1.64
107 Committed against trade union officials re violation no. 106 h 1 1.80 1.80
108 Lack of guarantee of due process and/or justice re violations nos. 96‐107 h 1 1.77 1.77
Sum (non‐normalized score) 24 42.29
Normalized score (0 = best, 10 = worst)1 4.45
1. Note that the weighted non‐normalized score is capped at 95, as described in the text.
Evaluation Criteria
Table 3: Hypothetical Example of Coding and Indicator Construction (for a Single Country and Year)

38| P a g e
Number % share Number % share Number % share
I. Fundamental civil liberties 312 10.9 45 2.7 267 22.7
II. Right of workers to establish and join organizations 1,045 36.5 581 34.4 464 39.5
III. Other union activities 322 11.3 227 13.4 95 8.1
IV. Right to collective bargaining 567 19.8 328 19.4 239 20.4
V. Right to strike 616 21.5 507 30.0 109 9.3
Sum 2,862 100.0 1,688 100.0 1,174 100.0
All violations Violations in law Violations in practice
Table 4: Coded Violations for 183 Countries by Category, 2012
All countries

39| P a g e
FH Political Rights FH Civil Liberties FH Assoc. & Org. Rights Polity2 CIRI Empowerment1
TUR overall 0.62 0.67 ‐0.68 ‐0.60 ‐0.71
TUR in law 0.55 0.57 ‐0.59 ‐0.55 ‐0.66
TUR in practice 0.58 0.63 ‐0.63 ‐0.58 ‐0.64
FH Political Rights FH Civil Liberties FH Assoc. & Org. Rights Polity2 CIRI Empowerment
TUR overall 0.44 0.48 ‐0.48 ‐0.33 ‐0.52
TUR in law 0.45 0.48 ‐0.49 ‐0.40 ‐0.56
TUR in practice 0.30 0.34 ‐0.33 ‐0.15 ‐0.34
FH Political Rights FH Civil Liberties FH Assoc. & Org. Rights Polity2 CIRI Empowerment
TUR overall 0.69 0.74 ‐0.73 ‐0.65 ‐0.74
TUR in law 0.61 0.64 ‐0.64 ‐0.59 ‐0.69
TUR in practice 0.65 0.69 ‐0.68 ‐0.62 ‐0.68
FH Political Rights FH Civil Liberties FH Assoc. & Org. Rights Polity2 CIRI Empowerment
TUR overall 0.50 0.54 ‐0.53 ‐0.37 ‐0.55
TUR in law 0.52 0.54 ‐0.54 ‐0.44 ‐0.58
TUR in practice 0.35 0.39 ‐0.36 ‐0.17 ‐0.36
1. Note that data for CIRI Empowerment is for 2011.
C. Dropping 9 countries WITH default scores
A. All 183 countries WITH default scores
Table 5: Correlation Coefficients (Pearson) with Related Indicators, 2012
B. All 183 countries WITHOUT default scores
D. Dropping 9 countries WITHOUT default scores

40| P a g e
Country
TUR
overall
TUR in
law
TUR in
practiceAfghanistan* 0.90 1.42 0.00
Albania 2.00 1.76 1.41
Algeria 4.53 3.24 3.93
Angola 2.47 2.80 1.11
Antigua and Barbuda 0.91 1.44 0.00
Argentina 4.00 2.27 4.06
Armenia 1.07 1.40 0.29
Australia 3.30 3.71 1.51
Austria 0.00 0.00 0.00
Azerbaijan 1.85 1.48 1.45
Bahamas 3.23 3.93 1.18
Bahrain 6.27 6.57 3.36
Bangladesh 7.63 6.99 5.10
Barbados 1.45 1.10 1.19
Belarus 10.00 3.44 10.00
Belgium 1.82 0.59 2.29
Belize 1.64 1.70 0.90
Benin 2.38 1.98 1.79
Bolivia (Plurinational State of) 3.28 4.33 0.87
Bosnia and Herzegovina 2.01 0.59 2.60
Botswana 4.54 4.27 2.92
Brazil 4.07 3.08 3.37
Brunei Darussalam 3.17 4.70 0.32
Bulgaria 2.70 2.55 1.73
Burkina Faso 1.45 1.12 1.18
Burundi 3.40 3.63 1.76
Cabo Verde 0.50 0.80 0.00
Cambodia 6.60 3.23 7.22
Cameroon 5.61 3.25 5.63
Canada 1.79 1.43 1.41
Central African Republic 2.29 3.35 0.27
Chad* 2.61 1.71 2.43
Chile 2.89 3.43 1.15
China 10.00 10.00 10.00
Colombia 5.27 2.06 6.29
Comoros 0.34 0.29 0.24
Congo* 1.25 1.38 0.60
Costa Rica 2.90 1.99 2.61
Côte d'Ivoire* 2.40 1.92 1.88
Croatia 1.12 0.57 1.21
Cuba 10.00 10.00 10.00
Cyprus 0.19 0.00 0.30
Czech Republic 2.05 1.77 1.47
Democratic Republic of the Congo 3.85 4.00 2.10
Denmark 0.19 0.30 0.00
Djibouti 3.56 1.73 3.90
Dominica 0.36 0.58 0.00
Dominican Republic 3.81 2.29 3.74
Ecuador 4.17 4.55 2.05
Egypt 10.00 10.00 10.00
El Salvador 5.28 4.51 3.84
Equatorial Guinea 10.00 1.14 10.00
Eritrea 10.00 1.75 10.00
Estonia 0.94 0.90 0.60
Appendix Table 1: TUR Indicators, 2012

41| P a g e
Ethiopia 5.84 4.97 4.28
Fiji 6.88 6.04 4.85
Finland 0.00 0.00 0.00
France 1.42 1.39 0.86
Gabon* 1.08 0.00 1.71
Gambia* 1.28 2.02 0.00
Georgia 3.70 2.55 3.31
Germany 0.78 0.93 0.30
Ghana 2.02 2.01 1.18
Greece 1.71 1.91 0.79
Grenada 0.71 1.12 0.00
Guatemala 7.08 2.86 8.36
Guinea 2.16 1.64 1.78
Guinea‐Bissau 0.50 0.55 0.24
Guyana 1.61 1.68 0.87
Haiti 3.63 2.81 2.94
Honduras 4.50 3.96 3.16
Hungary 2.73 1.15 3.17
Iceland 0.53 0.57 0.27
India 6.83 6.95 3.86
Indonesia 5.18 4.93 3.27
Iran (Islamic Republic of) 10.00 10.00 10.00
Iraq 10.00 10.00 10.00
Ireland 0.52 0.82 0.00
Israel 1.47 0.85 1.48
Italy 0.19 0.00 0.30
Jamaica 1.10 0.54 1.21
Japan 2.21 2.94 0.57
Jordan 3.69 4.03 1.80
Kazakhstan 2.55 2.86 1.17
Kenya 4.60 4.61 2.68
Kiribati 1.82 2.88 0.00
Kuwait 3.09 4.33 0.57
Kyrgyzstan* 1.10 1.15 0.60
Lao People's Democratic Republic 10.00 10.00 10.00
Latvia 1.63 1.08 1.50
Lebanon 4.05 4.91 1.50
Lesotho 3.17 2.94 2.08
Liberia 1.51 1.79 0.60
Libya 10.00 10.00 10.00
Lithuania 2.31 1.90 1.76
Luxembourg 0.19 0.30 0.00
Macedonia 1.48 0.58 1.76
Madagascar 3.71 3.19 2.68
Malawi 2.27 1.47 2.12
Malaysia 6.65 7.59 2.95
Maldives 1.97 1.36 1.76
Mali 1.30 0.58 1.47
Malta 0.70 1.11 0.00
Marshall Islands 0.67 0.82 0.24
Mauritania 5.34 5.18 3.27
Mauritius 3.67 1.92 3.89
Mexico 4.15 3.39 3.19
Mongolia 1.05 0.24 1.42
Montenegro 1.99 1.39 1.77
Morocco 3.68 3.73 2.11
Mozambique 2.93 3.50 1.15
Myanmar 4.05 4.00 2.41
Namibia 1.81 1.14 1.73

42| P a g e
Nepal 3.25 4.90 0.24
Netherlands 0.18 0.29 0.00
New Zealand 1.83 2.04 0.86
Nicaragua 2.23 0.85 2.69
Niger 1.30 1.14 0.92
Nigeria 5.20 4.61 3.62
Norway 0.17 0.27 0.00
Oman 3.47 5.49 0.00
Pakistan 7.40 8.47 3.26
Palau 0.52 0.82 0.00
Panama 6.67 5.38 5.18
Papua New Guinea 1.66 2.02 0.60
Paraguay 3.45 2.75 2.71
Peru 5.64 4.26 4.67
Phil ippines 5.81 4.33 4.87
Poland 3.01 1.79 2.98
Portugal 1.20 1.37 0.53
Qatar 10.00 10.00 10.00
Republic of Korea 7.72 6.23 5.99
Republic of Moldova 1.98 1.96 1.17
Romania 3.73 3.92 1.98
Russian Federation 5.61 3.85 5.03
Rwanda 3.08 2.87 2.02
Saint Kitts and Nevis 0.85 1.35 0.00
Saint Lucia 0.39 0.61 0.00
Saint Vincent and the Grenadines 0.70 1.11 0.00
Samoa 1.29 2.05 0.00
San Marino 0.00 0.00 0.00
Sao Tome and Principe 1.53 2.19 0.24
Saudi Arabia 10.00 10.00 10.00
Senegal 2.72 2.27 2.03
Serbia 2.57 2.27 1.80
Seychelles 2.33 2.58 1.11
Sierra Leone 1.72 0.58 2.15
Singapore 3.66 4.57 1.24
Slovakia 0.00 0.00 0.00
Slovenia 0.18 0.28 0.00
Solomon Islands 3.09 4.89 0.00
South Africa 1.68 0.84 1.82
Spain 1.11 0.00 1.75
Sri Lanka 5.17 3.76 4.43
Sudan 10.00 10.00 10.00
Suriname 0.35 0.00 0.56
Swaziland 6.46 5.19 5.04
Sweden 0.54 0.24 0.61
Switzerland 1.47 1.72 0.60
Syrian Arab Republic 10.00 10.00 10.00
Tajikistan* 1.65 1.73 0.88
Thailand 6.09 6.06 3.59
Timor‐Leste 0.58 0.91 0.00
Togo 1.31 1.17 0.91
Trinidad and Tobago 1.77 1.94 0.87
Tunisia 2.40 1.20 2.60
Turkey 6.39 5.61 4.50
Turkmenistan 10.00 10.00 10.00
Tuvalu 1.60 2.29 0.24
Uganda 3.70 2.89 2.97
Ukraine 3.76 1.47 4.48
United Arab Emirates 10.00 10.00 10.00

43| P a g e
United Kingdom 2.58 2.30 1.79
United Republic of Tanzania 4.22 4.57 2.12
United States of America 4.57 4.58 2.65
Uruguay 0.51 0.54 0.27
Uzbekistan 10.00 3.13 10.00
Vanuatu 2.68 4.24 0.00
Venezuela 7.01 3.36 7.75
Viet Nam 10.00 10.00 10.00
Yemen* 2.60 2.90 1.21
Zambia 4.63 4.91 2.43
Zimbabwe 7.19 6.06 5.32
* Note that we recommend dropping the 9 asterisked countries
from the sample for reasons noted in the text.
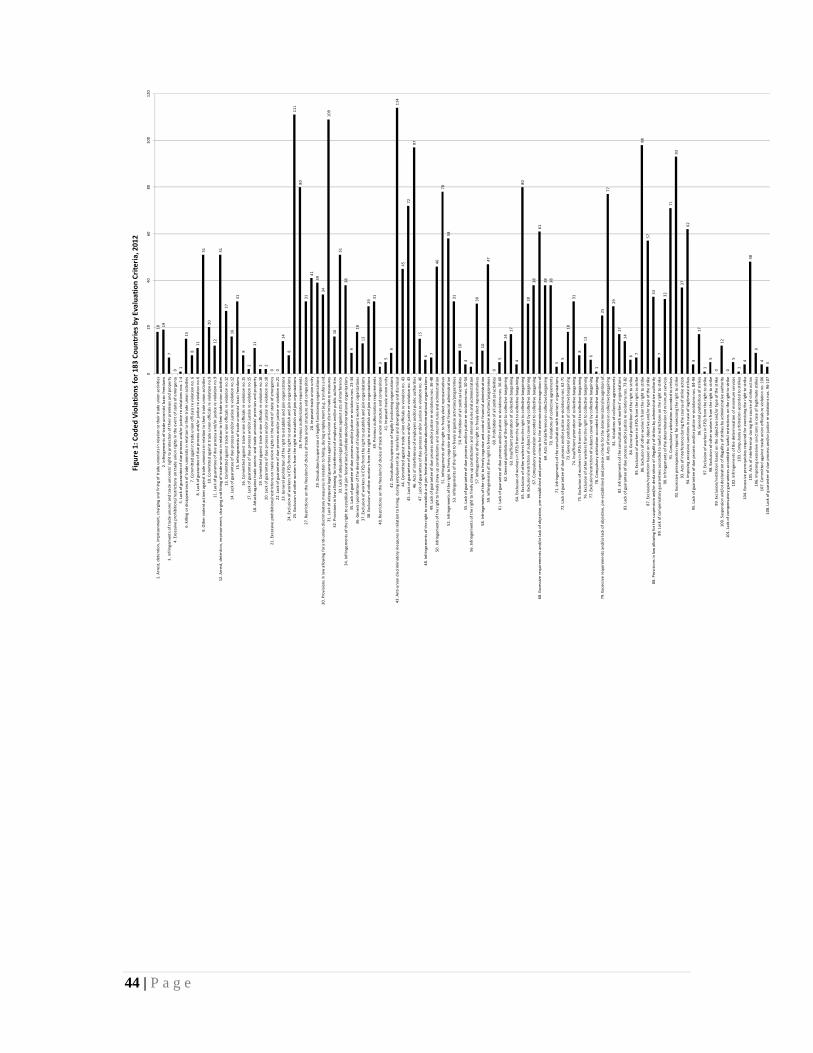
44 | P a g e
18 19
7
0
1
15
8
11
51
20
12
51
27
16
31
8
2
11
2 2
0 0
14
8
111
80
31
41
39
34
109
16
51
38
9
18
13
29
31
3
5
9
114
45
72
97
15
6
7
46
78
58
31
10
4
3
30
10
47
0
5
14
17
4
80
30
38
61
38
38
3
5
18
31
8
13
6
1
25
77
29
17
14
6
7
98
57
33
7
32
71
93
37
62
4
17
1
5
0
12
0
5
1
4
48
9
4
3
020
40
60
80
100
120
1. A
rrest, detention, imprisonment, charging and fining of trade unionists in
relation to their trade union activities
2. Infringem
ents of trade unionists' basic freedoms
3. Infringem
ents of trade unions' and trade unionists' right to protection of their premises and property
4. Excessive prohibitions/restrictions on trade union rights in
the event of state of emergency
5. Lack of guarantee of due process and/or justice re violations nos. 1‐4
6. Killing or disappearance of trade unionists in
relation to their trade union activities
7. Committed against trade union officials re violation no. 6
8. Lack of guarantee of due process and/or justice re violation no.6
9. O
ther violent actions against trade unionists in
relation to their trade union activities
10. Committed against trade union officials re violation no.9
11. Lack of guarantee of due process and/or justice re violation no.9
12. A
rrest, detention, imprisonment, charging and fining of trade unionists in
relation to their trade union activities
13. Committed against trade union officials re violation no.12
14. Lack of guarantee of due process and/or justice re violation no.12
15. Infringements of trade unionists' basic freedoms
16. Committed against trade union officials re violation no.15
17. Lack of guarantee of due process and/or justice re violation no.15
18. A
ttacks against trade unions' and trade unionists' premises and property
19. Committed against trade union officials re violation no.18
20. Lack of guarantee of due process and/or justice re violation no.18
21. Excessive
prohibitions/restrictions on trade union rights in the event of state of em
ergency
22. Lack of guarantee of due process and/or justice re violation no.21
23. G
eneral prohibition of the right to establish and join organizations
24. Exclusion of workers in EPZs from the right to establish and join organizations
25. Exclusion of other workers from the right to establish and join organizations
26. Previous authorization requirements
27. Restrictions on the freedom of choice of trade union structure and composition
28. Imposed trade union unity
29. D
issolution/suspension of legally functioning organizations
30. Provisions in law allowing for anti‐union discrim
inatory m
easures in relation to hiring, during employment (e.g. transfers and…
31. Lack of adequate legal guarantees against anti‐union discrim
inatory m
easures
32. Provisions in law allowing for interference of em
ployers and/or public authorities
33. Lack of adequate legal guarantees against acts of interference
34. Infringements of the right to establish and join federations/confederations/international organizations
35. Lack of guarantee of due process and/or justice re violations nos. 23‐34
36. G
eneral prohibition of the development of independent workers' organizations
37. Exclusion of workers in EPZs from the right to establish and join organizations
38. Exclusion of other workers from the right to establish and join organizations
39. Previous authorization requirements
40. Restrictions on the freedom of choice of trade union structure and composition
41. Imposed trade union unity
42. D
issolution/suspension of legally functioning organizations
43. A
nti‐union discrim
inatory m
easures in relation to hiring, during employm
ent (e.g. transfers and downgrading) and dismissal
44. Committed against trade union officials re violation no. 43
45. Lack of guarantee of due process and/or justice re violation no. 43
46. A
cts of interference of employers and/or public authorities
47. Lack of guarantee of due process and/or justice re violation no. 46
48. Infringements of the right to establish and join federations/confederations/international organizations
49. Lack of guarantee of due process and/or justice re violations nos. 36‐48
50. Infringements of the right to freely draw up constitutions and internal rules and administration
51. Infringements of the right to freely elect representatives
52. Infringements of the right to freely organize and control financial administration
53. Infringements of the right to freely organize activities/programmes
54. Prohibition of all political activities
55. Lack of guarantee of due process and/or justice re violations nos. 50‐54
56. Infringements of the right to freely draw up constitutions and internal rules and administration
57. Infringements of the right to freely elect representatives
58. Infringements of the right to freely organize and control financial administration
59. Infringements of the right to freely organize activities/programmes
60. Prohibition of all political activities
61. Lack of guarantee of due process and/or justice re violations nos. 56‐60
62. G
eneral prohibition of the right to collective bargaining
63. Insufficient promotion of collective bargaining
64. Exclusion of workers in EPZs from the right to collective bargaining
65. Exclusion of other workers from the right to collective bargaining
66. Exclusion/restriction of subjects covered by collective bargaining
67. Compulsory arbitration accorded to collective bargaining
68. Excessive
requirem
ents and/or lack of objective, pre‐established and precise criteria for the determination/recognition of…
69. A
cts of interference in
collective bargaining
70. Violations of collective agreements
71. Infringements of the consultation with workers' organizations
72. Lack of guarantee of due process and/or justice re violations nos. 62‐71
73. G
eneral prohibition of collective bargaining
74. Insufficient promotion of collective bargaining
75. Exclusion of workers in EPZs from the right to collective bargaining
76. Exclusion of other workers from the right to collective bargaining
77. Exclusion/restriction of subjects covered by collective bargaining
78. Compulsory arbitration accorded to collective bargaining
79. Excessive
requirem
ents and/or lack of objective, pre‐established and precise criteria for the determination/recognition of…
80. A
cts of interference in
collective bargaining
81. Violations of collective agreements
82. Infringements of the consultation with workers' organizations
83. Lack of guarantee of due process and/or justice re violations nos. 73‐82
84. G
eneral prohibition of the right to strike
85. Exclusion of workers in EPZs from the right to strike
86. Exclusion of other workers from the right to strike
87. Exclusion/restriction based on the objective and/or type of the strike
88. Provisions in law allowing for the suspension and/or declaration of illegality of strikes by administrative authority
89. Lack of compensatory guarantees accorded
to lawful restrictions on the right to strike
90. Infringements of the determ
ination of minim
um services
91. Compulsory arbitration accorded to strikes
92. Excessive
prerequisites required
for exercising the right to strike
93. A
cts of interference during the course of strike
action
94. Imposing excessive sanctions in case of legitimate strikes
95. Lack of guarantee of due process and/or justice re violations nos. 84‐94
96. G
eneral prohibition of strikes
97. Exclusion of workers in EPZs from the right to strike
98. Exclusion of other workers from the right to strike
99. Exclusion/restriction based on the objective and/or type of the strike
100. Suspension and/or declaration of illegality of strikes by administrative authority
101. Lack of compensatory guarantees accorded to lawful restrictions on the right to strike
102. Infringements of the determ
ination of minim
um services
103. Compulsory arbitration accorded to strikes
104. Excessive prerequisites required
for exercising the right to strike
105. Acts of interference during the course of strike action
106. Im
posing excessive sanctions in case of legitimate strikes
107. Committed against trade union officials re violation no. 106
108. Lack of guarantee of due process and/or justice re violations nos. 96‐107
Figure
1: C
oded Violations for 183 Countries by Evaluation Criteria, 2012
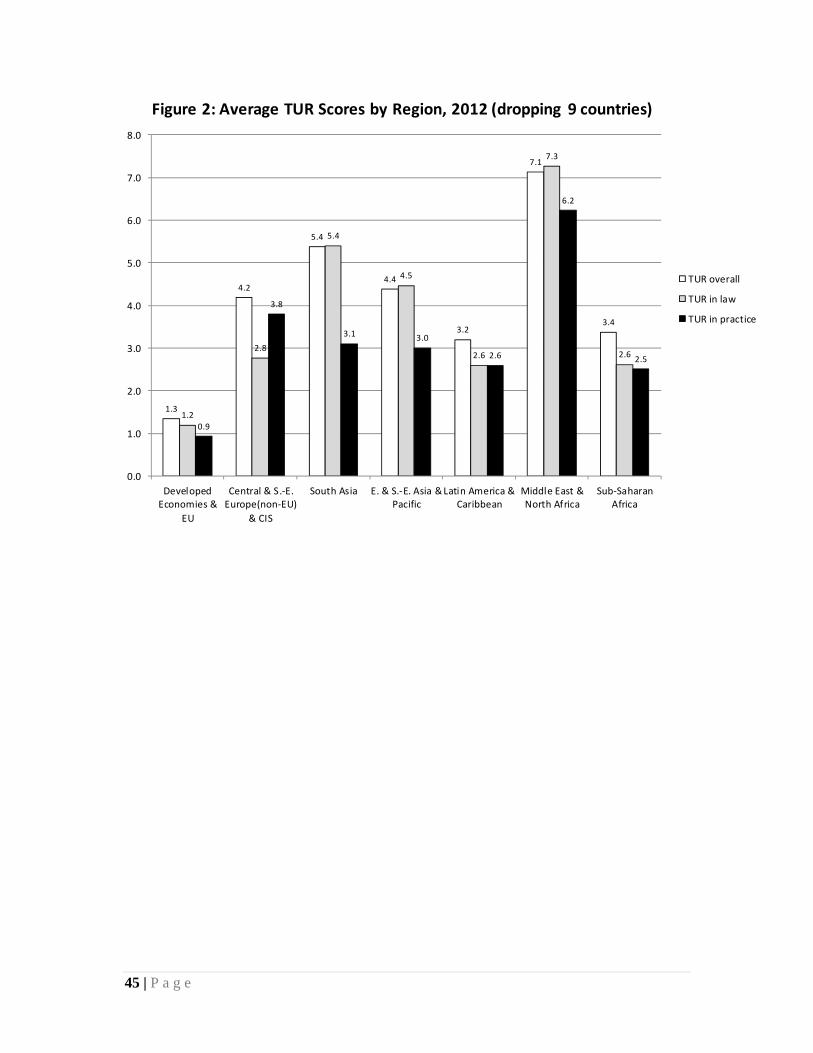
45 | P a g e
1.3
4.2
5.4
4.4
3.2
7.1
3.4
1.2
2.8
5.4
4.5
2.6
7.3
2.6
0.9
3.8
3.1 3.0
2.6
6.2
2.5
0.0
1.0
2.0
3.0
4.0
5.0
6.0
7.0
8.0
DevelopedEconomies &
EU
Central & S.‐E.Europe(non‐EU)
& CIS
South Asia E. & S.‐E. Asia &Pacific
Latin America &Caribbean
Middle East &North Africa
Sub‐SaharanAfrica
TUR overall
TUR in law
TUR in practice
Figure 2: Average TUR Scores by Region, 2012 (dropping 9 countries)

46 | P a g e
Target 8.9 By 2030, devise and implement policies to promote sustainable tourism that creates jobs and promotes local culture and products.
Indicator 8.9.1: Tourism direct GDP as a proportion of total GDP and in growth rate Indicator 8.9.2: Number of jobs in tourism industries as a proportion of totral jobs and growth rate of jobs, by sex From UNWTO (both indicators): Definition … of (a) Tourism Direct GDP (as % total GDP and in growth rate) Tourism Direct GDP (TDGDP) is defined as the sum of the part of gross value added (at basic prices) generated by all industries in response to internal tourism consumption plus the amount of net taxes on products and imports included within the value of this expenditure at purchasers’ prices (TSA: RMF 2008 para. 4.96). Presenting this economic contribution of tourism as a share of GDP shows the relative size of the tourism sector in the economy. … of (b) Number of jobs in tourism industries (as % total jobs and growth rate of jobs, by gender) The “tourism industries”, or tourism characteristic industries, comprise all establishments for which the principal activity is a tourism characteristic activity, i.e. the activities that typically produce tourism characteristic products (IRTS 2008 paras. 5.10-5.11). For international comparability purposes these are (according to ISIC Rev. 4 categories): accommodation for visitors (5510, 5520, 5590, 6810 and 6820), food and beverage serving activities (5610, 5629 and 5630), railway passenger transport (4911), road passenger transport (4922), water passenger transport (5011 and 5021), air passenger transport (5110), transport equipment rental (7710), travel agencies and other reservation service activities (7911, 7912 and 7990), cultural activities (9000, 9102, 9103), and sport and recreational activities (7721, 9200, 9311, 9319, 9321 and 9329). Regarding jobs, the agreement between an employee and the employer defines a job and each self-employed person has a job. The number of jobs in the economy thus exceeds the number of persons employed to the extent that some employees have more than one job (SNA 2008 para. 19.30 in IRTS 2008 Compilation Guide para. 7.6). Consequently, the number of jobs (demand side) and the number of persons employed (supply side) are dissimilar categories and therefore usually do not match. In this respect, it should be noted that employment in the tourism industries refers to all the jobs (in all occupations) in both tourism-characteristic activities and non-tourism-characteristic activities in all establishments in tourism industries19. The indicator shows the relative importance of jobs in the tourism industries as a share of the economy’s total jobs. Method of computation … of (a) Tourism Direct GDP (as % total GDP and in growth rate)
∗ 100
… of (b) Number of jobs in tourism industries (as % total jobs and growth rate of jobs, by gender)
∗ 100
19 International Recommendations for Tourism Statistics: Compilation Guide (Chapter 7. Employment in the tourism industries). Madrid, UN New York 2008WTO, Madrid 2014, para. 7.4; available at: http://unstats.un.org/unsd/publication/SeriesM/seriesm_83rev1e.pdf

47 | P a g e
Rationale Target 8.9 has several dimensions but the essence of the target seems to be on promoting sustainable tourism [that …]. It is recognized that the suggested indicator does not cater to all dimensions of the target, but finding one indicator that would do so seems unviable, certainly over the short-medium term. There is the added challenge that the concept “sustainable tourism” is mainly a policy construct and not defined nor part of an established or internationally conceptual/statistical framework at this point. Even though UNWTO together with a number of countries, UNSD and OECD, and counting on the support of the UNCEEA are putting put in motion an initiative towards developing the measurement of the relationship between tourism and sustainability, notably through linking SEEA and TSA, it seems that the production of internationally comparable data on (something that could approximate for) “sustainable tourism” in a significant number of countries still has some years to go. For the meantime, the suggested indicator (in its two parts, on tourism related GDP and jobs) seems to be a sensible approximation because (a) it is a good conceptual fit to some key dimensions of the target (b) it stems from a systems approach and is based on sound internationally agreed methodology, and (c) there is a significant number of countries already producing data for this indicator. In addition, the suggested indicator (tourism related GDP and jobs) is in line with Goal 8’s general focus on economic growth and employment. Finally, the TDGDP/GDP part of this indicator can complement Target 14.7’s indicator: “Fisheries as a % of GDP” in order to cater to tourism dimension of this target. Interpretation … of (a) Tourism Direct GDP (as % total GDP and in growth rate) Target 8.9 has several dimensions; this caters to the dimension: tourism; promote [...] tourism. The value of the economic contribution of tourism captured by this indicator, and (relative) increases or decreases in it, could indicate the degree to which tourism is being successfully promoted. This indicator is useful for policy on tourism at national level and the level of sub-national regions as it gives the only credible measure of the economic contribution of tourism, which can be compared to GDP contributions of other economic activities. The indicator has been found especially useful in promoting and mainstreaming tourism in policy agendas at all levels. The indicator can also be compared across countries, although true international comparability of the figures needs to be improved. ... of (b) Number of jobs in tourism industries (as % total jobs and growth rate of jobs, by gender) Target 8.9 has several dimensions; this caters to the dimension: tourism that creates jobs. It could also give an indication on how successful the "promotion" of tourism as job creator is being: promote […] tourism that creates jobs Sources and data collection … for (a) Tourism Direct GDP (as % total GDP and in growth rate) The indicator already exists. The indicator is sourced from countries’ Tourism Satellite Account, which is a satellite account to the National Accounts. About 60 countries have some kind of TSA exercise and data available on this indicator, as shown in an international TSA data compilation exercise UNWTO realized in 2010. Eurostat and OECD have also occasionally collected data on this indicator. The indicator is currently not structurally compiled into an international dataset but UNWTO will start on this over the short term. Some countries cannot produce TDGDP but have Tourism Direct Value Added (% Total Value Added), which can be used as an approximation. … for (b) Number of jobs in tourism industries (as % total jobs and growth rate of jobs, by gender) The indicator, or data series for populating this indicator, already exist and are regularly produced in a substantial number of countries. Currently UNWTO compiles in its international dataset country yearly data on “Jobs in tourism industries” (approx. 26 countries for reference year 2012). This is currently not compiled by gender. ILO compiles in its international dataset (ILOStats) data country data on “total jobs”, by gender (approx.. 111 countries). Coverage could be increased over the medium term through joint UNWTO/ILO and capacity building in countries.
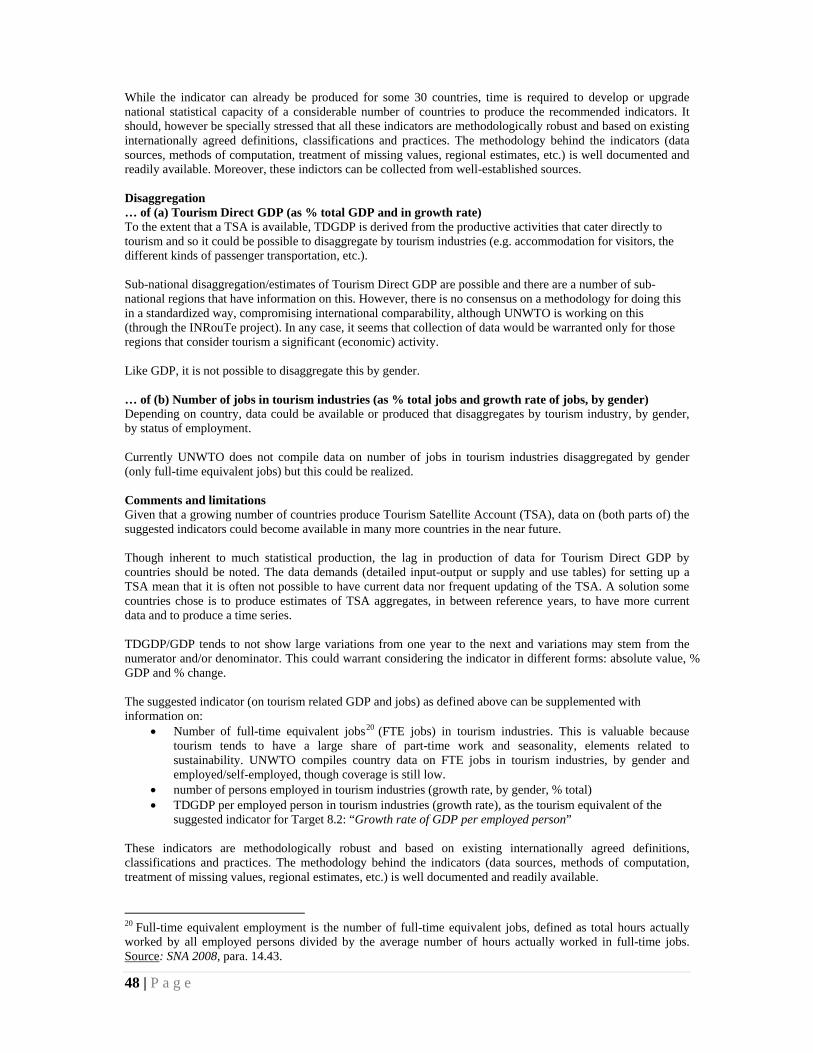
48 | P a g e
While the indicator can already be produced for some 30 countries, time is required to develop or upgrade national statistical capacity of a considerable number of countries to produce the recommended indicators. It should, however be specially stressed that all these indicators are methodologically robust and based on existing internationally agreed definitions, classifications and practices. The methodology behind the indicators (data sources, methods of computation, treatment of missing values, regional estimates, etc.) is well documented and readily available. Moreover, these indictors can be collected from well-established sources. Disaggregation … of (a) Tourism Direct GDP (as % total GDP and in growth rate) To the extent that a TSA is available, TDGDP is derived from the productive activities that cater directly to tourism and so it could be possible to disaggregate by tourism industries (e.g. accommodation for visitors, the different kinds of passenger transportation, etc.). Sub-national disaggregation/estimates of Tourism Direct GDP are possible and there are a number of sub-national regions that have information on this. However, there is no consensus on a methodology for doing this in a standardized way, compromising international comparability, although UNWTO is working on this (through the INRouTe project). In any case, it seems that collection of data would be warranted only for those regions that consider tourism a significant (economic) activity. Like GDP, it is not possible to disaggregate this by gender. … of (b) Number of jobs in tourism industries (as % total jobs and growth rate of jobs, by gender) Depending on country, data could be available or produced that disaggregates by tourism industry, by gender, by status of employment. Currently UNWTO does not compile data on number of jobs in tourism industries disaggregated by gender (only full-time equivalent jobs) but this could be realized. Comments and limitations Given that a growing number of countries produce Tourism Satellite Account (TSA), data on (both parts of) the suggested indicators could become available in many more countries in the near future. Though inherent to much statistical production, the lag in production of data for Tourism Direct GDP by countries should be noted. The data demands (detailed input-output or supply and use tables) for setting up a TSA mean that it is often not possible to have current data nor frequent updating of the TSA. A solution some countries chose is to produce estimates of TSA aggregates, in between reference years, to have more current data and to produce a time series. TDGDP/GDP tends to not show large variations from one year to the next and variations may stem from the numerator and/or denominator. This could warrant considering the indicator in different forms: absolute value, % GDP and % change. The suggested indicator (on tourism related GDP and jobs) as defined above can be supplemented with information on:
Number of full-time equivalent jobs20 (FTE jobs) in tourism industries. This is valuable because tourism tends to have a large share of part-time work and seasonality, elements related to sustainability. UNWTO compiles country data on FTE jobs in tourism industries, by gender and employed/self-employed, though coverage is still low.
number of persons employed in tourism industries (growth rate, by gender, % total) TDGDP per employed person in tourism industries (growth rate), as the tourism equivalent of the
suggested indicator for Target 8.2: “Growth rate of GDP per employed person” These indicators are methodologically robust and based on existing internationally agreed definitions, classifications and practices. The methodology behind the indicators (data sources, methods of computation, treatment of missing values, regional estimates, etc.) is well documented and readily available.
20 Full-time equivalent employment is the number of full-time equivalent jobs, defined as total hours actually worked by all employed persons divided by the average number of hours actually worked in full-time jobs. Source: SNA 2008, para. 14.43.

49 | P a g e
Moreover, these indictors can be collected from well-established sources. The statistical capacity for data collection and analysis to support the indicator already partially exists in countries that conduct regular labour Force Surveys21. But it is also true that in order to produce regular estimates of persons employed in the tourism industries, many countries would need launching pilot projects supported with necessary resources and test the indicators produced. Supplementary information and references The above suggested indicator (both parts, on GDP and jobs) is firmly based in the International Recommendations for Tourism Statistics 2008 (IRTS 2008), approved by the United Nations Statistical Commission at its 39th session (26-29 February 2008) and the Tourism Satellite Account: Recommended Methodological Framework 2008 (TSA: RMF 2008), which updates the 2000 version adopted by the UN Statistical Commission. The IRTS 2008 provides the methodological framework (concepts, definitions and classifications) for basic tourism statistics, while the TSA: RMF 2008 provides the conceptual framework for linking tourism statistics to the System of National Accounts, enabling the economic measurement of tourism and the generation of aggregates such as Tourism Direct GDP. Responsible entities World Tourism Organization (UNWTO)
21 According to the ILO information over 100 countries worldwide conduct LFS.

50 | P a g e
Target 8.10 Strengthen the capacity of domestic financial institutions to encourage and expand access to banking, insurance and financial services for all. Indicator 8.10.1: Number of commercial bank branches and automated teller machines (ATMs) per 100,000 adults From UNCDF: Definition and Method of Computation Number of ATMs per 100,000 adults Calculated as: (number of ATMs)*100,000/adult population in the reporting country. Number of branches per 100,000 adults Calculated as follows: (number of institutions + number of branches)*100,000/adult population in the reporting country --- calculated separately for commercial banks, credit unions and financial cooperatives, and all MFIs. Rationale and Interpretation People and businesses need access to financial services that are safe, reliable, and convenient. The high costs of providing these services, particularly to those living and working in more remote areas or for those whose transaction values are low, have led to limited access. New technologies and delivery channels are lowering costs and bringing timely and appropriate services to even more people, but require the institutions providing or partnering to provide services to have the capability to design and deliver these services. Sources and Data Collection The IMF Financial Access Survey (FAS) is the most comprehensive global supply-side data on financial inclusion. The FAS database currently contains annual data for 184 jurisdictions, including all G20 economies, covering a nine-year period (2004-2012). To date, over 94,000 interviews in 126 countries have taken place. FAS collects data on access to and usage of financial services from central banks and other financial regulators around the world on an annual basis. The key FAS indicators help:
• Identify knowledge gaps and set priorities for policies on broadening financial access; • Monitor the effectiveness of these policies over time; • Advance research and analysis to strengthen understanding of the determinants and implications of
financial access and usage. Disaggregation Comments and Limitations In the event that there are future reviews to reduce the number of global SDG indicators, this target could relating to the capacity of financial institutions could be monitored by the percentage of population that have an account. Therefore, the following indirectly related indicator can be used to monitor Target 8.10:
Adults owning an account either through a financial institution or mobile money provider, disaggregated by income level, geography location, gender, age and education (Global Findex)
This is a multi-purpose indicator that is relevant to Targets 1.4, 2.3, 5.a, 10.2. Gender Equality Issues Data for Global and Regional Monitoring The IMF is responsible for annually collecting and compiling this indicator at the international level. References International Monetary Fund. Financial Access Survey (FAS). Washington, DC. Internet site: http://fas.imf.org/Default.aspx http://fas.imf.org/misc/Explanatory_Notes.pdf

51 | P a g e
Indicator 8.10.2: Proportion of adults (15 years and older) with an account at a bank or other financial institution or with a mobile-money-service provider From UNCDF: Definition and Method of Computation Definition This indicator denotes the percentage of respondents who report having an account (by themselves or together with someone else) at a bank or another type of financial institution; having a debit card in their own name; receiving wages, government transfers, or payments for agricultural products into an account or through a mobile phone at a financial institution in the past 12 months; paying utility bills or school fees from an account at a financial institution in the past 12 months; receiving wages or government transfers into a card in the past 12 months; or personally using a mobile phone to pay bills or to send or receive money through a GSM Association (GSMA) Mobile Money for the Unbanked (MMU) service in the past 12 months (% age 15+) Concepts Account (% age 15+): The percentage of respondents who report having an account (by themselves or together with someone else) at a bank or another type of financial institution (see definition for “account at a financial institution”) or personally using a mobile money service in the past 12 months (see definition for “mobile money account”). Rationale and Interpretation Access to formal financial services such as savings, insurance, payments, credit and remittances is essential to the ability of people—regardless of income level, gender, age, education or where they live—to manage their lives, build their futures, and grow their businesses. Having access to an account is an important starting point for people to access a range of financial services. Sources and Data Collection The Global Findex is the only global demand-side data source allowing for global and regional cross-country analysis. The over 100 indicators in the 2014 Global Financial Inclusion (Global Findex) database are drawn from survey data covering almost 150,000 people in 143 economies—representing more than 97 percent of the world’s population. The survey was launched in 2011 by the World Bank with financial support from the Bill & Melinda Gates Foundation. The survey was again carried out in 2014 calendar year by Gallup, Inc. as part of its Gallup World Poll, which since 2005 has continually conducted surveys of approxi-mately 1,000 people in each of more than 160 economies and in over 140 languages, using randomly selected, nationally representative samples. The target population is the entire civilian, non-institutionalized population age 15 and above. The global survey will be conducted every three years. Data Collection: Interview Procedure Surveys are conducted face to face in economies where telephone coverage represents less than 80 percent of the population or is the customary methodology. In most economies the fieldwork is completed in two to four weeks. In economies where face-to-face surveys are conducted, the first stage of sampling is the identification of primary sampling units. These units are stratified by population size, geography, or both, and clustering is achieved through

52 | P a g e
one or more stages of sampling. Where population information is available, sample selection is based on probabilities proportional to population size; otherwise, simple random sampling is used. Random route procedures are used to select sampled households. Unless an outright refusal occurs, interviewers make up to three attempts to survey the sampled household. To increase the probability of contact and completion, attempts are made at different times of the day and, where possible, on different days. If an interview cannot be obtained at the initial sampled household, a simple substitution method is used. Respondents are randomly selected within the selected households by means of the Kish grid. In economies where cultural restrictions dictate gender matching, respondents are randomly selected through the Kish grid from among all eligible adults of the interviewer’s gender. In economies where telephone interviewing is em-ployed, random digit dialing or a nationally representative list of phone numbers is used. In most economies where cell phone penetration is high, a dual sampling frame is used. Random selection of re-spondents is achieved by using either the latest birthday or Kish grid method. At least three attempts are made to reach a person in each house-hold, spread over different days and times of day. Disaggregation It is possible to disaggregate this indicator by country and region, as well as by income level, geography (rural/urban), gender, age and education level. Disaggregation is especially important (1) by income level to monitor progress on target 1.4 on poverty; (2) by geographic location to monitor progress on target 2.3 on agricultural productivity; (3) by gender to monitor progress on target 5.a on gender equality and women’s empowerment; and (4) by all these dimensions to address issues of equality and inclusion of all in target 10.2. Comments and Limitations Gender Equality Issues The indicator can be disaggregated by gender. Data for Global and Regional Monitoring The World Bank is responsible for compiling this indicator at the international level. Supplementary Information Examples References Asli Demirguc-Kunt, Leora Klapper, Dorothe Singer, and Peter Van Oudheusden, “The Global Findex Database 2014: Measuring Financial Inclusion around the World”. Policy Research Working Paper 7255 Data for all indicators can be found on the website. World Bank. Global Findex. Washington, DC. Internet site: http://www.worldbank.org/en/programs/globalfindex

53 | P a g e
Target 8.a Increase Aid for Trade support for developing countries, in particular least developed countries, including through the Enhanced Integrated Framework for Trade-Related Technical Assistance to Least Developed Countries. Indicator 8.a.1: Aid for Trade commitments and disbursements From OECD: Definition and method of computation Total official development assistance (ODA) disbursements that qualify as aid for trade. Data expressed in US dollars at the average annual exchange rate. Rationale and interpretation ODA is the accepted measure of international development co-operation. In this case it captures aid in support of projects and programmes to improve the trade and production capacities of developing countries. Sources and data collection Data are compiled by the Development Assistance Committee (DAC) of the Organisation for Economic Co-operation and Development from returns submitted by its member countries and other aid providers. Data are available here. Disaggregation The data are generally obtained on an activity level, and include numerous parameters. They can thus be disaggregated by provider and recipient country; by type of finance, and by type of resources provided. Some data are also available on the policy objectives targeted by individual projects. Comments and limitations The data only cover official concessional support from donor countries. The OECD and other organisations also collect data on broader investment flows to developing countries. However detailed sectoral information on such flows is lacking. Gender equality issues The data include a “gender equality” marker which identifies individual projects that have a clear gender dimension. Data for global and regional monitoring Data are available for essentially all high-income countries, and for an increasing number of middle-income aid providers. Supplementary information See Aid for trade References See links to publications here.

54 | P a g e
Target 8.b By 2020, develop and operationalize a global strategy for youth employment and implement the Global Jobs Pact of the International Labour Organization. Indicator 8.b.1: Total government spending in social protection and employment programmes as a proportion of the national budgets and GDP From ILO: Definition and method of computation This indicator represents the total public expenditure in social protection and employment programmes expressed as a percentage of the national budget and the Gross Domestic Product (GDP). It also includes the collective bargaining coverage rate, which is calculated as the percentage of employees whose pay and conditions of employment are determined by one or more collective agreements. A collective bargaining agreement refers to “all agreements in writing regarding working conditions and terms of employment concluded between an employer, a group of employers or one or more employers' organizations, on the one hand, and one or more representative workers' organizations, on the other" (ILO Collective Agreements Recommendation, 1951). Rationale and interpretation Total public expenditure in social protection and employment programmes synthesizes the overall public redistributive and employment promotion efforts. Calculating it as a percentage of the national budget and the GDP allows for the analysis of its relative place in the national economy as a whole. The collective bargaining coverage rate provides a measure of the reach of collective bargaining agreements and, as such, can help in assessing and monitoring the development of industrial relations. Sources and data collection Household surveys (LFS, HIES, LSMS, Integrated HH surveys, etc.), Official estimates, Establishment surveys, Administrative records. Disaggregation Data on collective bargaining coverage are available (for a more reduced number of countries) by sex and main economic activity. Comments and limitations The percentage of the national budget or the GDP allocated to the expenditure in social protection and employment programmes is useful for comparative analysis at the national level and at the level of the components (social security scheme, types of employment programmes), but its interpretation presents inherent difficulties. These include understanding the composition of the national social security system and the configuration of employment programmes as well as changes to the framework over time. Other difficulties pertain to the interpretation of each national legal framework underlying national social protection systems and employment programmes. Regarding the collective bargaining coverage rate, given that its reference group is most commonly employees, the relative importance of self-employment in total employment should be kept in mind when interpreting it. This is of particular importance for developing countries, where employees represent a lower share of total employment. Data for global and regional monitoring The ILO does not currently produce global and regional estimates on the topics covered by this indicator. Supplementary information and references For general information on social security statistics, refer to the Resolution concerning the development of social security statistics, available at: http://www.ilo.org/global/statistics-and-databases/standards-and-guidelines/resolutions-adopted-by-international-conferences-of-labour-statisticians/WCMS_087550/lang--en/index.htm Statistical information on social security can be found in the statistical knowledge base of the ILO Social Protection Department, available at: http://www.ilo.org/secsoc/areas-of-work/statistical-knowledge-base/lang--en/index.htm For further details on collective bargaining statistics, refer to the Resolution concerning statistics of collective agreements, available at: http://www.ilo.org/global/statistics-and-databases/standards-and-guidelines/resolutions-adopted-by-international-conferences-of-labour-statisticians/WCMS_087547/lang--en/index.htm For further details of the collective bargaining rates in the context of European and developed countries using the Quality of Employment Framework, please refer to:

55 | P a g e
Handbook on Measuring Quality of Employment: A Statistical Framework. (UNECE and CES): http://www.unece.org/fileadmin/DAM/stats/documents/ece/ces/2015/4_Add.2_Rev1_Guidelines_on_QoEmployment.pdf Responsible entities ILO. Current data availability The ILO has data on the collective bargaining rates for 84 countries. Collective bargaining coverage rate Name Percentage of employees covered by collective bargaining agreements Objectives This indicator gives the proportion of workers in paid employment whose pay and/or conditions of employment are determined by a collective agreement. It provides a measure of the reach of collective bargaining agreements and, as such, can help in assessing and monitoring the development of industrial relations. Formula ((Number of employees whose pay and/or conditions are determined by collective agreement) / Total number of employees) x 100 Concepts and definitions Collective bargaining and collective bargaining agreement as defined by ILO conventions C098 and C154 and the Resolution concerning statistics of collective agreements, adopted by the Third International Conference of Labour Statisticians, 1926 (see glossary). Employees (age 15+): Employees are defined according to the ICSE‐1993 (see glossary). According to national circumstances, it might be useful to include all employed persons for the calculation of the indicator as defined by the Resolution on work, employment and labour underutilisation, adopted by the 19th ICLS in 2013. In this case, the indicator should be disaggregated by status in employment. The denominator used should be documented in the metadata. Recommended data source(s) Common sources for statistics on collective bargaining coverage are administrative records (maintained by unions or government agencies). The numerator and denominator should have the same coverage. As an alternative, establishment surveys or labour force surveys can be used. Recommended metadata The coverage and the reliability of the data sources should be documented. The type of metadata to be provided depends on the source that has been used. In the case of administrative records, the reliability of the data depends on whether the registration of collective agreements is compulsory. Since the duration of collective agreements may vary, care should be taken to also capture the coverage of agreements which have been registered in previous year(s) but are still valid. Possible double counting problems of workers covered by agreements that are reached at different levels should be mentioned. Also, as registered agreements possibly have no expiry date, there may be some element of under‐ or over‐representation which should be documented. Indeed in such a case information will only have been recorded when the agreement registration was first negotiated. In the case of a labour force survey, the worker coverage should be documented. Moreover, it is possible that many workers do not know their coverage status. Thus, a question on collective bargaining coverage can suffer from item non‐response and information on the quality of the responses should be provided. In the case of an establishment survey, the firm size and sectorial coverage should be documented. Such surveys may exclude enterprises with a small number of workers or enterprises from specific sectors (e.g. informal sector) or economic activities (e.g. agriculture). Information about inclusion of workers indirectly covered by one or more collective agreement (e.g. through extension clauses) should also me indicated. International comparisons

56 | P a g e
The Resolution concerning statistics of collective agreements adopted by the Third International Conference of Labour Statisticians in 1926 provides guidance to countries regarding the concept definition of collective agreements and frequency of recording such agreements, as well as other key aspects of statistics on collective agreements and their principal contents. Despite the existence of this international statistical standard, there is a high degree of methodological variation across countries and over time as regards statistics of collective agreements. The Resolution concerning the International Classification of Status in Employment (ICSE) adopted by the Fifteenth International Conference of Labour Statisticians in 1993 provides a statistical definition of employees. Nonetheless, there are differences in operational definitions of employees across countries. Further readings Broughton, A. and C. Welz, 2013: Impact of the crisis on industrial relations. Dublin: European Foundation for the Improvement of Living and Working Conditions. Available at: http://www.eurofound.europa.eu/eiro/studies/tn1301019s/tn1301019s.htm Eurofound, 2012: Social dialogue in times of global economic crisis. Dublin: European Foundation for the Improvement of Living and Working Conditions. Available at: http://www.eurofound.europa.eu/publications/htmlfiles/ef1221.htm ILO, 1926: Resolution concerning statistics of collective agreements. Adopted by the Third International Conference of Labour Statisticians, 1926. Available at: http://www.ilo.org/global/statistics‐anddatabases/standards‐and‐guidelines/resolutions‐adopted‐byinternational‐conferences‐of‐labour‐statisticians/WCMS_087547/lang‐‐en/index.htm ILO, 2013: Decent Work Indicators ‐ Guidelines for producers and users of statistical and legal framework indicators. Second edition, Geneva: ILO. Available at: http://www.ilo.org/stat/Publications/WCMS_223121/lang‐‐ en/index.htm ICTWSS: Database on Institutional Characteristics of Trade Unions, Wage Setting, State Intervention and Social Pacts in 34 countries between 1960 and 2012. Available at: http://www.uva‐aias.net/207 ILOSTAT Database of labour statistics, with statistics for over 100 indicators and 230 countries, areas and territories; includes information on collective bargaining coverage rate for different disaggregations. Available at: http://www.ilo.org/ilostat