gnaraloo turtle conservation programgnaraloo.org/assets/180626_reportexecsummgtcp0818.pdf · file...
TRANSCRIPT

File name: 180626_ReportExecSummGTCP0818.docx 3 July 2018, Page 1 of 13 www.gnaraloo.org
Gnaraloo Bay Rookery
Gnaraloo Cape Farquhar Rookery
Report 2008 - 2018
w w w . g n a r a l o o . o r g
G n a r a l o o W i l d e r n e s s F o u n d a t i o n & G n a r a l o o T u r t l e C o n s e r v a t i o n P r o g r a m
G n a r a l o o T u r t l e C o n s e r v a t i o n P r o g r a m - G n a r a l o o W i l d e r n e s s F o u n d a t i o n
Gnaraloo Turtle Conservation Program

File name: 180626_ReportExecSummGTCP0818.docx 3 July 2018, Page 2 of 13 www.gnaraloo.org
1 EXECUTIVE SUMMARY
The Gnaraloo Turtle Conservation Program (GTCP) is a scientific research and public outreach
program aimed at identifying, monitoring and protecting sea turtle rookeries located along a 65 km
stretch of beach at the southern end of the Ningaloo Reef at Gnaraloo, Western Australia (WA;
Appendix A1). The sea turtle nesting habitat at Gnaraloo Bay, including a 20 km radius internesting
habitat buffer, was identified as a habitat which is critical to the survival of loggerhead turtles of the
southeast Indian Ocean regional management unit (RMU; Recovery Plan for Marine Turtles in Australia,
2017 – 2027). Since 2008, the GTCP has conducted daily beach track surveys, along with a variety of
complementary research and monitoring activities (e.g. Night Surveys, flipper tagging, satellite tagging,
Nest excavations), in the Gnaraloo Bay Rookery (GBR) between 1 November and 28 February.
Additional beach track surveys commenced in season 2011/12 in the Gnaraloo Cape Farquhar Rookery
(GCFR), which is located approximately 22 km north of the Gnaraloo Homestead and unreported prior
to 2011. The primary species nesting in both the GBR and GCFR Survey Areas is the endangered
loggerhead turtle (Caretta caretta), with green turtles (Chelonia mydas) nesting infrequently (Figure 2).
Hawksbill turtles (Eretmochelys imbricata) have been observed foraging in the waters off the Survey
Areas, but no evidence of their nesting has been confirmed. In this document, we report on the activities
of the GTCP during the sea turtle nesting season 2017/18 and summarise findings of the 10-year
monitoring program.
Current indications are that the valuable turtle and feral animal Monitoring, Evaluation, Reporting and
Improving (MERI) research work at Gnaraloo by the GTCP, in the form undertaken during 2008/09 –
2017/18 with full season nesting surveys from November to February, will end on 30 June 2018. There
is because, at the time of this report, there is no funding from private or public sources (including from
the Gnaraloo Station Trust or co-investment grants from Government) for continuation of this work.
Some of the implications of the GTCP ending on 30 June 2018 in its current format (i.e. daily surveys
during consecutive annual full nesting periods for 10 years) are that the 30-year consecutive baseline
data set of nesting by loggerhead sea turtles in the GBR Survey Area will be broken and lost. The GTCP
research field teams will also no longer be present to notice and rescue stranded female sea turtles in
real time during the nesting period nor to monitor and record the impact of feral animals on turtle Nests,
including the possible return of European red foxes (Vulpes vulpes) in future. The level of Predation of
turtle Nests by foxes may return to the high levels reported for the GBR Survey Area prior to 2008/09,
but will go unnoticed as the research undertaken to date by the GTCP will no longer be conducted in
the GBR Survey Area. We will all be the poorer for this.
Given the important findings by the private sector driven scientific sea turtle survey program at Gnaraloo
over the past decade, there is a high likelihood that there are other important turtle nesting hotspots on

File name: 180626_ReportExecSummGTCP0818.docx 3 July 2018, Page 3 of 13 www.gnaraloo.org
beaches of the southern Ningaloo Coast from Quobba Station to Coral Bay. To the authors’ knowledge,
these beaches along the southern Ningaloo Coast have never been systematically surveyed via
scientific on-ground long-term surveys. As such, potential unknown critical sea turtle nesting habitat on
beaches of the southern Ningaloo Coast are not currently specifically protected from potential threats,
such as driving on beaches, camping activities and/or inappropriate future coastal development.
As a reading aid for the report, capitalised words are defined in the Error! Reference source not
found..
Gnaraloo Bay Rookery – Day Surveys
GBR Day Surveys were conducted during 1 November 2017 – 28 February 2018 with no missed days.
A total of 516 Nesting Activities were recorded, including 284 Nests, all laid by loggerhead turtles. The
first Nest was laid on 10 November 2017 and the last Nest was laid on 21 February 2018. The temporal
distribution of Nesting Activities throughout the season was similar to previous seasons, showing an
increase in Nesting Activities and Nests between mid-December and late January. However, in previous
seasons, the GBR Survey Area received an average of 69 Nesting Activities and 38 Nests per week
between 13 December and 23 January, while during season 2017/18, only 53 Nesting Activities and 30
Nests per week were recorded for the same period. As in previous seasons, GBR Sub-section BP8 –
BP9 recorded the majority of Nesting Activities (70.7 %), followed by Sub-sections GBN – BP7 (21.5
%) and BP7 – BP8 (7.8 %).
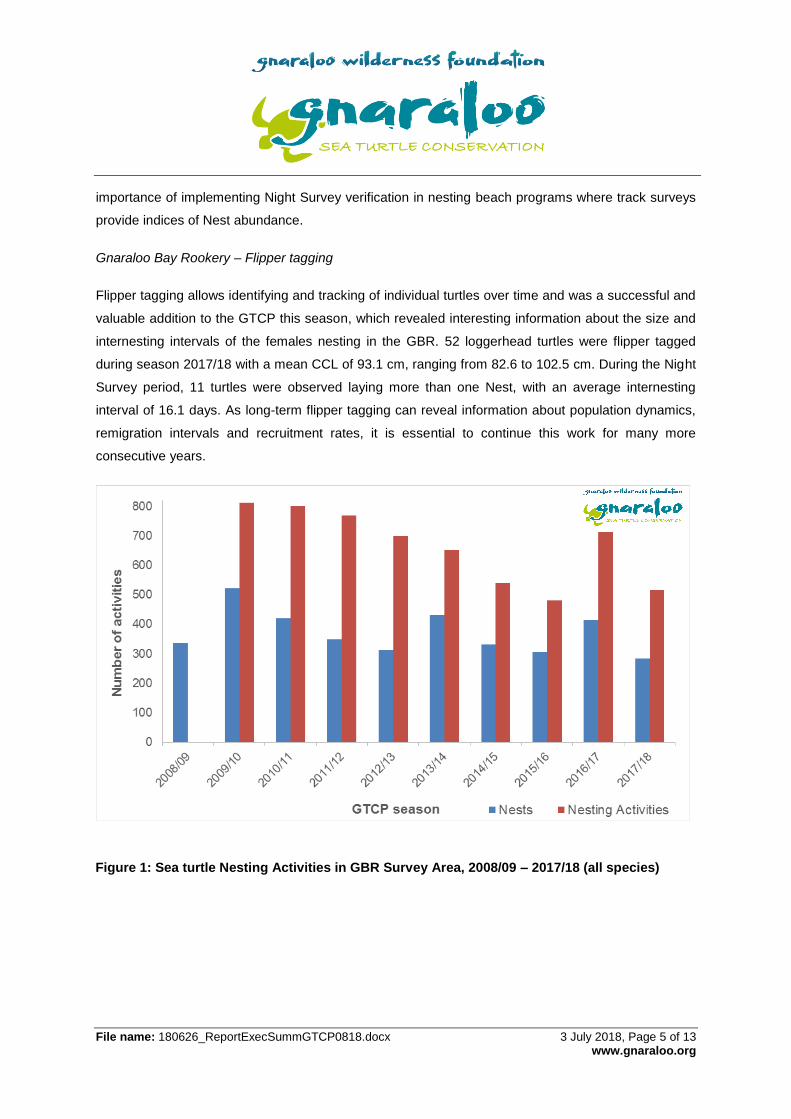
In total, season 2017/18 recorded the second lowest number of total Nesting Activities (the lowest
season being 2015/16) and lowest number of Nests since monitoring began in 2008 (Table 1, Figure
1). No evidence of green turtle nesting was observed, but there was a single green turtle U-Track. The
seasonal numbers of Nesting Activities in the GBR Survey Area from 1 November – 28 February show
a decreasing trend since 2009/101, while the total number of Nests per season do not show a clear
trend since 2008/09. Nesting success (i.e. the proportion of emergences resulting in a Nest) in the GBR
is generally relatively low and has been variable since 2008/09, depending on how favourable local
beach conditions are. Nesting Activities in season 2017/18 were less likely to occur during high spring
tides associated with a full moon, likely because they often created powerful shore-break and high
escarpments on the beach. It is important to keep in mind that 10 years are a relatively short time in
terms of loggerhead turtle life cycles, and inferences on nesting abundance trends and population
dynamics should be made with caution. However, due to the likely long-standing impact of fox Predation
1 Nesting Activity total for 2008/09 excluded because the dates and locations of unsuccessful activities were not recorded during
this season.

File name: 180626_ReportExecSummGTCP0818.docx 3 July 2018, Page 4 of 13 www.gnaraloo.org
on turtle Nests in the GBR prior to the initiation of the Gnaraloo Feral Animal Control Program (GFACP)
in 2008, a general decline in Nest numbers or a stabilisation at low levels may have to be expected for
another two decades.
Coarse analysis of sea surface temperatures (SST) in the eastern Indian Ocean reveals a potential
inverse correlation with Nest numbers in the GBR Survey Area. Warmer SST associated with Indian
Ocean Dipole (IOD) events might have negatively impacted the number of females getting ready to
breed at Gnaraloo in season 2017/18. Comparing the 10-year trend in nesting numbers in the GBR
Survey Area supports this hypothesis, as it could explain the trend for 80 % of the data (Chapter Error!
Reference source not found.). More detailed analyses with larger data sets are necessary to get a better
understanding of SST in foraging habitats and associated nesting abundance on nesting beaches.
Further research is particularly warranted in light of potential consequences which an increase in SST,
due to climate change, might have on sea turtle nesting.
Based on the number of Nests laid in the GBR during each season, it is estimated that between 60 and
120 female loggerhead turtles nest in the GBR during any nesting season. As remigration intervals for
these females are currently not known and likely highly variable, estimates for the total population of
nesting turtles in the GBR range from 200 – 450.
Gnaraloo Bay Rookery – Night Surveys
Night Surveys were conducted in the GBR Survey Area during 16 November – 21 December 2017. The
primary goal of Night Surveys was to verify track interpretations made during Day Surveys in terms of
Species Identification (SI) and Nesting Activity Determination (NAD), as well as to estimate a Nest
detection bias (i.e. the likelihood of correctly identifying Nests during Day Surveys). For the first time
this season, all turtles encountered during Night Surveys were also fitted with titanium flipper tags.
Day Survey track monitoring had an accuracy of 100.0 % for SI (consistent with previous years, which
have all been > 95 %), and 75.4 % for NAD. While this was below the desired 80.0 % accuracy level
for NAD, it was not necessarily indicative of the quality of work of this year’s field research team, as
newly implemented procedures such as flipper tagging and clutch counts made it increasingly difficult
to leave turtle activities unblemished for identification the following day during Day Survey. Nest
detection bias was -10.5 %, indicating that there was a negative systematic bias in terms of Nest
identification, resulting in an overall tendency to underestimate Nest abundance). Nest detection bias
during 2010/11 – 2017/18 averaged -10.7 %, but also decreased during that period, suggesting an
overall tendency to underestimate Nest abundance, but improvement in Nest detection at the program
level over time. Thus, Nest totals given in Table 1 are likely conservative. These results highlight the
File name: 180626_ReportExecSummGTCP0818.docx 3 July 2018, Page 5 of 13 www.gnaraloo.org
importance of implementing Night Survey verification in nesting beach programs where track surveys
provide indices of Nest abundance.
Gnaraloo Bay Rookery – Flipper tagging
Flipper tagging allows identifying and tracking of individual turtles over time and was a successful and
valuable addition to the GTCP this season, which revealed interesting information about the size and
internesting intervals of the females nesting in the GBR. 52 loggerhead turtles were flipper tagged
during season 2017/18 with a mean CCL of 93.1 cm, ranging from 82.6 to 102.5 cm. During the Night
Survey period, 11 turtles were observed laying more than one Nest, with an average internesting
interval of 16.1 days. As long-term flipper tagging can reveal information about population dynamics,
remigration intervals and recruitment rates, it is essential to continue this work for many more
consecutive years.
Figure 1: Sea turtle Nesting Activities in GBR Survey Area, 2008/09 – 2017/18 (all species)

File name: 180626_ReportExecSummGTCP0818.docx 3 July 2018, Page 6 of 13 www.gnaraloo.org
Figure 2: Nests of all sea turtle species in GBR Survey Area, 2008/09 – 2017/18
Gnaraloo Bay Rookery – Satellite tagging
Two loggerhead turtles nesting in the GBR were fitted with satellite trackers in early December 2017.
Both turtles, now named Gnargoo and Baiyungu, laid three more Nests after the initial tagging event.
Their internesting intervals shortened from 15 and 16 days to 14 days in correlation with increasing
water temperatures during the internesting period, which shortens the time needed to produce a new
clutch of eggs. Both turtles nested exclusively in the GBR Survey Area, but spent all internesting
intervals in the waters off the beach in the GCFR Survey Area. Immediately after laying her last Nest,
Gnargoo started her homeward migration, which lasted approximately 3 months. She swam
approximately 4,100 km before reaching her foraging habitat in the eastern Gulf of Carpentaria,
approximately 35 km offshore of the remote community of Aurukun in far north western Queensland
(Qld). Baiyungu returned to her internesting habitat in the GCFR Survey Area after her last Nest, and
started her post-nesting migration one week later. She swam slower and less direct than Gnargoo,
migrating approximately 4,700 km and taking 4.5 months to join Gnargoo in her foraging habitat.
These findings offer valuable new knowledge of the foraging habitats used by some of the loggerhead
turtles that nest at Gnaraloo. Previous satellite tracking undertaken by the GTCP in 2015 - 2017
revealed foraging grounds ranging from Shark Bay, approximately 250 km south of Gnaraloo, in WA all

File name: 180626_ReportExecSummGTCP0818.docx 3 July 2018, Page 7 of 13 www.gnaraloo.org
along the western coast of Australia, to Darwin, Northern Territory (NT; Strydom et al., 2017). The wide
dispersion of foraging habitats along 4,700 km of Australia’s western and northern coastline, including
3 States and Territories, highlights the importance and necessity of comprehensive and collaborative
approaches to sea turtle conservation. As sea turtles spend most of their lives in foraging grounds,
protection of these habitats is crucial and directly affects the number, health and ability to migrate and
breed of resident sea turtles. For effective sea turtle conservation, it is therefore not enough to focus all
protection and management actions on nesting habitats.
The movements of both turtles can be monitored by the public on the free Turtle Tracker App of the
Gnaraloo Wilderness Foundation (GWF), which was launched in December 2015, and on
www.seaturtle.org (Western Australian Loggerheads – Gnaraloo Bay and Gnaraloo Cape Farquhar
2015 – 2018).
Gnaraloo Bay Rookery – Sampled Nest Surveys
Within the GBR Survey Area, a subset of Nests (n = 52) were designated as Sampled Nests. These
were monitored daily for evidence of Predation or Disturbance by feral or native animals, Inundation,
sand movement and evidence of hatchling emergence on the surface. No signs of Disturbance or
Predation by feral animals were observed. In contrast, 90.4 % of all Sampled Nests were either
disturbed or predated by ghost crabs (Ocypode convexa or O. ceratophthalma), which was the second
highest number of Sampled Nests affected by Disturbance or Predation since 2011/12. However, the
precise impact of crab Disturbance and Predation on turtle Hatching success and Emergence success
remains unknown and should be investigated further.
Despite the absence of major storms during season 2017/18, 40.4 % of all Sampled Nests were
inundated by high tides and/or storm surges at least once. Only two seasons since 2011 (2011/12 and
2012/13) had more Sampled Nests inundated, whereas season 2012/13 was affected by tropical
cyclone Nerelle. No instances of Erosion (i.e. exposure of the egg chamber by environmental factors)
were observed, despite 9.6 % of all Sampled Nests experiencing a loss of sand of 20 cm or more on
top of the suspected egg chamber. The same number of Sampled Nests had 20 cm or more sand
accumulating on top of the suspected egg chamber throughout the season, with a maximum of 129 cm
on one Sampled Nest (Section Error! Reference source not found.). It is recommended that the issue
of large accumulations of sand on top of egg chambers during the Incubation period in the GBR Survey
Area, which can lead to suffocation of eggs and hatchlings, be considered in future for management
intervention.

File name: 180626_ReportExecSummGTCP0818.docx 3 July 2018, Page 8 of 13 www.gnaraloo.org
The Incubation period for the 31 Sampled Nests that showed evidence of hatchling emergence on the
surface (i.e. hatchlings or hatchling tracks emerging from the egg chamber) ranged from 58 to 76 days,
with an average of 67.5 days.
A total of 41 Sampled Nests and 1 non-Sampled Nest were excavated at the end of their monitoring
period. No egg chambers were found for 6 Sampled Nests, indicating that they may not have been
Nests as identified during Day Survey. Of all excavations, 26.2 % exposed only few small egg shell
fragments, but no intact egg chamber, indicating crab Predation before, during or after hatching (i.e.
coming out of the shell, rather than emerging on the surface). Excavations of the remaining Sampled
Nests revealed that all clutches hatched to some extent. Overall Hatching success in the GBR Survey
Area was 80.5 ± 20.7 % and Emergence success was 79.3 ± 20.6 %. Estimated clutch size in the GBR
Survey Area was 115.4 ± 25.8 eggs. These values are similar to those reported from other loggerhead
turtle rookeries and emphasise the importance of Nest excavations, as they give a more accurate and
biologically meaningful indication of the reproductive success of a rookery than just superficial
observations.
Gnaraloo Cape Farquhar Rookery – Day Surveys
In addition to monitoring turtle nesting in the GBR Survey Area, the GTCP again conducted Day Surveys
in the Gnaraloo Cape Farquhar Rookery (GCFR) for three consecutive weeks during the assumed peak
nesting period (27 December 2017 – 16 January 2018). A total of 181 Nesting Activities, including 71
Nests, were recorded during these surveys (Table 3). All activities were attributed to loggerhead turtles.
While it is not yet possible to make full-season comparisons with Nesting Activity in the GBR, the GCFR
generally records slightly fewer Nests than the GBR during overlapping monitoring periods (Table 2).
This may be attributed to local beach conditions, as Nesting success in the GCFR over the past four
seasons has on average been approximately 15 % lower than in the GBR during the same monitoring
period. As there are no human disturbances present in the GCFR Survey Area, further investigation
may be warranted to investigate reasons for the low Nesting success. Continued work in the GCFR is
recommended for future seasons.
Education and community engagement
Community engagement has been a central focus of the GTCP since the season 2010/11 and continued
to expand during the season 2017/18. The GTCP directly engaged with 4,665 persons in total (1 June
2017 – 31 May 2018). This was done partially onsite, but also through offsite presentations at schools,
post-secondary institutions and community groups. Offsite presentations also included 24 Skype in the
Classroom (Microsoft Education) lectures to students in the USA, Sweden, Sri Lanka, New Zealand,
Malaysia, Brazil, Egypt, India, Indonesia and Australia. Additionally, 38 Field Diaries were published

File name: 180626_ReportExecSummGTCP0818.docx 3 July 2018, Page 9 of 13 www.gnaraloo.org
during the season 2017/18, allowing a glimpse into the life and work of the GTCP field research team
as well as explaining scientific findings associated with the sea turtle research at Gnaraloo. The free
Turtle Tracker App developed by the GWF was used to share the travels of the two satellite-tracked
loggerhead turtles with the public. The GTCP was also featured in media articles, radio and television
interviews during the season 2017/18. The GTCP Facebook page has over 3,892 followers as of 31
May 2018.
The GTCP also shares its data and program information with the scientific and conservation community
(local, national and international) via several online repositories and websites.
Remarkably the GTCP’s outreach activities during 2010/11 – 2016/17 were provided free of charge to
all participants. Given the end of grant support as well as the previous significant financial support by
the Gnaraloo Station Trust for the season 2018/19 (from 1 July 2018), small fees were asked during
2017/18 for onsite visitor participation with the program as an investment in its future. From 1 July 2018,
the GTCP will also no longer be able to provide the offsite school and public presentations free of charge
as was given during 2010/11 – 2017/18. Education, engagement of and outreach to the community are
important pillars of successful conservation strategies. The accessibility by the public to onsite activities
related to sea turtle science and conservation at Gnaraloo, including participation in surveys, as well as
the educational presentations and Skype in the Classroom lessons should be carried on in future to
continue to build and raise community awareness of sea turtle biology and conservation.

File name: 180626_ReportExecSummGTCP0818.docx 3 July 2018, Page 10 of 13 www.gnaraloo.org
Table 1: 10-year summary of sea turtle Nesting Activities in GBR Survey Area, 2008/09 – 2017/18
GTCP SEASON 2008/09 2009/10 2010/11 2011/12 2012/13 2013/14 2014/15 2015/16 2016/17 2017/18
Loggerhead turtle
Caretta caretta
Nesting Activities (N, UNA, UT, Ua) recorded by Day Survey
N/A 731 758 700 672 635 528 479 695 512
Nests recoded by Day Survey 319 480 399 324 303 424 328 304 405 284
Nest detection bias N/A N/A -17.8 % -21.4 % -15.8 % -11.9 % -11.4 % 0.0 % +2.8 % -10.5 %
Estimated number of females (range)
62 – 76 97 – 119 78 – 96 65 – 79 58 – 71 80 – 98 61 – 75 56 – 69 77 – 94 53 – 65
Percentage of species composition (excludes Unidentified species)
98.2 % 94.1 % 98.0 % 92.8 % 97.7 % 98.6 % 100.0 % 100.0 % 98.5 % 99.8 %
Green turtle
Chelonia mydas
Nesting Activities recorded by Day Survey
N/A 60 15 53 10 10 0 0 9 1
Nests recorded by Day Survey 6 30 8 25 7 6 0 0 6 0
Estimated number of females 1 5 1 4 1 1 0 0 1 1
Percentage of species composition (excludes Unidentified species)
1.8 % 5.9 % 2.0 % 7.2 % 2.3 % 1.4 % 0.0 % 0.0 % 1.5 % 0.2 %
Unidentified species
Nesting Activities recorded by Day Survey
N/A 22 28 16 17 7 11 1 9 3
Nests recorded by Day Survey 11 12 14 0 2 2 3 1 3 0
Total Nesting Activities recorded by Day Survey (all species)
N/A 813 801 769 699 652 539 480 713 516
Total Nests recorded by Day Survey (all species)
336 522 421 349 312 432 331 305 414 284

File name: 180626_ReportExecSummGTCP0818.docx 3 July 2018, Page 11 of 13 www.gnaraloo.org
Notes:
1. This table supersedes all previously issued GTCP nesting summary tables. The numbers recorded for the GBR Survey
Area are conservative as we do not monitor the entire rookery nor the entire nesting period, but only parts thereof due to
logistical and resource constraints. This table only reflects data collected during the now standard GTCP monitoring
period (1 November – 28 February) in the now standard GBR Survey Area (GBN – BP9).
2. If errors were identified in Day Survey track assessments based on comparison with direct Night Survey observations,
they were corrected prior to data summary for this table.
3. Some minor deviations in timing occurred from the now standard GTCP monitoring period. Notably, the portion of GTCP
season 2008/09 that is relevant to Table 1 ran from 1 December 2008 – 28 February 2009, while GTCP season 2010/11
ran from 13 November 2010 – 4 February 2011 (with one day missed due to a cyclone). Thus, numbers for these seasons
are conservative. During season 2011/12, 4 survey days were missed and during season 2012/13, 1 survey day was
missed. Overall, the mean number of days surveyed during GTCP seasons 2008/09 – 2017/18 was 112.8 (SD = 14.0)
4. Only Nest numbers were recorded during the GTCP season 2008/09, other Nesting Activity (i.e. UNA, U-Track and Ua)
numbers were not recorded during the first year of the program. All necessary data were recorded for all Nesting Activity
types in the remaining seasons 2009/10 – 2017/18. The Nest total for 2008/09 was included because dates and locations
for all Nests were recorded.
5. Nests for which the species could not be identified were excluded from species composition calculations.
6. Particularly during the early years of the GTCP (2008/09 – 2009/10), a significant number of tracks in the GBR was
considered to be from hawksbill turtles despite this species being reported to rarely nest as far south as Gnaraloo (pers.
comm., R.I.T. Prince, DBCA). Because hawksbill turtle tracks can be extremely difficult to distinguish from small
loggerhead turtle tracks, particularly on wind prone beaches such as those at Gnaraloo, these track interpretations had
a potential for error. Since 2010/11, we have directly observed 604 turtles during Night Surveys in the GBR Survey Area
(as of 28/02/2018; this includes multiple sightings of individual turtles since most were not flipper tagged and therefore
individuals could not be identified). No hawksbill turtles have been seen. In contrast, the low proportion of green turtles
seen during Night Surveys in the GBR has aligned closely with the proportion of tracks attributed to this species during
Day Surveys. Furthermore, the proportion of tracks ascribed to loggerhead turtles during Day Surveys was initially lower
than the proportion seen during Night Surveys but was equivalent if the putative hawksbill tracks were re-classified as
loggerhead turtle tracks. Based on this evidence, we changed all suspected hawksbill turtle tracks in the Day Survey data
set 2008/09 – 2015/16 to loggerhead turtles to minimise species identification errors. The number of hawksbill turtle Nests
changed to loggerhead turtle Nests during GTCP seasons 2008/09 – 2015/16 was respectively: 14, 78, 2, 0, 1, 5, 0 and
2.
7. Nest detection bias for loggerhead turtles was determined by comparing Day Survey track interpretations with
independent, direct observations of turtle nesting activities during Night Surveys, which were conducted during a subset
of seasons 2010/11 – 2017/18. To be considered ‘verified’ during Night Surveys, the turtle had to be observed during a
nesting phase that would ensure 100 % certainty of the nesting activity (i.e. Nest, UNA or U-Track). For Nests, the turtle
had to be seen at the laying phase at the latest and witnessed depositing eggs into the egg chamber. For UNAs, the
turtle had to be seen at the egg chamber phase at the latest and observed returning to the ocean without laying eggs.
For U-Tracks, the turtle had to be seen at the emergence phase at the latest and witnessed returning to the ocean without
attempting to dig a Nest. For each season, we extracted all verified Night Survey observations and their corresponding
Day Survey track interpretations. This included cases in which a verified activity was missed entirely the following morning
or incorrectly assigned to a green turtle. We then tallied the number of Nests recorded in each data set. The Night Survey
Nest count was taken to represent the true value and the Day Survey Nest count represented the observed value. We
calculated the percent error between the two using the formula: % error = (observed - true) / true * 100. This analysis

File name: 180626_ReportExecSummGTCP0818.docx 3 July 2018, Page 12 of 13 www.gnaraloo.org
was not conducted for green turtles due to the paucity of Night Survey observations for this species.
8. Only the Nest numbers recorded by Day Surveys per season are shown in the table (i.e. not the adjusted Nest numbers
per season in line with the Nest detection bias percentage for that particular season), due to the sample sizes for some
of the seasons being too small.
9. To estimate the number of female loggerhead turtles likely nesting in the GBR during each season, we consulted the
literature for clutch frequency estimates for this species derived from satellite telemetry. Telemetry-based estimates more
accurately reflect true clutch frequency than survey-based estimates since nesting events may be missed during beach
surveys if they are outside a prescribed survey area or period, or are simply not detected (Tucker, 2010). We calculated
the mean and standard deviation (SD) of the estimated clutch frequency (ECF, 4.9 ± 0.5) based on values from currently
available studies (Scott, 2006; Rees et al., 2008; Rees et al., 2010; Tucker, 2010). We then divided the number of Nests
recorded during Day Surveys within each season by the mean ECF ± 1 SD to provide an estimate.
10. The number of female green turtles was estimated using a clutch frequency of 6 (Limpus et al., 2001).

File name: 180626_ReportExecSummGTCP0818.docx 3 July 2018, Page 13 of 13 www.gnaraloo.org
Table 2: 4-year summary of sea turtle Nesting Activities in GCFR Survey Area (27 Dec – 9 Jan),
2014/15 – 2017/18
GTCP SEASON 2014/15 2015/16 2016/17 2017/18
Loggerhead turtle
Caretta caretta
Nesting Activities (N, UNA, UT, Ua) recorded by Day Survey
64 134 114 131
Nests recoded by Day Survey 33 59 55 45
Percentage of species composition (excludes Unidentified species)
100 % 100 % 100 % 100 %
Unidentified species
Nesting Activities recorded by Day Survey
1 0 0 0
Nests recorded by Day Survey 0 0 0 0
Total Nesting Activities recorded by Day Survey (all species)
65 134 114 131
Total Nests recorded by Day Survey (all species) 33 59 55 45
Table 3: 2-year summary of sea turtle Nesting Activities in GCFR Survey Area (27 Dec – 16 Jan),
2016/17 – 2017/18
GTCP SEASON 2016/17 2017/18
Loggerhead turtle
Caretta caretta
Nesting Activities (N, UNA, UT, Ua) recorded by Day Survey
172 181
Nests recoded by Day Survey 86 71
Percentage of species composition 100 % 100 %