glycosylation site occupancy heterogeneity in chinese hamster
TRANSCRIPT

Glycosylation Site Occupancy Heterogeneity in ChineseHamster Ovary Cell Culture
by
Gregg B. Nyberg
B.S. Chemical Engineering and Petroleum RefiningColorado School of Mines, 1992
SUBMITTED TO THE DEPARTMENT OF CHEMICAL ENGINEERINGIN PARTIAL FULFILLMENT OF THE REQUIREMENTS FOR THE DEGREE OF
DOCTOR OF PHILOSOPHYat the
MASSACHUSETTS INSTITUTE OF TECHNOLOGY
June, 1998
'1998 Gregg B. Nyberg. All rights reserved.
The author hereby grants to MIT permission to reproduce and to distribute publiclypaper and electronic copies of this thesis document in whole or in part.
Signature of Author: -iJ CDepartment of Chemical Engineering
April 6, 1998
Certified by: _ _Daniel I. C. Wang
Institute ProfessorThesis Supervisor
Accepted by: -_ _
,.. .. .. *-. 'S INjS 'ii LJTL.G(' . .ANOLOGY
JUL 091998
Robert E. CohenSt. Laurent Professor of Chemical EngineeringChairman, Committee for Graduate Students
Wf@VL~~~~~~CLIBRARIES
-


Glycosylation Site Occupancy Heterogeneity in ChineseHamster Ovary Cell Culture
byGregg B. Nyberg
Submitted to the Department of Chemical Engineering on April 6, 1998in Partial Fulfillment of the Requirements for the Degree of
Doctor of Philosophy in Chemical Engineering
Abstract
Asparagine linked (N-linked) glycosylation is an important secondary modification ofrecombinant proteins. Oligosaccharide chains can significantly influence glycoproteinproperties such as specific activity, solubility, thermal stability and clearance rate in theblood stream. Despite the importance of glycosylation, it is an inherently variableprocess, and not all potential glycosylation sites are occupied with oligosaccharide.Furthermore, glycosylation characteristics can change with time in batch and fed-batchcultures. To investigate the interaction between cellular metabolism and glycosylationsite occupancy heterogeneity, we studied how central carbon metabolism influences theavailability of the nucleotide sugars which serve as sugar donors in glycosylation.
We were able to characterize metabolism and glycosylation through a series of continuousculture (chemostat) experiments with Chinese hamster ovary cells producing recombinanthuman gamma interferon. Nutrient uptake and byproduct formation data obtained inchemostats were used to solve material balances for a biochemical network model ofcentral carbon metabolism. From data obtained in glucose limited chemostats, we foundthat glycosylation correlated with TCA cycle activity, but not glycolysis. This findingled to the hypothesis that nucleotide sugar formation is influenced more by nucleosidetriphosphate availability than hexose availability. Nucleotide and nucleotide sugarmeasurements from these and subsequent experiments confirmed that the primarydeterminants of nucleotide sugar concentrations during exponential growth are nucleosidetriphosphate levels and, in the case of amino sugars such as N-acetylglucosamine, aminosugar formation.
Understanding how to manipulate nucleotide sugar concentrations allowed us toinvestigate how glycosylation site occupancy is influenced by nucleotide sugars in batchand fed-batch experiments. The data indicate that nucleotide sugars primarily influenceglycosylation during periods of glucose or glutamine starvation. Under starvationconditions nucleotide sugar levels drop and glycosylation site occupancy decreases.Nucleotide sugar concentrations can be increased by feeding nucleotide precursors, butthis leads to only modest improvement in glycosylation site occupancy. Thus nucleotide
3

sugar deprivation has a much larger influence than nucleotide sugar expansion.Furthermore, a gradual decline in glycosylation observed during fed-batch exponentialgrowth is caused by a step downstream of nucleotide sugar formation, as nucleotidesugars actually increase during this time.
Thesis Supervisor: Dr. Daniel I. C. Wang
Title: Institute Professor
4
Acknowledgments
At times Ph.D. graduate work can seem very isolating. Freedom to pursue ideas can notonly be exhilarating, but it can also be overwhelming. Looking back on my time at MIT. Ireally appreciate the support and guidance from those around me, who helped keep myresearch on track and my sanity intact. Too often we take people for granted, and do notthank them for their contributions to our lives. I am grateful for this opportunity, so thatI may attempt to express my gratitude to those who made this thesis possible.
My thesis advisor, Professor Daniel Wang, deserves much of the credit for keeping myresearch on track. Dr. Wang kept me focused on the important issues, and I learned toappreciate his direct, honest advice. As my career develops, I can only hope to emulatehis intellectual integrity. Professor Gregory Stephanopoulos also deserves specialmention, especially for his support and guidance on the "Chemostat Project." Dr.Stephanopoulos always made me feel welcome in his research group and provided mewith useful advice. I am also indebted to the other members of my thesis committee,Professors Harvey Lodish, Douglas Lauffenburger and Linda Griffith. for their commentsand suggestions.
One of the primary reasons I came to MIT was for the interaction with other graduatestudents. My fellow graduate students at BPEC not only contributed to my research, butthey made my graduate career enjoyable. They taught me cell culture, biology andlaboratory techniques. They also taught me Sheepshead, darts and poker. The politicaland philosophical discussions at lunch gave me things to think about other than research.Thank you to David Chang, Keqin Chen, John Chung, Peter Frier, Joydeep Goswami,Bryan Harmon, Brian Kelley, Dan Lasko, Kai-Chee Loh, Gautam Nayar, Jrg Neermann,Chandra Papudesu, Martin Reinecke, Cliff Rutt, Eric Scharin, Marc Shelikoff, TroySimpson, Rahul Singhvi, Araba Lamousd-Smith, Dave Stevenson, Inn Yuk, Liangzhi Xie,Jifeng Zhang and Craig Zupke. I would like to express special thanks to Brian Follstadand Robert Balcarcel (members of the Chemostat Team who worked with me on theexperiments described in Chapter 5), Sherry Gu (my fellow IFN-y glycosylationresearcher-I forgive her for arriving after me and graduating before me) and Steve Meier(classmate turned friend and colleague-I look forward to future poker games).
The opportunity to supervise research assistants was an added bonus in my education.Much of the research described in this thesis was done with their help. Thank you toJessica Oleson, Allen Wong, Shawn Brennan, Shital Shah, Brad Gray and Alethia de Le6n;I hope you learned as much from me as I learned from you.
I would also like to express my appreciation to the BPEC staff including Audrey Childs,Sonia Foster, Lynne Lenker, Joya Gargano, James Leung, John Galvin, Darlene Ray,Lorraine Cable and Sara Puffer. With my duties as "Technical Coordinator" I workedespecially closely with the administrative staff, and I am grateful for their help.
5

Having saved the best for last, I would like to thank my family for their love and support.My mother inspired me by getting her own Ph.D., and she did her best to help guide methrough the graduate school process. Her caring and love will always be appreciated.Although I will never be able to duplicate my father's tireless work ethic and sense ofduty, his example helped get me through the difficult times. I just wish he would take abreak occasionally. My sister has always offered me her love and support, and I hope Ican do the same for her as she works to finish her schooling and start a new career.Finally, I would like to thank my best friend and wonderful wife, Gina. Gina'sencouragement and unconditional love gave me the strength to persevere, and I know shewill continue to be there as we start a new chapter in our life together.
6

Table of Contents
ABSTRACT ........................................ 3
ACKNOWLEDGMENTS .......................................................................................................... 5
TABLE OF CONTENTS .............................. 7
LIST OF FIGURES ............................................................................................... 11
LIST OF TABLES ................................................................................................................. 17
1. INTRODUCTION .................... ...... .................................................................................... 19
1.1 Background ......................................................................................................... 19
1.2 M otivation .......................................................................................................... 20
1.3 Thesis Objectives ............................................................................................... 21
1.4 Thesis Organization ............................................................................................ 21
2. LITERATURE REVIEW .................................................................................................... 23
2.1 Overview of N-linked Glycosylation ................................................................. 23
2.2 Implications of N-linked Glycosylation . .......................... ..................... 29
2.2.1 Implications for Protein Folding ............................................................. 292.2.2 Implications for Targeting and Secretion . .............................. 322.2.3 Implications for Glycoprotein Biochemical Properties .......................... 332.2.4 Implications for Circulatory Half-Life ........................................ ... 35
2.3 Factors Influencing N-linked Glycosylation Site Occupancy Heterogeneity .... 38
2.3.1 Lipid-Linked Oligosaccharide Precursor Formation ............................... 382.3.2 Oligosaccharyltransferase Activity ........................................ ... 502.3.3 Substrate Amino Acid Sequence ........................................... 512.3.4 Competition with Protein Folding ........................................... 552.3.5 Cell Culture Environment ........................................... 56
2.4 Model System: Recombinant Human Gamma Interferon Production in ChineseHamster Ovary Cells ........................................ 59
7
3. MATERIALS AND METHODS ........................................................................................... 65
3.1 Cell Culture ...................................................... 65
3.1.1 Cell Line ...................................................... 653.1.2 Chaperone Protein (BiP) Levels in T-flask Cultures ............................. 653.1.3 T-flask Cultures Treated with Tunicamycin . ............................ 663.1.4 Adaption to Suspension Culture ...................................................... 663.1.5 Low-Serum Culture .......................................................... ......... .............673.1.6 Serum-Free Culture ...................................................... 673.1.7 Culture M aintenance .............................................................................. 69
3.2 Pulse-Chase Radiolabeling Experiment ...................................................... 69
3.3 Pulse Radiolabeling Experiments ........................................................................ 70
3.3.1 Monitoring Secreted Protein Glycosylation with Radiolabeling ............ 703.3.2 Batch Culture ...................................................... 703.3.3 Fed Batch Culture ...................................................... 713.3.4 Sugar Precursor Fed Cultures ...................................................... 713.3.5 Nucleotide Precursor Fed Cultures ...................................................... 723.3.6 Glucosamine and Uridine Fed Cultures .................................................. 733.3.7 Uridine Fed Batch Culture ...................................................... 74
3.4 Continuous Culture Experiments ...................................................................... 753.4.1 Continuous Culture M edia ....................................... 753.4.2 Bioreactor Operation .............................................................................. 753.4.3 Oxygen Uptake Rate .............................................................................. 763.4.4 Carbon Dioxide Evolution Rate .............................................................. 77
3.5 Analytical M ethods ....................................... 783.5.1 Cell Number, Viability and Dry Cell W eight . ................................. 783.5.2 Sugar and Lactate Assays ....................................... 793.5.3 Amino Acid Analysis ..................................................... ................. 793.5.4 Measuring Amino Acids in Peptides ....................................... 803.5.5 Nucleotide and Nucleotide Sugar Analysis . ............................... 823.5.6 Determination of IFN-y Concentration ....................................... 873.5.7 Radiolabeled IFN-y Glycosylation Site Occupancy Analysis ............... 873.5.8 Accumulated IFN-y Glycosylation Site Occupancy Analysis .............. 883.5.9 Quantitative Western Blot for BiP . .................................... 903.5.10 Total Protein Assay ..................................................... 92
3.6 Material Balancing for Intracellular Flux Analysis . ............................... 93
3.6.1 Biochemical Network ............................................................................ 933.6.2 Calculation of Fluxes .......................... ........ 973.6.3 Redundancy and Consistency ................................................................ 98
8

4. IFN-yGLYCOSYLATION SITE OCCUPANCY IN BATCH AND FED-BATCH CULTURES. 101
4.1 Glycosyiation Site Occupancy Monitoring with Radiolabeling ....................... 102
4.2 Batch Culture Glycosylation Site Occupancy ................................................. 108
4.3 Fed-Batch Culture Glycosylation Site Occupancy .......................................... 113
4.3.1 Transient Starvation Impacts Glycosylation ....................................... 1144.3.2 Glycosylation During Non-Starved Fed-Batch Intervals ..................... 120
5. CENTRAL CARBON METABOLISM AND GLYCOSYLATION: CONTINUOUS CULTURE
EXPERIMENTS ................................................................................................... 125
5.1 Glycosylation Site Occupancy in Continuous Culture ................................. 126
5.1.1 Glycosylation at Steady State ............................................... 1265.1.2 Glycosylation Site Occupancy and Nucleotide Sugars ........................ 128
5.2 Metabolic Flux Analysis ........................................ 130
5.2.1 Redundancy Analysis: Predictions of Oxygen Uptake and CarbonDioxide Evolution ............................... ............................................... 136
5.2.2 Redundancy Analysis using a Statistical Consistency Index ............... 1385.2.3 Estimated Metabolic Fluxes ........................................ .............. 140
5.3 Nucleotide Sugars, Glycosylation and Metabolism ......................................... 141
5.3.1 Reaction Yields Correlated with Glycosylation Site Occupancy ......... 1415.3.2 Nucleoside Triphosphates and Nucleotide Sugars in Chemostat Cultures 1445.3.3 Nucleoside Triphosphates and Nucleotide Sugars in Batch and Fed-
Batch Cultures ...................................................................................... 145
5.4 Discussion ....................................... 148
5.5 Conclusions ........................................ 154
6. THE INFLUENCE OF NUCLEOTIDE SUGARS ON IFN-YGLYCOSYLATION SITE
OCCUPANCY ............................................................................................................... 157
6. 1 Sugar Precursor Feeding .................................... 158
6.1.1 Alternative Carbon Sources .................................................................. 1586.1.2 The Influence of Glucosamine On Nucleotide Sugars and Glycosylation
Site Occupancy .................................. 1616.1.3 Discussion ........................................ 165
6.2 Nucleotide Precursor Feeding ................................. 167
6.2.1 Altered Nucleotide Levels and Glycosylation Site Occupancy withExposure to Nucleotide Precursors .................................................... 167
6.2.2 Uridine Feeding in Fed-Batch Culture . ................................. 1706.2.3 D iscussion ............................................................................................ 181
6.3 Conclusions ........................................ 186
9

7. QUALITY CONTROL OF SECRETED GLYCOPROTEINS VIA MOLECULAR CHAPE.ONES189
7.1 Background ....................................................................................................... 190
7.2 Model Development ............................. 192
7.2.1 M odel Structure ............................... 1927.2.2 Parameter Estimation ............................................................................ 196
7.3 M odel Results .................................................................................................. 200
7.4 Discussion ........................................................................................................ 204
7.5 The Feasibility of Improving IFN-y Quality Through BiP Overexpression in y-CHO Cells ........................................................................................................ 206
7.6 Conclusions ...................................................................................................... 206
8. CONCLUSIONS AND RECOMMENDATIONS ........................... 209
8.1 Conclusions ...................................................................................................... 209
8.2 Recommendations ..................... ......... 212
REFERENCES...................... .............................................................................................. 215
10

List of Figures
Figure 2-1.
Figure 2-2.
Figure 2-3.
Figure 2-4.
Figure 2-5.
Figure 2-6.
Figure 2-7.
Figure 2-8.
Figure 2-9.
Figure 3- 1.
Figure 3-2.
Schematic of the N-linked glycosylation pathway in the endoplasmicreticulum: formation of the oligosaccharide precursor, transfer to proteinand initial sugar trimm ing.............................................................................. 24
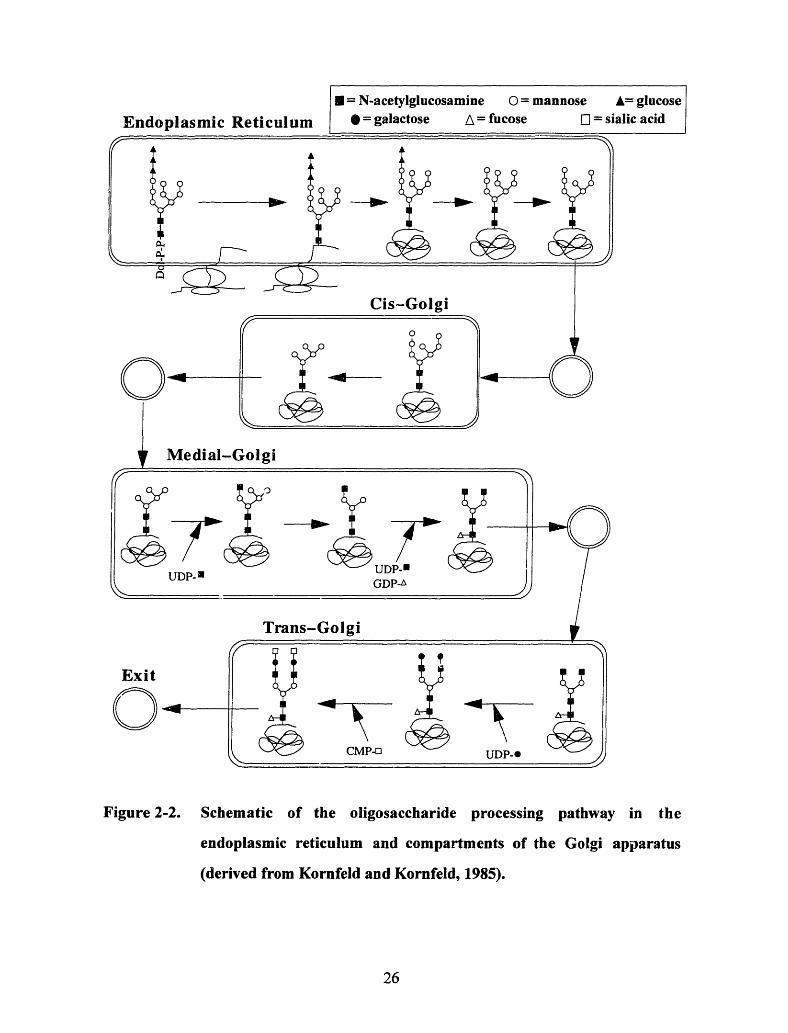
Schematic of the oligosaccharide processing pathway in the endoplasmicreticulum and compartments of the Golgi apparatus (derived from Kornfeldand Kornfeld, 1985) ...................................................................................... 26
Structures representing the major classes of N-linked oligosaccharides.Abbreviations are: GlcNAc, N-acetylglucosamine; Man, mannose; Gal,galactose; Fuc, fucose; NeuNAc, sialic acid ................................................. 28
Biosynthesis of common nucleotide sugars.................................................. 39
The chemical structure of dolichol (n=l 7 to 21 for mammalian cells) .......... 43
The proposed biochemical pathway for dolichol synthesis ........................ 44
A reaction mechanism proposed by Imperiali et al. (1992b) for theoligosaccharyltransferase reaction (Figure reproduced from Silberstein andG ilm ore, 1996) .............................................................................................. 54
The amino acid sequence of mature human interferon-y (after signal peptide
cleavage). Glycosylation sites are indicated by .r ........................ 62
Schematic drawings of E. Coli derived recombinant human interferon-ydimers (from Ealick et al., 1991). (A) Ribbon drawing approximatelyparallel to the dimer twofold axis. (B) The a helices are represented ascylinders, while nonhelical regions are tubes. (C) a helices are representedby circles, with the N-terminal end darkened. Glycosylation sites are
indicated by .......................................................................................... 63
Example chromatogram for a 150 il injection of CHO cell PCA extractanalyzed with pH=6.0 buffers. A. Entire chromatogram. B. Detail ofnucleotide sugar region.................................................................................. 84
Example chromatogram for a 150 jul injection of CHO cell PCA extractanalyzed with pH = 5.0 buffers. A. Entire chromatogram. B. Detail ofUTP and GTP separation............................................................................. 86
11

Figure 3-3.
Figure 4-1.
Figure 4-2.
Figure 4-3.
Figure 4-4.
Figure 4-5.
Figure 4-6.
Figure 4-7.
Figure 4-8.
Figure 4-9.
Figure 4-10.
Figure 4-11.
Figure 4-12.
Figure 4-13.
Schematic diagram of a simplified biochemical reaction network describingcentral carbon metabolism. ........................................... 94
Glycoform distribution of radiolabeled IFN-y secreted during the chaseperiod following a pulse of 35S labeled methionine ..................................... 103
Glycoform distribution of radiolabeled IFN-y secreted following a steppulse of 35S labeled methionine into medium containing 0.1 mM of nn-labeled methionine ..................................................................................... 106
Overview of the pulse radiolabeling technique for monitoring differentialproduct glycosylation site occupancy........................................................ 107
Viable and total -CHO cell numbers during batch suspension culture inlow-serum m edium .................................................................................... 108
Glucose consumption and lactate production during low-serum batch cultureof y-CHO cells. ........................................... 109
Differentially produced IFN-y glycosylation site occupancy monitored withpulse radiolabeling in low-serum batch culture of y-CHO cells ................. 110
Specific glucose consumption rate in low-serum batch culture of -CHOcells ............................................................................................... 11
Normalized intracellular concentration of the molecular chaperone BiP duringlow-serum batch culture of y-CHO cells .................................................... 113
Viable -CHO cell densities in batch and fed-batch serum-free, suspensioncultures ...................................................................................................... 115
Glucose concentration and lactate production during batch and fed-batchserum-free cultures of -CHO cells ............................................................ 116
Glutamine concentration and ammonia accumulation during fed-batch serum-free culture of y-CHO cells ....................................................................... 117
Differentially produced IFN-y glycosylation site occupancy monitored withpulse radiolabeling in batch serum-free culture of y-CHO cells ................. 118
Cell growth in serum-free fed-batch cultures of -CHO cells transfected withthe Bcl-2 anti-death gene and control transfected -CHO cells ................ 121
12

Figure 4-14. Differentially produced IFN-g glycosylation site occupancy monitored withpulse radiolabeling in fed-batch culture of y-CHO cells transfected with theBcl-2 anti-death gene and control transfected y-CHO cells. Glycosylationwas monitored between feeding times with four hour pulses of radioactivemethionine ........................................ 123
Figure 5-1. The relationship between glycosylation site occupancy and intracellularUDP-GNAc concentration in glucose and glutamine limited chemostatcultures ...................................................................................................... 130
Figure 5-2. Schematic diagram of a simplified biochemical reation network describingcentral carbon metabolism ......................................................................... 131
Figure 5-3. Peptide bound amino acids in the feed and reactor effluent for glucose limitedsteady state 4 .............................................................................................. 133
Figure 5-4. Measured specific carbon dioxide evolution rate in glucose limitedchemostats (0) compared to calculated based upon free amino acid data only(+) and calculated based upon total (peptide + free) amino acids (+)...... 136
Figure 5-5. Measured specific oxygen uptake rate in glucose limited chemostats (0)compared to calculated based upon free amino acid data only () andcalculated based upon total (peptide + free) amino acids () .................... 138
Figure 5-6. Reaction yields correlated to glycosylation site occupancy heterogeneity inglucose limited chemostat cultures. Site occupancy correlated with the yieldof the pyruvate to acetyl CoA reaction () and the reactions of the TCAcycle such as oxaloacetate to ao-ketoglutarate () and -ketoglutarate tosuccinyl CoA (+) ...................................................................................... 143
Figure 5-7. The relationship between intracellular UDP-GNAc concentration and UTPin glucose and glutamine limited chemostat cultures ................................. 145
Figure 5-8. The correlation between intracellular UDP-GNAc and UTP duringexponential growth in batch, fed-batch and chemostat cultures. Symbolsindicate results from various independent experiments............................. 146
Figure 5-9. Reduced UDP-GNAc formation under glutamine limitation: the relationshipbetween UDP-GNAc and UTP during glutamine limitation () compared toexponential growth in batch, fed-batch and chemostat cultures (+).......... 147
Figure 5-10. Synthesis of UDP-GIcNAc under glucose and glutamine limitation. Duringglucose starvation, nucleoside triphosphates including UTP are depleted,which limits nucleotide sugar formation. In contrast, glutamine starvationlimits UDP-GlcNAc synthesis by preventing amino sugar formation....... 149
13
Figure6-1. Biosynthesis of common nucleotide sugars from various carbon sources(Schachter, 1978) ................................................ 159
Figure 6-2. Glycosylation site occupancy of IFN-y produced in the presence of varioussugars .......................................................................................................... 160
Figure 6-3. The influence of glucosamine on IFN-Ty glycosylation site occupancy ...... 162
Figure 6-4. The relationship between IFN-y glycosylation site occupancy andintracellular UDP-GNAc with glucosamine and uridine feeding ............... 164
Figure 6-5. Differentially produced IFN-y glycosylation site occupancy monitored withpulse radiolabeling in fed-batch culture of y-CHO cells with and withouturidine supplementation ................................................ 172
Figure 6-6. Percentage of IFN-y two-site glycosylated (monitored with pulseradiolabeling) during fed-batch culture of y-CHO cells with and withouturidine supplementation ................................................ 173
Figure 6-7. Viable y-CHO cell densities during fed-batch culture with and withouturidine supplementation .................................................................. ..... 174
Figure 6-8. Gamma interferon productivity during fed-batch culture of y-CHO cellswith and without uridine supplementation ............................................... 175
Figure 6-9. Changes in intracellular UDP-GNAc concentration during fed-batch cultureof y-CHO cells with and without uridine supplementation ....................... 176
Figure 6-10. Changes in intracellular UDP-Glc+GDP-Man concentration during fed-batchculture of y-CHO cells with and without uridine supplementation ........... 177
Figure 6-11. Glucose concentration during fed-batch culture of -CHO cells with andwithout uridine supplementation. .............................................. 179
Figure 6-12. Glutamine concentration during fed-batch culture of y-CHO cells with andwithout uridine supplementation. .............................................. 180
Figure 6-13. Conceptual schematic of the initial N-linked glycosylation steps. Thenucleotide sugar pool is considered as a liquid in a tank, with the heightcorresponding to the nucleotide sugar concentration .................................. 182
Figure 6-14. The relationship between glycosylation site occupancy and intracellularUDP-GNAc concentration during fed-batch exponential growth of y-CHOcells with and without uridine supplementation. Data is grouped by sampletime ................................... 184
14

Figure6-15. The relationship between glycosylation site occupancy and intracellularUDP-GNAc concentration during fed-batch exponential growth of y-CHOcells with and without uridine supplementation. Data is grouped bysupplemental uridine concentration............................................................ 185
Figure 7-1. Schematic of a single species model for BiP mediated protein folding,secretion and degradation (B = BiP; P = unfolded polypeptide; BP =BiP/unfolded polypeptide complex; F = folded polypeptide; A = unfoldedpolypeptide aggregates; D = degradation products) ................................... 193
Figure 7-2. Model simulation of total BiP concentration versus oligosaccharyltransferase(OST) efficiency in a wild-type cell maintaining a constant level ofumcomplexed BiP ................................................ 201
Figure 7-3. Experimental data for the induction of BiP synthesis in -CHO cells in thepresence of the glycosylation inhibitor tunicamycin (10 gg/ml) ................ 201
Figure 7-4. Model simulation of BiP overexpression: secreted product glycosylation vs.oligosaccharyltransferase (OST) efficiency with varying total BiPconcentrations............................................................................................. 202
Figure 7-5. Model simulation of BiP overexpression: amount of glycosylated productsecreted vs. oligosaccharyltransferase (OST) efficiency with varying totalBiP concentrations. As the total concentration of BiP increases, more of thedesired product is degraded along with the underglycosylated species ...... 203
Figure 8-1. Interactions between metabolism, nucleotide sugar formation andglycosylation site occupancy ........................................................... 211
15


List of Tables
Table 3-1. Listing of reactions included in the simplified biochemical reaction networkdescribing central carbon metabolism. ............................................. 95
Table 3-2. Biomass synthesis requirements for central carbon metabolismintermediates. Requirements (in mmol/gram dry cell weight) were calculatedas described in Zupke and Stephanopoulos (1995). Positive values indicatethe intermediate is consumed in biomass synthesis. Amino acidrequirements for protein synthesis were accounted for separately .............. 96
Table 4-1. Differentially produced IFN-y glycosylation site occupancy monitored withpulse radiolabeling in fed-batch serum-free culture of -CHO cells: theimpact of periodic feeding. ............................................. 119
Table 5-1. Glucose and glutamine limited steady states achieved in continuous culture. 126
Table 5-2. Glycosylation site occupancy for four glucose limited and one glutaminelimited steady state cultures ............................................. 127
Table 5-3. Cell mass-specific nucleotide concentrations (gmole/g viable dry cell weight)measured in perchloric acid extracts.................... ....................................... 129
Table 5-4. Rates of peptide amino acid consumption in steady state chemostat cultures(mmol/g DCW/d) .............................................. 134
Table 5-5. Measured metabolite production rates (r) for steady state chemostat cultures(mmol/g DCW/d). Amino acid production rates include peptide derivedamino acids and are the net catabolic rates after accounting for biomasssynthesis..................................................................................................... 135
Table 5-6. Consistency indices, h, for steady state data analyzed with a metabolicnetwork including two redundant measurements. Glucose limited chemostatdata were analyzed based upon either free amino acid measurements only oron total (free + peptide) amino acid measurements .................................... 139
Table 5-7. Estimated central carbon metabolism reaction yields (mmole/g viable dry cellweight) for chemostat steady state cultures ........................................ 142
Table 6-1. The effects of uridine (5 mM) and glucosamine (2 mM) on intracellularnucleotide levels (gmol/g viable dry cell weight) ....................................... 163
Table 6-2. The effects of various nucleotide precursors on intracellular nucleotide levels(gumol/g viable dry cell weight) .................................................................. 168
17

Table 6-3. The effects of various nucleotide precursors on secreted IFN-yglycosylation site occupancy .................................................................... 170
Table 6-4. Site-specific oligosaccharide microheterogeneity of IFN-y secreted duringfed-batch culture of y-CHO cells with and without uridine supplementation. 181
18

1. Introduction
1.1 Background
Biological systems have been used by man for thousands of years. Even before
microorganisms were discovered, fermentations were used to produce intoxicating drinks
and to age food. With Pasteur's discovery in the mid 1800's that alcoholic fermentations
and certain diseases were caused by living organisms, the science of microbiology was
born. Initial industrial uses of microorganisms were to produce small molecules such as
ethanol, acetone and citric acid. As the field of microbiology advanced, the products
became more complicated. World War II brought the development of biological
fermentations to produce antibiotics such as penicillin and streptomycin. Advances in
biochemistry had revealed that chemical reactions were catalyzed by proteins, and
naturally occurring enzymes were soon being produced as another major product from
microorganisms. Unfortunately many proteins of pharmaceutical or industrial interest
were not produced in sufficient quantities in their natural hosts, and this limited the
number of proteins which could be produced.
With the development of molecular biology in the 1960's and 1970's, it became possible
to produce large quantities of proteins that were difficult or impossible to isolate from
natural sources. Recombinant DNA technology made it possible to produce proteins in
virtually any cell line once the gene had been isolated. In 1982 human insulin became the
first recombinant pharmaceutical product approved for use in the United States. Rather
than being isolated from pig pancreas, insulin was then produced in a recombinant
Escherichia coli cell line. Today recombinant proteins produced in yeast, bacteria and
animal cells are sold for billions of dollars annually.
19

1.2 Motivation
Recombinant proteins are typically produced in animal cell culture when the protein is
not adequately processed by faster growing and more easily manipulated organisms such
as bacteria and yeast. Animal cells are able to correctly fold and covalently modify
proteins, and this post-translational processing can significantly impact protein
properties. The most extensive covalent modification performed by eukaryotic cells is
glycosylation, which is the attachment of sugars to the polypeptide chain. Glycosylation
is especially important for therapeutic proteins, because the oligosaccharides can
significantly impact biological activity and circulatory half-life within the body. Thus the
quality of recombinant product can depend upon the extent of glycosylation.
Despite its importance, glycosylation is an inherently variable process. Potential
glycosylation sites are not always occupied with oligosaccharide (site occupancy
heterogeneity) and the composition of attached oligosaccharides can vary
(microheterogeneity). Furthermore glycosylation characteristics can vary with time
during batch culture and with changes in the culture environment. Consistently producing
high quality biopharmaceuticals requires an understanding of the factors which influence
glycosylation heterogeneity. This thesis research analyzed a specific type of
glycosylation heterogeneity: N-linked glycosylation site occupancy heterogeneity. N-
linked glycosylation occurs at an asparagine residue, and it constitutes the majority of
secreted protein glycosylation. The initial steps of N-linked glycosylation involve the
formation of an oligosaccharide precursor which is bound to the membrane of the
endoplasmic reticulum. The precursor oligosaccharide is subsequently transferred to a
nascent polypeptide, typically as the polypeptide is translocated into the lumen of the
endoplasmic reticulum. The transfer of oligosaccharide precursor does not always
proceed to completion; a given protein may be produced as a heterogeneous population
with potential N-linked glycosylation sites variably occupied.
20

1.3 Thesis Objectives
The goals of this thesis were to monitor N-linked glycosylation site occupancy
heterogeneity during batch and fed-batch cultures, to determine how site occupancy is
influenced by cell culture conditions and to develop strategies for improving site
occupancy. This thesis focused in particular on the role of central carbon metabolism in
providing the sugar precursors for glycosylation. Recombinant human gamma interferon
(IFN-y) produced in Chinese hamster ovary (CHO) cell culture served as the model
system for this study. IFN-y was a good model protein for this study, because it has
two potential glycosylation sites which are variably occupied.
1.4 Thesis Organization
This thesis is organized into eight chapters. The first chapter introduced the research
topic and outlined the specific objectives of the thesis. A more detailed review of relevant
background information is included in Chapter 2. Chapter 3 provides a complete
description of the experimental methods described in the thesis, including cell culturing
protocols, glycosylation monitoring techniques, analytical procedures and metabolic flux
analysis methodologies. Chapter 4 describes results of radiolabeling experiments which
studied how glycosylation site occupancy varied in batch and fed-batch cultures. The
continuous culture experiments described in Chapter 5 analyzed the relationship between
central carbon metabolism and glycosylation in more detail than was possible in batch
experiments. Based upon the results of Chapter 5, Chapter 6 explores the feasibility of
improving glycosylation site occupancy by increasing nucleotide sugar concentrations.
Chapter 6 also examines whether sugar precursors are responsible for glycosylation
changes in fed-batch culture, such as the changes described in Chapter 4. Chapter 7
suggests an alternative method for influencing site occupancy. A mathematical modeling
analysis is presented for how the intracellular chaperone BiP might be used to selectively
retain underglycosylated proteins as a quality control mechanism. Finally, Chapter 8
summarizes important conclusions and presents suggestions for future work.
21

22

2. Literature Review
Most proteins secreted by mammalian cells, including many with pharmaceutical
applications, have sugars covalently attached to their polypeptide backbones (i.e. they
are glycoproteins). The sugars are important because they can significantly impact the
properties of secreted proteins, such as biological activity and circulatory half-life within
the body. The process of sugar attachment, referred to as glycosylation, typically leads
to heterogeneous products. Potential glycosylation sites are not always occupied with
oligosaccharide (site occupancy heterogeneity) and the composition of attached
oligosaccharides can vary (microheterogeneity). This thesis focused on a specific type of
glycosylation heterogeneity: N-linked glycosylation site occupancy heterogeneity. N-
linked glycosylation occurs at an asparagine residue, and it constitutes the majority of
secreted protein glycosylation. This chapter provides background information on N-
linked glycosylation which will be useful for subsequent chapters in this thesis.
2.1 Overview of N-linked Glycosylation
The pathway of N-linked glycosylation has been well established (see reviews in
Hirschberg and Snider, 1987; Kornfeld and Kornfeld, 1985). N-glycosylation occurs as a
series of enzyme catalyzed reactions in the endoplasmic reticulum and Golgi apparatus of
eukaryotic cells. The initial steps involve the formation of a precursor oligosaccharide
which is bound to the membrane of the endoplasmic reticulum via a pyrophosphate
linkage to the lipid dolichol (Dol). The precursor is formed through step-wise addition of
activated sugar monomers. Figure 2-1 illustrates that the first seven sugars (two N-
acetylglucosamine and five mannose) are added directly from nucleotide sugars while the
precursor faces the cytosol (Abeijon and Hirschberg, 1990; Abeijon and Hirschberg, 1992;
Kean, 1991b; Orlean, 1992). This precursor is subsequently flipped to face the lumen of
23

Vesicle TransportTo Golgi
0= Dolichol = Mannose
= N-Acetylglucosamine = Glucose
= Glycosylation Site:A-Qn-XYv-(ferIThrI
Figure 2-1. Schematic of the N-linked glycosylation pathway in the endoplasmic
reticulum: formation of the oligosaccharide precursor, transfer to
protein and initial sugar trimming.
24

the ER where the next seven sugars (four mannose and three glucose) are added from
dolichol linked sugars (dolichol-P-mannose and dolichol-P-glucose). The dolichol linked
sugars are formed from dolichol-P and nucleotide sugars. Dolichol-P-mannose is
synthesized on the cytosolic side of the membrane and subsequently translocated to the
lumen. Protease sensitivity assays with intact microsomes suggest that dolichol-P-
glucose is synthesized in a similar fashion (Abeijon and Hirschberg, 1992). Thus
nucleotide sugar transport into the endoplasmic reticulum may not be necessary for
synthesis of the Glc3Man9GlcNAc2-P-P-Dol precursor. Although sugar transporters for
the nucleotide sugars UDP-glucose (UDP-Glc) and UDP-N-acetylglucosamine (UDP-
GlcNAc) have been identified, these transporters may be necessary for other
glycosylation reactions such as O-linked glycosylation, phosphatidylinositol (GPI)-
anchored glycosylation and for transient reglucosylation of N-linked oligosaccharides after
they have been added to protein and trimmed (Abeijon and Hirschberg, 1992). The
mechanisms of Dol-sugar and Man5GlcNAc2-P-P-Dol translocation across the ER
membrane are not known. Dolichol has been shown to induce destabilization of
phospholipid bilayers, and this property may play a role in a protein-mediated
translocation process (Abeijon and Hirschberg, 1992).
Once the Glc3Man 9GlcNAc 2-P-P-Dol precursor has been formed, it is transferred onto a
nascent polypeptide chain, where it forms an amide bond to an asparagine residue that is
part of the tripeptide recognition sequence Asn-Xxx-Ser/Thr (Xxx is any amino acid
except proline). Oligosaccharyltransferase catalyzes this transfer, typically co-
translationally as the polypeptide is translocated into the lumen of the endoplasmic
reticulum (Rothman and Lodish, 1977), although post-translational glycosylation can also
occur (Sareneva et al., 1994). Following some initial sugar trimming reactions in the ER,
the protein is transported via vesicles to the Golgi apparatus. Figure 2-2 illustrates that
the protein is transferred through the compartments of the Golgi (again via vesicles),
where the oligosaccharide undergoes various enzyme catalyzed sugar transfer and
trimming reactions. These modifications create the high mannose, complex and hybrid
25
Endoplasmic Reticulum
Exit
Figure 2-2. Schematic of the oligosaccharide processing pathway in the
endoplasmic reticulum and compartments of the Golgi apparatus
(derived from Kornfeld and Kornfeld, 1985).
26
CMP-o UDP-@- - - -
CMP-O UDP-0

type oligosaccharides depicted in Figure 2-3. All N-linked oligosaccharides contain a core
of Man3GlcNAc2-Asn, and it is the composition of the outer branches which determine
whether the oligosaccharide is classified as high mannose, complex or hybrid. High
mannose oligosaccharides have only mannose residues on the outer branches, while
complex structures have N-acetylglucosamine and galactose residues. Hybrids have at
least one complex branch and at least one high mannose branch. Up to four branches can
be attached to the core oligosaccharide. Additional heterogeneity can arise from terminal
sialic acid groups which may be added to the galactose of complex branches. The core
oligosaccharide may also be modified through the addition of fucose or a bisecting
GlcNAc as shown in Figure 2-3.
The compartmentalized, enzyme catalyzed reactions comprising the N-glycosylation
pathway result in heterogeneous glycoproteins. The first potential source of
heterogeneity is the transfer of the Glc3Man9GlcNAc2 oligosaccharide precursor to the
nascent polypeptide. This reaction does not always proceed to completion, and
asparagines that are potential glycosylation sites may not have oligosaccharides attached.
This type of heterogeneity is referred to as site occupancy heterogeneity or
macroheterogeneity. A second type of heterogeneity, called microheterogeneity, arises
from the myriad sugar trimming and addition reactions which may occur once the
oligosaccharides are attached to protein. The sequence or extent of reactions may vary as
proteins move through the compartments of the Golgi, causing the attached
oligosaccharides to vary in composition from molecule to molecule. Because of macro-
and microheterogeneity, glycoproteins are usually expressed as sets of glycoforms which
share a common amino acid sequence but have different glycosylation characteristics.
Glycoforms can have varying functional properties, and so it is desirable to produce
therapeutic glycoproteins as reproducible sets of glycoforms. This thesis focuses in
particular on site occupancy heterogeneity.
27

NeuNAcI
GalI
GlcNAcI
Man
NAc ManI
GIcNAc
Fuc - GIcNAcI
Asn
Complex
Gal
GlcNAc
Man
±GlcNAc
NeuNAc
Gal
GicNAc
Man
Man
Man
Man
ManI
Man
Man
GIcNAc
GIcNAc
Asn
High Mannose
Man Man
Man
Man
GIcNAcI
GIcNAcI
Asn
Hybrid
Figure 2-3. Structures representing the major classes of N-linked
oligosaccharides. Abbreviations are: GIcNAc, N-acetylglucosamine;
Man, mannose; Gal, galactose; Fuc, fucose; NeuNAc, sialic acid.
28
Man
Man
±Glcl
:i
Man

2.2 Implications of N-linked Glycosylation
2.2.1 Implications for Protein Folding
The oligosaccharides attached to nascent polypeptides can make an immediate impact by
influencing protein folding. When glycosylation is inhibited (either through chemical
inhibitors such as tunicamycin or through elimination of glycosylation sites through site
directed mutagenesis), many proteins fail to fold correctly (Dorner et al., 1987; Gallagher
et al., 1992; Riederer and Hinnen, 1991; Sareneva et al., 1994). The underglycosylated
proteins often form aggregates which are noncovalently associated with BiP, an abundant
ER resident chaperone protein that binds to hydrophobic regions of incompletely folded
proteins (Gething et al., 1994). The BiP-bound, misfolded proteins are prevented from
secretion and are targeted for eventual degradation (Knittler et al., 1995; Schmitz et al.,
1995). Thus the first important function of N-glycosylation is to aid in the proper
folding of nascent polypeptides.
N-linked oligosaccharides can influence protein folding in multiple ways. The
oligosaccharides enhance the solubility of folding intermediates, stabilize folding domains
and enable the interaction between unfolded protein and lectin-chaperones such as
calnexin (Helenius, 1994). In vitro protein refolding experiments have demonstrated the
influence that oligosaccharides can have on solubility and folding kinetics. A number of
glycoproteins have been shown to refold more slowly and/or to aggregate during refolding
after their carbohydrates have been removed (Kern et al., 1992; SchUlke and Schmid,
1988; Strickland et al., 1985). The hydrophilic nature of the attached carbohydrates helps
to solubilize the folding intermediates and prevent interactions which would otherwise
lead to aggregation. Glycosylation may also help establish folding domains early in the
folding process, because the hydrophilicity of attached oligosaccharides will orient them
to the protein surface, where they will reside in the mature glycoprotein. It should be
noted that oligosaccharides are not always critical for folding. For example, the refolding
29
of ribonucleases is independent of glycosylation (Krebs et al., 1983), which illustrates
that folding can be independent of the presence of oligosaccharides for proteins with a
robust folding pathway.
More recently another role has been identified for oligosaccharides in the folding process.
Lectin-like chaperones have been identified which interact with the oligosaccharides of
glycoproteins and are believed to play a role in protein folding. In vivo protein folding
varies significantly from in vitro refolding because the in vivo process can be initiated
cotranslationally (Chen et al., 1995; Fedorov and Baldwin, 1995), and in vivo folding is
aided by proteins which act as catalysts and chaperones (Gething and Sambrook, 1992;
Hartl et al., 1992). Current evidence suggests that in vivo protein folding occurs in an
assisted self-assembly process, where various proteins catalyze isomerization reactions
(foldases) while others reduce the probability of unproductive interactions (chaperones).
The final protein configuration is believed to be determined by free energy minimization
(Anfinsen, 1973), so that foldases and chaperones facilitate rather than determine protein
folding (i.e. proteins that can refold in vitro will achieve the same final configuration as in
vivo folded proteins). Some examples of foldases in the endoplasmic reticulum include
protein disulfide isomerase (PDI), which catalyzes thiol/disulfide interchanges, and
peptidyl prolyl cis-trans isomerase (PPIase), which catalyzes isomerizations of peptide
bonds involving proline. Chaperone proteins of the ER include BiP (GRP78),
endoplasmin (GRP94) and the lectin-like chaperones calnexin and calreticulin. BiP is the
nmost studied ER chaperone, and it normally functions by binding hydrophobic regions of
unfolded proteins which might otherwise associate with other nascent polypeptides and
lead to aggregation (Gething et al., 1994). BiP undergoes a series of binding and release
which requires ATP hydrolysis. Once the protein folds correctly, the hydrophobic
sequences are buried in the core of the protein and are no longer available for BiP binding.
The chaperones calnexin and calreticulin are unique, because they recognize their
substrates through interactions with glycoprotein carbohydrate. Calnexin is also unique
30

because it is a type I integral membrane protein, while calreticulin is soluble like most
chaperones which have been identified. Calnexin and calreticulin act as lectins with
affinity for glycoprotein GlclMan 9 GlcNAc 2 oligosaccharide (Spiro et al., 1996; Ware et
al., 1995). After the initial Glc3Man9GlcNAc 2 precursor is transferred to protein, the
glucose residues are trimmed from the core oligosaccharide within minutes by the
enzymes glucosidase I, which trims the initial glucose, and glucosidase II, which can
remove the final two glucose residues. The oligosaccharides of unfolded proteins are
typically maintained in a monoglucosylated state by the action of the enzyme UDP-
glucose:glycoprotein glucosyltransferase. This glucosyltransferase, which transfers a
glucose onto MangGlcNAc2 oligosaccharides, only uses unfolded glycoproteins as
substrates (Sousa et al., 1992). Because of deglucosylation by glucosidase II and
reglucosylation by the glucosyltransferase, unfolded glycoproteins typically have rapid
turnover of the single glucose residue on the GlclMan9GlcNAc2 oligosaccharide. Once the
nascent glycoprotein folds correctly, the glucose is removed by glucosidase II and the
glycoprotein is no longer a substrate for the glucosyltransferase, calnexin or calreticulin.
Thus the oligosaccharide mediates the interaction between nascent glycoproteins and the
chaperones calnexin and calreticulin.
Calnexin and calreticulin act as chaperones by promoting proper folding, preventing
premature oligomerization, irnhibiting degradation and mediating quality control (Tatu and
Helenius, 1997). Interaction with these chaperones appears important for the proper
folding of several proteins. If glucosidase I or II is inhibited, the Glc1Man9 GlcNAc 2
oligosaccharide can not be formed, and interaction with calnexin and calreticulin is
prevented. Under such conditions, nascent glycoprotein folding and transport is often
perturbed (Chen et al., 1995; Helenius, 1994). Calnexin has been shown to bind
cotranslationally to hemagglutinin (Chen et al., 1995), which illustrates that it acts early in
the folding process. The exact mechanisms of action are unclear, but direct interaction
with the polypeptide chain is likely. Ware et al. (1995) have demonstrated that
interaction with the oligosaccharide is critical for initial calnexin binding, but that once the
31

complex is formed the oligosaccharide does not contribute significantly to the interaction.
It is not known whether folding occurs while the polypeptide is complexed with calnexin,
or if it occurs during cycles of binding and release similar to the chaperone BiP (Ware et
al., 1995).
In summary, glycosylation can be critical for proper folding because oligosaccharides can
enhance the solubility of folding intermediates, stabilize folding domains and enable the
interaction between unfolded protein and lectin-chaperones. Sugar trimming and addition
reactions in the ER function as a quality control mechanism for monitoring and mediating
protein folding.
2.2.2 Implications for Targeting and Secretion
As mentioned above, N-glycosylation can impact protein secretion by influencing folding
and hence exit from the endoplasmic reticulum. Proper folding has been identified as a
prerequisite for transport from the ER to the Golgi (Gething et al., 1986; Helenius, 1994).
Chaperone proteins such as BiP and calnexin are believed to play a central role in
mediating the interaction between folding and transport. Stable association of unfolded
proteins with BiP has been correlated to reduced secretion efficiency (Dorner et al., 1987;
Dorner et al., 1993). There is evidence that the degree of association with BiP can depend
upon the ER BiP concentration, so that secretion of proteins which transiently associate
with BiP can be enhanced by reducing BiP (Dorner et al., 1988) and inhibited by elevating
BiP (Dorner et al., 1992). Since they typically fold more slowly, underglycosylated
proteins are more likely to associate with BiP and be retained in the ER. Exit from the ER
may therefore represent a site of "quality control", where underglycosylated proteins
may be selectively retained. Chapter 7 considers the relationship between glycosylation
and secretion in greater detail and explores the possibility of using BiP overexpression to
selectively retain underglycosylated proteins.
32

Glycosylation can also impact other intracellular trafficking and secretion events. The
most extensively studied example of oligosaccharide mediated protein sorting is the
targeting of lysosomal enzymes to the endocytic pathway (Fielder and Simons, 1995;
Kornfeld and Mellman, 1989). Lysosomal proteins are recognized in the Golgi by a
specific UDP-GlcNAc phosphotransferase, which catalyzes the transfer of GlcNAc-P to
a mannose of the core oligosaccharide. This enzyme only recognizes native lysosomal
proteins. A second enzyme subsequently cleaves off the GIcNAc, generating an
oligosaccharide with a mannose-6-P marker which can bind to mannose-6-P receptors in
the rans-Golgi network. The receptors thus sort out proteins which are bound for
lysosomes. Another example of oligosaccharide mediated trafficking is the asymmetric
sorting of proteins to the plasma membrane of epithelial cells (Fielder and Simons, 1995).
For example, there is experimental evidence for the involvement of carbohydrate in apical
secretion by Madin-Darby Canine Kidney (MDCK) cells (Kitagawa et al., 1994). Other
roles for N-glycans in protein trafficking have been speculated (Fielder and Simons,
1995), but experimental evidence is lacking.
2.2.3 Implications for Glycoprotein Biochemical Properties
Oligosaccharides normally constitute a significant fraction of a glycoprotein's mass, and
they can be important contributors to the protein's biochemical properties (see reviews in
Cumming, 1991; Goochee et al., 1991; Goochee et al., 1992; Jenkins and Curling, 1994).
For example, glycosylation can influence the solubility of glycoproteins. Proteins such as
EPO and fibrinogen are more susceptible to aggregation when they are deglycosylated
(Dordal et al., 1985; Langer et al., 1988). As discussed above, the solubility of denatured
glycoproteins can also be influenced by oligosaccharides (Kern et al., 1992; Schtilke and
Schmid, 1988; Strickland et al., 1985). The oligosaccharides are believed to enhance
solubility by contributing a strong hydrophilic component to the glycoprotein, and by
masking the protein surface to prevent intramolecular polypeptide interactions (Goochee
et al., 1992).
33

Fully glycosylated proteins are typically more stable than their non-glycosylated
counterparts. Several proteins are more susceptible to thermal inactivation upon
oligosaccharide removal, although it is not always clear whether the effect is due to
thermal instability or reduced solubility of the denatured protein (Goochee et al., 1992).
For example carbohydrates protect thermally denatured yeast invertase from aggregation,
but they apparently do not influence the thermal denaturation process (Schiulke and
Schmid, 1988). The in vivo stability of a glycoprotein can also be a function of
susceptibility to protease attack. There are many documented cases of oligosaccharides
protecting proteins from proteases. The glycans at Asn-25 in human interferon-y, for
example, protect the protein from degradation by elastase, cathepsin G, plasmin and
crude granulocyte protease (Sareneva et al., 1995). Similarly, the carbohydrates of
porcine pancreatic ribonuclease protect the protein from degradation by trypsin and
subtilisin (Wang and Hirs, 1977). The oligosaccharides may protect the polypeptide
from proteases by sterically blocking potential cleavage sites.
The oligosaccharides of glycoproteins can also impact biological activity. For example,
the glycans of the human interferon-y receptor are required for proper ligand binding
(Fischer et al., 1990). Carbohydrates have also been found to affect the specific activity
of immunoglobulins, due to glycosylation in both the heavy chain and variable regions
(reviewed in Goochee et al., 1992). In contrast to these examples, biological activity of
other glycoproteins can be unaffected or even negatively impacted by oligosaccharides.
Human interferon-y (IFN-y) in vitro activity is not affected by glycosylation; E. coli
derived IFN-y has full anti-viral and anti-proliferative activity in vitro (Rinderknecht et
al., 1984). Tissue-type plasminogen activator (t-PA) is an example where specific
activity is negatively impacted by increased extent of glycosylation. t-PA is produced as
two forms because of variable glycosylation at Asn-184: type I has three N-linked
oligosaccharides, whereas type II has only two. The oligosaccharide at Asn- 184 inhibits
the proteolytic conversion of single chain t-PA to two chain t-PA (Wittwer and Howard,
1990). The two chain form of t-PA has a higher catalytic activity (Berg et al., 1993), and
34

so type II t-PA is more effective than type I. Rademacher et al. (1988) suggest that
variable glycosylation may confer greater sensitivity to tPA-mediated thrombolysis, by
providing both fast and slow acting forms.
A recurring theme that emerges from the above discussion is that oligosaccharides
influence glycoprotein properties in a very protein specific manner. While glycosylation
may be critical for folding or activity of one protein, it may be irrelevant for another. The
impact of glycosylation must be determined on a case by case basis. However it is clear
that in many instances carbohydrates play an important role in determining glycoprotein
properties.
2.2.4 Implications for Circulatory Half-Life
Oligosaccharides are of critical importance in determining the in vivo circulatory half-life
of glycoproteins in the blood stream. Proteins are cleared from the blood by a variety of
mechanisms, and the in vivo activity of an injected therapeutic protein can depend upon
how long it is able to remain in circulation.
One mechanism of glycoprotein removal is by receptors which recognize specific terminal
monosaccharides of glycoprotein carbohydrates. Once glycoproteins are bound by the
receptors, they enter the cell and are degraded in lysosomes. The steps of the endocytic
pathway are: concentration of receptor-ligand complexes in coated pits, internalization,
pH mediated dissociation of receptor-ligand in tle CURL (compartment of uncoupling of
receptor and ligand), segregation, transport of ligand to lysosomes and recycling of the
receptor (Darnell et al., 1990). Examples of glycosylation-specific receptors include the
asialoglycoprotein receptor (ASGP-R) present on hepatocytes and the mannose receptor
found on tissue resident macrophages. The ASGP-R recognizes oligosaccharides with
terminal galactose or N-acetylgalactose residues, including under-sialylated and
desialylated complex N-glycans (Monroe and Huber, 1994; Weiss and Ashwell, 1989).
Glycoproteins with terminal mannose, N-acetylglucosamine or fucose residues are
35

recognized by the mannose receptor (Ezekowitz and Stahl, 1988). The receptor mediated
clearance mechanisms serve to eliminate abnormal or foreign glycoproteins from
circulation. The majority of human plasma N-glycoproteins carry complex-type
oligosaccharides with terminal sialic acid residues. In contrast, mannose is a common
component of bacterial pathogens, parasites, yeasts and the envelope glycoprotein of
certain viruses (Ezekowitz and Stahl, 1988).
A less specific mechanism of protein clearance occurs in the kidney. The renal glomerulus
acts as an ultrafiltration device, allowing small molecules to pass through to the urinary
(Bowman's) space, while almost completely restricting the passage of molecules the size
of plasma albumin or larger (Kanwar, 1984). The permeability of a given molecule has an
inverse relationship with its effective hydrodynamic radius, so that larger molecules are
more likely to be retained. In addition, permeability is influenced by the molecule's
configuration and net electrical charge. The more positively charged a molecule is, the
more likely it will pass through to the urinary space. Thus, small positively charged
molecules are likely to be cleared by the kidney, while large negatively charged molecules
will remain in circulation. It is important to note that oligosaccharides can significantly
increase the size of a glycoprotein, and attached sialic acid groups contribute negative
charges. Therefore glycosylation can prevent small proteins from being cleared by the
kidney.
Studies of glycoprotein persistence in the blood stream have identified each of the
mechanisms described above as potentially important determinants of in vivo half life.
For example, Flesher et al. (1995) found that clearance of a CTLA4 fusion protein could
be correlated to sialic acid content. This is consistent with hepatic clearance of
asialoglycoproteins by the ASGP-R. Similarly, removal of terminal sialic acid residues
from erythropoietin (EPO) results in rapid ASGP-R mediated clearance from the blood
stream (Spivak and Hogans, 1989). EPO is a particularly interesting protein, because it
also appears to be partially cleared by the kidney. EPO with biantennary
36

oligosaccharides was found to be cleared by the kidney more rapidly than EPO with
predominantly tetraantennary structures (Misaizu et al., 1995). EPO is a relatively small
protein, with carbohydrate accounting for 40% of its 30 kDa molecular weight. Extra
carbohydrate branching provides EPO with a greater mass and more negative charge (due
to additional sialic acid residues), and hence reduces the likelihood that it will be cleared
by the kidney. Low molecular weight secretory proteins from rat liver have also been
shown to e protected from renal clearance by complex carbohydrates (Gross et al., 1988;
Gross et al., 1989). When the carbohydrates were of the high mannose type, the rat liver
glycoproteins were rapidly cleared via the mannose receptor pathway (Gross et al., 1988;
Gross et al., 1989).
The examples discussed above illustrate that effective therapeutic glycoproteins must not
only be glycosylated, but they must be glycosylated correctly. In fact improper
glycosylation is worse than lack of glycosylation, because improperly glycosylated
proteins are rapidly removed through receptor-mediated mechanisms. For this reason,
Chinese hamster ovary (CHO) cells have emerged as the most widely used cell line for
producing recombinant human therapeutic glycoproteins. CHO cells are able to closely
mimic human in vivo glycosylation characteristics, perhaps even more closely than some
human cell lines of tumor origin (Goochee et al., 1992). Although the glycosylation
fidelity is not perfect (for example CHO cells synthesize a2,3-linked terminal sialic acids
exclusively, while humans synthesize a2,6 and a2,3-linked sialic acids), CHO cells are
more effective than most other cell lines (Jenkins et al., 1996). Simpler organisms are
typically unable to create the required complex carbohydrates (see reviews in Goochee et
al., 1991; Jenkins et al., 1996). For example, bacteria can not N-glycosylate proteins,
while yeast attach high mannose glycans, plants do not add sialic acids and insect cells
typically produce simpler oligomannose oligosaccharides.
37

2.3 Factors Influencing N-linked Glycosylation Site Occupancy
Heterogeneity
More than twenty individual enzymes are involved in the conversion of glucose to
protein bound carbohydrate, not including the sugar trimming and addition reactions
which occur in the Golgi. The reactions which these enzymes catalyze rely on an
adequate supply of sugar and activated carrier molecules such as nucleoside triphosphates
and dolichol phosphate. In principle, any of the enzymes or substrates might limit
transfer of oligosaccharide to protein. This section reviews the features of the
glycosylation pathway which are most likely to influence glycosylation site occupancy.
2.3.1 Lipid-Linked Oligosaccharide Precursor Formation
An obvious potential cause of unoccupied glycosylation sites is a lack of oligosaccharide
precursor. If the lipid-bound precursor is not available to the oligosaccharyltransferase
enzyme, the glycosylation reaction can not occur. There are several potential bottlenecks
to synthesis of the precursor oligosaccharide, including nucleotide sugar availability,
dolichol availability and the activity of the various glycosyltransferase enzymes which
catalyze the synthesis.
2.3.1.1 Nucleotide Sugar Availability
All sugars added to protein in iLlycosylation are ultimately derived from nucleotide sugar
intermediates. Figure 2-4 illustrates how the nucleotide sugars are formed from various
carbon sources (Schachter, 1978). All of the nucleotide sugars may be formed from a
fructose-6-P or glucose-6-P intermediate. These intermediates undergo enzyme catalyzed
isomerization reactions to the appropriate hexose-l-P, and then they react with
nucleoside triphosphates to form nucleotide sugars. The activated sugars can then serve
directly as donors in glycosylation reactions or be used to form dolichol-sugars. The role
38

o ILE -- I=-0 040
0 0 a U
a)C
C C.'EI 0. o
a)0 tM05 aA i
.aa.
a)
00
._
0O>1
CE
-*I. 00).a
v
z
G~,c3<
Figure 2-4. Biosynthesis of common nucleotide sugars.
39
a)o a..0 0a)
4 0
La M" (4
oi
aU) 0 3
zLL d
a)
il
CD00(U0
0
o.0
Z'd._
CC
0no
0(Uo
2r0.
(3a0
0.-a)o(U 0CC(o
iaC)(UCC
a.(ba)GO -01
U.w
nI
U. 0
CL(aOA
LLI.
a)LI)0C
(U
C
a)
E(U* -'0o(UIL
0)caE
510
00
M
0C-
EM0(U0U(uo
MM0)4a.Qzs0.
I
4) ctCL \
0\
ECE
M
00CC
(U
3O.a,o)
Ii0
a,C
IU
(uM00
a,
U
z.C(3
CD o
o 0
° I
a.
EcoM
0)C.
<;i
a) (aU) 00 -o 0
L.(u.
I
41
r--'"m v

that nucleotide sugars play in glycosylation has primarily been studied under conditions
of glucose starvation or during feeding of specific nucleotide sugar precursors.
Numerous studies have examined the effects of glucose starvation on glycosylation
(Baumann and Jahreis, 1983; Chapman and Calhoun, 1988; Gershman and Robbins, 1981;
Rearick et al., 1981; Stark and Heath, 1979; Turco, 1980). These studies have generally
concluded that glucose starvation leads to accumulation of truncated oligosaccharides
bound to lipid, along with transfer of smaller oligosaccharides to proteins. Glucose fed
cells synthesize predominantly Glc 3Man 9GlcNAc 2-P-P-Dol, while starved cells
synthesize Man2GlcNAc2-P-P-Dol, Man5GlcNAc2-P-P-Dol and Glc3MansGlcNAc2-P-P-
Dol (Chapman and Calhoun, 1988; Gershman and Robbins, 1981; Rearick et al., 1981).
The truncated Glc3MansGlcNAc2-P-P-Dol species can be transferred to protein, although
with a much lower efficiency than the normal precursor. This leads to decreased
glycosylation site occupancy of some proteins. The glucose starvation response can be
reversed by adding exogenous glucose or mannose (and to a smaller extent galactose), but
adding pyruvate, glutamine, glycine, inositol, fructose, ribose, N-acetylglucosamine or
glycerol is not effective (Gershman and Robbins, 1981; Turco, 1980). Nucleotide sugar
depletion has also been observed in glucose starved cultures (Chapman and Calhoun,
1988; Ullrey and Kalckar, 1979), and it is often cited as the likely cause of truncated
precursor synthesis. Proposed explanations for nucleotide sugar depletion during glucose
starvation have generally focused on supply of hexose phosphates, leading to the
suggestion that glycosylation may be sensitive to cellular glucose-6-P pools and thus the
metabolic state of the cell (Turco, 1980).
Some nucleotide sugars can be formed from carbohydrate sources other than glucose,
mannose and galactose. For example, GDP-Fucose can be formed from fucose with
minimal catabolism or conversion to other sugars (Beeley, 1985). Similarly the amino
sugars glucosamine and galactosamine can be used to form UDP-N-acetylglucosamine
(UDP-GlcNAc), UDP-N-acetylgalactosamine (UDP-GalNAc) and CMP-N-
40

acetylneuraminic acid (CMP-NeuNAc or CMP-sialic acid). N-acetylmannosamine is
another example of a specific sugar precursor, and it is used to synthesize CMP-NeuNAc
almost exclusively (Gu, 1997). Low concentrations of these sugar precursors are
commonly used in radiolabeling experiments to label glycoproteins or specific types of
glycoproteins (Beeley, 1985). Feeding millimolar amounts of glucosamine, galactosamine
and N-acetylmannosamine leads to accumulation of specific nucleotide sugars and
perturbations in glycosylation. N-acetylmannosamine feeding, for example, results in
elevated CMP-NeuNAc and increased sialylation (Gu, 1997). In terms of glycosylation
site occupancy, glucosamine and galactosamine are more important, because they cause
accumulation of UDP-GlcNAc (Kornfeld and Ginsburg, 1966; Pels Rijcken et al., 1995a),
which is used to synthesize the lipid-linked precursor oligosaccharide.
Following their entry into the cell, glucosamine and galactosamine are converted into
hexosamine phosphates, acetylated, and reacted with UTP to make UDP-GlcNAc and
UDP-GalNAc (the sum is referred to as UDP-GNAc). UDP-GlcNAc and UDP-GalNAc
can be interconverted readily by UDP-GalNAc 4-epimerase, and the two species were
present at the equilibrium ratio in glucosamine fed HeLa cells (Kornfeld and Ginsburg,
1966). The amino sugars are not converted to other sugars, because the formation of
glucosamine-6-P from fructose-6-P is normally not reversible (Beeley, 1985). Despite the
fact that UDP-GlcNAc and UDP-GalNAc are most likely in equilibrium, feeding
glucosamine affects glycosylation much differently than feeding galactosamine.
Glucosamine feeding causes a reduction in glycosylation (Datema and Schwarz, 1979;
Elbein, 1987; Koch et al., 1979; Pan and Elbein, 1982), while rat hepatocytes fed
galactosamine slightly increased mannosylation of proteins and increased sialylation by a
factor of 2.5 (Pels Rijcken et al., 1995a). Five mM glucosamine caused truncated
precursor oligosaccharide synthesis in MDCK cells, while the same concentration of
galactosamine did not influence precursor synthesis or glycosylation (Pan and Elbein,
1982). The effect of glucosamine on glycosylation may be due to glucosamine itself
rather than the nucleotide sugar. Koch et al. (1979) demonstrated that the negative impact
41

of glucosamine on glycosylation was rapidly reversible, and that reversibility correlated to
depletion of glucosamine itself and not any of its metabolites. The concentration of
UDP-Glc, UDP-GlcNAc and GDP-Man did not change significantly, while glucosamine
levels declined and glycosylation ability was recovered.
The impact of nucleotide sugars on glycosylation has also been studied by altering
nucleoside triphosphate levels. Pels Rijcken et al. (1995b) found that treating rat
hepatocytes with 0.5 mM uridine or cytidine led to large increases in UTP (6.7 fold
increase after 40 h) and UDP-sugars (2.5 to 4.6 fold increases after 40 h). The nucleotide
precursor treatment also led to changes in glycosylation: incorporation of N-
acetylhexosamine into cell-associated and secreted glycoconjugates increased, while
sialylation decreased. The authors suggested that increased UDP-GNAc was responsible
for both of the observed effects. UDP-GNAc was suggested to impair the transport of
CMP-NeuNAc into the Golgi, thus reducing sialylation. However, similar increases in
UDP-GNAc observed during treatment with galactosamine did not impair sialylation; in
contrast sialylation increased by a factor of 2.5 in these cells (Pels Rijcken et al., 1995a).
Pels Rijcken et al. (1995a) suggest that the apparent contradiction may be due to different
compartmentation of the UDP-GNAc made with uridine feeding versus galactosamine
feeding. Alternatively other UDP-sugars or uridine metabolites may be responsible for
the reduction in sialylation observed with uridine feeding. On an equimolar basis, UDP-
Gal is a more potent inhibitor of in vitro CMP-NeuNAc transport than UDP-GlcNAc
(Carey et al., 1980), which supports the hypothesis that other UDP-sugars may be
influencing CMP-NeuNAc transport.
The glucose starvation, sugar precursor feeding and nucleotide precursor feeding
experiments demonstrate that nucleotide sugars can influence glycosylation. However,
the impact of nucleotide sugars under normal growth conditions is less clear. Furthermore
the effects of precursor feeding are often ambiguous, since the precursors may influence
multiple metabolic pathways or produce metabolites which impact glycosylation in
42

unexpected ways. Galactosamine feeding versus glucosamine feeding illustrates the
second point; despite the fact that both precursors lead to similar alterations in nucleotide
sugar levels, glycosylation is impacted very differently. The results described in
subsequent chapters of this thesis help to elucidate how normal cellular metabolism
influences nucleotide sugar levels and glycosylation site occupancy.
2.3.1.2 Dolichol Availability
In addition to nucleotide sugars, proper glycosylation depends upon an adequate supply
of dolichol phosphate, the membrane lipid which is the anchor of the precursor
oligosaccharide. Dolichols are actually a class of related polyprenols in which the final
(alpha) isoprene unit is saturated (see Figure 2-5). In mammalian cells, dolichol typically
contains 17-21 isoprenyl units, with the 19 unit isomer the most prevalent in Chinese
hamster ovary cells (Kaiden and Krag, 1992). Dolichol is formed from farnesyl
pyrophosphate and isopentenyl pyrophosphate, intermediates which are also part of the
cholesterol biosynthesis pathway. Although there is still some debate about how
dehydrodolichol pyrophosphate is converted to dolichol phosphate, Figure 2-6 illustrates
what is currently believed to be the dolichol biosynthesis pathway (Sagami et al., 1996;
Sagani et al., 1993). The activities of important enzymes downstream of 3-hydroxy-3-
methylglutaryl CoA (HMG CoA) synthesis have been isolated in the microsomal
fractions of mammalian cells, including HMG CoA reductase, cis-Isoprenyltransferase
CH3
-C C--C-H 2 H H 2
CH3I
-C- C-C--CH 20HH 2 H H 2
n-1
Figure 2-5. The chemical structure of dolichol (n=17 to 21 for mammalian cells).
43
H-

I +a-
0zC C4j
OC
I C
ot;"a
Figure 2-6. The proposed biochemical pathway for dolichol synthesis.
44
'0=i
0O
'-'
CD
-
Q
zn.-,
O-5._0
nr-a) f 0 L
C:
<0C )
oc
o )Vc
a-
a. s Z
cuo
L na 2_ a.LLD
-c-a)C
I0
o 0o
0i
o0-
00
oC"
o.a0oa)
a>
- 'nCLC -
a
.E °
a
o0
C: > C)
o a < if
a-
oC)Cu
-5-cC)
a.

(also known as IPTase or dehydrodolichyl pyrophosphate synthase) and
dehydrodolichol reductase.
A number of studies have related dolichol-P levels to the formation of lipid-linked
oligosaccharide precursors. For example, exogenous Dol-P added to the culture medium
increased the rate of oligosaccharide-P-P-dolichol synthesis and protein N-glycosylation
in embryonic rat brain cells (Crick and Waechter, 1994). There is increasing evidence that
cells use dolichol-P synthesis to modulate N-glycosylation capacity. Induction of
dolichol synthesis has been correlated to increased oligosaccharide-P-P-dolichol synthesis
and N-glycosylation in several cell lines, including during cell cycle dependent regulation
in rat 3Y1 cells (Fukushima et al., 1997), mitogenic response regulation in mouse B cells
(Crick et al., 1994) and developmental regulation in embryonic rat brain cells (Crick and
Waechter, 1994). Dolichol synthesis appears to be regulated separately from cholesterol
synthesis, because the rate of cholesterol synthesis was not accelerated during the
expansion of Dol-P and oligosaccharide-P-P-Dol (Crick and Waechter, 1994). Consistent
with this hypothesis is the finding that HMG CoA reductase was not up-regulated under
any of the conditions described above, while IPTase, which is specific to the dolichol
pathway, was induced. In addition, when 0.5 jgM lovastatin was added to partially
inhibit HMG CoA reductase, cholesterol synthesis was suppressed, while dolichol
synthesis was slightly enhanced (Crick et al., 1994). A higher concentration (3 /aM) of
lovastatin was found to inhibit dolichol-P synthesis and N-glycosylation in the human
melanoma cell line SK-MEL-2, which illustrates that a partially functioning HMG CoA
reductase is required to supply the necessary mevalonate (Carlberg et al., 1996). Under
normal conditions, however, mevalonate does not appear to be limiting for dolichol
synthesis in a variety of cell lines.
Deficiencies in dolichol synthesis have been shown to negatively impact oligosaccharide-
P-P-dolichol synthesis and protein N-glycosylation. It has recently been found that the
congenital disorder known as carbohydrate-deficient glycoprotein (CDG) syndrome type
45

I can be caused by deficient dehydrodolichol reductase enzyme (Ohkura et al., 1997).
Primary fibroblast cultures established from skin biopsies of patients with this deficiency
accumulated dehydrodolichol and had less dolichol. The cells synthesized the normal
Glc3Man9GlcNAc2-P-P-Dol precursor, although in smaller amounts. It has been shown
that N-glycoproteins from patients with CDG syndrome type I are underglycosylated.
The importance of dolichol synthesis in glycosylation was also demonstrated with a
Chinese hamster ovary mutant which had a severe defect in the dehydrodolichol reductase
enzyme (Stoll and Krag, 1988). The mutant F2A8 synthesized dehydrodolichol to
dolichol in a ratio of 100:1, while the ratio in control cells was 0.4:1. The mutant
synthesized oligosaccharide precursors which were similar to the parental cell line, except
that a significant fraction were synthesized on dehydrodolichol while control cells utilized
dolichol almost exclusively (Stoll et al., 1988). The unsaturated polyprenol was not as
effective in glycosylation reactions, and the mutant cells were unable to synthesize the
lipid-precursor effectively, which led to under utilization of potential glycosylation sites
(Stoll and Krag, 1988).
The evidence suggests that dolichol-P synthesis is an important regulator of
oligosaccharide-P-P-dolichol synthesis. Defects in dolichol-P synthesis cause
underglycosylation of proteins, while increased dolichol-P levels correlate with a higher
glycosylation capacity. Control of dolichol-P synthesis appears to reside with enzymes
such as IPTase and dehydrodolichol reductase. In some tissues dolichol kinase may play
an important role, although the pool of free dolichol in CHO cells is small, which suggests
that kinase activity is not limiting (Stoll et al., 1988).
2.3.1.3 Glycosyltransferase Activities
The Glc3Man9GlcNAc2-P-P-Dol precursor is synthesized in a series of enzyme catalyzed
reactions. Theoretically any of the glycosyltransferase enzymes involved in the dolichol-
oligosaccharide synthesis pathway could limit precursor synthesis and hence influence
46

glycosylation site occupancy. Indeed a number of mutants with specific enzyme
inactivations have been isolated which synthesize abnormal dolichol-linked
oligosaccharide precursors (Br'ndli, 1991; Lehrman and Zeng, 1989; Stanley, 1983; Stoll
and Krag, 1988). Most of these cell lines were generated by selecting for mutants
resistant to cytotoxic lectins or glycoprotein processing inhibitors, and they have proved
quite useful in elucidating the N-glycosylation pathway. Such cell lines produce
truncated oligosaccharide precursors which are typically transferred to protein with lower
efficiency than the normal precursor. Under normal conditions, however,
Glc 3Man 9GlcNAc 2-P-P-Dol is the dominant lipid-linked oligosaccharide species, with
smaller amounts of Glcl1 2Man9GlcNAc2-P-P-Dol and Man5GlcNAc2-P-P-Dol usually
detectable (Fukushima et al., 1997; Gershman and Robbins, 1981; Ohkura et al., 1997;
Rearick et al., 1981). Hence the activities of intermediate glycosyltransferase enzymes do
not normally limit the formation of the oligosaccharide precursor, and so the enzymes
involved in the initial steps of the pathway have received the most attention as potential
sites of control.
The first glycosyltransferase in the Glc3Man9GlcNAc2-P-P-Dol synthesis pathway is
UDP-GlcNAc:dolichol-P GlcNAc-1-P transferase (GPT), which catalyzes the reaction
UDP-GlcNAc + dolichol-P <-> GlcNAc-P-P-dolichol + UMP
This enzyme is inhibited by tunicamycin, a specific and reversible inhibitor which is
thought to be a substrate-product transition state analogue (Elbein, 1987). Experiments
utilizing tunicamycin have illustrated the importance of GPT in the N-linked
glycosylation pathway. Cells treated with tunicamycin are unable to synthesize the
lipid-linked oligosaccharide precursor, and N-linked glycosylation is inhibited. Chinese
hamster ovary cells selected for resistance to tunicamycin were found to have elevated
GPT activities and phenotypes consistent with gene amplification (Waldman et al., 1987;
Zhu et al., 1992). Zhu et al. (1992) demonstrated that the elevated GPT activity was due
to an unusually high copy number of a gene which was found to encode GPT. When
grown in the absence of tunicamycin, cell lines overexpressing GPT (selected mutants and
47

cells transfected with the GPT gene) had 10 to 15-fold higher GPT activity than control
cells (Waldman et al., 1987; Zhu et al., 1992). GPT overexpression did not, however, lead
to enhanced glycosylation. In contrast, cells overexpressing GPT were found to
accumulate the truncated oligosaccharide precursor MansGlcNAc2-P-P-Dol. Similar to
the case of glucose starvation (see the section on Nucleotide Sugar Availability),
accumulation of the truncated oligosaccharide precursor resulted in reduced incorporation
into protein.
Though caused by very different phenomena, glucose starvation and GPT overexpression
may share a common mechanism which leads to truncated precursor synthesis: depletion
of dolichol linked sugars. The truncated MansGlcNAc2-P-P-Dol precursor is synthesized
directly from nucleotide sugars; the four mannoses and three glucoses which are normally
added to complete the precursor are added from dolichol linked sugars. The dolichol
linked sugars mannose-P-Dol and glucose-P-Dol were depleted in cells overexpressing
GPT, due to excessive accumulation of oligosaccharide-P-P-Dol (primarily
MansGIcNAc2-P-P-Dol) (Rosenwald et al., 1990). The enzymes catalyzing dolichol
sugar formation (Man-P-Dol synthase and Glc-P-Dol synthase) compete with GPT for a
common pool of dolichol-P, and overexpression of GPT depletes the dolichol-P needed
for dolichol sugar formation. The activities of GPT, Man-P-Dol synthase and Glc-P-Dol
synthase must be balanced to produce the proper oligosaccharide precursor. When one of
the activities is altered, the distribution between Man-P-Dol, Glc-P-Dol and
oligosaccharide-P-P-Dol shifts accordingly, with little impact on total dolichol or dolichol-
P levels. For example a Man-P-Dol synthase mutant had lower Man-P-Dol and
correspondingly higher oligosaccharide-P-P-Dol (the truncated precursor), while cells
treated with tunicamycin to inhibit GPT had reduced oligosaccharide-P-P-Dol and
elevated Man-P-Dol and Glc-P-Dol (Rosenwald et al., 1990).
With their importance in the oligosaccharide-P-P-Dol pathway, one would expect the
activities of enzymes such as GPT, Man-P-Dol synthase and Glc-P-Dol synthase to be
48

tightly regulated. GPT is the most thoroughly studied, and indeed it is thought to be
under several types of control. For example, Mota et al. (1994) found that hamster GPT
activity paralleled transcript abundance, and that the gene was differentially expressed
during development and in differentiated adult tissues. Similarly, GPT was found to be
developmentally and hormonally regulated in mouse mammary gland (Ma et al., 1996). In
addition to transcriptional controls, GPT activity can be modulated by post-translational
means. Recent evidence suggests that GPT forms dimers, and dimer formation may play
a role in in vivo activity (Dan and Lehrman, 1997). The finding that Man-P-Dol is an
allosteric activator of GPT may indicate that the activities of GPT, Man-P-Dol synthase
and Glc-P-Dol synthase are coordinately modulated through feed-back mechanisms
(Kean, 1991 a).
Less is known about the other glycosyltransferases involved in the oligosaccharide
precursor biosynthetic pathway, although a few have been cloned. Several of these genes
have been shown to be essential for viability in yeast, including the genes for the enzymes
catalyzing the first (ALG7 which corresponds to the mammalian gene for GPT), third
(ALG1) and fifth (ALG2) steps in Glc3Man9GlcNAc2-P-P-Dol synthesis (Lennon et al.,
1995). The enzymes appear to share similar membrane-spanning regions which have been
suggested as dolichol recognition sequences (Orlean, 1992). Genes for several enzymes in
the dolichol pathway have been shown to display characteristics of early growth
response genes in yeast (Lennon et al., 1995).
Since Glc3Man9 GlcNAc 2-P-P-Dol is the dominant lipid-linked oligosaccharide species,
the glycosyltransferases downstream of GPT do not normally limit precursor formation.
During glucose starvation or overexpression of GPT, however, downstream steps can
limit precursor formation at the MansGlcNAc2-P-P-Dol species. Therefore of the
enzymes directly involved in oligosaccharide precursor synthesis, the most important for
glycosylation site occupancy are GPT, Dol-P-Man synthase (and translocase), Dol-P-Glc
synthase (and translocase), Dol-P-Man: Man5GlcNAc2-P-P-Dol Man- 1-P transferase and
49

the enzyme catalyzing the translocation of the Man5GlcNAc2-P-P-Dol precursor from
the cytosol to the lumen of the ER.
2.3.2 Oligosaccharyltransferase Activity
Even if sufficient oligosaccharide-P-P-Dol precursor is available, the N-glycosylation
reaction could be limited by the activity of the oligosaccharyltransferase (OST) enzyme
which catalyzes the transfer of the oligosaccharide to the polypeptide acceptor. OST has
recently been isolated in a number of species, and is found as a heteroligomeric complex of
between three and six polypeptides (Silberstein and Gilmore, 1996). OST activity for
several mammalian cell types has been co-purified with a heterotrimeric complex
composed of 66, 63 and 48 kDa subunits. Based upon amino acid sequence and protease
accessibility studies, the three subunits are believed to be type I integral membrane
proteins with large amino-terminal lumenal domains and short carboxy-terminal
cytoplasmic domains (Silberstein and Gilmore, 1996).
The 66 and 63 kDa subunits of OST were found to be identical to the previously
identified proteins ribophorin I and ribophorin II, respectively (Kelleher et al., 1992).
The ribophorins were initially identified as components of the rough endoplasmic
reticulum (RER) which were associated with bound riboso . . The ribophorins were
found to be present in approximately equimolar amounts relative to the number of bound
ribosomes on the RER (Marcantonio et al., 1984). Ribophorins, while not believed to be
directly responsible for ribosome binding, are apparently closely related to the translocon
apparatus. Antibodies to ribophorins I and II were able to inhibit translocation,
presumably by sterically inhibiting ribosome targeting to the ER membrane (Yu et al.,
1990). Such an intimate and stoichiometric association with bound ribosomes suggests
that the amounts of ribophorins are not limiting for co-translational OST activity.
Further evidence suggests that the 48 kDa unit is probably not limiting either. The yeast
homolog to the mammalian 48 kDa OST component is the protein WBP1 (Silberstein et
50

al., 1992), and overexpression of WBP1 did not lead to increased OST activity in yeast
(te Heesen et al., 1992). WBP1 was shown to be an essential yeast protein; depletion of
WBP1 led to underglycosylation and eventual cell death. Thus the evidence suggests that
co-translational glycosylation site occupancy is not modulated by the amount of OST
enzyme complex.
Although the amount of OST probably does not limit glycosylation, it is possible that the
activity of the enzyme complex could vary. For example, Oda-Tamai et al. (1985)
present evidence that changes in OST activity cause a decrease in glycosylation in
regenerating rat liver. The altered glycosylation site occupancy was apparently unrelated
to oligosaccharide precursor availability. Changes in membrane composition and fluidity
are also associated with rat liver regeneration, and these changes may have played a role in
modulating OST activity. In vitro studies have shown that OST activity has a stringent
requirement for phospholipid, with phosphatidylcholine being much more effective than
other naturally occurring phosphoglycerides (Chalifour and Spiro, 1988). Microsomes
from vitamin A deficient rat livers also show a radically altered lipid composition and
reduced OST activity (Chan and Wolf, 1987). Thus membrane composition is a possible
modulator of enzyme activity. Some biochemical factors are also known to influence
OST activity in in vitro assays. The OST activity is stimulated by bivalent metal ions,
with Mn 2 + being the most effective (Bause and Legler, 1981). OST is maximal at a neutral
pH, with activity dropping off quickly below pH 6.5 (Bause and Legler, 1981). In
summary, several biochemical factors may affect oligosaccharyltransferase activity, but
the amount of the enzyme is probably not limiting.
2.3.3 Substrate Amino Acid Sequence
The extent to which a potential glycosylation site is utilized can depend upon the amino
acid sequence of the substrate. Early analysis of glycoprotein amino acid sequences
identified the consensus recognition sequence Asn-Xxx-Ser/Thr (where Xxx is any amino
51

acid) as a requirement for N-linked glycosylation. As more protein sequences have
become available, the consensus sequence has been generally confirmed, although rare
exceptions have been identified (Gavel and von Heijne, 1990). Surveys of protein data
bases have found that the tripeptide sequences Asn-Xxx-Thr and Asn-Xxx-Ser appear
with equal frequency, but that sequences containing Thr are two to three times more
likely to be glycosylated than sites containing Ser (Gavel and von Heijne, 1990; Kaplan et
al., 1987). This conclusion is consistent with the finding that hexapeptides with Asn-
Xxx-Thr were forty-fold better acceptors than peptides with Asn-Xxx-Ser when assayed
in vitro (Bause and Legler, 1981). Although the in vitro results exaggerate the in vivo
differences, recent experiments with specific model proteins have confirmed that
threonine is the more effective hydroxy amino acid in the glycosylation sequon (Holst et
al., 1996; Kasturi et al., 1995).
The amino acid in the Xxx position of the recognition sequence has also been shown in
influence glycosylation site occupancy. From analysis of protein data bases, it was found
that certain amino acids such as Cys, Trp and Pro were very rare in the Xxx position of
glycosylated proteins (Kaplan et al., 1987). A recent study used site-directed
mutagenesis to substitute each of the 20 common amino acids for the Xxx position of an
Asn-Xxx-Ser sequon of a cell surface glycoprotein (Shakin-Eshleman et al., 1996). This
study found that glycosylation site occupancy varied significantly depending upon the
identity of Xxx. A Pro substituted mutant was not glycosylated at all, while mutants
substituted with large hydrophobic amino acids (e.g. Trp, Leu, Phe and Tyr) were
glycosylated inefficiently. It also appeared that negatively charged amino acids (Asp and
Glu) inhibited glycosylation, while positively charged amino acids (Lys, Arg and His)
were efficiently glycosylated.
The amino acid sequence specificity of the glycosylation reaction is likely related to the
reaction mechanism. The transferase reaction is interesting because it involves the
nucleophilic displacement of dolichol pyrophosphate from the donor oligosaccharide by
52

the primary amide nitrogen of an asparagine. Asparagine is not a particularly reactive
nucleophile, and so the reaction mechanism presumably involves an activation of the
primary amide (Silberstein and Gilmore, 1996). Initial proposed mechanisms for the
transferase reaction suggested that the asparagine amide is activated through hydrogen
bond interactions involving the hydroxy amino acid in the Asn-Xxx-Ser/Thr recognition
sequence (Bause and Legler, 1981; Marshall, 1972). The secondary structure of the
polypeptide acceptor was also believed to be important, based upon the observation that
utilized glycosylation sites frequently have a high probability of forming a -turn
conformation (Avanov, 1991). The relevance of secondary structure to the transferase
reaction was later refined based upon experiments with conformationally constrained
cyclic peptide substrates (Imperiali et al., 1992a). These experiments demonstrated that,
rather than a 5-turn, glycosylation sites adopt an asparagine-tum conformation. The
asparagine-turn is stabilized by hydrogen bond interactions between the carboxyamide
oxygen of asparagine, an amide from the polypeptide backbone and the hydroxyl group of
the recognition site Ser/Thr. Based upon this evidence, the revised reaction mechanism
presented Figure 2-7 in has been proposed (Imperiali et al., 1992b). According to this
mechanism, the hydroxy amino acid of the acceptor site stabilizes an asparagine-turn
conformation and is involved in the formation of an imidate tautomer, which is formed
when a base from the oligosaccharyltransferase active site abstracts a hydrogen from the
asparagine amide. The imidate tautomer is a competent nucleophile to displace dolichol
pyrophosphate from the oligosaccharide precursor. This mechanism would explain the
pH dependence of the transferase reaction and the importance of the Xxx amino acid. A
low pH would interfere with hydrogen bonding, while bulky Xxx side chains and proline
might interfere with the asparagine-turn conformation.
In addition to the local amino acid sequence and secondary structure, the position of the
glycosylation sequon in the polypeptide chain is important. The
oligosaccharyltransferase (OST) enzyme complex is membrane bound and the substrate
must reach the active site for glycosylation to occur. Experiments with membrane
53
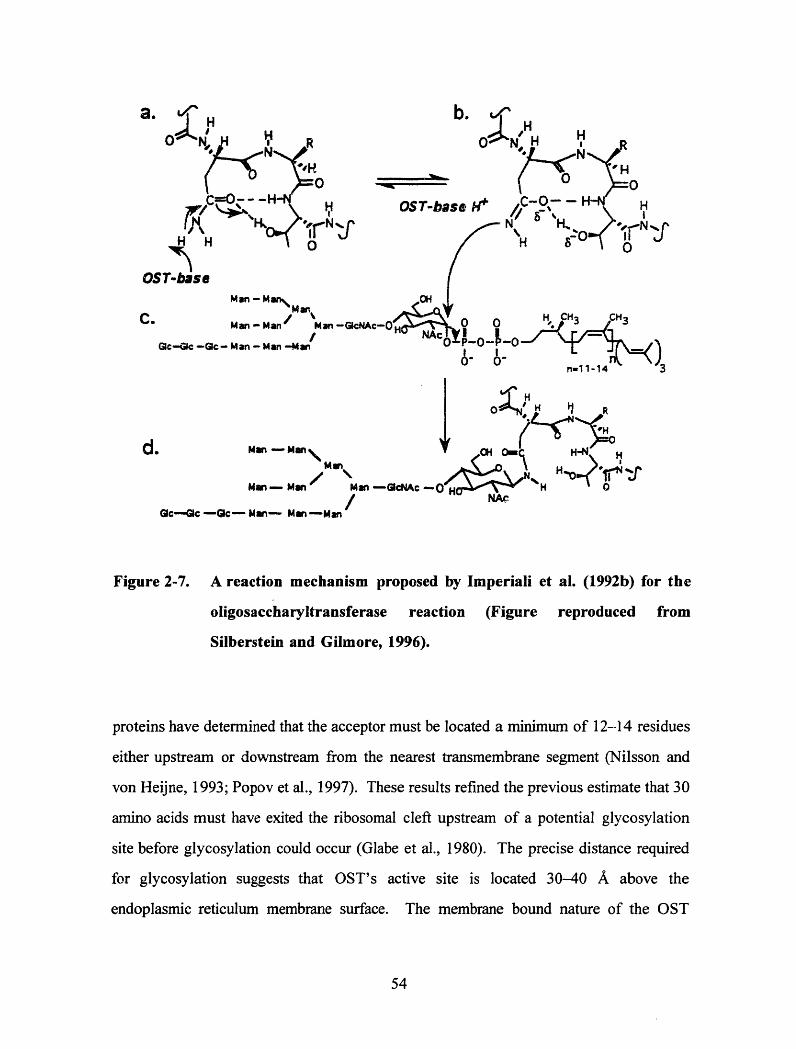
OST-ba:PN4'I 1
b.
-o o
Fe H* C-- -//j 8-,, \.
Man - Man M
C. / _Man- Man / n -I
Qc-Gc -GIc- Man - Man -Man
d. Man- Man\ I H (OimH H H
/ 1H N-c SMan-Man Mn -GcNAcc-- MH -Ma
Qc-Qc -Gc- Mn- Man -Man
Figure 2-7. A reaction mechanism proposed by Imperiali et al. (1992b) for the
oligosaccharyltransferase reaction (Figure reproduced from
Silberstein and Gilmore, 1996).
proteins have determined that the acceptor must be located a minimum of 12--14 residues
either upstream or downstream from the nearest transmembrane segment (Nilsson and
von Heijne, 1993; Popov et al., 1997). These results refined the previous estimate that 30
amino acids must have exited the ribosomal cleft upstream of a potential glycosylation
site before glycosylation could occur (Glabe et al., 1980). The precise distance required
for glycosylation suggests that OST's active site is located 30-40 A above the
endoplasmic reticulum membrane surface. The membrane bound nature of the OST
54
%
_,,

enzyme complex means that there is a defined spatial "window" in which glycosylation
may occur (Shelikoff et al., 1996). The polypeptide must be in close proximity to the
membrane, and yet must extend at least 30 A from the membrane surface. This stringent
spatial requirement may partially explain the observation that glycosylation sites are less
likely to be occupied the closer they are to the carboxy-terminus (Gavel and von Heijne,
1990). Nascent proteins are held in close proximity , the ER membrane as long as the
polypeptide chain is still attached to the ribosome; once the carboxy-terminus is
completed, the nascent polypeptide can move away from the membrane. Therefore
glycosylation sites located closer to the amino-terminus would be expected to spend more
time in the vicinity of the OST. Another possible explanation for less glycosylation
towards the carboxy-terminus it that more polypeptide is available for competing folding
reactions. The influence of protein folding on the transferase reaction is discussed in the
next section.
2.3.4 Competition with Protein Folding
An adequate polypeptide substrate, plenty of precursor oligosaccharide and an active
oligosaccharyltransferase (OST) still do not guarantee that a potential glycosylation site
will be occupied. The Asn-Xxx-Ser/Thr recognition sequence must be accessible to the
membrane-bound OST enzyme or the reaction will not proceed. Because glycosylation
typically occurs cotranslationally, the polypeptide is only accessible to the OST for a
limited time. Protein folding events also occur cotranslationally (Chen et al., 1995;
Fedorov and Baldwin, 1995), and if they render the glycosylation site inaccessible, then
glycosylation may not occur. The complex spatial and temporal relationship between
folding and glycosylation has recently been modeled (Shelikoff et al., 1996). This model
suggests that competition between folding and glycosylation may influence site
occupancy heterogeneity.
55

There is some experimental evidence to support the concept of protein folding events
interfering with glycosylation. By altering the redox potential in a cell-free transcription
and translation system, Bulleid et al. (1992) demonstrated that an inverse relationship
existed between disulfide bond formation and glycosylation of t-PA. Under conditions
where disulfide bond formation was inhibited, glycosylation site occupancy at Asn-184
increased. The in vitro results were later confirmed in vivo by culturing recombinant
CHO cells in the presence of the reducing agent dithiothreitol (DTT) to prevent co-
translational disulfide bond formation in the endoplasmic reticulum (Allen et al., 1995).
In accordance with in vitro results, inhibiting disulfide bond formation led to complete
glycosylation of the otherwise partially glycosylated Asn-184. Similarly, DTT treatment
of Saccharomyces cerevisiae has been shown to increase site occupancy of a novel
glycosylation site added via mutagenesis to carboxypeptidase Y (Holst et al., 1996). In
this study, similar effects were observed when in vivo folding was disrupted by deleting a
section of the polypeptide that was known to influence folding. Hence the change in
glycosylation site occupancy could be directly attributed to changes in folding, and not to
a secondary effect of DTT.
2.3.5 Cell Culture Environment
This literature review has so far focused on specific mechanisms for influencing
glycosylation site occupancy. A number of studies have also been published which
report alterations in glycosylation in response to changes in culture environment, without
identifying specific causes for the observed effects. Culture environment changes can
potentially impact site occupancy through any of the mechanisms described in the
preceding sections. This section briefly reviews the influence of culture environment and
discusses the likely causes for observed glycosylation changes.
Several investigators have noted that ammonia can influence glycosylation. Ammonia has
been shown to reduce the extent of sialylation of N-linked (Gawlitzek et al., 1995b; Kopp
56

et al., 1995; Thorens and Vassalli, 1986) and O-linked (Anderson and Goochee, 1995)
glycoproteins. In addition, ammonia negatively impacted glycosylation site occupancy of
recombinant mouse placental lactogen-I produced by CHO cells (Borys et al., 1994a).
Borys et al. (1994a) demonstrated that the negative impact of ammonium chloride
correlated with the concentration of the unprotonated ammonia species (NH3) and was
thus pH dependent. The uncharged species can freely diffuse across membranes, whereas
the charged species (NH4+) must be transported through ion-transport systems. Once
across the plasma membrane, ammonia may influence glycosylation by altering the
intracellular pH. Sialylation in particular might be influenced by changes in pH, since the
normal trans-Golgi is slightly acidic and ammonia has been shown to collapse the Golgi-
cytosol pH gradient (Anderson and Goochee, 1995). The O-linked sialyltransferase from
CHO cells has an approximately twofold decrease in activity as the pH is raised from
6.75 to 7.0 (Anderson and Goochee, 1995). Changes in Golgi pH could potentially cause
changes in N-linked sial, .ion as well, assuming the N-linked sialyltransferase has a
similar pH dependence. An alternative mechanism for ammonia's influence is buildup of
intracellular UDP-GlcNAc + UDP-GalNAc (UDP-GNAc). Ryll et al. (1994) found that
ammonium treatment leads to accumulation of UDP-GNAc, apparently due to enzymatic
action of glucosamine-6-P deaminase. Normally amino sugars are formed using glutamine
as the ammonia donor in a reaction catalyzed by glutamine:fructose-6-P amidotransferase
(GFAT), but apparently accumulation of ammonia can lead to amino sugar formation
using ammonia directly. Excessive UDP-GNAc may negatively impact glycosylation
reactions.
In addition to mediating the toxicity of ammonia by altering its extent of protonation,
extreme variations in culture pH have been reported to influence glycosylation in the
absence of ammonia buildup (Borys et al., 1993). Borys et al. (1993) found that
glycosylation of mouse placental lactogen-I by CHO cells did not vary significantly
between pH 6.9 to 8.2, as determined by western blot molecular weight distributions. At
lower or higher pH values, more low molecular weight species were produced,
57

presumably due to lower glycosylation site occupancy. The mechanism of pH disruption
of glycosylation is not clear. It may be related to variations in glycosylation enzyme
activities due to changes in intracellular and intracompartmental pH, since glycosylation
was fairly constant within a range of external pH over which CHO cells were reported to
maintain fairly constant intracellular pH (Borys et al., 1993). Alternatively, extreme pH
values may disrupt cellular metabolism, which would influence the availability of sugar
precursors and activated carrier molecules such as nucleoside triphosphates and dolichol
phosphate.
Lipid supplements have been shown to influence glycosylation site occupancy of IFN-y
produced by CHO cells (Jenkins et al., 1994). Lipids could be expected to influence
glycosylation site occupancy through at least two mechanisms. Lipids supplements
could alter the activity of the oligosaccharyltransferase (OST) enzyme due to changes in
the composition of the ER membrane (as discussed above in the section
Oligosaccharyltransferase Activity). Alternatively, the lipid supplements may influence
the availability of dolichol phosphate, thereby changing the amount of precursor
oligosaccharide.
Substantial changes in glycosylation have also been observed when cells are cultured in
serum-free versus serum-containing medium (Gawlitzek et al., 1995a; Jenkins et al.,
1996). In several cases cells cultured in serum-free medium had higher levels of terminal
sialylation. Gawlitzek et al. (1995a) also found that cells grown in serum-free medium
had a higher glycosylation site occupancy. The effects of serum on glycosylation might
be partially related to the lipid effects described above. In addition, hormones can impact
glycosylation (Goochee and Monica, 1990; Konrad and Merz, 1994), and serum content
will vary growth factor/hormone levels. Many hormonal and growth factor effects are
mediated by cyclic AMP, and Konrad and Merz (1994) have demonstrated that cAMP
stimulates lipid-linked oligosaccharide precursor synthesis in JEG-3 choriocarcinoma
cells. Hormonally induced oligosaccharide precursor synthesis may be a result of
58

increased activity of glycosyltransferase enzymes such as UDP-GlcNAc:dolichol-P
GlcNAc-1-P transferase (GPT) (Ma et al., 1996) or due to increased dolichol synthesis
(Crick and Waechter, 1994). Because of the complex and undefined nature of serum, it is
difficult to determine which factors are most responsible for alterations in glycosylation.
Variations in glycosylation have been noted with time during batch and fed-batch culture
(Curling et al., 1990; Robinson et al., 1994; Xie et al., 1997) and with changes in culture
characteristics such as extent of aggregation (Borys et al., 1994b; Coppen et al., 1995).
Such changes may be due to many of the factors discussed above, including changes in
pH, ammonia, lipids, etc. A further complication is that many culture environment
changes would be expected to impact central carbon metabolism, and the influence of
metabolism on glycosylation is not well understood. Metabolism would be expected to
impact availability of sugar precursors and activated carrier molecules such as nucleoside
triphosphates and dolichol phosphate. The results described in subsequent chapters of
this thesis help to elucidate how normal cellular metabolism influences glycosylation site
occupancy.
2.4 Model System: Recombinant Human Gamma Interferon
Production in Chinese Hamster Ovary Cells
In this research, glycosylation site occupancy was analyzed for recombinant human
gamma interferon (IFN-y) produced in Chinese hamster ovary cell culture. Natural
human IFN-y is a secretory glycoprotein produced by activated T lymphocytes and
natural killer cells in response to various mitogenic stimuli (Devos et al., 1982). IFN- is
a potent member of the cytokine family with antiviral, antiproliferative and
immunomodulatory activities (Farrar and Schreiber, 1993). A recombinant form of IFN-y
is sold under the trade name Actimmune by Genentech as a treatment for Chronic
Granulomatous Disease (CGD) (Physicians' Desk Reference, 1996). CGD is an inherited
59
disorder characterized by deficient phagocyte oxidative metabolism, and IFN-y treatment
is able to stimulate phagocyte function.
Natural IFN-y is a partially glycosylated, dimeric protein (Rinderknecht et al., 1984).
The monomer has two potential N-linked glycosylation sites, and these sites are variably
occupied which results in a mixture of proteins with two sites (Asn-25 and Asn-97), one
site (Asn-25 only) or zero sites glycosylated (James et al., 1995). When analyzed by
sodium dodecyl sulfate polyacrylamide gel electrophoresis (SDS-PA.GE), IFN-y migrates
as three major bands at 16, 20 and 24 kDa corresponding to the zero, one and two site
glycosylated species, respectively. IFN-y derived from cultured leucocytes was found to
be 52% two site, 39% one site and 9% zero site glycosylated, with dimers formed
randomly from the variously glycosylated monomers (Sareneva et al., 1995). Natural
IFN-y also exhibits heterogeneity at the carboxy terminus due to variable proteolytic
processing (Rinderknecht et al., 1984).
Human IFN-y cDNA has been cloned (Devos et al., 1982) and expressed in several
recombinant expression systems including Chinese hamster ovary cells (Scahill et al.,
1983), Escherichia coli (Arakawa et al., 1985; Zhang et al., 1992), insect cells (James et
al., 1995; Sareneva et al., 1994) and trangenic mice (James et al., 1995). Of these various
expression systems, the Chinese hamster ovary (CHO) cells produce a product which
most closely resembles natural human IFN-y. CHO cell derived IFN-y has glycosylation
site occupancy heterogeneity and variable carboxy terminal processing similar to the
natural product (Curling et al., 1990). Natural human IFN-y and recombinant CHO IFN-
y also have similar site specific glycosylation characteristics. The carbohydrates of
recombinant CHO IFN-y were characterized initially by 'H-NMR (Mutsaers et al., 1986)
and later by matrix-assisted laser desorption/time-of-flight (MALDI/TOF) mass
spectrometry (Gu et al., 1997; Harmon et al., 1996; James et al., 1995). The
carbohydrates of natural IFN-y were recently determined with MALDI/TOF (Mortz et
al., 1996), and similar structures were found. The oligosaccharides at Asn-25 are
60

predominantly core fucosylated complex biantennary structures, with lesser amounts of
tri- and tetraantennary complex oligosaccharides. Asn-97 oligosaccharides are not core
fucosylated, and they are generally less branched. Similar to the Asn-25 glycans, Asn-97
oligosaccharides are primarily complex biantennary structures, but there are fewer tri- and
tetraantennary glycans and more high mannose and hybrid structures. In comparison,
glycosylation of insect cell and transgenic mouse derived IFN-y differs significantly from
natural human IFN-y (James et al., 1995). Insect cells attached mainly truncated mannose
oligosaccharides, while transgenic mice produced high mannose carbohydrates at the Asn-
97 site.
The site occupancy heterogeneity of IFN-y produced in recombinant CHO cells is largely
due to variable occupation of the Asn-97 glycosylation site (James et al., 1995).
Typically 10% or less of the protein is non-glycosylated, while the remaining 90+%
contains oligosaccharide at Asn-25. The Asn-97 site is occupied to a lesser extent, which
gives rise to a significant fraction of protein glycosylated at only the Asn-25 site.
Virtually no Asn-97 one site glycosylated protein is detected. There are several possible
explanations for the preference of Asn-25 over Asn-97. The Asn-25 is part of an Asn-
Gly-Thr recognition sequence, while Asn-97 is part of Asn-Tyr-Ser. As discussed above
(see Substrate Amino Acid Sequence), threonine is a more effective hydroxy amino acid in
the Asn-Xxx-Ser/Thr glycosylation sequon (Kasturi et al., 1995), and glycine would be
expected to be better than the bulky aromatic tyrosine in the Xxx position (Shakin-
Eshleman et al., 1996). Thus the Asn-25 is part of a more effective glycosylation sequon.
Furthermore the Asn-97 residue is closer to the carboxy terminus, and, as noted
previously (see Substrate Amino Acid Sequence), asparagines towards the carboxy
terminus are less likely to be glycosylated than those near the amino terminus (Gavel and
von Heijne, 1990). In addition the Asn-25 may be more accessible, because it is located
on a random coil structure, while Asn-97 is located at the end of an alpha helix (see Figure
2-8). It is also possible that glycosylation at Asn-25 facilitates glycosylation at Asn-97.
Pulse-chase radiolabeling studies with insect cells producing recombinant IFN-y indicate
61

10Q D P Y V K E A E N L K K Y
i * Helix A
DN 30D N G TL F L G I L K N W K
I -- -Helix B |
F NJ A G H
40E E S R
20S D V A
K I M Q
50S Q I V S F Y
Helix C
70
V E T I K E D Helix D
E K L T S 1
-Helix E
120V M A E L S P
60F K L F K N F K I D
80
V K F
D L4
D
I -
Q S I Q
90K K R D D F
IdF I N S N K
110V Q R K A I H
Helix F
130K T G K R K R
E L I Q
S Q M L F R G
Figure 2-8. The amino acid sequence of mature human interferon-y (after
signal peptide cleavage). Glycosylation sites are indicated by J.
that the Asn-25 glycans are added cotranslationally, while core glycosylation of Asn-97
occurs largely post-translationally (Sareneva et al., 1994). Glycosylation at Asn-25
would promote interaction of IFN-y with calnexin, a membrane-bound lectin chaperone
(see Implications for Protein Folding). Calnexin would keep the protein in close
proximity to the membrane, making post-translational glycosylation by the membrane-
bound oligosaccharyltransferase more probable.
The oligosaccharides of IFN-y can impact the protein in many of the ways discussed
previously (see Implications of N-linked Glycosylation). Glycosylation appears to be
important for the correct folding and dimerization of IFN-y, with glycosylation at Asn-25
being especially critical (Sareneva et al., 1994). When the Asn-25 glycosylation site was
62

A B
Figure 2-9. Schematic drawings of E. Coli derived recombinant human
interferon-y dimers (from Ealick et al., 1991). (A) Ribbon drawing
approximately parallel to the dimer twofold axis. (B) The a helices
are represented as cylinders, while nonhelical regions are tubes. (C)
a helices are represented by circles, with the N-terminal end
darkened. Glycosylation sites are indicated by .
eliminated through site directed mutagenesis, dimerization was less efficient and protein
secretion dropped by more than 90%. IFN-y was observed in insoluble aggregates which
were hypothesized to be misfolded material tightly bound to chaperone proteins.
Inefficient folding of non-glycosylated protein might explain why E. coli produce
recombinant IFN-y as inclusion bodies (Arakawa et al., 1985; Zhang et al., 1992). IFN-y
from inclusion bodies can be refolded from 7 M urea or guanidine hydrochloride, although
there is typically loss of protein due to aggregation (Arakawa et al., 1985; Zhang et al.,
1992). Re-folded E. coli derived IFN-y forms a dimer, and the crystal structure for the
dimer has been solved (Ealick et al., 1991). The dimer is non-covalently associated, as
IFN-y does not contain any cysteine residues or disulfide bonds. Figure 2-9 illustrates
63
A

that the dimeric structure is stabilized by intertwining of alpha helices across the subunit
interface, and these interactions are believed to be essential for proper tertiary structure
(Dudich et al., 1992). Natural glycosylated IFN-y is believed to adopt a similar
configuration, and the glycosylation sites are on the surface of the dimer.
In addition to aiding in vivo protein folding, the oligosaccharides of IFN-y impact other
protein properties. The oligosaccharides have been shown to protect the polypeptide
from proteolysis by elastase, cathepsin G and plasmin (Sareneva et al., 1995). The N-
linked glycans can also be important for pharmacokinetics. Naturally glycosylated IFN-y
has a longer circulatory half-life than both non-glycosylated and recombinant insect cell
glycosylated IFN-y (Sareneva et al., 1993). The glycosylated insect cell product was
eliminated the most rapidly. Insect cells are known to attach primarily truncated
mannose oligosaccharides to IFN-y (James et al., 1995), and so rapid clearance of insect
glycosylated IFN-y was likely due to uptake via mannose receptors on tissue resident
macrophages (see Implications for Circulatory Half-Life). This illustrates that improper
glycosylation can be worse than lack of glycosylation. Proper glycosylation, on the other
hand, may help IFN-y avoid clearance in the kidney. The non-glycosylated IFN-y dimer
has a mass of around 34 kDa and is positively charged (Farrar and Schreiber, 1993). As
discussed above, small positively charged molecules are likely to be cleared by the kidney.
Full glycosylation increases the mass of the dimer to -50 kDa and sialic acid residues
contribute negative charges. Both of these changes may help prevent renal clearance.
This hypothesis is supported by evidence that E. coli derived IFN-y was cleared by
perfused rabbit liver and kidney more rapidly than glycosylated IFN-y from CHO cells
(Bocci et al., 1985). A longer circulatory half-life could potentially make the CHO cell
derived interferon a more effective pharmaceutical, despite the fact that glycosylated and
non-glycosylated interferon have similar in vitro activity (Rinderknecht et al., 1984). The
product sold by Genentech is derived from E. coli, and it is rapidly cleared from
circulation when administered intraveneously (Physicians' Desk Reference, 1996).
64

3. Materials and Methods
3.1 Cell Culture
3.1.1 Cell Line
A Chinese hamster ovary cell line producing recombinant human gamma interferon (-
CHO) was obtained from Dr. Walter Fiers at the University of Ghent, Belgium (Scahill et
al., 1983). The y-CHO cell line was created from a dihydrofolate reductase deficient
(DHFR-) CHO cell line by co-transfecting the cells with genes for DHFR and human
gamma interferon (FN-y). DHFR' cells require added ribonucleosides to survive, while
transformed cells are able to produce their own ribonucleosides. The cells were selected
for growth in 0.25 jiM methotrexate, which is a competitive inhibitor of the DHFR
enzyme. Methotrexate selection leads to amplification of the DHFR gene and adjacent
DNA (Kaufman and Sharp, 1982), which increases the copy number of genes co-
transfected with DHFR (IFN-y in our case). The cell line was originally grown in the
presence of serum, and was anchorage dependent. To maintain selection pressure, the
cells were grown in ribonucleoside-free medium with dialyzed serum and 0.25 gM
methotrexate.
3.1.2 Chaperone Protein (BiP) Levels in T-flask Cultures
Lysates were collected from the y-CHO cell line and two other CHO cell lines to
determine whether overexpression of IFN-y affects intracellular concentrations of the
chaperone protein BiP. CHO-K1 (CCL-61) and CHO/DHFR' (CRL-9096) cell lines were
obtained from the American Type Culture Collection (ATCC, Rockville, MD). The cell
lines were all adapted to growth in RPMI-1640 medium (Sigma, St. Louis, MO)
supplemented with 5% dialyzed fetal bovine serum (Sigma), 10,000 units/I penicillin
(Sigma) and 10 mg/l streptomycin (Sigma). Hypoxanthine at 0.1 mM (Sigma) and 0.01
mM thymidine (Sigma) were added to the medium for the CRL-9096 cells, because the
65

cell line is deficient in dihydrofolate reductase and therefore requires added
ribonucleosides. Cells were grown anchorage dependent in T-flasks maintained at 370 C
with a 10% carbon dioxide overlay. Cell lysates were collected during the exponential
growth phase and analyzed as described in Quantitative Western Blot for BiP (page 90).
3.1.3 T-flask Cultures Treated with Tunicamycin
Anchorage dependent y-CHO cells were grown in T-25 flasks in an incubator maintained
at 37°C with a 10% carbon dioxide overlay. The medium was DMEM/F12 (Sigma)
supplemented with 5% dialyzed fetal bovine serum (Sigma), 0.25 ptM methotrexate
(Sigma), 10,000 units/i penicillin (Sigma) and 10 mg/l streptomycin (Sigma). Cell lysates
were collected from control and 10 jgg/ml tunicamycin (Sigma) treated cultures 17 hours,
24 hours and 48 hours after exposure to tunicamycin. Lysates were collected and
analyzed as described in Quantitative Western Blot for BiP (page 90).
3.1.4 Adaption to Suspension Culture
The y-CHO cell line was adapted from serum-containing medium and anchorage
dependence to serum-free, suspension culture. These growth conditions were selected in
order to provide a defined environment, free of serum composition variations and surface
morphological effects. Cells growing in Dulbecco's Modified Eagle's Medium (Sigma, St.
Louis, MO) with 10% serum (Sigma) were trypsinized from T-flasks and suspended at
3x 05 cells/ml. Twenty ml aliquots were placed into 50 ml shake flasks, which were
agitated at 70 rpm in an incubator maintained at 37°C with a 10% carbon dioxide overlay.
Every 3-5 days the cells were counted and resuspended at -3x10 5 cells/ml in fresh
medium. The serum-containing medium was gradually replaced by a commercial serum
free medium, CHO-S-SFM (Gibco, Gaithersburg, MD) supplemented with 0.25 M
methotrexate (Sigma), 10,000 units/l penicillin (Sigma) and 10 mg/l streptomycin (Sigma).
Serum-content was reduced stepwise (5.00%, 3.75%, 2.50%, 1.25%, 0% dFBS) over a
period of several weeks. As serum-free medium replaced the serum-containing medium,
66

clumping and wall growth gradually subsided. Cells growing on walls were avoided when
transferring cells to fresh medium and flasks. The cells were completely adapted to
serum-free, suspension growth after about 3.5 months. Cells seeded at 3x10⁵ cells/ml
typically grew to -1.8x10⁶ cells/ml with a doubling time of 26 hours.
3.1.5 Low-Serum Culture
Although the y-CHO cells grew well in CHO-S-SFM, the medium was a proprietary
formulation and therefore unsuitable for experiments which required detailed knowledge
of medium composition. We attempted to develop a non-proprietary serum-free medium
based upon published formulations (Hamilton and Ham, 1977; Hayter et al., 1992;
Jenkins, 1991). Our initial serum-free medium was an RPMI-1640 base supplemented
with 10 mg/I insulin, 10 mg/l transferrin, 0.5 g/l albumin, 0.1 wt% Pluronic F-68, 1 mM
sodium pyruvate, 0.1 mM alanine, 1 PgM putrescine, 11 mg/I choline chloride, 100 M
ethanolamine, 1.5 M linoleic acid, 0.25 M methotrexate, 10,000 units/l penicillin, 10
mg/I streptomycin and trace elements according to Hamilton and Ham (1977). All
medium components were obtained from Sigma (St. Louis, MO). Although the cells were
able to survive in this medium, the growth rate was quite slow (-38 h doubling) and the
maximum cell density was low (-7x10⁵ cells/ml). We found that adding low
concentrations of serum (0.75% dialyzed fetal bovine serum) improved the growth rate to
24 hour doubling and the maximum cell density increased to -1.5x10⁶ cells/mi. "Low-
serum" experiments were performed using this medium.
3.1.6 Serum-Free Culture
In order to improve growth in serum-free media, many formulations include low molecular
weight digests of biological material such as yeast extracts and plant or animal tissue
hydrolysates (Bonarius et al., 1996; Keen and Rapson, 1995; Schumpp and Schlaeger,
1990; Velez et al., 1986). Such additives provide sources of free amino acids, peptides,
vitamins, minerals and undefined components. We tested hydrolysates from wheat, rice,
67

soy, and animal tissue (supplied by Quest International, Norwich, NY) at 2.5 g/l with our
preliminary serum-free medium formulation to see if we could get acceptable performance
without adding serum. The animal tissue hydrolysate Primatone RL (Quest International)
was found to provide the best improvement.
We also found that the high concentration (0.5 g/l) of albumin in our initial serum-free
medium formulation could be replaced by including 0.4 g/I 2-hydroxypropyl-[-
cyclodextrin (Sigma). Cyclodextrins can act as carriers for hydrophobic molecules such as
lipids and vitamins (Keen and Rapson, 1995), which is one of the primary roles for
albumin. Other medium improvements included reducing insulin and transferrin
concentrations, including EDTA to complex trace mirierals and switching from ferrous
sulfate to ferric citrate. The final serum-free medium, designated RPMI-SFM, consisted
of RPMI-1640 supplemented with 2.5 g/1 Primatone RL, 0.4 g/l 2-hydroxypropyl-13-
cyclodextrin, 1 g/l (0.1%) Pluronic F-68, 5 mg/l insulin, 5 mg/I transferrin, 1 mM sodium
pyruvate, 1 M putrescine, 11 mg/l choline chloride, 100 pgM ethanolamine, 1.5 M
linoleic acid, 0.25 gM methotrexate, 10,000 units/l penicillin, 10 mg/l streptomycin, 6.3
mg/l EDTA and trace minerals (10 nM sodium selenite, 1 nM manganese sulfate, 10 nM
molybdic acid, 10 nM ammonium metavanadate, 10 nM cupric sulfate, 3 ,uM zinc sulfate
and 5 gM ferric citrate). For experiments which involved 35S methionine radiolabeling,
methionine-free RPMI-1640 was used to increase the specific activity of the radiolabel.
Primatone RL at 2.5 g/l contains 150 to 200% of the methionine normally supplied by
RPMI-1640, and therefore ample methionine was present to support cell growth even
when methionine-free RPMI-1640 was used. Cell growth was identical whether or not
methionine was included in the RPMI-1640 base. In batch culture, the cells doubled
every -21 hours and reached maximum cell densities of -2x10 6 cells/ml when seeded at
2x10⁵ cells/ml.
68
3.1.7 Culture Maintenance
Cultures were routinely maintained in shake flasks agitated at 70 rpm on an orbital shaker
(Bellco, Vineland, NJ) placed in a 37°C incubator with a 5-10% carbon dioxide overlay.
Every 2-4 days, cells were resuspended in fresh medium at 2x10⁵ cells/mi. Frozen stocks
were prepared from cells with viabilities > 95% ty centrifuging the cells at 800 rpm for 7
minutes and resuspending the cells at 7x10⁶ cells/mil in freezing medium (7.5% DMSO,
46.3% fresh medium and 46.3% conditioned medium). Vials containing 1 ml of the cell
suspension were placed into a cryogenic 1 C/min freezing container (Cole-Parmer, Niles,
IL) which was placed into a -70 C freezer over-night. Cells were later transferred to a
liquid nitrogen cell bank for long term storage. New cultures were started by quickly
thawing the frozen cells and placing them directly into 20 ml of fresh medium in a shake
flask. The following day the cells were resuspended at 2x10⁵ cells/ml in fresh medium to
remove the DMSO. Cells were re-suspended every 2-4 days until the viability was
95%, at which time experiments were initiated.
3.2 Pulse-Chase Radiolabeling Experiment
The kinetics of IFN-y secretion were measured in a pulse-chase radiolabeling experiment.
Cells growing in low-serum (0.75% dialyzed fetal bovine serum) suspension culture were
collected and washed twice in phosphate buffered saline. The cells were then suspended
at 7x10⁵ cells/ml in 50 ml of methionine-free, low-serum medium. After a 30 minute pre-
starvation period, a 5.0 mCi pulse of 35S labeled methionine was added (0.1 mCi/ml final
concentration). Following a 30 minute exposure to the labeled amino acid, the cells were
transferred to chase medium containing excess (0.1 mM) non-labeled ("cold") methionine.
Samples (8 ml) were collected 0.5, 1.0, 1.5, 2.0 and 3.5 hours after adding the
[35S]methionine pulse. The samples were centrifuged for 4 minutes at 200 x g to remove
the cells, and the supernatents were stored at -700 C for later analysis. The radiolabeled
IFN-y was analyzed as described in Radiolabeled IFN-g Glycosylation Site Occupancy
Analysis on page 87.
69

3.3 Pulse Radiolabeling Experiments
3.3.1 Monitoring Secreted Protein Glycosylation with Radiolabeling
To study how protein glycosylation varied with changes in culture environment, we
developed a sensitive radiolabeling assay. Previously it was necessary to differentiate
accumulated product data to determine glycosylation characteristics of proteins being
produced at specific times during batch or fed-batch culture. Radiolabeling enabled
essentially differential data to be obtained directly, and it overcame detection limit
problems with methods such as western blot and silver stain. A 3 ml sample was
removed from the flask to be tested and placed into a 25 ml shake flask. Between 0.5 and
1.0 mCi of 35S labeled methionine was then added and the flask was incubated for 3-5
hours. No washing or media change steps were involved in the procedure, and the
methionine was added from between 17 and 27 gl of concentrated stock. This procedure
allowed us to radiolabel proteins produced during a defined time interval, while
introducing minimal perturbations in the cell culture environment. After the 3-5 hour
incubation, the supernatant was collected and stored at -70°C for later analysis. The
radiolabeled IFN-y was analyzed as described in Radiolabeled IFN-g Glycosylation Site
Occupancy Analysis on page 87.
3.3.2 Batch Culture
Glycosylation site occupancy and the concentration of the intracellular chaperone protein
BiP were monitored in low-serum (0.75% dFBS) batch culture. A 500 ml spinner flask
was seeded at 1.5x10⁵ cells/ml and agitated at approximately 75 rpm in a 37°C incubator
with a 5% carbon dioxide atmosphere. Every eight hours, a 3 ml sample was taken from
the spinner flask and radiolabeled in a 25 ml shake flask with between 0.5 and 1.0 mCi of
35S methionine. More radioactivity was used for early samples to compensate for the
higher concentration of unlabeled methionine and the lower cell density. The radiolabel
incubation lasted 3 hours. During the incubation period, the cell number and viability in
70

the spinner flask were determined using the trypan blue exclusion method with a
hemacytometer. Samples containing 2.5x10⁶ cells were then collected from the spinner
flask, and the cells were lysed in 2 ml of lysis buffer (see Quantitative Western Blot for
BiP on page 90). Radiolabeled supernatants were collected and analyzed for
glycosylation site occupancy heterogeneity, and cell lysates were analyzed for
intracellular BiP concentrations.
3.3.3 Fed Batch Culture
Fed batch cultures were performed in spinner flasks using the stoichiometric feeding
technique developed at MIT (Xie et al., 1997; Xie and Wang, 1994a; Xie and Wang,
1994b). Agitation was set at 100 rpm, and the flasks were placed in a 37°C incubator
with a 5% carbon dioxide atmosphere. Cultures were inoculated at 2-5x10⁵ cells/ml in
initial medium containing 3 mM glucose and 0.5 mM glutamine. The initial medium was
either a stoichiometrically designed medium (Xie et al., 1997), or RPMI-SFM with
reduced glucose and glutamine and enhanced buffer capacity. The buffer capacity of
RPMI-1640 was enhanced by adding 2.09 g/l of MOPS (Sigma) and 6.50 g/l HEPES
sodium salt (Sigma). To maintain proper osmolarity when the extra buffers were added,
the sodium chloride concentration was reduced from 6 g/l to 2 g/l. Choice of initial
medium had little impact on culture performance; similar results were obtained with the
stoichiometrically designed medium and the modified RPMI-SFM. Feeding was
performed with a stoichiometrically designed supplemental medium as described in Xie et
al. (1997). Cell counts and feeding were performed every 12 hours. Samples were
withdrawn periodically to monitor glycoform secretion with radiolabeling and to collect
supernatant for later analysis.
3.3.4 Sugar Precursor Fed Cultures
The potential impact of hexose carbon on glycosylation site occupancy was studied by
feeding various sugars which could be converted to oligosaccharide sugars. Cells were
71

pre-treated for two days in glucose-containing RPMI-SFM supplemented with 5 mM
mannose (Sigma), 5 mM galactose (Sigma), 5 mM fructose (Sigma) or 2 mM glucosamine
(Sigma). In addition, combinations of sugars were tested including 5 mM mannose + 5
mM galactose, 2 mM glucosamine + 5 mM mannose, 2 mM glucosamine + 5 mM
galactose, 2 mM glucosamine + 5 mM fructose and 2 mM glucosamine + 5 mM pyruvate.
Following the two day pretreatment, cells were resuspended in fresh media at 7.25x10⁵
cells/ml with the same additives used for pretreating. Three ml samples were removed
from each flask and radiolabeled with 0.5 mCi of 35S methionine for 3 hours. Radiolabeled
samples were analyzed for glycosylation site occupancy heterogeneity.
The influence of glucosamine feeding on site occupancy was further studied in a dose-
response experiment. Cells were suspended at 1.0x10 6 cells/ml in RPMI-SFM
supplemented with 0, 0.5, 1.0, 2.0 or 5.0 mM glucosamine. 4 ml samples were
radiolabeled with 0.5 mCi of 35S methionine for 5 hours. Radiolabeled samples were
analyzed for glycosylation site occupancy heterogeneity.
3.3.5 Nucleotide Precursor Fed Cultures
Glycosylation site occupancy was studied in the presence of the nucleotide precursors
uridine, orotic acid, adenosine and guanosine in 20 ml shake flask cultures. A 100 mM
stock of uridine (Sigma) and 2 mM stocks of orotic acid (Sigma), adenosine (Sigma) and
guanosine (Sigma) were prepared in RPMI-SFM and sterile filtered (Millex-GV,
Millipore, Bedford, MA) (guanosine was not very soluble in RPMI-SFM or water, and
so the final concentration after filtering may have been less than 2 mM). Each 20 ml flask
was prepared by blending the appropriate concentrated precursor stock, RPMI-SFM and
a concentrated cell suspension so that the initial cell density was 2.5x10⁵ cells/mi.
Nucleotide precursor stocks were added so that the final concentrations tested were 0.5
mM orotic acid, 1.0 mM orotic acid, 0.5 mM uridine, 1.0 mM uridine, 1.0 mM adenosine
and 1.0 mM guanosine. The flasks were incubated at 370 C in a 5% CO2 atmosphere for 2
72

days. On the second day, 3 ml samples were removed from each flask and radiolabeled
with 0.5 mCi of 35S methionine for 5 hours. During the radiolabel incubation, the cell
number and size was determined for each flask using a Coulter Counter (Coulter
Electronics, Hialeah, FL). Cell numbers and viabilities were also obtained using the
trypan blue exclusion method with a hemacytometer. Samples containing 5X10⁶ cells
were then collected from each flask, and the cells were extracted with perchloric acid (see
Nucleotide and Nucleotide Sugar Analysis on page 82). The radiolabeled supernatant was
analyzed to determine glycosylation site occupancy of secreted protein, and the
perchloric acid extracts were used to determine nucleotide concentrations.
3.3.6 Glucosamine and Uridine Fed Cultures
An experiment was designed to study the interaction between glucosamine feeding,
nucleotide sugar formation, UTP depletion and glycosylation site occupancy. Cells
growing in RPMI-SFM were fed 2 mM glucosamine and 5 mM uridine alone and in
combination. Fifteen ml cultures were seeded in the various media at 1.0x10⁶ cells/ml in
50 ml shake flasks. Following a 3 hour pre-treatment, 3 l samples were removed from
each flask and radiolabeled with 0.5 mCi of 35S methionine for 5 hours. During the
radiolabeling period, the cell number and size was determined for each non-radioactive
flask using a Coulter Counter (Coulter Electronics, Hialeah, FL). Cell numbers and
viabilities were also obtained using the trypan blue exclusion method with a
hemacytometer. Samples containing 510 6 cells were then collected from the original
flasks, and the cells were extracted with perchloric acid (see Nucleotide and Nucleotide
Sugar Analysis on page 82). The radiolabeled supernatant was analyzed to determine
glycosylation site occupancy of secreted protein, and the perchloric acid extracts were
used to determine nucleotide concentrations.
73

3.3.7 Uridine Fed Batch Culture
Nucleotide sugars and glycosylation site occupancy were studied in fed batch cultures
which contained uridine. The fed batch protocol described above (see Fed Batch Culture)
was performed with uridine added to the initial medium. The initial medium was a
modified RPMI-SFM with 3 mM glucose, 0.5 mM glutamine, 2.09 g/l of MOPS, 6.50 g/l
HEPES sodium salt and 2 g/l sodium chloride. A concentrated 100 mM stock of uridine
was prepared in the initial medium, and this stock was blended with initial medium and a
concentrated seed culture to give 100 ml spinner flasks containing 4.5x10 5 cells/ml and
uridine at 2.5 mM or 10.0 mM. Two control flasks were also analyzed: a fed batch
without added uridine, and a non-fed batch with 2 mM glutamine and 11 mM glucose in
the initial medium. The flasks were seeded with equal volumes from a common
concentrated seed culture. Feeding was performed with a stoichiometrically designed
supplemental medium as described in Xie et al. (1997). Cell counts and feeding were
performed every 12 hours. At 75 hours an additional 1 mM uridine was added to the
uridine containing flasks to account for expected consumption.
Every 24 hours samples were collected for radiolabeling and perchloric acid extraction.
The samples were taken between feeding times to avoid transiently starved or over-fed
cultures. Three ml samples were removed from each flask and radiolabeled with 0.5 mCi
of 35S methionine for 4 hours. During the radiolabel incubation, the cell number and size
was determined for each flask using a Coulter Counter (Coulter Electronics, Hialeah, FL).
Cell numbers and viabilities were also obtained using the trypan blue exclusion method
with a hemacytometer. Cell aggregation (clumping) was significant for the final sample,
and so cells were trypsinized before counting this sample. Two ml of sample was
centrifuged at 800 rpm for 7 minutes, and the supernatant was removed. The pellet was
suspended in 0.5 ml of 0.5 g/l porcine trypsin + 0.2 g/l EDTA.4Na (Sigma) by pipeting
the mixture repeatedly for two minutes. Trypsin was then neutralized by adding the
suspension to 1.5 ml of 1 mg/ml soybean trypsin inhibitor (Sigma). The trypsinized
74
sample was then counted using both the Coulter Counter and hemacytometer methods.
Following cell counts, fresh samples containing 5X10⁶ cells were collected from each flask,
and the cells were extracted with perchloric acid (see Nucleotide and Nucleotide Sugar
Analysis on page 82). The radiolabeled supernatant was analyzed to determine
glycosylation site occupancy of secreted protein, and the perchloric acid extracts were
used to determine intracellular nucleotide concentrations.
3.4 Continuous Culture Experiments
3.4.1 Continuous Culture Media
The media used for continuous culture experiments were slightly modified versions of the
RPMI-SFM serum-free medium described above (Serum-Free Culture on page 67).
Concentrations of glucose and glutamine were varied so that either glucose or glutamine
was the limiting nutrient. For glucose limited continuous culture, glucose-free RPMI-
1640 was supplemented with 0.5 g/l glucose (2.78 mM = 25% of normal RPMI-1640),
and glutamine was added to a final concentration of 0.45 g/l (3.08 mM = 150% of normal
RPMI- 1640). Similarly for glutamine limited chemostats, glutamine-free RPMI- 1640 was
supplemented with 75 mg/I glutamine (0.51 mM = 25% of normal RPMI-1640) and 2.0
g/l glucose (1 1.11 mM = 100% of normal RPMI-1640).
3.4.2 Bioreactor Operation
Continuous cultures were carried out in a 2 liter Applikon (Foster City, CA) reactor with
a 1.2 liter working volume. A heated water jacket maintained the temperature at 37 °C,
and agitation was set at 200 rpm. The pH was controlled at 7.20 ± .05 by addition upon
demand of 320 mM HC1 or a solution of 6.2 g/l NaOH and 0.4 g/l KOH. Carbon dioxide
was not included in the pH control loop so that the carbon dioxide evolution rate could be
more accurately measured (see below). Oxygen was supplied via surface aeration by
mixing air with either nitrogen or oxygen so that the reactor dissolved oxygen was
75

maintained at 45% of air saturation, with the gas flow rate controlled by a mass flow
controller at 35 mol/day (-0.05 VVM). An ML-4100 multi-loop processor controller
(New Brunswick Scientific, Edison, NJ) was used for the pH and oxygen control.
Process data were logged through the ML-4100 controller to a computer using the AFS
software from New Brunswick Scientific (Edison, NJ).
Reactor seed cultures were grown in 250 ml spinner flasks (Bellco, Vineland, NJ), and
reactors were seeded at approximately 4 x 10⁵ cells/mi. After 24 hours the feed and
waste pumps were started to initiate continuous culture. Following 5 residence times,
time invariance of the following variables was assumed to indicate a steady state: total
cell density, viability as measured by trypan blue exclusion, glucose concentration, lactate
concentration and oxygen uptake. When these parameters were steady within a 10%
range for 48 hours, the system was assumed to be at steady state.
3.4.3 Oxygen Uptake Rate
The oxygen uptake rate (OUR) was obtained from the mass balance for oxygen in the
liquid phase of the reactor at steady state:
OUR=kLa(C* - CR)+D(CF - CR) (1)
where kLa liquid phase mass transfer coefficient for oxygen
C* - liquid phase concentration of oxygen at equilibrium with the gas phaseCR- concentration of oxygen in the liquid phase of the reactorD - dilution rateCF- concentration of oxygen in the liquid feed
The first term on the right hand side represents oxygen transport across the gas-liquid
interface. The second term accounts for the net inflow of oxygen with the liquid streams.
Liquid concentrations of oxygen in the reactor and the feed were measured with a blood
gas analyzer (Ciba Coming Diagnostics, Medfield, MA). The equilibrium concentration,
C*, was calculated based on the gas phase oxygen concentration at the exit of the reactor,
which was determined with a gas analyzer containing a paramagnetic oxygen sensor
76

(Columbus Instruments, Columbus, OH). The partial pressures of oxygen, obtained from
either the blood gas analyzer or the gas analyzer, were converted to liquid concentrations
using Henry's Law (C02 = P02/Ho2 ). The Henry's constant for our serum free medium at
37 C was estimated as H0 2 = 9.99 x 10⁷ Pa mol/l based upon correlations presented by
Schumpe et al. (1982) for correcting gas solubilities to account for medium composition.
3.4.4 Carbon Dioxide Evolution Rate
The carbon dioxide evolution rate (CER) was determined from a mass balancing approach
similar to that of Bonarius et al. (1995), except that liquid phase carbon dioxide levels
were measured rather than calculated. A mass balance for carbon dioxide over the entire
reactor at steady state yields:
CER = VY -g Yco, )+ D(CAR - CA) (2)VR
where/ig -molar gas flowrate to the reactor
VR liquid volume of the reactor
Yco, - mole fraction of CO2 in reactor headspace
Yco - mole fraction of CO2 in the feed gas
D dilution rate
CR concentration of CO2 and bicarbonate in the liquid phase of the reactorCF - concentration of CO2 and bicarbonate in the liquid feed
The first term on the right hand side represents the net inflow of CO2 between the
entering and exiting gas streams. The mole fractions of CO2 in gas streams were measured
with a gas analyzer containing an IR C0 2 sensor (Columbus Instruments, Columbus,
OH). To allow for more accurate determination of (YC0, - Yo, ) C 2 was omitted from
the feed gas (YC2 < 10 ppm).
The second term on the right hand side of equation 2 represents the net inflow of CO2
with the liquid streams. A 250 ml pre-mixing vessel was used to equilibrate the feed
liquid with air containing 12% CO2 in order to eliminate variation in the feed CO 2 levels
due to loss of CO2 from the feed bottle. The amount of CO2 in a particular liquid stream,
77

present mainly as dissolved CO2 and bicarbonate, was determined by measuring the
partial pressure of CO2 (Pc02) and the pH using a blood gas analyzer (Ciba Coming
Diagnostics, Medfield, MA). The partial pressure of CO2 is related to the dissolved CO2
concentration through Henry's law. The bicarbonate concentration can then be
determined by assuming the simplified equilibrium relationship
CO2 + H2O <HCO; + H +
which has an apparent equilibrium constant K = HC03 (Putnam and Roos, 1991).Cco
Thus measuring the partial pressure of CO2 and the pH allows the total dissolved carbon
dioxide plus bicarbonate concentration to be calculated from
CA = Cr + C 0 = H I+ j (3).C2 HCO3 H 1 IO-PH (3)
Based on the correlations presented by Schumpe et al. (1982), the Henry's law constant
for our serum free medium at 37 °C was estimated as Hco2 = 4.20 x 10⁶ Pa mol/l, which is
very close to the value (4.19 x 10⁶ Pa mol/1) for cerebrospinal fluid at 37°C and pH =
7.20 (Severinghaus, 1965). Since both the Henry's law and equilibrium constants are
functions of ionic strength, one would expect aqueous solutions with similar Henry's
constants to have similar equilibrium constants. Therefore we estimated the apparent
equilibrium constant as pK = =-log(K) )=6.138, which is the measured value for
cerebrospinal fluid at 37C and pH = 7.20 (Severinghaus, 1965).
3.5 Analytical Methods
3.5.1 Cell Number, Viability and Dry Cell Weight
Cell number and viability were determined using a hemacytometer and microscope after
staining the sample with trypan blue. Viable cells exclude the dye, while non-viable cells
have lost membrane integrity and are stained blue. Total cell number was also determined
using a Coulter electronic particle counter (Coulter Electronics, Hialeah, FL) after diluting
78
samples in an isotonic saline solution. Dry cell weight was determined by drying samples
in a vacuum drying oven. One hundred ml reactor samples were collected and centrifuged
at 250 x g for 10 minutes, and the supernatant was removed. The cells were washed
twice in phosphate buffered saline and centrifuged. After carefully removing the
supernatant, cells were suspended in purified water and transferred to dried, pre-weighed
aluminum weigh boats. Samples were dried to constant weights in a vacuum drying oven
set at 60 °C.
3.5.2 Sugar and Lactate Assays
Suspension culture samples were centrifuged at 200 ¥ g for 8 minutes to remove the cells,
and the supernatant was frozen at -200 C until ready for analysis. Three-hundred and
forty g1 of thawed sample was deproteinated before performing the lactate and sugar
assays by adding 100 gl of 20% m/v trichloroacetic acid. Two-hundred ,gl of
deproteinated sample was then neutralized with 50 gl of 25% m/v potassium bicarbonate.
Enzymatic glucose and lactate assays were performed according to the 16-UV and 826-
UV Sigma assay protocols (Sigma, St. Louis, MO), respectively. Enzymatic assays for
fructose and mannose were performed according to kit 139-106 from Boehringer
Mannheim (Indianapolis, IN). Galactose was measured using enzymatic kit 176-303
from Boehringer Mannheim. The amino sugar glucosamine was quantified using the
amino acid HPLC measurement protocol described below (the amino group of
glucosamine was derivitized along with the amino acids). The peak corresponding to
glucosamine was determined by running spiked samples. A linear calibration was
determined by running glucosamine standards.
3.5.3 Amino Acid Analysis
Samples for amino acid analysis were thawed and diluted between 1.5 and 3.5 times, so
that the maximum expected amino acid concentration was less than 1 mM (the upper limit
of calibration). The internal standards norvaline and sarcosine were added during dilution,
79

so that they were both present at a final concentration of 0.5 mM. Samples were then
deproteinated using Ultrafree-MC 5,000 MW cut-off ultrafilters (Millipore, Bedford,
MA). Amino acids were analyzed using the AminoQuant protocol on an HP 1090 HPLC
(Hewlett Packard, Palo Alto, CA). This protocol uses pre-column derivitization with
ortho-phthalaldehyde (OPA) for detection of primary amino acids and 9-fluorenylmethyl
choloroformate (FMOC) for detection of secondary amino acids (AminoQuant Series II
Operator's Handbook, Hewlett Packard part # 01090-90025). Separation was achieved
on a C 18 reverse phase column (Hewlett Packard, Palo Alto, CA).
3.5.4 Measuring Amino Acids in Peptides
Amino acids present in peptides can be quantified by first deproteinating the sample and
then acid hydrolyzing the peptides into individual amino acids. By measuring the free
amino acid concentration before and after hydrolysis, the amount of amino acids present
in peptides can be calculated:
Peptide amino acids = (post-hydrolysis amino acids) - (pre-hydrolysis amino acids)
The internal standards norvaline and sarcosine were added to samples so that their final
concentrations after hydrolysis and neutralization would be 0.5 mM. Samples were then
deproteinated using pre-rinsed Ultrafree-MC 5,000 MW cut-off ultrafilters (Millipore,
Bedford, MA). It was important to pre-rinse the filters with water before use, because
the filters contain extractable triethylene glycol that is present as a humectant. If this
triethylene glycol is not flushed from the membrane, then a brown precipitate will form
during the hydrolysis step. Following deproteination the samples were dried in
microcentrifuge tubes in a Speed-Vac (Savant Instruments, Farmingdale, NY).
Samples were hydrolyzed using constant boiling (6 N) hydrochloric acid according to the
method of Chiou and Wang (1989). Reusable Pyrex hydrolysis tubes as described in
Chiou and Wang (1988) were ordered from the Custom Glass Shop, which is a division of
the Kontes Glass Company (Vineland, NJ). Before each use the tubes were cleaned with
80
a 2:1 nitric to sulfuric acid mixture, and then rinsed with purified water and dried. The
deproteinated, dried reactor samples were dissolved in 6 N HCl (Pierce, Rockford, IL),
and then 200 gl of each reconstituted sample was added to separate hydrolysis tubes.
The tubes were purged of oxygen by alternately flowing nitrogen and pulling a vacuum for
15 second intervals over 2 minutes while gently agitating the tubes. The tubes were
sealed while nitrogen flowed over the openings. The samples were hydrolyzed
individually in a microwave at 80% of full power (approximately 1200 W) for 4 minutes
each. Four minutes was established as an appropriate time by hydrolyzing chicken egg
white lysozyme (Sigma, St. Louis, MO) for various times and comparing actual amino
acid recoveries to theoretical recovery based upon the amino acid sequence. Four minutes
provided good recovery for most amino acids, with less destruction of labile amino acids
such as serine and threonine (data not shown). Hydrolyzed samples were cooled in ice
water to condense volatilized HCl, and then 100 gl of sample was neutralized with 75 l
of 8 M NaOH and 25 ul of 0.4 N borate buffer. Amino acids were then analyzed using
the AminoQuant procedure described above. Each sample was hydrolyzed in
quadruplicate, with amino acid measurements for each hydrolysis in duplicate.
The hydrolysis procedure described above causes extensive degradation of tryptophan,
and glutamine and asparagine are deamidated to glutamate and aspartate, respectively. Of
these amino acids, glutamine and asparagine are important in terms of central carbon
metabolism. If peptide glutamate+glutamine (glx) or aspartate+asparagine (asx) are
consumed by the cells, then the consumption of each of these individual amino acids must
be estimated. For the experiments described here, there was no significant uptake of
glutamine or glutamate from peptides (i.e. glx measured in peptides was the same in the
feed and reactor samples within experimental error). Significant peptide asx uptake was
detected, however, and so the asx was assumed to be 48% asparagine and 52% aspartate,
based upon a measured amino acid composition for animal cell protein (Xie and Wang,
1994a).
81

3.5.5 Nucleotide and Nucleotide Sugar Analysis
Analysis of nucleotides and nucleotide sugars was performed based upon the methods of
Ryll and Wagner (1991). Cells were extracted using perchloric acid (PCA), and
neutralized extracts were analyzed with ion-pair reverse phase HPLC. Some
modifications in the ion-pair HPLC buffers and gradients were required to obtain adequate
separation of the desired nucleotides and nucleotide sugars.
3.5.5.1 Extraction of Cells
Approximately 5 x 10⁶ cells were removed from the reactor and immediately centrifuged
at 0°C and 190 x g for 3 minutes. After discarding the supernatant, 500 Al of ice-cold 0.5
M perchloric acid (Mallinckrodt, Paris, KY) was added and the sample was vortexed
vigorously. The sample placed on ice for 2 minutes before centrifuging at 40C and 10,000
x g for 3 minutes. The supernatant was placed on ice and the insoluble pellet was
extracted a second time with 500 ll of ice-cold 0.5 M PCA. Following another
centrifugation at 4°C and 10,000 x g for 3 minutes, the supernatants from the first and
second extractions were combined. Eight-hundred Al of the combined extract was then
neutralized with 200 Al of ice-cold 2.5 M KOH (Mallinckrodt) in 1.5 M K2HPO 4 (Sigma,
St. Louis, MO). After sitting on ice for 2 minutes, the neutralized sample was centrifuged
at 4°C and 10,000 x g for 3 minutes to remove the potassium perchlorate precipitate.
The supernatant was filtered using a 0.2 gm syringe filter (Acrodisc, Gelman Sciences,
Ann Arbor, MI), and the samples were stored at -70C prior to HPLC analysis.
3.5.5.2 Ion-Pair High Performance Liquid Chromatography
In order to obtain acceptable separation of the desired nucleotides and nucleotide sugars
from the cell extracts, we found it necessary to slightly modify the buffer pH's and
gradients reported by Ryll and Wagner (1991). Two separate analyses with different
buffer pH's and gradients were required to quantify all of the desired compounds. For
both analyses the buffer compositions were the same; buffer A was 100 mM potassium
82

phosphate buffer (Sigma) + 8 mM tetrabutylammonium hydrogen sulfate (Sigma), and
buffer B was 70% buffer A plus 30% methanol (EM Science, Gibbstown, NJ). Buffers
were prepared with HPLC grade water (EM Science) and were filtered (0.45 gnm
Durapore filter, Millipore, Bedford, MA) and degassed before use. Chromatography was
performed using an HP 1090 HPLC (Hewlett Packard, Palo Alto, CA). Separation was
achieved on a Supelcosil LC-18-T column (150 mm long x 4.6 mm inside diameter, 3 ugm
particle size) equipped with a guard column (Supelco, Bellefonte, PA). Sample detection
by a diode array detector was at 254 nm, referenced to the 390 nm wavelength.
Nucleotide sugars and all nucleoside phosphates except UTP and GTP could be resolved
using buffers A and B at pH = 6.0. Buffers were pH adjusted with 4 M phosphoric acid
(Sigma) and 4 M KOH (Mallinckrodt). The gradient used was 0% buffer B for 7 minutes
followed by a 0-40% buffer B linear gradient over 5 minutes, a 40-100% buffer B linear
gradient over 6 minutes, a hold at 100% buffer B for 5 minutes, a switch from 100-0%
buffer B in 1 minute and finally a hold at 0% B for 6 minutes to equilibrate the column for
the next sample. The flow rate was 1.5 ml/min, and the column temperature was
controlled at 400 C. Figure 3-1 shows a typical chromatogram for a 150 pl injection of
CHO cell perchloric acid extract analyzed using this method. Under these
chromatographic conditions UTP and GTP co-eluted, but these two nucleotides could be
resolved by switching to pH = 5.0 buffers. The nucleotide sugars UDP-glucose (UDP-
Glc) and GDP-mannose (GDP-Man) also co-eluted, as did UDP-N-acetylglucosamine
(UDP-GlcNAc) and UDP-N-acetylgalactosamine (UDP-GalNAc). These nucleotide
sugars co-eluted under all conditions tested with PCA cell extracts, and so the composite
UDP-Glc+GDP-Man and UDP-GNAc (UDP-GlcNAc+UDP-GalNAc) are reported here.
UDP-GlcNAc and UDP-GalNAc can be interconverted readily by UDP-GalNAc 4-
epimerase, and the two species were present at the equilibrium ratio in glucosamine fed
HeLa cells (Kornfeld and Ginsburg, 1966). Therefore, the composite UDP-GNAc is
expected to indicate relative UDP-GlcNAc abundance.
83

A aA
Nucleotide S
0
LA- - - - -- L
0.
--
ugars H
O <
-A -L ---
5i - - I I ' ' - i i i I
10Retention Time [min]
8 10
15
12
20
14
Retention Time [min]
Figure 3-1. Example chromatogram for a 150 I injection of CHO cell PCA
extract analyzed with pH=6.0 buffers. A. Entire chromatogram.
Detail of nucleotide sugar region.
84
Qu-250
200'
EE
150
100
50-n
0
+-1-'Z C
-IC
-50
nf%
15
< 10E
5
N
f_
Q I oB 0 0~3 Mal~~ ~ -c -~ I~
-- O .
0
:D
A A
A L¼1~~% \J ' \-/ N V~d\]
4 66
B.
- _
, , 1 TI
_ _ _
-----_ _ _ _-
rf frf
= . | ___ _ _- - - -- -V.-
-
-
I
,,~~~~~~~~~~~~~~~~~~~~~~~~~~~~~~~~~~~~~~~~~
1
I
a I I v I / I f. A I _
i
f
r__
'1v I

Switching buffers A and B to pH = 5.0 provided resolution between UTP and GTP, but
the retention times of UDP and GDP also shifted. When PCA cell extracts were
analyzed, the UDP and GDP peaks overlapped with nucleotide sugar peaks to such an
extent that they were difficult to quantify. For this reason samples were run with pH =
6.0 buffers to quantify all nucleotide sugars and nucleotides except for UTP and GTP. At
a pH of 5.0, it was possible to quantify UTP and GTP, and to obtain additional
measurements for ATP, ADP and CTP. The gradient used with pH = 50 buffers was a
0-25% buffer B linear gradient over the first 22.5 minutes followed by a 25-100% buffer
B linear gradient over 3.5 minutes, a hold at 100% buffer B for 6 minutes, a switch from
100-0% buffer B in 1 minute and finally a hold at 0% buffer B fo 7 minutes to
equilibrate the column for the next sample. The flow rate was 1.5 ml/min, and the column
temperature was set at 400 C. Figure 3-2 shows a typical chromatogram for a 150 l
injection of CHO cell PCA extract analyzed with pH 5.0 buffers.
Chromatogram peaks were identified by comparing retention times and by analyzing
samples spiked with standards (nucleotide and nucleotide sugar standards were obtained
from Sigma), and these results agreed with the elution order and peak designations
reported by Ryll and Wagner (1991). Integrated peak areas were used for quantification.
Peak areas were related to concentration via standard curves which were obtained by
running standards at concentrations between 100 and 10,000 pmol. Concentration was
linearly related to peak area over this range.
85

300-
250-
200+
= 150-
E 100-
50-
0-
-50
4 Q
0
A
NucleotideSugars
Z -A
4 8
I-- 0o <
12 16 24 28Retention Time [min]
15 18 21Retention Time [min]
Figure 3-2. Example chromatogram for a 150 J.l injection of CHO cell PCA
extract analyzed with pH = 5.0 buffers. A. Entire chromatogram. B.
Detail of UTP and GTP separation.
86
a-
- I--
HH)
20
I0L
11
1412108
E 6420
-212 24
I _ _s _ _ _ _
_ _ - -- - _ --- -
-
. . . . . . . . . . . . . . . . . . . . I· . . . . .I .. . I. I I I ' ' '

3.5.6 Determination of IFN-y Concentration
Gamma interferon concentrations were measured using a commercially available ELISA
kit (Endogen, Inc., Cambridge, MA). Prior to analysis, samples were diluted to less than
1 jgg/I IFN-y (the maximum standard concentration) in a 10 g/ solution of bovine serum
albumin in phosphate buffered saline (Pierce, Rockford, IL). It was important to include
BSA in the dilution buffer to avoid loss of IFN-y due to non-specific adsorption to tube
walls. The assay was performed according to the manufacturer's protocol.
3.5.7 Radiolabeled IFN-y Glycosylation Site Occupancy Analysis
Glycosylation site occupancy of labeled IFN-y in radioactive supernatants was
determined by immunoprecipitating the IFN-y, separating the glycoforms based on
molecular weight using gel electrophoresis, and then analyzing the dried gels using
autoradiography. Immunoprecipitation was carried out with 1.4 ml of labeled
supernatant added to 1 ml of IP reaction buffer (50 mM Tris-HCI pH=8.2, 5 mM EDTA,
5 mM EGTA). Thirty g1 of a 1:1 suspension of phosphate buffered saline:IgG antibody-
sepharose complex (Reselute-y affinity chromatography medium, Celltech Ltd., Slough,
UK) was added to each sample. Samples were incubated with agitation for at least 3
hours at 4°C. Following incubation the sample was centrifuged 1 minute at 200 x g, and
the pellet was washed twice with wash buffer I (0.5% nonidet P40, 50 mM Tris-HCI,
500 mM NaCI, 5 mM EDTA, I g/l bovine serum albumin, pH=8.0), twice with wash
buffer II (0.5% nonidet P40, 50 mM Tris-HCI, 5 mM EDTA, pH=8.0) and once with
water. Samples were eluted by boiling for 5 minutes in 60 gl of 2X non-reducing SDS-
PAGE sample buffer (125 mM Tris-HCl pH=6.8, 20% v/v glycerol, 4% w/v SDS,
0.0025% w/v bromophenol blue).
Five l of the eluted sample was used for scintillation counting (LS6500, Beckman
Instruments, Inc., Fullerton, CA) to determine the activity of precipitated interferon.
Equal amounts of radioactivity (10,000 to 15,000 dpm) were loaded per lane onto 12%
87

polyacrylamide gels for sodium dodecyl sulfate polyacrylamide gel electrophoresis (SDS-
PAGE) in the Bio-Rad Mini-Protean II electrophoresis system (Bio-Rad, Hercules, CA).
The gels were run at a constant voltage of 130 V until the bromophenol blue dye front had
migrated to the bottom of the gel (1.2 to 1.5 hours). Following electrophoresis the gels
were treated with Entensify autoradiography enhancer (DuPont NEN, Boston, MA) and
dried. The dried gels were either exposed to pre-flashed X-ray film (X-OMAT AR,
Eastman Kodak Co., Rochester, NY) or a phosphor screen (Molecular Dynamics,
Sunnyvale, CA). The amount of each glycoform was determined from films using
densitometry (Molecular Dynamics) or from phosphor screens using a PhosphorImager
(Molecular Dynamics).
3.5.8 Accumulated IFN-y Glycosylation Site Occupancy Analysis
Glycosylation site occupancy heterogeneity of total accumulated IFN-y was analyzed by
immunoprecipitating IFN-y from culture supernatants and analyzing the purified product
using micellar electrokinetic capillary chromatography (MECC). Following
immunoprecipitation, the IFN-y was directly eluted into the MECC running buffer. This
procedure provided more reproducible glycosylation site occupancy results than when
IFN-y was purified with affinity chromatography followed by a low pH (pH=2-3)
elution. Purifications that involved a low pH elution yielded non-reproducible fractions
of non-glycosylated protein (data not shown). Non-glycosylated gamma interferon is
known to unfold at low pH and aggregate in the presence of salts. This aggregation has
been suggested as the reason IFN-Y activity is unstable in an acid environment (Arakawa
and Hsu, 1987). Furthermore the Asn-25 glycan of glycosylated IFN-y has been shown
to play an important role in folding and dimerization (Sareneva et al., 1994). We
hypothesize that non-reproducible results obtained using low pH ci.ion may have been
due to aggregation of non-glycosylated IFN-y, while the glycans of glycosylated IFN-y
may have prevented or reduced aggregation loss.
88

3.5.8.1 Immunoprecipitation
Samples containing approximately 10 jgg of IFN-y (between 4 and 8 ml of chemostat
steady state samples) were filtered (0.22 gm Millex-GV, Millipore, Bedford, MA) and
mixed 2:1 with IP reaction buffer (50 mM tris-HCl, 5 mM EDTA, 5 mM EGTA, pH =
8.2). Thirty-five pgl of a 1:1 suspension of phosphate buffered saline:IgG antibody (anti-
IFN-y)~sepharose complex (Reselute-y, Celltech Ltd., Slough, UK) was added to each
sample. Samples were incubated at 4 °C with agitation overnight. Following incubation
samples were centrifuged for 1 minute at 200 x g, and the pellet was washed twice with
wash buffer I (0.5% nonidet P40, 50 mM tris-HCI, 500 mM NaCI, 5 mM EDTA, 1 g/l
bovine serum albumin, pH = 8.0), twice with wash buffer II (0.5% nonidet P40, 50 mM
tris-HCI, 5 mM EDTA, pH = 8.0) and once with water. Samples were eluted directly
into 35 g1 of filtered (0.45 gm Durapore filter, Millipore), degassed MECC running buffer
(20 mM sodium borate, 20 mM boric acid, 100 mM SDS, pH = 8.2). The samples were
incubated at room temperature for 5 minutes after adding the MECC running buffer, and
then vortexed, centrifuged for 1 minute at 200 x g and the supernatants transferred to 0.5
ml micro-centrifuge tubes for MECC analysis. All buffer components were from Sigma
(St. Louis, MO).
3.5.8.2 Micellar Electrokinetic Capillary Chromatography (MECC)
The immunoprecipitated IFN-y was analyzed using MECC based upon the method
described by James et al. (1994). An analytical capillary electrophoresis system (Model
270A, Applied Biosystems, Foster City, CA) was equipped with a 75 m inside
diameter x 70 cm long (50 cm to detector) neutral hydrophilic bonded silica capillary
(CElect P175, Supelco, Bellefonte, PA). New capillaries were conditioned by washing
with 0.1 M KOH (Mallinckrodt) for 10 minutes, followed by 1 hour of MECC running
buffer. Between each separation the capillary was rinsed with 0. 1 M KOH for 2 minutes
and then MECC running buffer for 5 minutes. Samples were vacuum injected over 3
seconds, and then a 17 kV voltage was applied to the capillary. The separation was
89

performed at 30 °C, and the detection wavelength was set to 200 nm. The separate peaks
for 2-site, 1-site and non-glycosylated IFN-y eluted within 25 minutes, with glycoform
migration time inversely related to extent of glycosylation. Chromatograms were
exported from the System Gold software used for data acquisition (Beckman Instruments,
Fullerton, CA) and were analyzed using the GS370 peak integration software (version
3.0, Hoefer Scientific Instruments, San Francisco, CA).
3.5.9 Quantitative Western Blot for BiP
3.5.9.1 Cell Lysis
Intracellular BiP concentrations were detennined by analyzing cell lysates with a
quantitative western blot. Cells were detergent lysed in a buffer containing 0.5% Triton
X-100, 150 mM NaCl, 10 mM Tris-HCl (pH = 8.0) and 0.025% sodium azide.
Immediately prior to use, protease inhibitors were added to the following final
concentrations: 2 mM EDTA, 100 mg/l PMSF, 1 gM pepstatin A and 10 mg/l aprotinin.
Protease inhibitors were added from 1 OOx concentrated stocks prepared in water (EDTA),
isopropanol (PMSF), methanol (pepstatin A) or phosphate buffered saline (aprotinin).
All buffer components were from Sigma. Approximately 1 ml of lysis buffer was used
per 1.25x10⁶ cells, which ensured efficient extraction (we were we were able to lyse up to
2x 10⁷ cells/ml without losing total protein extraction efficiency).
Anchorage dependent cells were lysed in T-flasks after removing the medium and washing
the cells twice with phosphate buffered saline (PBS). Ice cold lysis buffer was added and
the flask was incubated on ice for 30 minutes. Following the first incubation, the T-flask
was shaken vigorously to free residual cells from the walls and then incubated another 30
minutes on ice. The lysate was collected and centrifuged at 10,000 x g at 4°C for 10
minutes, and the clarified supernatant was stored at -200 C until ready for western blot
analysis. Suspension cells were lysed in a similar fashion after spinning the cells down at
200 x g for 7 minutes and removing the supernatant. Cells were washed in PBS,
90
centrifuged and then suspended in ice-cold lysis buffer. The suspension was vortexed and
placed on ice for 30 minutes before vortexing a second time. After another 15 to 30
minute incubation on ice, the lysate was collected and centrifuged at 10,000 x g at 40 C for
10 minutes, and the clarified supernatant was stored at -20°C.
3.5.9.2 Quantitative Western Blot
Lysates were prepared for western blot analysis by mixing them 1:1 with 2x SDS-PAGE
sample buffer (125 mM Tris-HCI pH=6.8, 80 mM dithiothreitol, 20% v/v glycerol, 4%
w/v SDS, 0.0025% w/v bromophenol blue) before heating the samples in boiling water for
5 minutes. BiP standards were prepared from recombinant hamster BiP produced in E.
coli (Stressgen, Victoria, BC, Canada). The standards were diluted in lysis buffer, mixed
1:1 with 2x SDS-PAGE sample buffer and heated in boiling water for 5 minutes. Four
standards were loaded on each gel at between 0.2 and 0.02 gg/lane to produce a standard
curve. Ten l1 of each sample was loaded per lane onto 12% polyacrylamide gels for
sodium dodecyl sulfate polyacrylamide gel electrophoresis (SDS-PAGE) in the Bio-Rad
Mini-Protean II electrophoresis system (Bio-Rad, Hercules, CA). The gels were run at a
constant voltage of 130 V for 1.25 hours.
Following electrophoresis, the gels were incubated in transfer buffer (25 mM tris base and
14.4 g/l glycine in a 20% methanol solution) at 4 °C for 15 minutes. Proteins were then
transferred from the gels onto nitrocellulose membranes in the Mini Trans-Blot
Electrophoretic Transfer Cell (Bio-Rad) set at a constant 100 V for 45-60 minutes.
Following the transfer, the membranes were rinsed in TBST, a tris buffered saline solution
containing the detergent Tween-20 (10 mM Tris-HC1, 150 mM NaCI, 0.05% Tween-20,
pH=8.0). The rinsed membranes were soaked two hours in a blocking buffer which
contained 5% non-fat dry milk in TBST to saturate the nitrocellulose non-specific protein
binding capacity. The blocked membranes were then rinsed 3x5 minutes in TBST before
adding the primary antibody solution (30 gl of rabbit-derived polyclonal anti-BiP
91

antibody solution (Stressgen) in 40 ml of 2% non-fat dry milk in TBST). After a one
hour incubation in the primary antibody solution, the membranes were again washed 3x5
minutes in TBST. The next step was a 1 hour incubation in the secondary antibody
solution (15 l of horseradish peroxidase conjugated goat anti-rabbit IgG antibody
solution (Bio-Rad) in 45 ml of 2% non-fat dry milk in TBST). In preparation for the
development step, the membranes were rinsed 3x5 minutes in TBS (TBST without
Tween-20). The membranes were developed using the Renaissance Enhanced
Chemiluminescence kit (DuPont NEN, Boston, MA), and the results were recorded by
exposing the membranes to pre-flashed X-ray film (X-OMAT AR, Eastman Kodak Co.,
Rochester, NY) for exposure times ranging from 5 seconds to 5 minutes. Films were
developed in a film processor (Eastman Kodak Co.), and the results were quantified using
a laser densitometer (Molecular Dynamics, Sunnyvale, CA). Standard curves were
prepared from the integrated band intensities of standards run on the same gel as the
unknowns.
3.5.10 Total Protein Assay
Total protein concentrations in cell lysates were determined using the Bio-Rad DC
Protein Assay (Bio-Rad, Hercules, CA). The DC Protein Assay is compatible with ionic
and non-ionic detergents, and therefore can be used with detergent-lysed cells. Bovine
gamma globulin (Bio-Rad) was used as a standard. The standard was prepared in the
same buffer used for cell lysis at the following concentrations: 0.1, 0.3, 0.5, 0.7 and 0.9
mg/ml. The assay was performed according to the instructions provided by the
manufacturer, and unknown protein concentrations were determined from a linear
standard curve.
92

3.6 Material Balancing for Intracellular Flux Analysis
3.6.1 Biochemical Network
The simplified biochemical reaction network considered here is depicted in Figure 3-3 and
listed in Table 3-1. The network includes the reactions of central carbon metabolism
which have been identified as important for producing biomass and energy (Bonarius et
al., 1996; Savinell and Palsson, 1992; Stryer, 1988; Xie and Wang, 1996b; Zupke and
Stephanopoulos, 1995). Groups of serial reactions were lumped into single reactions, and
only pathways carrying significant flux were included. Production of recombinant protein
represented less than 0.4% of biomass production, and so was neglected. Consumption
of network intermediates for biosynthesis was treated as described in Zupke and
Stephanopoulos (1995). The composition of CHO cells used for deriving the biomass
requirements was estimated from measured values for hybridoma cells (Xie and Wang,
1994a). The estimated biosynthesis demands are listed in Table 3-2.
In this simplified network, flux through the pentose phosphate pathway is estimated
from the biosynthetic demand for ribose-5-P in nucleotide synthesis. There is no
accounting for recycling in the pentose phosphate pathway (PPP). NADPH production
cannot unambiguously be used to calculate the pentose phosphate recycle because of
uncertain transhydrogenase activity linking NADH and NADPH, and the fact that the
malic enzyme can use either NAD + or NADP + as a cofactor (Eigenbrodt et al., 1985). In
this analysis we lump NADH and NADPH into a single NAD(P)H pool of reducing
power, and this NAD(P)H pool is related to both biomass synthesis and oxygen uptake.
Under these assumptions, recycle in the pentose phosphate pathway and recycle in the
citric acid (TCA) cycle are indistinguishable; in both cases 2 equivalents of reducing
power are generated per carbon dioxide evolved. The inability to distinguish between
TCA and PPP recycle makes networks incorporating PPP recycle and lumped NAD(P)H
effectively singular. Thus our estimate for the TCA cycle flux may be an overestimate
that also includes PPP recycle.
93

Figure 3-3. Schnematic diagram of a simplified biochemical reaction network
describing central carbon metabolism.
94
- -
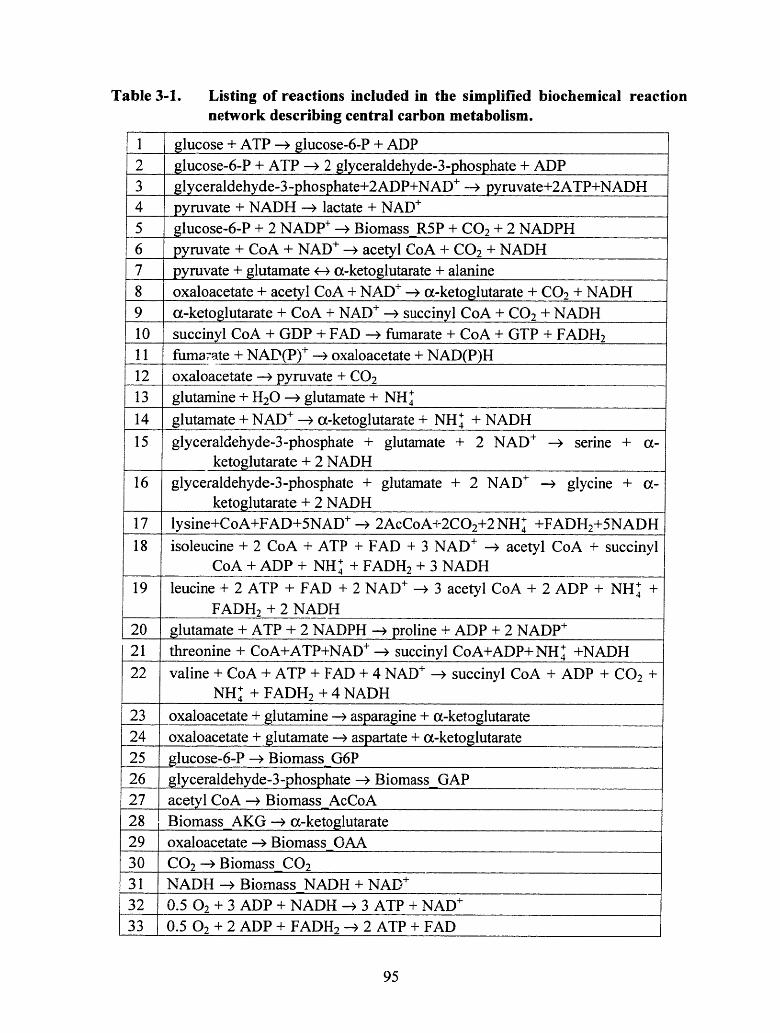
Listing of reactions included in the simplified biochemical reactionnetwork describing central carbon metabolism.
1 glucose + ATP --> glucose-6-P + ADP2 glucose-6-P + ATP ---> 2 glyceraldehyde-3-phosphate + ADP3 glyceraldehyde-3-phosphate+2ADP+NAD+ -> pyruvate+2ATP+NADH4 pyruvate + NADH - lactate + NAD+
5 glucose-6-P + 2 NADP+ - BiomassR5P + CO2 + 2 NADPH6 pyruvate + CoA + NAD+ - acetyl CoA + CO2 + NADH7 pyruvate + glutamate -4 a-ketoglutarate + alanine8 oxaloacetate + acetyl CoA + NAD+ -* a-ketoglutarate + CO2 + NADH9 a-ketoglutarate + CoA + NAD+ --> succinyl CoA + CO2 + NADH10 succinyl CoA + GDP + FAD ---> fumarate + CoA + GTP + FADH2
11 fima-ate + NAD(P)+ - oxaloacetate + NAD(P)H12 oxaloacetate -- > pyruvate + CO 2
13 glutamine + H2 0 --- glutamate + NH414 glutamate + NAD+ -> a-ketoglutarate + NH4 + NADH15 glyceraldehyde-3-phosphate + glutamate + 2 NAD+ --> serine + a-
ketoglutarate + 2 NADH16 glyceraldehyde-3-phosphate + glutamate + 2 NAD+ - glycine + a-
ketoglutarate + 2 NADH17 lysine+CoA+FAD+5NAD + -> 2AcCoA+2CO 2+2NH+ +FADH 2+5NADH
18 isoleucine + 2 CoA + ATP + FAD + 3 NAD+ --> acetyl CoA + succinylCoA + ADP + NH4 + FADH2 + 3 NADH
19 leucine + 2 ATP + FAD + 2 NAD+ --> 3 acetyl CoA + 2 ADP + NH +FADH 2 + 2 NADH
20 glutamate + ATP + 2 NADPH -- proline + ADP + 2 NADP+
21 threonine + CoA+ATP+NAD+ -> succinyl CoA+ADP+NH 4 +NADH
22 valine + CoA + ATP + FAD + 4 NAD+ - succinyl CoA + ADP + C0 2 +NH4 + FADH2 + 4 NADH
23 oxaloacetate + glutamine --> asparagine + a-ketoglutarate24 oxaloacetate + glutamate -- aspartate + a-ketoglutarate25 glucose-6-P - Biomass G6P26 glyceraldehyde-3-phosphate - Biomass GAP27 acetyl CoA -- Biomass AcCoA28 Biomass AKG -> a-ketoglutarate29 oxaloacetate -> Biomass OAA30 C02 - BiomassC0231 NADH --> Biomass NADH + NAD+
32 0.5 02 + 3 ADP + NADH - 3 ATP + NAD+
33 0.5 02 + 2 ADP + FADH2 - 2 ATP + FAD
95
Table 3-1.

Biomass synthesis requirements for central carbon metabolism
intermediates. Requirements (in mmol/gram dry cell weight) were
calculated as described in Zupke and Stephanopoulos (1995).
Positive values indicate the intermediate is consumed in biomass
synthesis. Amino acid requirements for protein synthesis were
accounted for separately.
Building Block Biomass Requirement (mmole/g DCW)
Acetyl CoA
Glutamine
Glutamate
Glucose-6-P
a-ketoglutarate
Oxaloacetate
Ribose-5-P
Glyceraldehyde-3-phosphate
ATP
NADH
NADPH
CO2
Table 3-2.
4.296
0.376
-0.022
0.248
-0.354
0.094
0.188
0.226
27.359
-0.346
5.911
-0.035
96

3.6.2 Calculation of Fluxes
Letting xi represent the flux (mmole/(g DCW*d)) of reaction i, ocij represent the
stoichiometric coefficient of metabolite j in reaction i and r represent the rate of
accumulation of metabolitej, a series of mass balances for each metabolite can be written
based upon the stoichiometry of the reactions presented in Table 3-1:
rj = o jxi (4)
The resulting set of material balance equations can be expressed in matrix notation as
Ax= r (5)
where A is the matrix of stoichiometric coefficients, x is the unknown vector of reaction
fluxes and r is the vector of metabolite production. The A matrix is determined by the
stoichiometry of the assumed biochemistry, and has dimensions of m x n, where m is the
number of metabolites in the network and n is the number of reactions. The metabolite
production vector, r, consists of the actual measured production rates for extracellular
metabolites, while production is assumed to be zero for intracellular metabolites based
upon the pseudo-steady-state (PSS) approximation. The PSS assumption is considered
reasonable, because the fluxes consuming and producing internal metabolites are much
larger than their expected maximum rates of concentration change (Zupke and
Stephanopoulos, 1995).
The unknown fluxes can be determined from equation (5) using simple matrix inversion if
A is square (m = n). In general A will not be square, since it is desirable to include
redundant information so that the consistency of the data and assumed biochemistry can
be analyzed. In this case m > n and the fluxes can be determined via the method of
weighted least squares (Strang, 1988):
x = (AT'lA)'lATr'flr (6)
where xv is the variance-covariance matrix of the measurement vector, r. Equation (6) can
be used to give reliable estimates for x assuming the matrix A is of full rank and is
reasonably well conditioned. A poorly conditioned matrix will be very sensitive to slight
97

changes in the measurements, and hence will not give reliable flux estimates. A measure of
this sensitivity is given by the condition number, c(A), defined as:
c(A) = IIA· IIA - 'II (7)
where II II indicates a matrix norm. c(A) serves as an upper bound to the relative error
magnification inherent in solving Ax=r. There are a number of ways for estimating the
norm of a matrix when calculating the condition number, but the 2-norm (also called the
spectral norm) provides the smallest upper bound on the potential error magnification
(Gerald and Wheatley, 1994). The 2-norm condition number can be calculated from the
singular value decomposition of A given that:
jlAl2 = Jlargest eigenvalue of ATA = largest singular value of A (8)
AIIAi2 = 1/4smallest eigenvalue of A A = 1/smallest singular value of A (9)
(Maron and Lopez, 1991). The system can be considered well posed if c(A) is small
(<100), while a large c(A) (>1000) indicates that sensitivity problems exist. As
mentioned above, our network including PPP recycle and lumped NAD(P)H is effectively
singular, because recycle in the PPP and TCA cycle are indistinguishable. The 2-norm
condition number for this network is 535,602, which indicates that reliable estimates of
PPP recycle are not possible. The modified network neglecting PPP recycle has a
condition number of 69.
3.6.3 Redundancy and Consistency
Redundant data are necessary for testing the consistency of measurements and assumed
biochemistry. A systematic method for analyzing data consistency was presented by
Romagnoli and Stephanopoulos (1981), and this approach has been applied to
fermentation data (Wang and Stephanopoulos, 1983) and flux analysis (Vallino and
Stephanopoulos, 1990; Zupke and Stephanopoulos, 1995). The method is based upon
statistical hypothesis testing to determine whether redundancies are satisfied to within
98

expected experimental error. The reader is referred to the original references for detailed
descriptions of the methodology; only a brief outline will be presented here.
The first step in the redundancy analysis is to extract the redundant equations from the
stoichiometry matrix, A, and then place these equations in the form
Er = (10)
where E is the matrix of redundant equations and r is the vector of metabolite
accumulation as defined above. Zupke and Stephanopoulos (1995) provide an illustration
of these manipulations. If the assumed stoichiometry is correct and the measurement rate
vector, r, contains no errors, then equation (10) will be satisfied exactly. In reality the
product Er will deviate from 0, and statistical hypothesis testing can be used to judge
whether the deviation can be attributed to expected random measurement error in r. The
hypothesis test is performed by calculating a consistency index, h, defined as
h = (11)
where
= -Er (12)
= ETxgE (13)
and Vr is the variance-covariance matrix of the measurements contained in r. Wang and
Stephanopoulos (1983) demonstrated that h follows a X2 distribution with the number of
redundant equations determining the degrees of freedom. h can be used to determine
whether the residuals of equation (10) deviate beyond their expected distribution around
zero for a specified significance (confidence level). If a given r fails the consistency check
(i.e. h > x2), then there is a (confidence level)% chance that either r contains gross
measurement errors or the assumed biochemistry is incorrect. With more than one
redundant measurement, suspect measurements can be identified by eliminating
measurements one at a time and recalculating h. If elimination of a particular measurement
dramatically decreases h, then it is likely that either the measurement is in error, or the
assumed biochemical pathways involving the particular metabolite are incorrect.
99

I
I

4. IFN-y Glycosylation Site Occupancy in Batch and Fed-Batch
Cultures
Determining how cell culture parameters influence glycosylation site occupancy in batch
and fed-batch cultures requires a sensitive assay for measuring changes in glycosylation.
Typically, glycosylation of the accumulated product is analyzed by techniques such as
western blot, silver stain or capillary electrophoresis. Because the environment is
continually changing in batch and fed-batch cultures, the secreted product which
accumulates in the media is the combined product from cells growing under a range of
different conditions. To determine how culture conditions at a specific instant are
influencing glycosylation, it is necessary to consider only the product being produced at
that instant. For sufficiently large changes in glycosylation, it is possible to determine
instantaneous glycosylation characteristics by differentiating accumulated product data.
However, differentiation of data tends to magnify experimental errors, and accurately
determining differential glycosylation requires large changes in the accumulated product.
Furthermore, differentiation can be problematic for late times in a batch culture, when
even large changes in the freshly secreted product will have little impact on the
accumulated product.
This chapter presents an alternative method for monitoring glycosylation site occupancy
heterogeneity with time in batch and fed-batch cultures. A sensitive radiolabeling assay
was used to analyze product made during defined time intervals. Product glycosylation
was determined by pulsing culture samples with 35S labeled methionine for three to five
hours and then collecting the supernatant. The product was immunoprecipitated from the
supernatant and the glycoforms were separated by SDS-PAGE. The various glycoforms
were then detected and quantified by autoradiography. By analyzing only the radioactive
product, differential glycosylation data was collected directly. This technique was
101

applied to analyze glycosylation site occupancy of recombinant gamma iterferon (IFN-
y) produced at various times during batch and fed-batch cultures of Chinese hamster
ovary (CHO) cells.
4.1 Glycosylation Site Occupancy Monitoring with Radiolabeling
In order to obtain accurate "snap-shots" of secreted product glycosylation site
occupancy, it was necessary to develop a method for selectively analyzing proteins
synthesized during defined time intervals. A protocol was developed which aiiowed site
occupancy to be determined for proteins produced during three hour labeling periods.
The method was designed to introduce minimal disturbances so that the analyzed product
would accurately reflect glycosylation in an undisturbed culture. By adding pulses of a
radioactive amino acid, very small quantities of labeled protein could be analyzed while
introducing a minimal disturbance. Applying this method to analysis of glycosylation
required the determination of appropriate labeling conditions, including which radioactive
amino acid to use, how much to use and what labeling protocol to follow.
The most commonly used radioactive amino acid for labeling proteins is [35 S]methionine
(Harlow and Lane, 1988). The 35S isotope is generally preferred over 3H and 14C because
it is easier to detect. Furthermore, 35S has a much shorter half-life and therefore the
radioactive waste decays more rapidly. The model protein for this study, IFN-y, has
three or four methionine residues, depending upon carboxy-terminal proteolytic
processing. Since IFN-y does not have any cysteine residues, [35 S]cysteine is not an
appropriate label. Thus [35S]methionine was chosen as the radiolabeled amino acid for
this work.
It is desirable to minimize the radiolabeling period so that the labeling time is essentially
differential when compared to the total culture time. On the other hand, the labeling must
be long enough so that detectable quantities of protein are produced at a steady state
102

t ^O/OU70 -
70%-
60%-
50%-
40%-
30%-
20%'
10%
0%-0.0 0.5 1.0
I .0 2.52.0 2.5
Time After [ 3 5 S]Methionine Pulse [h]
Figure 4-1. Glycoform distribution of radiolabeled IFN-y secreted during the
chase period following a pulse of 35S labeled methionine.
glycoform distribution. The steady state criteria becomes important if the various
glycoforms are synthesized or secreted at different rates. In order to determine the
secretion kinetics of IFN-y glycoforms, a pulse-chase experiment was performed. Cells
growing in low-serum (0.75% dialyzed fetal bovine serum), suspension culture were
placed in methionine-free media for 30 minutes before adding a pulse of [35 S]methionine at
0.1 mCi/ml. Following a 30 minute exposure to the labeled amino acid, the cells were
transferred to chase media containing excess (0.1 mM) non-labeled ("cold") methionine.
The glycoform distribution of secreted product was analyzed with time beginning 30
minutes after initiating the labeling pulse, and the results are presented in Figure 4-1.
103
03 LL
_ -
(5
2-site glycosylated
1-site glycosylated
O-site glycosylatei
,, I I , I X X X , 1 ',
L
I
3.5.I
3.0
n _ A 6P
`E19 ------ rN---c~A
--- -' ' ' ' ' 1l- 7
i

While the percentage of secreted IFN-y which was non-glycosylated was rather constant
with time, the fraction of one-site glycosylated IFN-y decreased with time as more two-
site glycosylated protein was secreted. Two hours after the [3 S]methionine pulse (1.5
hours after initiating the chase) the secreted product was approaching its final glycoform
distribution.
The most likely explanation for the observed pulse-chase behavior is post-transiational
glycosylation of one-site glycosylated protein in the endoplasmic reticulum. Pulse-chase
radiolabeling studies with insect cells producing recombinant IFN-y indicated that the
Asn-25 glycans are added co-translationally, while core glycosylation at Asn-97 occurs
largely post-translationally (Sareneva et al., 1994). Virtually all of the one-site
glycosylated IFN-y is glycosylated at only Asn-25 (James et al., 1995), which suggests
that non-glycosylated IFN-y is a poor substrate for post-translational glycosylation.
This explains why non-glycosylated IFN-y does not vary with time during the pulse-
chase experiment, while one-site glycosylated protein is apparently converted to two-site
glycosylated protein with time during the chase. As was mentioned in the Literature
Review, glycosylation at Asn-25 may be critical for post-translational glycosylation at
Asn-97, because the glycans at Asn-25 should promote interaction of IFN-y with
calnexin, a membrane-bound lectin chaperone. Calnexin-complexed proteins are kept in
close proximity to the ER membrane, which might facilitate gpst translational
glycosylation by the membrane-bound oligosaccharyltransferase. Interferon secreted
early in the chase period is less likely to be post-translationally glycosylated, because the
protein spent less time in the vicinity of the oligosaccharyltransferase. Since the rate-
limiting step for secretion of most proteins is transport from the endoplasmic reticulum
to the Golgi (Dorner et al., 1993; Lodish et al., 1983), proteins which are secreted late in
the chase period are expected to have spent more time in the ER. Post-translational
glycosylation thus explains all of the observed pulse-chase behavior.
104

The pulse-chase experiment illustrated the importance of waiting for a steady state
glycoform distribution when pulsing [35S]methionine to determine differential secreted
product glycosylation. Another consideration when monitoring batch cultures is that the
labeling procedure must introduce a minimal perturbation, and so medium changes should
be avoided. To determine whether sufficient labeled protein could be produced when the
radiolabel is added directly to batch samples, a pulse labeling experiment was performed
by adding [35 S]methionine to medium containing 0.1 mM cold methionine. The
experiment was also designed to determine the time required to reach steady state labeling
with a radiation pulse (no chase). A pulse of [35S]methionine at 0.06 mCi/ml was added
to y-CHO cells growing in low-serum (0.75% dFBS), suspension culture, and samples
were collected with time (Figure 4-2). Detectable quantities of labeled proteins were
produced, although in future experiments the activity of [3 5S]methionine was increased to
reduce film development time. Figure 4-2 illustrates that steady state labeling was
achieved within 3 to 5 hours. Significant changes in glycosylation were not observed
between 3 and 19 hours.
Based upon the pulse-chase and pulse experiments described above, a radiolabeling
protocol was developed for monitoring glycosylation at various times during batch
culture. A schematic overview of the technique is presented in Figure 4-3. A 3 ml sample
is removed from the culture being analyzed and placed into a shake flask along with a
small quantity of [35S]methionine. Typically 0.5 to 1.0 mCi of [3 5S]methionine was
added per 3 ml sample. The radiolabel was added from less than 35 gl of an aqueous
[35 S]methionine stock which had an activity of 1110 Ci/mmol. Therefore less than 0.3
gM of [3 5 S]methionine was added per radiolabel, which amounts to less than 0.3% of the
methionine concentration found in RPMI-1640. The minimal changes in methionine
concentration and culture volume are expected to have no significant impact on the cell
culture environment. The sample is next incubated for 3-5 hours under the same
conditions as the parent culture. Following the incubation, the product is
immunoprecipitated from the supernatant and the glycoforms are separated by SDS-
105

PAGE. The various glycoforms are then detected and quantified by autoradiography.
This radiolabeling technique was applied to the analysis of glycosylation site occupancy
in batch and fed-batch cultures.
80%
0"-Z
i- L
00O0M .(A 2o L_ _
70% -
60%
50%
30%
20%-
10%
0 55 1515 20
Time After [ 35 S]Methionine Pulse [h]
Figure 4-2. Glycoform distribution of radiolabeled IFN-y secreted following a
step pulse of 35S labeled methionine into medium containing 0.1 mM
of non-labeled methionine.
106
..2r~---- -sit-·- gLy l
2-site glycosylated
1-site glycosylated
O-site glycosylated
I · · · · _ · · _ · · 1 T_ · I_· 1 _ ·
10

3 ml sample35S] Methionine
)-I
Incubate 3 hours
Immunoprecipitate
SDS-PAGE andAutoradiography
13 -l4e 0gyc os lycal d
o...I r . *-g. ..t..
Glucosamin Conctraton (mM]
Figure 4-3.
4
Densitometry
Overview of the pulse radiolabeling technique for monitoring
differential product glycosylation site occupancy.
107
0
§ 8 v'S
. I i so,i°e o
.s2
1 0
t

4.2 Batch Culture Glycosylation Site Occupancy
Recombinant IFN-y glycosylation site occupancy was monitored in low-serum (0.75%
dFBS) batch culture of y-CHO cells. The suspension batch was performed in a 500 ml
spinner flask, and samples were taken every eight hours. At each sample time, a three ml
aliquot was removed for radiolabeling with [35 S]methionine and a second sample was
collected for analysis of intracellular proteins. Figure 4-4 shows the cell growth during
the batch culture. The cells grew exponentially for the first 80-90 hours, and then cell
growth ceased. Shortly thereafter cell death initiated. Figure 4-5 shows that by the very
end of the batch, glucose was depleted and the cells had begun to consume lactate.
(n
.0
E
z00
1.4x10⁶
1.2x10⁶
1.0x10⁶
8.0x1 05
6.0x1 05
4.0x1 05
2.0x1 05
O.Oxl 0,0 20 40 60 80 100 120 140 160 180
Culture Time [h]
Figure 4-4. Viable and total y-CHO cell numbers during batch suspension
culture in low-serum medium.
108

The glycosylation site occupancy of product secreted at different times during the batch
was determined from radiolabeled samples, and the results are plotted in Figure 4-6. The
relative secretion of two-site glycosylated product gradually decreased during the
exponential growth phase (from 69% down to 55%), while the relative proportions of
one-site and non-glycosylated product increased (from 23% to 31% and from 8% to 14%,
respectively). This trend is similar to the decreases in IFN-y glycosylation observed
during batch culture of a different CHO cell line by Jenkins and co-workers (Curling et al.,
.4 t-%I0
14
E
Cr0._
CI
a)
C0
12
10
8
6
4
2
00 20 40 60 80 100 120 140 160 180
Culture Time [h]
Figure 4-5. Glucose consumption and lactate production during low-serum batch
culture of y-CHO cells.
109

1990; Jenkins et al., 1994), except that the changes we observed were less pronounced.
At the conclusion of exponential growth, the IFN-y being secreted abruptly changed
within 15 hours back to 69% two-site, 23% one-site and 8% non-glycosylated. A similar
shift in glycosylation was not detected by Jenkins and co-workers, most likely because
they were analyzing accumulated product via silver staining. The differential radiolabeling
technique allows this shift to be detected, even though changes in accumulated IFN-y
would have been very subtle. By the end of the batch when glucose was essentially used
up, glycosylation fell quickly to 50% two-site, 27% one-site and 23% non-glycosylated
protein.
nnO/O)70o
C03
,- OL
L
.0u ._
h..
70%
60%
50%
40%
30%
20%
10%
0%0 20 40 60 80 100 120 140 160 180
Culture Time [hi
Figure 4-6. Differentially produced IFN-y glycosylation site occupancy
monitored with pulse radiolabeling in low-serum batch culture of y-
CHO cells.
110

4 AI.'L
0 1.2.,
1.0'
-00-
CO
E 0.2
= 0 .-oI 0.0
_0 -0.2--0 2..2 I,,, I' I',, I''' I''' I,,, I,, I ' l 0 20 40 60 80 100 120 140 160 180
Culture Time [h]
Figure 4-7. Specific glucose consumption rate in low-serum batch culture of y-
CHO cells.
The reason for the decline in glycosylation during exponential growth is not clear. The
specific glucose consumption rate also declines during exponential growth (see Figure 4-
7), which at first glance tends to implicate sugar metabolism. However, Curling et al.
(1990) found that a similar decline in site occupancy was observed even when glucose
was maintained above 6 mM. It is possible that glucose metabolism shifts during
exponential growth independent of external glucose concentration. In this hypothesis
central carbon metabolism may be shifting and causing the decline in glycosylation. The
fed-batch experiments described in this chapter and experiments described in Chapters 5
and 6 explore this hypothesis in more detail. The rapid increase in glycosylation at the
111
I

onset of the stationary phase could be related to changes in central carbon metabolism as
biosynthesis is shut down. Alternatively, reduced biosynthesis may simply decrease the
consumption of oligosaccharides for cellular glycoproteins, leading to increased precursor
availability for IFN-.
If sugar availability were to severely limit glycosylation, then the cells would be expected
to respond by inducing synthesis of glucose regulated proteins such as GRP78 (BiP)
(Beckmann et al., 1990; Sciandra and Subjeck, 1983). BiP synthesis is induced under
conditions such as glucose starvation that lead to severe underglycosylation of proteins
(see Chapters 2 and 7). Cell lysates from the batch culture were analyzed using
quantitative western blots to determine BiP concentration, and the results are shown in
Figure 4-8. The results are normalized, because absolute BiP concentrations varied
depending upon which antibody was used for detection. A polyclonal primary antibody
yielded an initial BiP concentration of -2-3% of total cellular protein, while a monoclonal
antibody western blot indicated that BiP constituted -7% of total protein. Both
estimates seem high, and so normalized results are presented here. Figure 4-8 shows that
BiP levels remained relatively constant during exponential growth. Glucose regulated
protein synthesis was not induced by the gradual decline in glycosylation during
exponential growth. In contrast, BiP synthesis was induced more than 2 fold at the end
of the batch when glycosylation efficiency had declined to low levels and glucose was
essentially depleted. The final decline in glycosylation is typical of glucose starvation.
112

2
2c.
'- 1
N0coL0
OZ
0 20 40 60 80 100 120 140 160 180
Culture Time [h]
Figure 4-8. Normalized intracellular concentration of the molecular chaperone
BiP during low-serum batch culture of y-CHO cells.
4.3 Fed-Batch Culture Glycosylation Site Occupancy
If changes in glucose metabolism were responsible for the gradual decline in glycosylation
observed during batch exponential growth, then improving the consistency of metabolism
would be expected to improve glycosylation consistency. A stoichiometric fed-batch
technique was recently proposed for improving the consistency of animal cell metabolism
(Xie et al., 1997; Xie and Wang, 1994a; Xie and Wang, 1994b; Xie and Wang, 1994c).
Nutrients such as glucose and amino acids are maintained at low levels and fed based upon
113
calculated stoichiometric demand. In this manner by-product formation is reduced and
the nutritional environment is maintained relatively constant. This fed-batch technique
was applied to the y-CHO cell line and glycosylation was monitored with radiolabeling to
determine whether consistent glycosylation could be obtained by maintaining a consistent
nutritional environment.
4.3.1 Transient Starvation Impacts Glycosylation
A fed-batch, suspension culture was performed in a spinner flask using a
stoichiometrically designed initial medium as described in Materials and Methods. The
medium was serum-free, but contained the aninal tissue hydrolysate Primatone RL at 2
g/l. Cell counts and feeding were performed manually every 12 hours. The maximum
viable cell density in the fed-batch culture was 5.0 x 10⁶ cells/ml as compared to 2.4 x 10⁶
cells/ml in a control batch culture (Figure 4-9). Based upon the stoichiometric feeding
strategy, glucose was maintained at low concentration in the fed-batch culture to reduce
lactate formation (Xie and Wang, 1996a). Figure 4-10 illustrates that glucose was indeed
maintained at low levels, and lactate formation was reduced compared to batch culture
(specific lactate production in the fed batch was 0.024 nnole/109 cells/h versus 0.15
mmole/109 cells/h in the batch). The stoichiometric feeding strategy is also designed to
maintain low concentrations of amino acids such as glutamine to limit amino acid
metabolism and ammonia production (Xie and Wang, 1996a). The stoichiometric feeding
was not perfect, however, which led to accumulation of amino acids such as glutamine
(Figure 4-11). Overfeeding of amino acids may have been caused by not accounting for
the amino acids supplied by Primatone RL.
Glycosylation was monitored periodically during the course of the experiment using
[35S]methionine radiolabeling. The serum-free batch culture had glycosylation
characteristics similar to the low-serum batch culture described previously. Figure 4-12
shows that glycosylation site occupancy in the batch culture declined during the
114

69
E
0co
01-
*-0a)
.a)
5-
4-
3-
2-
1-
0-0 50 100 150 200 250
Culture Time [h]
Figure 4-9. Viable -CHO cell densities in batch and fed-batch serum-free,
suspension cultures.
115
Fed-batch
L-
- - - - - c --
II
__^ A. .
I I I . I I I I I I I . I . I I . I . I I I I .

2Ad
C 10
c 1
oC~
0 50 100 150 200 250
Culture Time [h]
Figure 4-10. Glucose concentration and lactate production during batch and
fed-batch serum-free cultures of y-CHO cells.
116
nC9

4 FA
E
Iim0co
c-00CM
0 50 100 150 200
Culture Time [h]
Figure 4-11. Glutamine concentration and ammonia accumulation during fed-
batch serum-free culture of y-CHO cells.
117
250
I

-- QOfiO/ ; OU /0-0
0._*. U 60%-E-
> 40/0 -O0
_ _ 20%-m O -
0 20 40 60 80 100 120 140
Cultivation Time [hours]
Figure 4-12. Differentially produced IFN-y glycosylation site occupancy
monitored with pulse radiolabeling in batch serum-free
culture of y-CHO cells.
118
2-site glycosylated
1-site glycosylated
Non-glycosylated
I ' E I I I I I ' I I ' I I I I I I I I I I

exponential growth phase before increasing again at the onset of the stationary phase.
The results demonstrate that similar behavior is observed in batch culture with serum-free
and low-serum media.
The fed-batch culture was also monitored with radiolabeling, and the results are presented
in Table 4-1. The wide variations in glycosylation site occupancy from sample to sample
illustrate that periodic feeding impacted glycosylation. Several of the radiolabeling
samples were taken just prior to the periodic feeding time, and so variations in
glycosylation are apparently the result of transient starvation between feedings. The
most likely components to limit glycosylation are glucose and glutamine (glutamine is
Table 4-1.
Timea [h]
23.8
48.5
73.0
94.5
97.8
122.5
165.5
188.5
Differentially produced IFN-y glycosylation site occupancy
monitored with pulse radiolabeling in fed-batch serum-free culture
of y-CHO cells: the impact of periodic feeding.
Glucoseb [mM]
3.1
0.6
0.2
0.7
3.3
3.3
0.9
3.0
0-site [%]
5.3
38
68
67
5.8
8.2
64
73
1-site [%]
27
27
19
21
36
35
26
21
2-site [%]
68
35
13
12
58
57
10
5.8
aCulture time when a 3 mL sample was withdrawn and pulsed with [35 S]methionine.
bEstimated glucose concentration at the beginning of the 3 hour pulse radiolabeling assay.
119
--
_ __
required for amino sugar formation as discussed in Chapter 2). Since glutamine was in
excess throughout the culture (Figure 4-11), glycosylation patterns were presumably
influenced by changes in glucose concentration. Table 4-1 lists the estimated glucose
concentration at the beginning of each radiolabeling period. It shouldbe kept in mind that
the labeling lasted three hours, and so the glucose concentration continually decreased
during the assay based upon the viable cell density of the sample. When the glucose
concentration at the beginning of the radiolabel was low (below -1 mM), glycosylation
site occupancy was extremely poor. It is interesting to note that glycosylation at 23.8
hours was identical in the fed-batch and batch cultures, despite the fact that the glucose
concentrations were approximately 3.1 mM and 20 mM, respectively. Glycosylation
could be maintained over wide variations in glucose concentration, as long as the cultures
were not starved. The influence of starvation between periodic feedings is most clearly
illustrated by comparing results from the 94.5 h and 97.8 h sample times (Table 4-1). At
94.5 h glucose had dropped to 0.7 mM, and glycosylation site occupancy was extremely
low (67% of the IFN-y being secreted was non-glycosylated). By the 97.8 h sample
time, which was taken only 20 minutes after feeding had elevated the glucose
concentration to more than 4 mM, glycosylation had fully recovered. The results
demonstrate that the effects of short term starvation were rapidly reversible, which agrees
with previous studies of glycosylation and glucose starvation (Gershman and Robbins,
1981; Turco, 1980).
4.3.2 Glycosylation During Non-Starved Fed-Batch Intervals
The fed-batch experiment described above illustrated that transient starvation due to
manual periodic feeding negatively impacted glycosylation. However, the extent to which
glycosylation varied during non-starved periods was not clear. Another set of fed-batch
experiments were performed to answer this question. In these experiments, glycosylation
site occupancy was monitored with [35 S]methionine radiolabeling at the mid-point
between feedings so that periods of transient starvation would be avoided. Experiments
120

6x1
E
0
2x10.)
Ox1i
100
30
I >1-
._
._30.)0'
)OC
0 50 100 150 200 250
Culture Time [h]
Figure 4-13. Cell growth in serum-free fed-batch cultures of y-CHO cells
transfected with the Bcl-2 anti-death gene and control transfected
y-CHO cells.
were performed in serum-free, suspension culture with y-CHO cells which had been
transfected with the anti-apoptosis gene Bcl-2 and control cells transfected with a similar
plasmid without the Bcl-2 gene (Goswami et al., 1998). The fed-batch was performed
using the stoichiometric fed-batch technique with a modified RPMI-SFM initial medium
as described in Materials and Methods (Chapter 3).
The cell growth of the Bcl-2 transfected and control transfected y-CHO cells was very
similar (Figure 4-13). The viable cell densities in both fed-batches exceeded 4.2 x 10⁶
cells/nil, although severe clumping at densities above 4.0 x 10⁶ cells/ml precluded accurate
121

determination of the time of growth cessation and the final cell numbers. Dry cell weight
measurements indicated that significant numbers of cells were adhered to the flask walls
and were in clumps too large to be counted with a hemacytometer. The viability of the
Bcl-2 transfected cells was consistently higher than the control cells, and this difference
became especially apparent at the end of the fed-batch. The Bcl-2 transfected cells
maintained a higher viability because they underwent less apoptosis (Goswami et al.,
1998).
Figure 4-14 shows that glycosylation site occupancy of secreted IFN-y was identical for
the two cell lines. The remarkable agreement demonstrates the reproducibility of the
[35S]methionine radiolabeling technique for monitoring instantaneous glycosylation site
occupancy. Furthermore, by labeling at the mid-point between feedings, periods of
transient starvation were avoided. The changes in glycosylation with time were very
reminiscent of the changes observed during batch culture. Site occupancy continually
declined during the exponential growth period, before improving during the stationary
phase. Glycosylation declined slightly at the onset of massive cell death. Although the
cause of cell death was not clear in these experiments (nutrients such as glucose and amino
acids were not limiting), excessive osmolality was believed to be partially responsible.
The similar changes observed in glycosylation site occupancy in batch and fed-batch
cultures indicate that controlling glucose and amino acid concentrations was not sufficient
to maintain consistent glycosylation. Although periodic feeding in the fed-batches led to
some fluctuations in nutrient concentrations, the changes were much smaller than changes
in batch culture. Alterations in glycosylation site occupancy could not be correlated with
nutrient variations, except during periods of extreme starvation. The decline in
glycosylation with time during exponential growth appears to be unrelated to external
glucose and amino acid concentrations. The fed-batch experiments could not rule out the
possibility that other factors such as growth factors may influence central carbon
metabolism with time. Changes in culture environment could have altered carbon
122

100 150
Cut.lture Time [h]
Figure 4-14. Differentially produced IFN-y glycosylation site occupancy
monitored with pulse radiolabeling in fed-batch culture of y-
CHO cells transfected with the Bcl-2 anti-death gene and
control transfected y-CHO cells. Glycosylation was monitored
between feeding times with four hour pulses of radioactive
methionine.
metabolism and hence the intracellular availability of activated sugar precursors. Chapter
5 examines the relationship between central carbon metabolism and glycosylation in more
detail. The influence that central carbon metabolism has on glycosylation during
exponential growth is then revisited in Chapter 6.
123
Ano0/UV /0 -
80%
70%
60%
5O%
40 %
30%'
20%
1 OO/oOtt
0
C0
, ZC3'
E- _ O>._
So
ca %
< '-
CI0
2-site glycosylated
1-site glycosylated
0-site glycosylatedE3_0- 0
50 200 250
|
. . . . . . . . ... .., , , . II I


5. Central Carbon Metabolism and Glycosylation: Continuous
Culture Experiments
To investigate the relationship between central carbon metabolism and glycosylation site
occupancy, we studied the glycosylation of recombinant human interferon-y (IFN-y)
produced in continuous culture (chemostat) experiments. Chemostat experiments were
the preferred method for studying metabolic effects on glycosylation, because the
accuracy of metabolite rate measurements is improved, and cell physiology can be studied
under well-defined, steady state conditions. Intracellular nucleotide sugar levels and IFN-
y glycosylation were measured at different steady states, which were characterized by
central carbon metabolic fluxes estimated by material balances and extracellular metabolite
rate measurements.
Glycosylation site occupancy of IFN-y produced in glucose and glutamine limited
chemostat cultures was found to correlate with intracellular nucleotide sugar
concentrations. From data obtained in glucose limited chemostats, we found that
glycosylation site occupancy also correlated with TCA cycle activity but not glycolytic
activity. Since the TCA cycle would be expected to influence precursors for nucleoside
triphosphate synthesis, these findings led to the hypothesis that site occupancy was
limited by nucleotide sugar formation, which was influenced primarily by nucleoside
triphosphate availability. A glutamine limited chemostat illustrated that amino sugar
formation can also limit the formation of the nucleotide sugar UDP-N-acetylglucosamine.
Nucleotide and nucleotide sugar measurements from chemostat, batch and fed-batch
experiments confirmed that the primary determinants of UDP-sugar concentrations during
exponential growth are UTP levels and amino sugar formation. The chemostat
experiments demonstrated that during periods of glucose or glutamine starvation,
nucleotide sugar availability can limit glycosylation site occupancy.
125
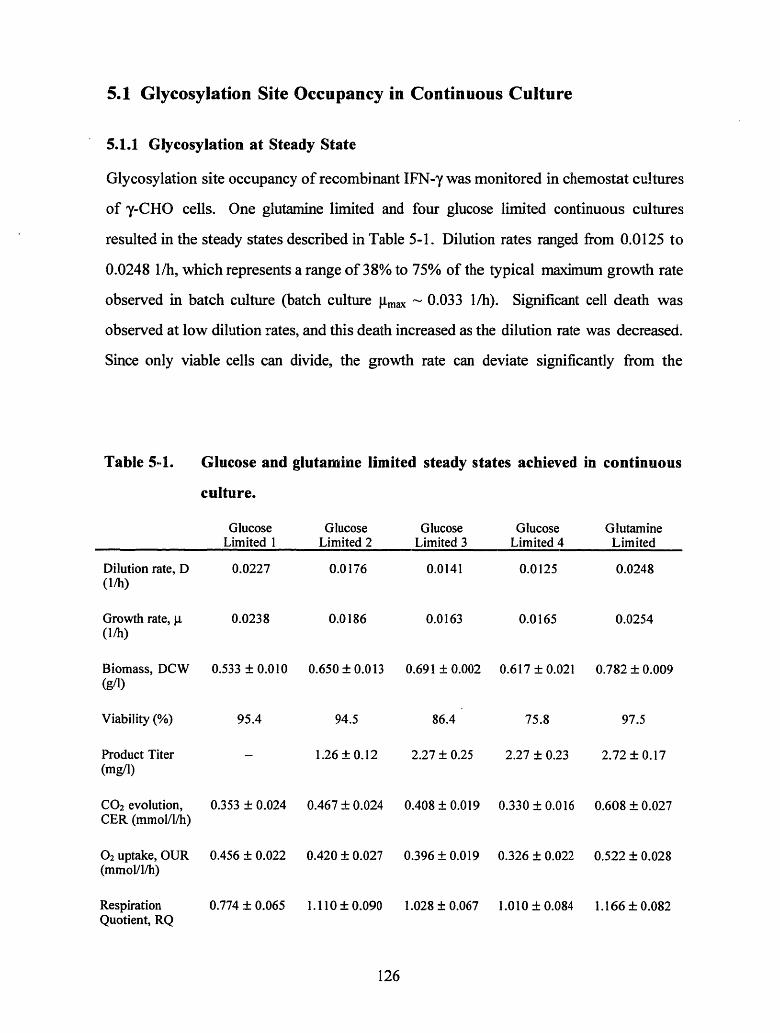
5.1 Glycosylation Site Occupancy in Continuous Culture
5.1.1 Glycosylation at Steady State
Glycosylation site occupancy of recombinant IFN-y was monitored in chemostat cultures
of y-CHO cells. One glutamine limited and four glucose limited continuous cultures
resulted in the steady states described in Table 5-1. Dilution rates ranged from 0.0125 to
0.0248 1/h, which represents a range of 38% to 75% of the typical maximum growth rate
observed in batch culture (batch culture max - 0.033 /h). Significant cell death was
observed at low dilution rates, and this death increased as the dilution rate was decreased.
Since only viable cells can divide, the growth rate can deviate significantly from the
Glucose and
culture.
glutamine limited steady states achieved in continuous
Dilution rate, D(1/h)
Growth rate, g(1/h)
Biomass, DCW(g/l)
Viability (%)
0.533 ± 0.010
95.4
0.650 ± 0.013
94.5
0.691 ± 0.002
86.4
0.617 ± 0.021
75.8
0.782 ± 0.009
97.5
Product Titer(mg/l)
1.26 ± 0.12 2.27 ± 0.25 2.27 ± 0.23 2.72 ± 0.17
CO 2 evolution,CER (mmol/l/h)
02 uptake, OUR(mmol/l/h)
RespirationQuotient, RQ
0.353 ± 0.024
0.456 ± 0.022
0.774 ± 0.065
0.467 ± 0.024
0.420 ± 0.027
1.110 +± 0.090
0.408 ± 0.019
0.396 ± 0.019
1.028 ± 0.067
0.330 ± 0.016
0.326 ± 0.022
1.010 ± 0.084
0.608 ± 0.027
0.522 ± 0.028
1.166 ± 0.082
126
Table 5-1.
GlucoseLimited 1
0.0227
0.0238
GlucoseLimited 2
0.01 76
0.0186
GlucoseLimited 3
0.0141
0.0163
GlucoseLimited 4
0.0125
0.0165
GlutamineLimited
0.0248
0.0254
-

dilution rate at low dilutions ( = D/viability). Increasing death with decreasing dilution
rate has been observed before with CHO cell chemostats (Hayter et al., 1993).
Glycosylation site occupancy at these steady states was analyzed using micellar
electrokinetic capillary chromatography (MECC) of immunoprecipitated samples, and
the results are presented in Table 5-2. Immunoprecipitations were performed in
duplicate, and each immunoprecipitated sample was injected 2-3 times in MECC.
Although growth rates and viabilities varied significantly at the different steady states,
glycosylation site occupancy was found to vary over a rather narrow range. No obvious
correlations were evident between site occupancy and growth rate.
Glycosylation site occupancy for four glucose
glutamine limited steady state cultures.
Glycosylation Sites Occupied (%)
Dilutionrate, D (/h)
Growthrate, g. (I/h)
69.8 + 1.1 25.1 + 0.4
66.3 + 0.4 26.9 ± 0.2
68.3 + 0.8 25.0 + 0.6
65.2 + 1.2 28.0 + 1.0
61.7 + 0.8 30.0 + 0.6
Table 5-2. limited and one
2-sites 1-site 0-sites
GlucoseLimited
GlucoseLimited 2
GlucoseLimited 3
GlucoseLimited 4
GlutamineLimited
0.0227
0.0176
0.0141
0.0125
0.0248
0.0238
0.0186
0.0163
0.0165
0.0254
5.0 ± 0.8
6.7 + 0.2
6.6 ± 0.6
6.7 + 0.8
8.2 + 0.4
127

5.1.2 Glycosylation Site Occupancy and Nucleotide Sugars
Nucleotide sugar concentrations were analyzed to determine whether their availability
may have been responsible for the observed variations in glycosylation site occupancy.
Perchloric acid cell extracts were collected for the glutamine limited chemostat and for
three of the four glucose limited chemostats, and the extracts were analyzed with ion-pair
reverse phase HPLC as described in Materials and Methods. The measured nucleotide
concentrations are reported in Table 5-3 as pmole/(g viable dry cell weight). Results are
expressed on a dry cell weight rather than cell number basis to account for variations in
cell size, and because extensive cell aggregation (clumping) at low dilution rates made cell
number determination difficult. Perchloric acid extracts of non-viable (trypan blue
permeable) cells were found to contain negligible concentrations of nucleotides and
nucleotide sugars (data not shown). This result was not surprising, since loss of
membrane integrity, as measured by trypan blue permeability, was expected to increase
free nucleotide permeability. Hence, nucleotide concentration results are considered on a
viable dry cell weight basis.
As the glycosylation site occupancy decreased, there was a corresponding decrease in
intracellular UDP-N-acetylglucosamine + UDP-N-acetylgalactosamine (the nucleotide
sugars co-eluted in HPLC as discussed in Materials and Methods; the sum will be referred
to as UDP-GNAc). Figure 5-1 shows the percentage of IFN-y glycosylated at both
potential sites against the intracellular UDP-GNAc. A trend, consistent for all of the
glucose and glutamine limited chemostats, is identified. For the glucose limited
chemostats, the concentrations of all nucleotides and nucleotide sugars declined as UDP-
GNAc declined, indicating that declining UDP-GNAc may have been related to an overall
reduction in nucleotide levels (Table 5-3). In contrast, the glutamine limited culture had
high levels of nucleoside triphosphates, but very low UDP-GNAc.
128

Cell mass-specific nucleotide concentrations (mole/g viable dry cell
weight) measured in perchloric acid extracts.
Nucleotide
ATP
ADP
AMP
GTP
GDP
CTP
UTP
UDP
UDP-Gal
UDP-Glc+GDP-Man
UDP-GNAc
GlucoseLimited 1
25.40+ 0.19
2.57 + 0.36
0.49 + 0.03
4.62 + 0.07
0.54 ± 0.06
3.79+ 0.19
7.81 ± 0.21
0.75+ 0.19
0.64 + 0.33
2.16+ 0.20
2.85 + 0.02
GlucoseLimited 2
21.68 ± 0.25
2.18 ± 0.14
0.43 ± 0.03
3.96 ± 0.03
0.41 ± 0.01
3.34 ± 0.01
6.72 ± 0.01
0.56 ± 0.03
0.66 ± 0.16
2.05 ± 0.06
2.30 ± 0.08
GlucoseLimited 4
19.18 ±
2.09 ±
0.49
3.57
0.50 ±
2.82±
4.87 ±
0.63
0.50±
2.00 ±
GlutamineLimited
0.43
0.27
0.06
0.07
0.08
0.06
0.05
0.11
0.10
0.15
1.98 0.08
25.07 ±
1.58
0.25
4.87
0.31 ±
4.17±
9.66
0.82
1.10±
2.57
0.37
0.10
0.02
0.06
0.04
0.11
0.05
0.04
0.03
0.12
1.70 0.02
129
- -
Table 5-3.

'Tro/(.1; I I-/o
> 70%0
o 68%
n 66%
zL 64%0m 62%Q)
a- 60%1.50 1.75 2.00 2.25 2.50 2.75 3.00
UDP-GNAc [mole/g viable DCW]
Figure 5-1. The relationship between glycosylation site occupancy and
intracellular UDP-GNAc concentration in glucose and glutamine
limited chemostat cultures.
5.2 Metabolic Flux Analysis
To determine whether changes in nucleotide sugars and glycosylation were related to
metabolism, the fluxes of central carbon metabolism were estimated from material
balances. Figure 5-2 depicts the metabolic network model used (see Materials and
Methods). Accurate determination of metabolic fluxes using material balances requires
that all significant material uptake be taken into account. Peptides represent a potentially
substantial source of amino acids in our serum free medium, since the hydrolysate
Primatone RL, which is present at 2.5 g/l, contains approximately 41% peptides by
130

'Biomass-R5P
Biomass-GAP
Gly
ier
Lactate
TCACycle
227 T2'Val Thr
Figure 5-2. Schematic diagram of a simplified
describing central carbon metabolism.
biochemical reation network
131
In
4
8
3
)

weight (from manufacturer specifications). Amino acids present in peptides were
measured in the feed and steady state reactor samples to determine whether utilization of
peptide amino acids occurred under these conditions.
We found that uptake of some peptide amino acids did occur. The amounts of peptide-
bound alanine, aspartate, glycine, hydroxyproline, isoleucine, lelcine, phenylalanine and
valine were significantly lower in reactor effluents compared to the feed. Figure 5-3
compares the amounts of these peptide-bound amino acids in the feed to the amounts in
the reactor effluent for glucose limited steady state 4; the difference represents a source of
amino acids which may have been metabolized or accumulated in the medium. Other
amino acids not shown in Figure 5-3 were present in equal amounts in the feed and reactor
effluent within experimental error, which indicates that only selected amino acids were
liberated from peptides in significant amounts. Table 5-4 shows the contribution that
peptide derived amino acids made to measured metabolite production rates. Including
peptide derived amino acids, the overall metabolite production rates for the steady states
are listed in Table 5-5. The amino acid requirements for biosynthesis (i.e. protein,
nucleotide and lipid synthesis) have already been subtracted from the data in Table 5-5,
and so the data are net catabolic rates (Bonarius et al., 1996).
The consistency of the metabolite measurements and assumed biochemistry can be
assessed by considering the reaction network depicted in Figure 5-2. The network
includes 37 metabolites and 33 reactions (i.e. m=37 and n=33). The stoichiometric matrix,
A, is 37 x 33, with rank(A)=33 and a condition number c(A)=69 (see Materials and
Methods for details). The number of redundant equations in the network is equal to m - n
- (the number of linearly dependent equations). Since the equations for NAD(P)+ and
NAD(P)H are linearly dependent as are the equations for FAD and FADH 2, the number
of redundant equations in the network is 2 (37 - 33 - 2). Hence there are two redundant
measurements used in solving the network, and we can use these redundancies to
determine the consistency of the metabolite measurements and assumed biochemistry.
132

E
O 1.0Oc m .
*c 0.50CL-co
~0.0Ala Asp Gly Hyp lie Leu Phe Val
Figure 5-3. Peptide bound amino acids in the feed and reactor effluent for
glucose limited steady state 4.
133
-4

Rates of peptide amino acid consumption in steady state chemostat
cultures (mmol/g DCW/d).
GlucoseLimited 1
0.204+0.031
0.052±0.056
0.048+0.040
0.034+0.019
0.124+0.042
-0.100±0.060
0.815+0.266
0.146+0.040
GlucoseLimited 2
0.288+0.009
0.127+0.031
0.122+0.026
0.038+0.005
0.112±0.007
-0.005+0.031
0.568+0.201
0.205±0.014
GlucoseLimited 3
0.242+0.018
0.130+0.022
0.080+0.036
0.028+0.016
0.084+0.032
0.090+0.020
0.515±0.144
0.197±0.028
GlucoseLimited 4
0.269+0.013
0.183±0.026
0.143+0.049
0.031+0.012
0.133+0.029
-0.002+0.064
0.572+0.282
0.196+0.021
134
Table 5-4.
Ala
Asn+Asp
Gly
lie
Leu
Pro
Hyp
Val
GlutamineLimited
0.268+0.027
0.171+0.044
0.126±0.049
0.045±0.011
0.137±0.026
0.070+0.078
0.369±0.153
0.191±0.018
-- -

Measured metabolite production rates (r) for steady state chemostat
cultures (mmol/g DCW/d). Amino acid production rates include
peptide derived amino acids and are the net catabolic rates after
accounting for biomass synthesis.
GlucoseLimited I
Glucose -2.712±0.147
Lactate 0.869+0.351
CO2 15.89+1.37
02 -20.54±1.46
Ala 0.515+0.039
Asn -0.248±0.023
Asp 0.000±0.018
Gin -2.311±0.141
Glu 0.046±0.024
Gly 0.090±0.042
Ile -0.060±0.021
Leu -0.148±0.025
Lys 0.007±0.107
Pro+ 0.266±0.026Hyp
Ser 0.361±0.029
Thr 0.048±0.019
Val -0.011 +0.042
GlucoseLimited 2
-1.711 +0.098
0.218+0.085
17.23+ 1.30
-15.52+ 1.30
-0.172+0.019
-0.228+ 0.030
-0.056±0.021
-1.674±0.095
-0.016+0.013
0.062±0.029
-0.107±+0.015
-0.289+0.023
0.060±0.050
0.085±0.032
0.190+0.017
0.042±0.014
-0.123±+0.021
GlucoseLimited 3
-1.283±0.042
0.036±0.106
14.15±0.77
-13.76±0.76
-0.157±0.015
-0.210±0.018
0.001 +0.019
-1.2511±0.055
0.076+0.018
0.165±0.029
-0.065 + 0.011
-0.206+0.014
-0.012+0.049
0.041+0.018
0.154+0.024
0.064+0.018
-0.067+0.022
GlucoseLimited 4
-1.271 + 0.062
-0.081 +0.021
12.82±0.851
-12.70± 1.039
-0.224± 0.020
-0.194±0.020
-0.009±0.018
-1.179±0.070
0.102±0.014
0.217±0.050
-0.068±0.013
-0.218+0.020
0.013±0.136
0.041 +0.065
0.147±0.017
0.079+0.013
-0.071 +0.022
GlutamineLimited
-8.137±0.348
9.190±0.491
18.682±1.150
-16.020±1.091
0.071±0.028
-0.260±0.029
-0.191+±0.026
-0.039±0.026
-0.273 ±0.025
-0.052±0.041
-0.130±0.020
-0.342±0.030
-0.041 ±0.052
0.017±0.060
0.064±0.042
0.036±0.019
-0.128±0.023
135
Table 5-5.
I).III

5.2.1 Redundancy Analysis: Predictions of Oxygen Uptake and Carbon Dioxide
Evolution
One method for determining the consistency of a data set is to use the minimum required
information to solve the network, and then calculate the value of redundant measurements
based upon the solved network. If the assumed biochemistry is correct and the
measurement set is consistent, then the calculated values for redundant measurements
should match the experimentally determined values. This technique can be applied to the
A
a)
Ct
c
CM
o
a)
C\
0
0
0
-
00a)
cm
0EE
0
00.014 0.01 7 0.020 0.
Growth Rate [1/h]
023 0.026
Figure 5-4. Measured specific carbon dioxide evolution rate in glucose limited
chemostats (0) compared to calculated based upon free amino acid
data only (*) and calculated based upon total (peptide + free) amino
acids (+).
136
I
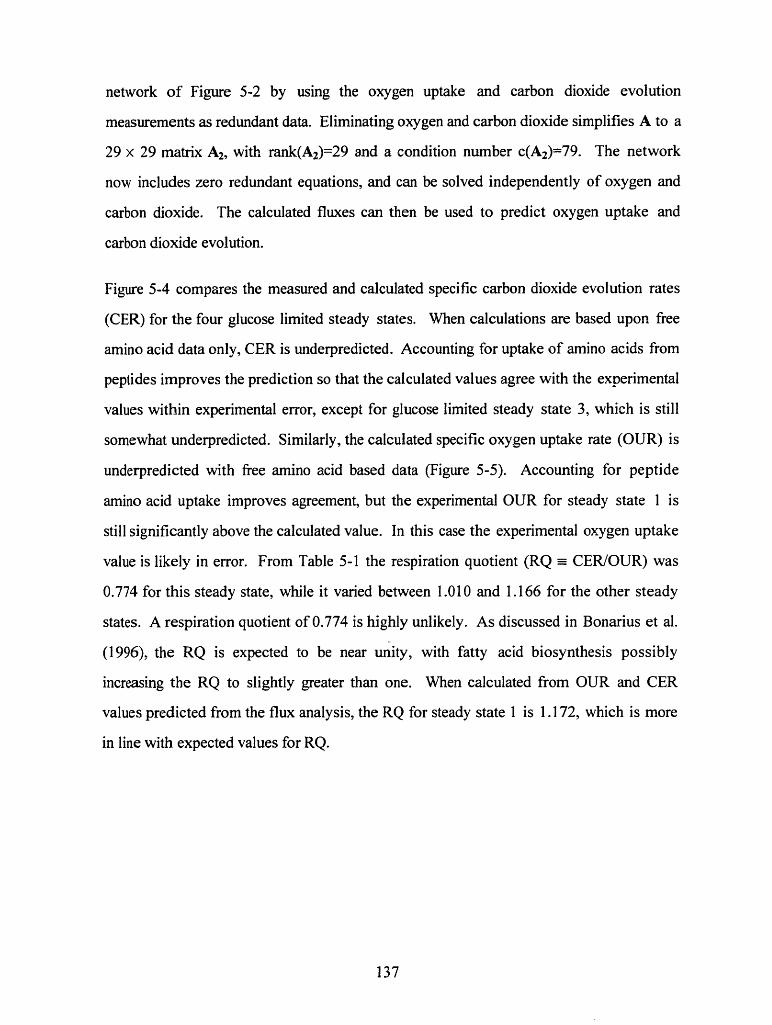
network of Figure 5-2 by using the oxygen uptake and carbon dioxide evolution
measurements as redundant data. Eliminating oxygen and carbon dioxide simplifies A to a
29 x 29 matrix A2, with rank(A 2)=29 and a condition number c(A 2)=79. The network
now includes zero redundant equations, and can be solved independently of oxygen and
carbon dioxide. The calculated fluxes can then be used to predict oxygen uptake and
carbon dioxide evolution.
Figure 5-4 compares the measured and calculated specific carbon dioxide evolution rates
(CER) for the four glucose limited steady states. When calculations are based upon free
amino acid data only, CER is underpredicted. Accounting for uptake of amino acids from
peptides improves the prediction so that the calculated values agree with the experimental
values within experimental error, except for glucose limited steady state 3, which is still
somewhat underpredicted. Similarly, the calculated specific oxygen uptake rate (OUR) is
underpredicted with free amino acid based data (Figure 5-5). Accounting for peptide
amino acid uptake improves agreement, but the experimental OUR for steady state 1 is
still significantly above the calculated value. In this case the experimental oxygen uptake
value is likely in error. From Table 5-1 the respiration quotient (RQ - CER/OUR) was
0.774 for this steady state, while it varied between 1.010 and 1.166 for the other steady
states. A respiration quotient of 0.774 is highly unlikely. As discussed in Bonarius et al.
(1996), the RQ is expected to be near unity, with fatty acid biosynthesis possibly
increasing the RQ to slightly greater than one. When calculated from OUR and CER
values predicted from the flux analysis, the RQ for steady state 1 is 1. 172, which is more
in line with expected values for RQ.
137
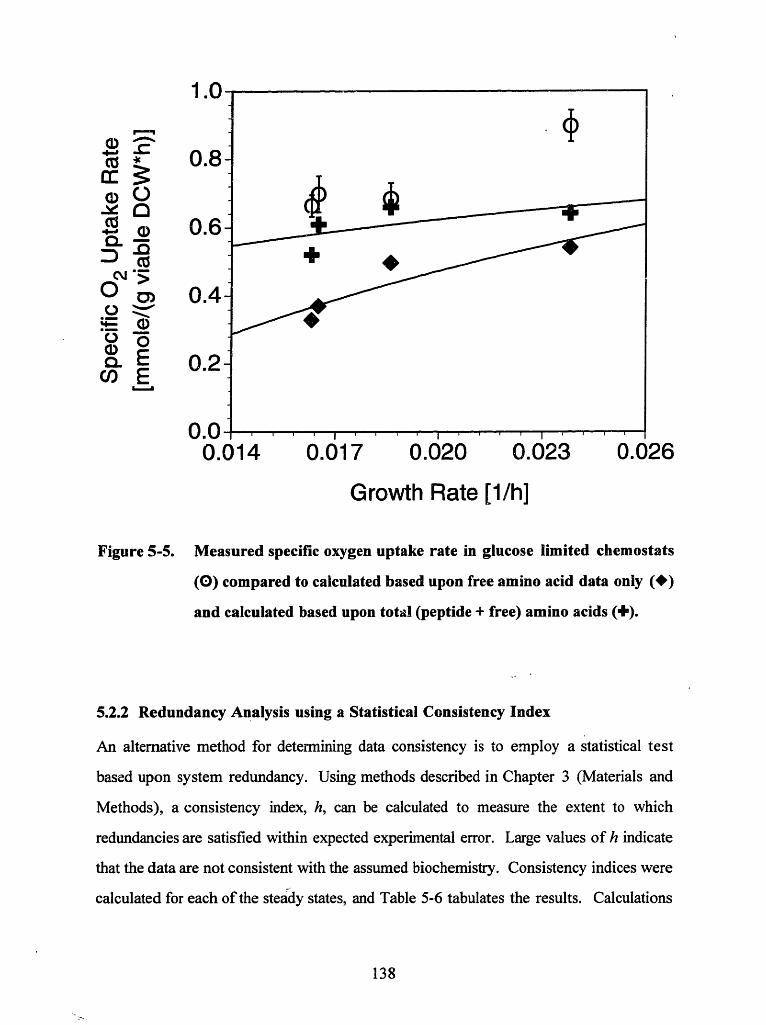
4 I .V
a) O,UC a) 0.6-
0.-
O a, 0.4-
o', 0.2-n) E
0.00.014 0.017 0.020 0.023 0.026
Growth Rate [1/h]
Figure 5-5. Measured specific oxygen uptake rate in glucose limited chemostats
(O) compared to calculated based upon free amino acid data only (*)
and calculated based upon total (peptide + free) amino acids (+).
5.2.2 Redundancy Analysis using a Statistical Consistency Index
An alternative method for determining data consistency is to employ a statistical test
based upon system redundancy. Using methods described in Chapter 3 (Materials and
Methods), a consistency index, h, can be calculated to measure the extent to which
redundancies are satisfied within expected experimental error. Large values of h indicate
that the data are not consistent with the assumed biochemistry. Consistency indices were
calculated for each of the steady states, and Table 5-6 tabulates the results. Calculations
138
. ..
+
III
I I

Consistency indices, h, for steady state data analyzed with a
metabolic network including two redundant measurements. Glucose
limited chemostat data were analyzed based upon either free amino
acid measurements only or on total (free + peptide) amino acid
measurements.
hFree amino acids
hTotal amino acids
Glucose Limited 1
Glucose Limited 2
Glucose Limited 3
Glucose Limited 4
54.603 22.044
72.616 0.023
131.516 13.842
93.589 1.312
Glutamine Limited 6.529
for the glucose limited steady states were performed on both the free amino acid based
data and the total (free+peptide) amino acid based data. The data based only on free
amino acids had higher h values than data which account for peptide uptake. These
results, which indicate that accounting for peptide uptake results in more consistent data,
agree with the qualitative results obtained above by predicting OUR and CER.
Table 5-6 reveals that the data from the glutamine limited steady state and the glucose
limited steady states 1 and 3 still fail the 90% confidence level consistency check (h >
4.604), even when peptide-derived amino acids are taken into account. For these steady
states, suspect measurements can be identified by eliminating measurements one at a time
and recalculating h. If elimination of a particular measurement dramatically decreases h,
then it is likely that either the measurement is in error, or the assumed biochemical
139
Table 5-6.
_ __

pathways involving the particular metabolite are incorrect. Eliminating the oxygen
measurement for glucose limited steady state 1 reduces the consistency index from h =
22.044 (h > Z2 = 4.61, 90% confidence, 2 degrees of freedom) to h = 0.595 (h < X2 = 2.71,
90% confidence, 1 degree of freedom). Thus the consistency analysis indicates that there
is a greater than 90% chance that the oxygen measurement is in error. This result is
consistent with the observation that the respiration quotient, RQ, is abnormally low for
steady state 1, as was noted above.
Eliminating the leucine measurement for glucose limited steady state 3 reduces the
consistency index from h = 13.842 (h > X2 = 4.61, 90% confidence, 2 degrees of freedom)
to h = 0.027 (h < 2 = 2.71, 90% confidence, 1 degree of freedom). Similarly, the
glutamine limited steady state's consistency index can be reduced from h = 6.529 to h =
0.082 by eliminating the leucine measurement. In both cases the high consistency indices
are due to OUR and CER measurements which are not consistent with the remaining
measurements and metabolic network. When leucine is converted to a dependent variable,
material input into the TCA cycle can be altered to account for higher or lower OUR and
CER measurements. The data inconsistencies are therefore either due to inaccurate
estimations of TCA flux, or the experimental OUR and CER measurements are incorrect
due to systematic errors such as inaccurate dilution rate measurements. The dilution rate
is used to calculate both the OUR and CER, and therefore a dilution rate error would
cause errors in these quantities.
5.2.3 Estimated Metabolic Fluxes
For consistent data sets, the final metabolic flux estimates were based upon a weighted
least squares solution including all measurements. For the glucose limited steady state 1,
the oxygen data was not included in the solution, because the data consistency analysis
had identified the measurement as inconsistent. Likewise, the oxygen and carbon dioxide
140

data were not used in the weighted least squares solutions for the glucose limited steady
state 3 and the glutamine limited steady state.
The final intracellular flux estimates obtained by material balancing are presented in Table
5-7. Fluxes were normalized by the growth rate, , instead of the uptake rate of a
particular nutrient to facilitate comparisons of flux distributions at different steady states
and different nutrient limitations. Normalizing by the growth rate allows direct
comparison of the reaction yields (mmole/g dry cell weight), which are measures of
reaction pathway activities per cell mass produced.
5.3 Nucleotide Sugars, Glycosylation and Metabolism
5.3.1 Reaction Yields Correlated with Glycosylation Site Occupancy
For the glucose limited chemostats, glycosylation site occupancy correlated strongly with
citric acid (TCA) cycle activity. The percentage of IFN-y glycosylated at both potential
sites was linearly related to TCA cycle reaction yields. Figure 5-6 shows these
relationships for the pyruvate to acetyl CoA reaction (R2 = 0.997), the a-ketoglutarate to
succinyl CoA reaction (R2 = 0.990) and the oxaloacetate to a-ketoglutarate reaction (R2 =
0.965). In contrast, no correlation was observed between glycosylation site occupancy
and the reactions of glycolysis. This was somewhat surprising, since the hexose donor in
nucleotide sugar formation is derived from isomerization of glucose-6-P, an intermediate
in glycolysis. The results suggest that hexose availability was not the limiting factor for
nucleotide sugar formation.
141

Estimated central carbon metabolism reaction yields (mmole/g viable
dry cell weight) for chemostat steady state cultures.
ction
Glc --> G6P
G6P --> 2 GAP
GAP -- Pyr
Pyr -- Lac
G6P -- BiomassR5P + CO2
Glucose Glucose Glucose Glucose GlutamineLimited 1 Limited 2 Limited 3 Limited 4 Limited
4.96 4.05 3.80 4.26 13.67
4.52 3.62 3.37 3.82 13.24
7.98 6.42 5.56 6.23 26.22
1.89 0.51 0.11 -0.27 15.44
0.19 0.19 0.19 0.19 0.19
Pyr -* AcCoA + CO2
Pyr + Glu c a-KG + Ala
Oaa + AcCoA -- a-KG + CO2
a-KG -- SuCoA + CO2
SuCoA - Fum
Fum -- Oaa
9.53 11.50 10.37 11.95 12.55
0.95 -0.41 -0.47 -0.75 0.12
6.03 9.24 8.17 10.68 10.33
10.02 13.40 11.88 14.58 11.18
10.05 13.85 12.08 14.79 11.55
10.05 13.85 12.08 14.79 11.55
Oaa ---> Pyr + CO2
Gln -- Glu
Glu --- a-KG
4.38 5.18 4.44 4.70 1.89
4.67 4.51 4.33 4.60 0.50
2.31 4.29 3.50 3.78 1.12
GAP + Glu - Ser + a-KG
GAP + Glu -4 Gly + a-KG
Lys - 2 AcCoA + 2 COz2Ile -- AcCoA + SuCoA
Leu - 3 AcCoA
Glu -- Pro
Thr -- SuCoA
Val -* SuCoA + CO2
Oaa + Gln - Asn + cc-KG
Oaa + Glu --> Asp + a-KG
G6P -- BiomassG6P
GAP ---> BiomassGAP
AcCoA -- Biomass AcCoA
BiomassAKG -* a-KG
Oaa -- Biomass OAA
CO 2 -- Biomass_CO 2
NADH -- BiomassNADH
0.5 O2 + 3 ADP + NADH -3 ATP + NAD+
0.5 02 + 2 ADP + FADH2-2 ATP + FAD
0.66 0.45 0.46 0.49 0.11
0.17 0.15 0.49 0.70 -0.09
-0.05 -0.14 0.04 0.30 0.07
0.11 0.25 0.19 0.23 0.22
0.27 0.69 0.61 0.73 0.57
0.49 0.20 0.12 0.08 0.03
-0.09 -0.10 -0.19 -0.26 -0.06
0.01 0.29 0.20 0.24 0.21
-0.45 -0.54 -0.62 -0.65 -0.44
0.00 -0.13 0.00 -0.03 -0.32
0.25 0.25 0.25 0.25 0.25
0.23 0.23 0.23 0.23 0.23
4.31 4.29 4.30 4.28 4.30
0.35 0.35 0.35 0.35 0.35
0.09 0.09 0.09 0.09 0.09
-0.22 -0.22 -0.22 -0.22 -0.22
5.38 5.38 5.38 5.37 5.38
40.40 56.32 50.43 63.56 55.09
10.39 14.94 13.12 16.29 12.63
142
Rea¢
1
2
3
4
5
6
7
8
9
10
11
12
13
14
15
16
17
18
19
20
21
22
23
24
25
26
27
28
29
30
31
32
33
I
I
-
-
-
�-
�-
-
�-
-
-
-
-
-
�-
�-
-
-
Table 5-7.
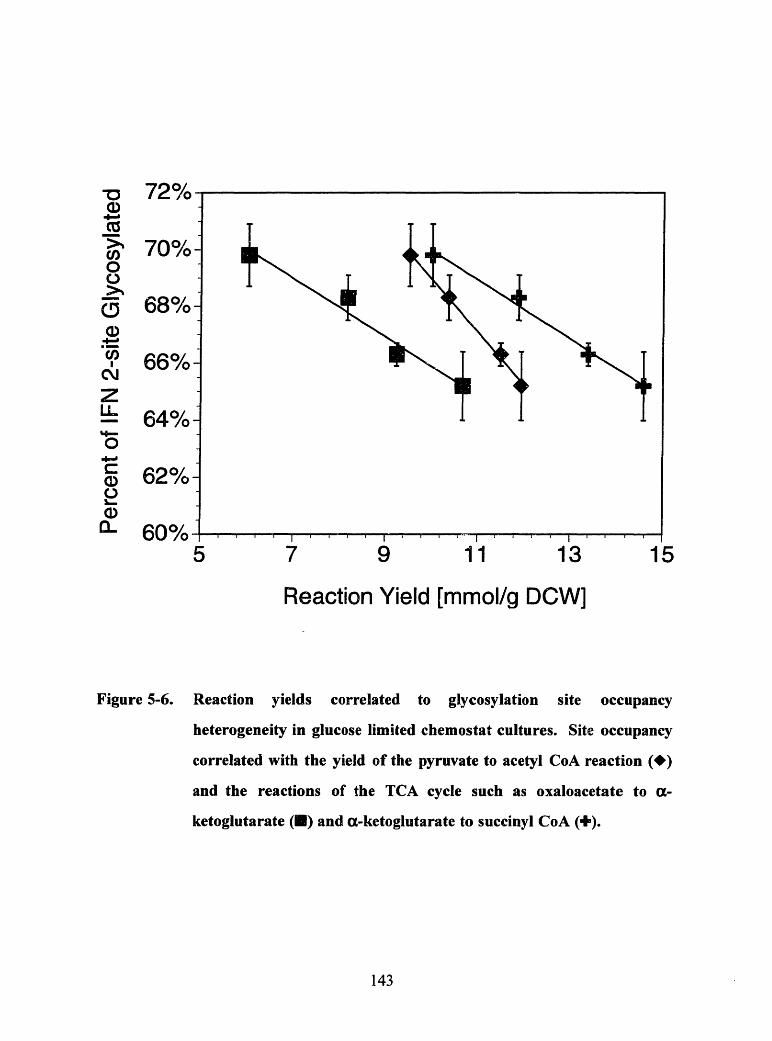
-0 I -7/O-(a)4 'o o
> 70%-0
'c, 66%-
L IIZ O R -. O,
0
) 62%-a)a- 60%-
5 7 9 11 13 15
Reaction Yield [mmol/g DCW]
Figure 5-6. Reaction yields correlated to glycosylation site occupancy
heterogeneity in glucose limited chemostat cultures. Site occupancy
correlated with the yield of the pyruvate to acetyl CoA reaction ()
and the reactions of the TCA cycle such as oxaloacetate to a-
ketoglutarate () and a-ketoglutarate to succinyl CoA (+).
143
17flol
-
. . . I I . I . I I I I I- I

5.3.2 Nucleoside Triphosphates and Nucleotide Sugars in Chemostat Cultures
The correlation between glycosylation and the TCA cycle implicates nucleoside
triphosphates as the main factor influencing nucleotide sugar levels. The reactions of the
TCA cycle impact nucleotide synthesis, because potential TCA metabolites, such as
aspartate and glutamine, are important intermediates in pyrimidine and purine base
synthesis (Stryer, 1988). When the TCA cycle is producing more energy and fewer
byproducts, the yield of TCA cycle reactions increases and nucleotide synthesis declines.
In such cases available carbon is used to generate energy, and less carbon is available for
biosynthesis. The observation from the glucose limited chemostats that declining
nucleotide sugars correlated with declining total nucleotide levels supports the hypothesis
that nucleoside triphosphate levels were impacting nucleotide sugar concentrations.
Figure 5-7 shows the relationship between UDP-GNAc and UTP. For glucose limited
chemostats, UDP-GNAc levels declined as UTP declined.
It is noted that the glutamine limited chemostat did not follow the same trends regarding
TCA cycle activity, nucleoside triphosphates and nucleotide sugars. Although
glycosylation site occupancy in the glutamine limited chemostat did correlate with UDP-
GNAc, the low levels of UDP-GNAc did not appear to be related to UTP concentration
or the TCA cycle. UTP was actually in excess compared to the concentration of UDP-
GNAc (Figure 5-7). A likely cause of the low UDP-GNAc concentration in this case is
limitation of the N-acetylglucosamine-l-P precursor. The committed step in the
formation of this amino sugar is conversion of fructose-6-P to glucosamine-6-P, which is
catalyzed by the enzyme glutamine:fructose-6-P amidotransferase (GFAT). GFAT uses
glutamine as an ammonia donor, and hence glutamine limitation would be expected to
inhibit amino sugar synthesis.
144

i, nfnr O.UU
0o 2.75-a)
(. 2.50-
o 2.25-E
o 2.00-z -
, 1.75
1.504 5 6 7 8 9 10
UTP [pmol/g viable DCW]
Figure 5-7. The relationship between intracellular UDP-GNAc concentration
and UTP in glucose and glutamine limited chemostat cultures.
5.3.3 Nucleoside Triphosphates and Nucleotide Sugars in Batch and Fed-Batch
Cultures
Examination of nucleotide levels in batch and fed-batch cultures supports the hypothesis
that nucleoside triphosphates are the primary determinants of nucleotide sugar
concentrations in the absence of glutamine limitation. Figure 5-8 shows UDP-GNAc vs.
UTP during exponential growth in batch, fed-batch and chemostat cultures. Intracellular
UTP levels varied between 5 and 10 !xmole/g viable dry cell weight over the course of a
145
GlutamineLimited
. . . . I ... I . . . . I I I

4 Arl-" I VlU
O0 80-0
oE=- 4
z9 2
a-
0 5 10 15 20 25 30
UTP [pmol/g viable DCW]
Figure 5-8. The correlation between intracellular UDP-GNAc and UTP during
exponential growth in batch, fed-batch and chemostat cultures.
Symbols indicate results from various independent experiments.
fed-batch culture. Higher concentrations of UTP were obtained by feeding the nucleotide
precursor uridine (up to 10 mM), while lower concentrations were observed during
glucose starvation at the end of batch culture. Figure 5-8 demonstrates that UDP-GNAc
was linearly correlated with UTP over a 10-fold range in UTP (from 2.5 to 25 jumole/g
vDCW). Similar correlations were found for UDP-Gal and UDP-Glc (data not shown),
indicating that in general UDP-sugar levels are regulated by nucleoside triphosphate
concentrations. This data is in agreement with the data of Pels Rijcken et al. (1995a), who
146

0 5 10 15 20 25
UTP [pmol/g viable DCW]
Figure 5-9. Reduced UDP-GNAc formation under glutamine limitation: the
relationship between UDP-GNAc and UTP during glutamine
limitation () compared to exponential growth in batch, fed-batch
and chemostat cultures (+).
found that rat hepatocytes fed 0.5 mM uridine for 40 hours increased the pools of UTP,
UDP-Hexose and UDP-GNAc 6.7-, 3.8- and 4.6-fold, respectively.
Nucleoside triphosphates are not the only regulators of UDP-sugar synthesis, however,
as the glutamine limited chemostat demonstrates. In this case amino sugar formation
appears to limit UDP-GNAc synthesis. Figure 5-9 re-plots the data from Figure 5-8
along with additional data from glutamine limited cultures (the glutamine limited
147
4 A._III
00>
0
0
0z13
C]:
iV
8
6
4
2
030

chemostat and cells starved for glutamine in batch and fed-batch culture). The data from
glutamine limited cultures fall below the exponential growth data, indicating an excess of
UTP compared to UDP-GNAc. The glutamine starvation effect was specific to amino
sugars, since UDP-Glc and UDP-Gal still correlated with UTP (data not shown). Thus
amino sugar formation most likely limits UDP-GNAc synthesis during glutamine
starvation.
5.4 Discussion
Glycosylation site occupancy of recombinant IFN-y varied with intracellular UDP-
GNAc (the combined UDP-GlcNAc and UDP-GalNAc pool) for the glucose and
glutamine limited steady states analyzed. Based upon analysis of nucleotide levels and
estimates of central carbon metabolic fluxes, we propose the model in Figure 5-10 to
explain the effects of glucose and glutamine limitation. During glucose limitation available
carbon is preferentially used for energy production, causing reduced nucleotide
biosynthesis. Because they are continually consumed for RNA synthesis, nucleoside
triphosphates such as UTP become depleted. Lower nucleoside triphosphate pools in
turn cause lower nucleotide sugar pools and lower glycosylation site occupancy. During
glutamine deprivation, amino sugar formation limits UDP-GNAc synthesis, since
glutamine is the ammonia donor in this reaction.
While it has been known for some time that glucose starvation decreases glycosylation
efficiency (Baumann and Jahreis, 1983; Chapman and Calhoun, 1988; Gershman and
Robbins, 1981; Rearick et al., 1981; Stark and Heath, 1979; Turco, 1980), the exact
mechanism of this effect has remained unresolved. Glucose starved cells synthesize
truncated lipid-linked oligosaccharide precursors, which are transferred to protein with a
much lower efficiency than the normal precursor (see Chapter 2). Nucleotide sugar
depletion has also been observed in glucose starved cultures (Chapman and Calhoun,
1988; Ullrey and Kalckar, 1979), and it is often cited as the likely cause of truncated
148

Glutamat
GFAT
~T N-A(
GlutamineLimitation
Gluco,Limital
Glucosamine 6-P
=etyiglucosamine 6-P
Figure 5-10. Synthesis of UDP-GlcNAc under glucose and glutamine limitation.
During glucose starvation, nucleoside triphosphates including UTP
are depleted, which limits nucleotide sugar formation. In contrast,
glutamine starvation limits UDP-GlcNAc synthesis by preventing
amino sugar formation.
149
Fructose f

precursor synthesis. Proposed explanations for nucleotide sugar depletion during glucose
starvation have generally focused on supply of hexose phosphates, but little work has
been done to investigate these hypotheses. This chapter presents evidence that
nucleoside triphosphate depletion is the cause of reduced intracellular nucleotide sugar
concentrations during glucose starvation.
Evidence from the literature supports our hypothesis that glucose starvation affects
glycosylation by causing depletion of nucleoside triphosphates. Nucleoside triphosphate
depletion during glucose starvation has been observed in the past (Kaminskas, 1979;
Rapaport et al., 1979). Declines in nucleoside triphosphates were not explained by
increases in nucleoside mono- and diphosphates, indicating that the nucleosides were
being depleted. Treatment with cycloheximide, which inhibits protein and RNA
synthesis, was found to prevent the decline in ribonucleotide pools during glucose
starvation. This result suggests that RNA synthesis plays a role in ribonucleotide
depletion during glucose starvation. Interestingly, other experiments have shown that
cycloheximide treatment allows glucose starved cells to synthesize the normal
Glc3Man9GlcNAc2-P-P-Dol precursor oligosaccharide (Chapman and Calhoun, 1988).
Hence under glucose-starved conditions which do not lead to depletion of nucleoside
triphosphates, glycosylation appears normal. This may also explain the results of Lanks
et al. (1988), who found that feeding nucleosides was more effective on a molar basis than
feeding glucose to supress glucose regulated protein synthesis in glucose starved murine
L929 cells. When glycosylation efficiency is impaired, synthesis of glucose regulated
proteins such as BiP (GRP78) is induced, presumably because the underglycosylated
proteins mis-fold and accumulate (Kozutsumi et al., 1988; Lee, 1987; Wooden et al.,
1991). The finding that uridine feeding can suppress GRP synthesis in glucose starved
cultures strongly suggests that uridine fed cells are able to maintain normal glycosylation
patterns.
150

Additional evidence linking glycosylation deterioration to nucleotide depletion during
glucose starvation is that the kinetics of the phenomena are very similar. The kinetics of
nucleotide depletion are quite rapid; Kaminskas (1979) reported that ribonucleoside
triphosphate pools decreased by 66-90% within 15 minutes of glucose starvation in
exponentially growing Erlich ascites tumor cells. Within 1 hour of glucose re-feeding,
nucleotide levels increased to at or above pre-starvation levels. These kinetics agree with
the rapid changes in lipid-linked oligosaccharides observed during glucose starvation
(Gershman and Robbins, 1981) and with the rapid changes in glycosylation site
occupancy we have observed with periodically starved cells in fed-batch culture (see
Chapter 4).
Altered nucleotide levels in non-starved cultures have also been found to influence
nucleotide sugars and glycosylation. Treatment of glucose fed Ehrlich ascites tumor cells
with cycloheximide was found to increase nucleoside triphosphate pools (Kaminskas,
1979), and this treatment has been shown to increase glycosylation site occupancy of
recombinant human prolactin produced in C127 cells (Shelikoffet al., 1994). Shelikoff et
al. (1994) found that other protein synthesis inhibitors did not improve glycosylation,
and so the effect may have been linked to cycloheximide's ability to inhibit RNA
formation and increase nucleotide levels. Pels Rijcken et al. (1995b) demonstrated that
nucleotide levels can also be increased by feeding precursors such as uridine, and
variations in UDP-sugars were sufficient to cause alterations in glycosylation patterns.
Uridine feeding increased the incorporation of N-acetylhexosamine into macromolecules,
while sialylation decreased. The authors suggested that elevated UDP-sugar
concentrations may have impaired transport of CMP-NeuAc into the Golgi, causing
decreased sialylation. Experiments with nucleotide antimetabolites provide further
evidence that altered nucleotide levels can influence glycosylation. For example inhibition
of purine biosynthesis in HL-60 leukemia cells with 3 gM 6-methylmercaptopurine
ribonucleoside resulted in reduced GTP levels (21% of control) and reduced mannose
151

incorporation into proteins and oligosaccharides (40% of control) (Sokoloski and
Sartorelli, 1987).
For the glucose limited chemostat experiments described here, nucleotide concentrations
appeared to vary in response to changes in metabolism. The reactions of the citric acid
(TCA) cycle in particular were found to correlate with nucleotide levels and glycosylation
in glucose limited chemostats (see Figure 5-6). Metabolism could impact nucleotide
biosynthesis by altering the availability of important precursor metabolites such as
aspartate, glutamine, serine, glycine and ribose-5-P. Of these precursor metabolites, the
TCA cycle is most likely to impact aspartate. The importance of the TCA cycle in
providing aspartate for nucleotide synthesis was demonstrated in a respiration deficient
Chinese hamster lung fibroblast cell line which had an almost complete shutdown of TCA
cycle reactions (DeFrancesco et al., 1976). While the cells were able to grow when 3 mM
asparagine was added to the medium, the amount of 14C labeled ATP was reduced by
70% compared to control cells, and UDP-glucose was reduced by 50%. Exogenous
aspartate would not even support growth, apparently because it was less readily taken
up by the cells. The data suggest that exogenous asparagine can only partially satisfy the
demand for intracellular aspartate, and normal nucleotide synthesis relies on the TCA
cycle for aspartate supply.
Aspartate is synthesized by the enzyme aspartate aminotransferase, which catalyzes the
transfer of a glutamine ammonia group to oxaloacetate. Oxaloacetate is a TCA cycle
intermediate which can also react with acetyl CoA to form citrate by the citrate synthase
enzyme. Eigenbrodt et al. (1985) cited evidence that oxaloacetate availability is a primary
regulator of aspartate formation, and the citrate synthase and aspartate aminotransferase
reactions can compete for available oxaloacetate. High concentrations of acetyl CoA favor
consumption of oxaloacetate for citrate synthesis, and so increased pyruvate oxidation
leads to consumption of oxaloacetate in the TCA cycle and lower aspartate production.
Interestingly, we found that increased pyruvate oxidation in glucose limited chemostats
152

led to lower glycosylation site occupancy (Figure 5-6). Thus when carbon utilization
patterns favored consumption of oxaloacetate for citrate synthesis, nucleotide levels and
glycosylation site occupancy declined. The data are consistent with the hypothesis that
oxaloacetate availability for aspartate synthesis influenced nucleotide synthesis, which in
turn influenced nucleotide sugars and glycosylation site occupancy. Glycosylation was
best when pyruvate was converted to byproducts such as lactate and alanine, while the
worst glycosylation occurred when both lactate and alanine were consumed and more
pyruvate was oxidized.
The glutamine limited chemostat demonstrated that, although nucleoside triphosphates
play an important role in determining nucleotide sugar concentrations, they are clearly not
the only factor. Amino sugar formation can also determine the supply of UDP-GNAc.
The glutamine:fructose-6-P amidotransferase (GFAT) enzyme responsible for amino
sugar formation transfers an ammonia group from glutamine to fructose-6-P to form
glucosamine-6-P. The rate of this reaction depends upon the concentration of glutamine
and fructose-6-P, among other factors. Traxinger and Marshall (1991) reported GFAT's
glutamine Km values measured in adipose, liver and other tissues ranged from 0.4 to 1.6
mM. The steady-state concentration of glutamine in the glutamine limited chemostat was
0.022 mM. While the intracellular glutamine concentration most likely differed from the
extracellular concentration, one would expect intracellular glutamine was in short supply
as well. Limited glutamine supply for amino sugar formation could explain low UDP-
GNAc and high UTP concentrations under glutamine limitation (Figure 5-9).
Further evidence implicating amino sugar formation as a regulator of UDP-GNAc
synthesis is that feeding amino sugars such as glucosamine or galactosamine leads to
accumulation of UDP-GNAc (Komfeld and Ginsburg, 1966; Pels Rijcken et al., 1995a).
Following their entry into the cell, amino sugars are converted into hexosamine
phosphates, acetylated, and reacted with UTP to make UDP-GNAc. Since the reaction
catalyzed by GFAT is essentially not reversible, glucosamine-6-P is not converted to
153

fructose-6-P, and the majority of the hexosamine accumulates as nucleotide sugars. The
UDP-GNAc expansion can be severe enough to cause UTP depletion and cell death. Such
excessive accumulation demonstrates that amino sugar levels can play a key role in UDP-
GNAc synthesis. Under normal conditions amino sugar formation must be tightly
regulated to maintain sufficient supply of glucosamine-6-P, without over-stimulating
nucleotide sugar formation. However, UDP-GNAc concentrations cannot be the only
source of feedback regulation, since amino sugar formation does not limit UDP-GNAc
expansion when UTP is increased by feeding uridine. This data seem to implicate
hexosamine phosphates as regulators of the GFAT reaction.
5.5 Conclusions
Continuous culture experiments allowed us to analyze central carbon metabolism under
cc-, ,ons which led to varied product glycosylation site occupancy. Although site
occupancy varied over a narrow range, we found that differences correlated with the
intracellular UDP-GNAc concentration. Measured nucleotide levels and estimates of
central carbon metabolic fluxes point to nucleoside triphosphate depletion as the cause of
decreased site occupancy during glucose limitation. Subsequent experiments in batch and
fed-batch culture have confirmed that UDP-sugar concentrations are correlated with UTP
levels in the absence of glutamine limitation. Glutamine limitation appears to influence
glycosylation by reducing amino sugar formation and hence UDP-GNAc concentrations.
It should be emphasized that continuous culture experiments are used to study cells under
nutrient limitation. We found that under glucose or glutamine limitation, nucleotide sugar
formation can be responsible for observed changes in glycosylation site occupancy.
Under non-limiting conditions, nucleotide sugars may or may not play an important role
in regulating glycosylation site occupancy. The relatively modest change in site
occupancy (from 70% to 62% 2-site glycosylated protein) for a 40% reduction in UDP-
GNAc tends to suggest that nucleotide sugar concentrations can vary over a fairly wide
154

range without having major impact on glycosylation site occupancy. Nucleotide sugar
concentrations may only be critical during extreme starvation. The influence of nucleotide
sugars on glycosylation site occupancy during normal exponential growth is explored in
Chapter 6.
155


6. The Influence of Nucleotide Sugars on IFN-y Glycosylation
Site Occupancy
The experiments described in the previous chapter established that the primary
determinants of nucleotide sugar concentrations ding exponential growth were
nucleoside triphosphate concentrations and amino sugar formation. Under conditions of
glucose or glutamine limitation, nucleotide sugars limited glycosylation site occupancy.
However, it was not clear from the results in Chapter 5 to what extent nucleotide sugars
influence glycosylation in cultures which are not nutrient limited. Can increasing
nucleotide sugar concentrations improve glycosylation site occupancy in non-starved
cultures? Do nucleotide sugar variations during normal batch and fed-batch culture
explain the changes in glycosylation site occupancy described in Chapter 4?
The experiments described in this chapter were designed to answer these questions. The
influence of nucleotide sugars on glycosylation site occupancy was investigated by
feeding nucleotide sugar precursors. Alterations in nucleotide sugar concentrations were
monitored and related to glycosylation site occupancy. Nucleotide sugar concentrations
and glycosylation site occupancy were also monitored with time during fed-batch culture.
The results indicate that nucleotide sugars primarily influence glycosylation site
occupancy during periods of starvation; increased nucleotide sugar concentrations led to
only modest improvement in glycosylation. Furthermore the gradual decline in
glycosylation site occupancy observed during exponential growth (Chapter 4) is caused
by a step downstream of nucleotide sugar formation, as nucleotide sugar concentrations
actually increased during this time.
157
6.1 Sugar Precursor Feeding
6.1.1 Alternative Carbon Sources
According to the results from Chapter 5, nucleoside triphosphates and amino sugar
formation are the primary determinants of nucleotide sugar concentrations in glucose fed
cultures. Hexose phosphates did not appear limiting, despite the demand placed on
hexose phosphates by glycolysis and the pentose phosphate cycle. To further examine
the role of hexose carbon in glycosylation, a series of sugar feeding experiments were
performed in serum-free, suspension culture. Sugars which enter carbon metabolism at
various reactions (Figure 6-1) were fed and glycosylation was monitored with
radiolabeling after two days. Galactose, fructose, mannose and glucosamine were chosen
based upon literature information about uptake and utilization (Schachter, 1978;
Yurchenco et al., 1978).
Glycosylation after a two day exposure to the sugars fed is shown in Figure 6-2. The
data illustrate that glycosylation was minimally affected by hexose feeding, while a
dramatic decline in glycosylation was observed upon feeding the amino sugar glucosamine.
To insure that the sugars were indeed transported to and utilized by the cells, sugar
concentrations were monitored over a three day batch. Measurable consumption of
sugars occurred, with mannose most readily utilized. In addition, cells were adapted to
growth in the presence of mannose alone (i.e. without glucose), or mannose plus galactose
(the cells would not grow well with galactose or fructose as the sole carbon source).
Maximal glycosylation with the various sugar sources was found to be similar in all cases,
although end of batch starvation behavior varied as the sugars were exhausted at different
times (results not shown). The data are consistent with the hypothesis that hexose
phosphates are not the primary regulators of nucleotide sugar formation and
glycosylation. Amino sugars can be important, however, as the glucosamine-fed flask
demonstrated.
158

,0(a0I0-c0(5C-- O- E -0
x
00
wU)A0C
L
a(L
0MO..-E -(a0U
f,
O
DCD_
000(D0IL
aaC,
U) I4I
IL 0 4 0 zUz LId
LL 2
t0C
Ea
8co00
0-w 0)4
Z0
a.0 Qi
0 0.C CE S0 w
0
SZ Z.4.i
Figure 6-1. Biosynthesis of common nucleotide sugars from various carbon
sources (Schachter, 1978).
159
00 Co a.
2 co.5a 0i O
00O
000(CwE
a8I
E
0*a
ra
a)w
(U000L
n) IICo O :W -
C W
V.6<:
i
00)0OC,
40aEM00C
Ut:,E
0.
i
aM'-
0
00
CC
o5CD2I(0
4)0
00CC
a.
UCL
a)8(0
'i2LLLi0
0 oO
L-.
aIL
0CE
00M(n
(5
0)084i
0)C
EM000cU(5(5~0>
0
Z.
0a
m
T- tD
0P W'4-00 So o
o O
01 )U) 0A0 ..
U IL(-I. .1
0C
E
8(00)
0)0U
z
a,8~41Z
-
I
-- I

CD LO t C Cj
uoJaJaIu I Blwwue3 paeaoae o IuaOJad
Figure 6-2. Glycosylation site occupancy of IFN-y produced in the presence of
various sugars.
160
cmcU
+
_E
Ec
co
o
U)0ZC
0

6.1.2 The Influence of Glucosamine On Nucleotide Sugars and Glycosylation Site
Occupancy
The most interesting result from the sugar feeding experiments was the decline in
glycosylation observed with glucosamine feeding. A dose-response experiment was
performed to see if the decline would occur in a dose-dependent manner. The results
shown in Figure 6-3 indicate that as the glucosamine concentration was increased,
glycosylation decreased. In addition to its impact on glycosylation, glucosamine is
known to cause accumulation of UDP-GicNAc and UDP-GalNAc (the sum is referred to
as UDP-GNAc) (Komfeld and Ginsburg, 1966). Glucosamine feeding causes
accumulation of UDP-GNAc, because glucosamine is not freely converted to other sugars
and metabolized. As discussed in the Literature Review, this is because amino sugar
formation is not normally reversible, and so glucosamine-6-P is not readily converted to
fructose-6-P.
In order to explain the decline in glycosylation with glucosamine feeding, several
hypotheses can be suggested: (1) accumulation of UDP-GNAc could deplete the cellular
UTP needed for UDP-Glc synthesis, (2) accumulation of UDP-GlcNAc may elevate
GlcNAc-P-P-dolichol, depleting the dolichol which is also necessary for Glc-P-dolichol
and Man-P-dolichol and (3) glucosamine itself may inhibit glycosylation reactions. The
first hypothesis seemed plausible, since depletion of UTP with galactosamine feeding had
been reported in the literature (Pels Rijcken et al., 1995a). Moreover, feeding pyruvate
with glucosamine led to even worse glycosylation (Figure 6-2), and pyruvate would be
expnected to worsen UTP depletion, since pyruvate oxidation was correlated to decreased
nucleoside triphosphate levels in chemostat cultures (Chapter 5).
To investigate the hypothesis that glucosamine affects glycosylation by depleting UTP,
nucleotide levels and glycosylation site occupancy were monitored when -CHO cells
were fed glucosamine alone or in combination with uridine. Table 6-1 presents the
intracellular nucleotide concentrations for untreated (control) cells, cells treated with 2
161

2 -site _
i-site --
O-site _
gE E E E C
ozC Cp o 0
6 0o o
-cCI.
C> 0
(/) 00C) 'aaz 0(0 _O= 50d 2gE_
L a
-DC1.2
C.
...... "'"", -Concentration [mM]
Figure 6-3. The influence of glucosamine on IFN- glycosylation site occupancy.
162
A

The effects of uridine (5 mM) and glucosamine (2 mM) on
intracellular nucleotide levels (mol/g viable dry cell weight).
Control
21.95 + 0.42
1.64 0.05
4.82 0.21
0.34 ± 0.00
4.73 + 0.11
8.21 + 0.36
0.86 + 0.20
+glucosamine
23.28 + 0.88
1.49 ± 0.05
4.45 + 0.11
0.32 + 0.01
3.53 + 0.19
5.38 ± 0.20
1.17+ 0.15
+uridine
18.38 + 0.91
1.63 + 0.17
4.51 + 0.21
0.32 + 0.02
7.18+ 0.34
15.53 + 0.84
1.31 + 0.16
+glucosamine+uridine
19.69 + 0.09
1.40 + 0.08
4.30 ± 0.08
0.33 + 0.03
4.41 + 0.33
9.43 ± 0.23
1.95 + 0.08
UDP-GNAc
UDP-Glc+GDP-Man
UDP-Gal
3.61 + 0.02
2.19+ 0.04
0.96 + 0.02
38.56 + 0.41
1.69 + 0.05
0.79 + 0.03
5.31 ±+ 0.33
3.14 0.14
1.38 + 0.06
49.53 + 0.94
2.34 + 0.10
0.95 + 0.04
mM glucosamine, cells treated with 5 mM uridine and cells treated with both 2 mM
glucosamine and 5 mM uridine. Accumulation of UDP-GNAc due to glucosamine feeding
did appear to cause some depletion of UTP and other UDP-sugars. Feeding 2 mM
glucosamine led to a 10-fold increase in intracellular UDP-GNAc, and decreases in UDP-
Gal (18% decrease), UDP-Glc+GDP-Man (23% decrease) and UTP (35% decrease). The
UTP depletion could be reversed by feeding uridine. Feeding 5 mM uridine in addition to
2 mM glucosamine recovered UDP-sugar and UTP concentrations to at or above control
concentrations, and led to even higher UDP-GNAc concentrations.
163
Table 6-1.
Nucleotide
ATP
ADP
GTP
GDP
CTP
UTP
UDP
-I

The relationship between glycosylation site occupancy and UDP-GNAc during
glucosamine and uridine feeding is shown in Figure 6-4. As the UDP-GNAc
concentration increased, glycosylation site occupancy decreased. The effect was not due
to UDP-Glc depletion, since the uridine+glucosamine culture had a UDP-Glc+GDP-Man
concentration slightly higher than the control, and yet glycosylation site occupancy was
even worse than with glucosamine alone. Worse glycosylation with uridine+glucosamine
implicates excessive UDP-GNAc as the cause of poor glycosylation, rather than
inhibition of glycosylation by glucosamine itself.
0/'O/
0 10 20 30 40 50
UDP-GIcNAc + UDP-GalNAc[pmol/g viable DCW]
60
Figure 6-4. The relationship between IFN-y glycosylation site occupancy and
intracellular UDP-GNAc with glucosamine and uridine feeding.
164
{D0
(D
a)I)a)
0Q)
CD
C
a-o0a)
a-

6.1.3 Discussion
Previous investigators have also found that glucosamine feeding causes a reduction in
glycosylation (Datema and Schwarz, 1979; Elbein, 1987; Koch et al., 1979; Pan and
Elbein, 1982). In our glucosamine and uridine feeding experiments, we observed an
inverse correlation between intracellular UDP-GNAc and glycosylation site occupancy.
The evidence did not support the hypotheses that glucosamine itself inhibits
glycosylation or that UTP depletion inhibits glycosylation. An inverse correlation
between UDP-GNAc and glycosylation may seem contradictory to the positive
correlation reported in Chapter 5. However, the range of UDP-GNAc concentrations is
quite different in each case. The highest concentration of UDP-GNAc observed during
normal exponential growth is -4 gmol/g viable DCW, while glucosamine feeding results in
concentrations ten times higher. Furthermore, in normal cultures the UDP-GNAc
concentration fluctuates with the UTP concentration, and so UDP-GNAc remains in
balance with UDP-Glc. With glucosamine feeding, UDP-GNAc pools expand
dramatically out of proportion compared with UDP-Glc. Such lopsided, excessive
accumulation of one nucleotide sugar may be detrimental to glycosylation.
A possible mechanism for glucosamine's negative impact on glycosylation site occupancy
is that accumulation of UDP-GlcNAc may cause accumulation of GlcNAc-P-P-dolichol,
depleting the dolichol which is also necessary to make Glc-P-dolichol and Man-P-
dolichol. The proposed mechanism is similar to the effect of UDP-GlcNAc:dolichol-P
GlcNAc-1-P transferase (GPT) overexpression discussed in the Literature Review. GPT
catalyzes the formation of GlcNAc-P-P-dolichol, and overexpression of this enzyme
leads to formation of truncated oligosaccharide precursors and a decrease in glycosylation
site occupancy (Waldman et al., 1987; Zhu et al., 1992). The dolichol linked sugars
mannose-P-Dol and glucose-P-Dol were depleted in cells overexpressing GPT, due to
excessive accumulation of oligosaccharide-P-P-Dol (primarily MansGlcNAc2-P-P-Dol)
(Rosenwald et al., 1990). The truncated MansGlcNAc2-P-P-Dol precursor is synthesized
165
directly from nucleotide sugars; the four mannoses and three glucoses which are normally
added to complete the precursor are added from dolichol linked sugars. The enzymes
catalyzing dolichol sugar formation (Man-P-Dol synthase and Glc-P-Dol synthase)
compete with GPT for a common pool of dolichol-P, and overexpression of GPT
depletes the dolichol-P needed for dolichol sugar formation. Excessive accumulation of
UDP-GlcNAc may mimic GPT overexpression by stimulating the synthesis of GlcNAc-
P-P-dolichol.
Although an attractive hypothesis, some evidence seems to contradict dolichol-P
depletion as the mechanism for glucosamine's negative impact on glycosylation.
Galactosamine feeding was found to cause accumulation of UDP-GNAc similar to
glucosamine feeding, but glycosylation was actually slightly enhanced (Pels Rijcken et al.,
1995a). Furthermore, 5 mM glucosamine caused truncated precursor oligosaccharide
synthesis in MDCK cells, while the same concentration of galactosamine did not
influence precursor synthesis or glycosylation (Pan and Elbein, 1982). Pels Rijcken et al.
(1995) suggest that such apparent contradictions may be caused by compartmentation of
separate pools of UDP-GNAc, with glucosamine-derived and galactosamine-derived
pools of UDP-GNAc maintained separately. Such compartmentation need not arise from
membrane barriers, but may be caused by multienzyme channeling of metabolites or
distinct cellular localization of related enzymes. An alternative explanation is that
glucosamine itself may inhibit glycosylation, rather than UDP-GlcNAc (Koch et al.,
1979). The finding that uridine enhances glucosamine's negative impact on glycosylation
implicates UDP-GlcNAc as the inhibitory compound, but it cannot be ruled out that
uridine may also cause higher intracellular glucosamine concentrations via an indirect
mechanism.
The sugar precursor feeding experiments confirmed that amino sugar formation plays an
important role in nucleotide sugar synthesis and glycosylation. In contrast, altering
166

hexose carbon sources had little impact on glycosylation site occupancy. Hexose
phosphates do not appear to normally limit nucleotide sugar synthesis or glycosylation.
6.2 Nucleotide Precursor Feeding
Since nucleoside triphosphates were implicated as regulators of nucleotide sugar
synthesis, nucleotide precursors were used as tools to manipulate nucleotide sugar
concentrations. Such experiments allowed us to examine the impact of nucleotide sugar
concentrations on glycosylation in non-starved cultures. The nucleotide sugars with the
greatest impact on glycosylation site occupancy are UDP-GlcNAc, GDP-Man and UDP-
Glc, since they are involved in the synthesis of the lipid-linked oligosaccharide precursor.
Therefore the nucleoside triphosphates most likely to impact site occupancy are UTP
and GTP.
6.2.1 Altered Nucleotide Levels and Glycosylation Site Occupancy with Exposure
to Nucleotide Precursors
The influence of nucleotide precursors on nucleotide sugar concentrations and
glycosylation site occupancy was analyzed by feeding y-CHO cells 1 mM each of orotic
acid, uridine, adenosine and guanosine. Orotic acid is an intermediate in the de novo
synthesis of pyrimidine nucleotides such as UTP and CTP, and orotic acid feeding has
been shown to increase pyrimidine pools in rat hepatocytes (Pels Rijcken et al., 1993).
Uridine can also be used to synthesize pyrimidine nucleotides, although through salvage
pathways rather than the de novo pathway (Pels Rijcken et al., 1993). Similarly,
adenosine and guanosine can be utilized via salvage pathways to make purine nucleotides
(Cory, 1992). After a two day exposure to the various precursors in serum-free,
suspension culture, glycosylation was monitored with radiolabeling and perchloric acid
extracts were collected for nucleotide analysis.
167

The impact of nucleotide precursors on intracellular nucleotide sugar concentrations is
shown in Table 6-2. Although orotic acid exposure led to elevated pyrimidine nucleotide
pools in rat hepatocytes (Pels Rijcken et al., 1993), we observed no increases in
pyrimidines with orotic acid feeding in our y-CHO cells. In contrast, exposure to 1 mM
uridine led to doubling of intracellular UTP and an 80% increase in CTP. It is not
surprising that CTP levels were affected by uridine feeding, since CTP is synthesized
directly from UTP (Cory, 1992). As expected, UDP-sugar concentrations increased in
response to the elevated UTP concentration, with UDP-GNAc increasing 63%, UDP-
Glc+GDP-Man increasing 129% and UDP-Gal increasing 135%.
Table 6-2. The effects of various nucleotide precursors on intracellular
nucleotide levels (mol/g viable dry cell weight).
+1 mM +1 mM +1 mM +1 mMControl orotic acid uridine adenosine guanosine
ATP 27.00+1.28 20.10+ 0.14 21.95±0.13 34.98+0.05 19.64±0.05
ADP 1.91+0.04 1.22+ 0.17 1.44+0.08 1.98±0.00 1.37+0.04
AMP 0.37+0.05 0.17+ 0.00 0.33+0.01 0.41±0.03 0.37+0.01
GTP 4.38+0.32 3.35+ 0.12 4.49±0.35 5.14±0.02 19.25+0.32
GDP 0.40+0.01 0.24+ 0.01 0.31±+0.01 0.43±0.05 1.03±0.19
CTP 2.63+0.39 1.96± 0.01 4.73+0.37 1.37±0.03 2.51±+0.35
UTP 6.67+0.58 5.30+ 0.15 13.35+0.35 3.36+0.08 4.40+0.06
UDP 0.90±0.04 0.44+ 0.02 0.95+0.06 0.46+0.01 0.84+0.18
UDP-GNAc 2.35+0.14 1.95+ 0.02 3.83+0.01 2.20+0.14 2.33+0.00
UDP-Glc + 0.68±0.05 0.74± 0.01 1.56+0.00 0.99±0.16 1.08±0.03GDP-Man
UDP-Gal 0.31_0.03 0.35+ 0.01 0.73+0.01 0.40_0.13 0.39±0.01
168

Adenosine caused an increase in purine nucleotides, but to a lesser degree than the
pyrimidine expansion observed with uridine feeding. ATP increased by 30% and GTP by
17% in cells fed 1 mM adenosine. The purine nucleotides ATP and GTP can be
interconverted through an inosine monophosphate (IMP) intermediate, which explains
why both ATP and GTP levels increased (Cory, 1992). Interestingly, adenosine also
caused a 50% reduction in UTP levels; the reason for this reduction is unclear. The
combined UDP-Glc+GDP-Man pool increased by 46% in response to adenosine feeding,
probably due to expansion of GDP-Man pools. Cells fed 1 mM guanosine had a
remarkable 340% increase in GTP concentration. Surprisingly, ATP concentrations did
not increase, which indicates that the purine nucleotides are not always kept in balance.
Guanosine feeding resulted in a 59% increase in the UDP-Glc+GDP-Man pool. Similar
to adenosine, guanosine caused a slight decline in UTP concentration, but the effect was
less pronounced.
The glycosylation site occupancy of IFN-y produced in the presence of the various
nucleotide precursors is tabulated in Table 6-3. Orotic acid had no effect on glycosylation
site occupancy, which was not surprising since nucleotide sugar concentrations were not
affected either. Uridine appeared to improve site occupancy slightly, although the
improvement was minor in comparison to the large increases in the UDP-GNAc and
UDP-Glc+GDP-Man pools (63% and 129% increases, respectively). Likewise,
guanosine improved slightly glycosylation site occupancy, probably as the result of a
59% increase in the UDP-Glc+GDP-Man pool. Despite a 46% increase in the UDP-
Glc+GDP-Man pool, adenosine negatively impacted glycosylation site occupancy.
Depletion of UDP-sugars does not appear to explain the poor glycosylation, since UDP-
GNAc concentrations were similar in adenosine fed and control cultures. The reason for
adenosine's negative impact on glycosylation remains unclear.
169

Table 6-3. The effects of various nucleotide precursors on secreted IFN-y
glycosylation site occupancy.
Glycosylation Sites Occupied (%)
2-sites 1-site O-sites
Control 76.7 + 1.5 20.4 + 1.2 2.8 + 0.5
+1 mM orotic acid 75.9 ± 1.3 21.4 + 0.9 2.7 + 0.7
+1 mM uridine 78.6 + 1.3 18.1 + 1.1 3.3 + 0.5
+1 mM adenosine 71.4 + 0.8 25.5 + 0.4 3.1 ± 0.5
+1 mM guanosine 79.2 + 1.0 18.1 + 0.7 2.8 + 0.4
6.2.2 Uridine Feeding in Fed-Batch Culture
The nucleotide precursor feeding experiment suggested that an increase in nucleotide sugar
concentrations can have a small positive impact on glycosylation site occupancy.
However, the experiment was conducted after a brief two day exposure to nucleotide
precursors, and glycosylation was not monitored with time. To understand how
nucleotide sugars influence glycosylation at various stages during fed-batch culture, a
nucleotide precursor-fed culture was monitored over an entire culture span. Uridine was
chosen as the nucleotide precursor, so that nucleotide sugar effects could be clearly
separated from cell growth effects. Over the course of a two day experiment, 1 mM
uridine did not affect cell growth or viability. In contrast, 1 mM adenosine and 1 mM
guanosine reduced cell growth by 25% over the two days. Subsequent experiments
confirmed that 1 mM guanosine negatively impacts y-CHO growth and viability, while
uridine up to 10 mM has little impact on cell growth.
Fed-batch cultures were analyzed with initial uridine concentrations of 2.5 and 10 mM.
At 75 hours an additional 1 mM uridine was added to account for consumption. Two
170

control flasks were also analyzed: a non-fed batch and a fed-batch, both without added
uridine. The feeding strategy was performed according to the stoichiometric fed-batch
technique with a modified RPMI-SFM initial medium as described in Materials and
Methods (Chapter 3). Differential product glycosylation was monitored daily with
pulse-radiolabeling, and perchloric acid extracts were collected for nucleotide analysis.
Extracts were collected during the four hour radiolabeling period so that observed
glycosylation patterns could be directly compared with measured nucleotide sugar
concentrations.
The differentially measured glycosylation site occupancy in the fed batch cultures is
shown in Figure 6-5. For most of the culture, the percentage of protein glycosylated at
both potential sites was about 4% higher than the control for the 10 mM uridine fed
cultures and about 2% higher for the 2.5 mM fed cultures (Figure 6-6 replots only the 2-
site glycosylated data to show this more clearly). As seen in Figure 6-7, cell growth was
minimally affected by the uridine treatment (regressed growth rates were 0.0176 /h for
the control, 0.0194 1/h for the 2.5 mM uridine flask and 0.0174 1/h for the 10 mM uridine
flask). Figure 6-8 shows that gamma interferon productivities were also identical at 1.4
pg/cell/day. Thus the improvement in product quality did not come at the expense of
product titer.
As in previous fed batch studies (see Chapter 4), glycosylation site occupancy declined
during the growth phase, with each of the fed batch cultures declining in parallel. Figure
6-9 and Figure 6-10 show that during this time nucleotide sugar concentrations were
increasing. The fact that nucleotide sugar concentrations increased while glycosylation
site occupancy decreased suggests that a step downstream of nucleotide sugar formation
caused the decline.
The fed batch experiments also confirmed the starvation behavior suggested in Chapter 5
based upon chemostat results. The batch control flask exhibited a classic glucose
171

2-site glycosylated
I
. . .50. 0 . . . .. 50 1O0 150 200
Figure 6-5. Differentially produced IFN-y glycosylation
monitored with pulse radiolabeling in fed-batch culture of y-CHO
cells with and without uridine supplementation.
172
AnO/UV -/0o
80%
70%/o
60%
50%
40%'
30%
20%-
10%'
0%:
C0
*Ib
co z
.en *LCD
0O ,Ban*_Q)tl:
X Fed Batch ControlO 2.5 mMl Uridine+ 10 mM Uridine* Batch Control
ated
0
Culture Time [h]
site occupancy
I
kC----L�·�p�kC1'I
- - - - . . .

50 100
Culture Time [h]
Figure 6-6. Percentage of IFN-y two-site glycosylated (monitored with pulse
radiolabeling) during fed-batch culture of y-CHO cells with and
without uridine supplementation.
173
85%
._C
.0LM-u-co Z
a eLOa> I
U-
0.C.) CD>11 W
0
4))Ln4)
80%-
75%-
70%-
65% -
60%0 150 200
I II l~~~~ ~ ~ ~ ~~~ ~ ~~~~~~~~~~~~~~~~~~~~~~~~~~~~~~~~~~~~~~~~l I
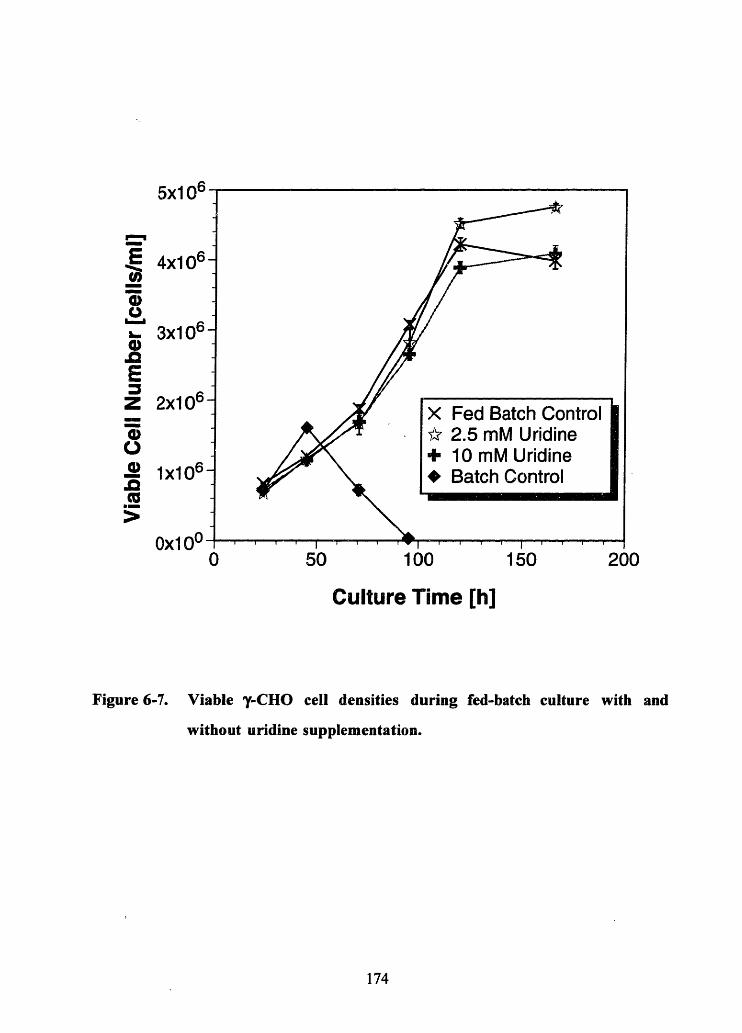
5x1
r-"
EL.I00-acu
E,
4x1
3x1
2x1
lx1
Ox10 50 100 150 200
Culture Time [h]
Figure 6-7. Viable y-CHO cell densities during fed-batch culture with and
without uridine supplementation.
174
I

1x101 1 2x10 11 3x10 11 4x101 1
Integrated Viable Cell Area (ICA)[viable cells*h/ml]
Figure 6-8. Gamma interferon productivity during fed-batch culture of y-CHO
cells with and without uridine supplementation.
175
30
25
20
1
1
L u
co
aC00
L
cEe.
EE
CD
IFN= 5.866E-1 1*ICA
:R2 = 0.987 xSpecific Productivity =
5.866E-11 mg/cell/h =
1.41 pg/cell/d
X Fed Batch Control/ A 2.5 mM Uridine I+ 10 mM Uridine
5
0
5
0
Oxl 00 5x10¹¹

0 50 100 150
Culture Time [h]
Figure 6-9. Changes in intracellular UDP-GNAc concentration during fed-batch
culture of 7-CHO cells with and without uridine supplementation.
176
Q ~J
30
25
20
15
10
5
L)
0E
0
I
I
0200
r2

.4 %
C] >
cm
:+ -a bL.lA
0 50 100 150 200
Culture Time [h]
Figure 6-10. Changes in intracellular UDP-Glc+GDP-Man concentration during
fed-batch culture of y-CHO cells with and without uridine
supplementation.
177
ie

limitation, as is shown in the plot of glucose vs. time in Figure 6-1 1. At 45 hours the cells
were still 98% viable, but the secreted interferon was 73% non glycosylated (Figure 6-5).
At this time nucleotide and nucleotide sugar levels were much lower than normal (Figure
6-9 and Figure 6-10). The data confirm that intracellular nucleotide concentrations
decrease during glucose starvation, and this decrease is probably the cause of decreased
nucleotide sugars and poor glycosylation. The results in Chapter 5 also indicated that
during glutamine limitation the formation of amino sugars limits UDP-GlcNAc formation
and glycosylation. HPLC amino acid analysis indicated that the first samples of the fed
batch cultures were glutamine limited as a result of underfeeding (Figure 6-12). Despite
high UTP concentrations, the UDP-GlcNAc concentrations were low and glycosylation
was lower than expected for these samples, consistent with amino sugar formation
limiting UDP-GlcNAc synthesis.
In addition to affecting glycosylation site occupancy, nucleotide sugars may influence the
structure and composition of the attached oligosaccharides (glycosylation
microheterogeneity). The microheterogeneity of the accumulated IFN-y produced during
the first 144 hours of the fed-batch cultures was analyzed by Dr. Jfeng Zhang using
chromatography and matrix-assisted laser-desorption ionization/time-of-flight
(MALDI/TOF) mass spectrometry (Gu et al., 1997; Harmon et al., 1996). The site-
specific oligosaccharide heterogeneity at Asn-25 and Asn-97 are presented in Table 6-4.
As the concentration of uridine increased, the antennarity and sialylation of
oligosaccharides at both Asn-25 and Asn-97 decreased. Because the fed-batches all had
high viabilities and similar growth kinetics, the changes in microheterogeneity were
attributed to altered nucleotide sugar concentrations.
178

X Fed Batch Control* 2.5 mM Uridine+. 10 mM Uridine* Batch Control I
_fW~5I0~~'i'I~~- - -50 100
Culture Time [h]
Figure 6-11. Glucose concentration during fed-batch culture of y-CHO cells with
and without uridine supplementation.
179
_'l
E
fiC
ISCD60
CLu000Ca0a0'U,
12-
10-
8-
6-
4-
2-
('U
0 150 200
;Lk
.
1 -ra� I-11I� Ir
4A1-iId
__ .. __. .B. _.

.2EIsC
I-0oi0C0
E
Figure 6-12.
0 50 100 150 200
Culture Time [h]
Glutamine concentration during fed-batch culture of y-CHO cells
with and without uridine supplementation.
180
I

Site-specific oligosaccharide microheterogeneity of IFN-y secreted
during fed-batch culture of -CHO cells with and without uridine
supplementation.
IFN-y oligosaccharide
Uridine [mM] tetraantennary triantennary
0.0
2.5
10.0
0.0
2.5
10.0
19.4%
14.7%
8.89%
3.89%
2.47%
0.00%
24.3%
22.4%
18.7%
14.4%
7.80%
4.30%
microheterogeneity
biantennary sialylation
56.3%
62.9%
72.4%
81.7%
89.7%
95.8%
94.3%
92.3%
88.1%
78.7%
72.5%
67.6%
Nucleotide sugar availability is one of several factors winch may influence glycosylation
site occupancy. As discussed in Chapter 2, site occupancy can also be affected by
dolichol availability, glycosyltransferase activities, oligosaccharyltransferase activity, and
competition with protein folding. Understanding how nucleotide sugars influence
glycosylation requires an understanding of how nucleotide sugar levels interact with other
factors influencing glycosylation.
Figure 6-13 presents a "tank and valve" analogy to help visualize how nucleotide sugar
levels are related to glycosylation site occupancy. In this analogy the intracellular
nucleotide sugar concentration is represented as a liquid level in a tank. The nucleotide
sugars influence the glycosylation flux to protein through a series of "valves" which
181
Table 6-4.
Asn-25:
Asn-97:
6.2.3 Discussion
-

U-
E o
O -r... - ----- ---.----.
C') t aC
9 c- r4-0 ll +
uo!l1AsooAl6
co.P" : t
r O '
= .
a) :CD ! 'a
e
2 Uo!lelASOOA16
no..
a Eo co
- C o
U) - I -Ico = O II
O
0a-Z >Ž
a) co
E-.
0 ._r- CC >
Figure 6-13. Conceptual schematic of the initial N-linked glycosylation steps.
The nucleotide sugar pool is considered as a liquid in a tank, with
the height corresponding to the nucleotide sugar concentration.
182
- -L1 ZA~~~~~~~~~~~~0Y. . . . . . . . . . . . .
011
jL-
b cis C
I
i
0 -M OM - -- -- - -- -- -

represent downstream step(s) influencing glycosylation, such as dolichol availability,
oligosaccharyltransferase activity, etc. If the "valve positions" remain constant, then the
liquid level (nucleotide sugar concentration) represents a driving force which should
influence the flow rate (glycosylation flux), assuming the tank is not "overflowing." Thus
for given valve settings, increasing the liquid level (e.g. feeding uridine to increase UDP-
sugars) should lead to an increase in flow (glycosylation flux). For the uridine fed-batch
experiment, the case of constant downstream limitations can be considered by comparing
cultures with different uridine concentrations at the same culture time. Each time point
should represent similar downstream limitations for each culture, since cell growth and
product formation were essentially identical. Figure 6-14 shows that for a given set of
downstream limitations there is a weak positive correlation between nucleotide sugar
concentrations and glycosylation site occupancy. Increasing nucleotide sugars for a given
set of downstream limitations can lead to modest improvement in glycosylation.
In the tank and valve analogy, changes in downstream limitations are represented as
changes in valve settings. As valve settings change, the flow rate will change, causing
changes in the tank's liquid level. For example, when a valve is slowly closed (when
downstream factors limit glycosylation), the out-flow (glycosylation flux) is reduced and
the tank liquid level (nucleotide sugar concentration) will increase since out-flow is
reduced, while in-flow remains the same. In this manner the liquid level will rise, working
to counteract changes in flow caused downstream. Thus if factors downstream of
nucleotide sugar formation are dominating glyccsylation flux, then glycosylation should
vary inversely with nucleotide sugar concentrations. We found this to be the case as
glycosylation site occupancy changed with time during fed-batch culture (Figure 6-15).
Therefere the decline in site occupancy with time during exponential growth is due to
steps downstream of nucleotide sugar formation.
In addition to affecting glycosylation site occupancy, uridine feeding influenced the
structure and composition of the attached oligosaccharides (glycosylation
183
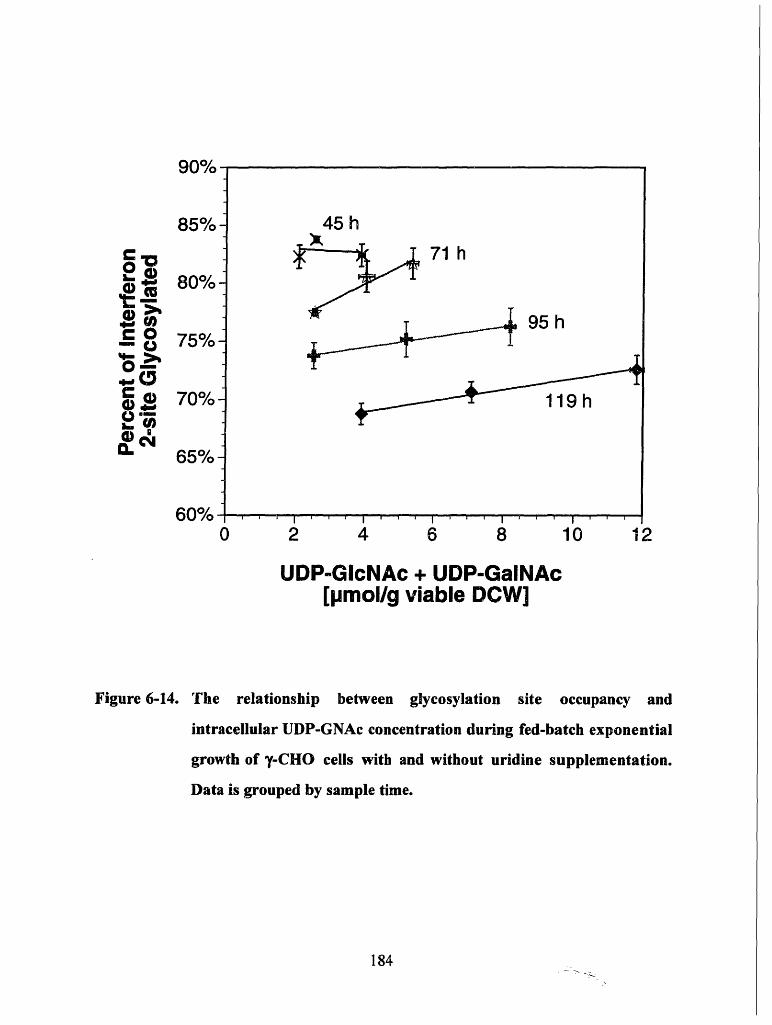
r' /' /ZU 7o
85%
O 80%
- o 75%
4 qC 70%
65%
60%0 2 4 6 8 10 12
UDP-GlcNAc + UDP-GalNAc[pmol/g viable DCW]
Figure 6-14. The relationship between glycosylation site occupancy and
intracellular UDP-GNAc concentration during fed-batch exponential
growth of y-CHO cells with and without uridine supplementation.
Data is grouped by sample time.
184

0 2 4 6 8 10
UDP-GIcNAc + UDP-GalNAc[pmol/g viable DCW]
Figure 6-15. The relationship between glycosylation site occupancy and
intracellular UDP-GNAc concentration during fed-batch exponential
growth of y-CHO cells with and without uridine supplementation.
Data is grouped by supplemental uridine concentration.
185
nqo/VU 70
85%
l_
C O
Q
&) Ml
80%
75%
70%
65%
60%12

microheterogeneity). As the uridine concentration increased, terminal sialylation and
branching of the attached oligosaccharides decreased. Pels Rijcken et al. (1995b) observed
decreased glycoconjugate sialylation with uridine feeding of rat hepatocytes, and they
suggested that accumulation of UDP-sugars such as UDP-GNAc and UDP-Glc may
interfere with transport of CMP-NeuNAc across the Golgi membrane. This hypothesis
was based upon the observation that UDP-sugars inhibit CMP-NeuNAc transport in
isolated mouse liver microsomes (Carey et al., 1980).
The decreased oligosaccharide branching observed with uridine feeding is more difficult to
explain. The GlcNAc-transferases control branching (Schachter, 1986; Umafia and Bailey,
1997), and one might expect an elevated UDP-GlcNAc concentration to increase
branching during uridine exposure. However, uridine feeding also elevates the intracellular
UDP-Gal concentration, and once a galactose residue is transferred to an oligosaccharide it
is no longer a substrate for GlcNAc-transferases (Schachter, 1986). The
galactosyltransferase (GalT) enzyme is mainly localized in the trans Golgi, while
GlcNAc-transferase is in the medial Golgi, and so these enzymes do not normally
compete for substrate. Branching is typically determined before the glycoprotein
encounters the GalT in the trans Golgi. It is possible, nevertheless, that small amounts of
GalT in the medial Golgi are active, and that an elevated UDP-Gal concentration results in
premature oligosaccharide galactosylation.
6.3 Conclusions
The influence of nucleotide sugars on glycosylation site occupancy was investigated by
feeding nucleotide sugar precursors. Consistent with the hypothesis that hexose
phosphates are not normally limiting for nucleotide sugar formation or glycosylation,
feeding various hexoses did not alter glycosylation site occupancy. Feeding the amino
sugar glucosamine, on the other hand, led to accumulation of UDP-GNAc and alterations
in glycosylation. Glucosamine feeding experiments confirmed that amino sugar formation
186

is an important regulatory step in UDP-GNAc synthesis. Excessive accumulation of
UDP-GNAc with glucosamine feeding led to lower glycosylation site occupancy,
possibly due to dolichol phosphate depletion.
Nucleotide sugar concentrations were also altered by feeding nucleotide precursors.
Uridine and guanosine both increased nucleotide sugar concentrations and glycosylation
site occupancy, but guanosine was also slightly toxic to the cells. Uridine feeding
increased UTP and UDP-sugar concentrations without impacting cell growth or
productivity. A fed-batch experiment demonstrated that feeding 10 mM uridine can
slightly increase site occupancy. However, a three-fold increase in UDP-GNAc lead to
only a 4% increase in the percentage cf interferon that was two site glycosylated,
indicating that nucleotide sugars have a small impact on glycosylation site occupancy in
non-starved cultures. Finally, the gradual decline in glycosylation site occupancy
observed during exponential growth (Chapter 4) is caused by a step downstream of
nucleotide sugar formation, as nucleotide sugar concentrations actually increased during
this time.
187


7. Quality Control of Secreted Glycoproteins via Molecular
Chaperones
Previous chapters focused on how metabolism affects the fraction of potential
glycosylation sites which receives oligosaccharide. By understanding how metabolism
influences the availability of sugar donors, we hoped to devise strategies to increase the
concentration of oligosaccharide precursors, thereby increasing the extent of the
oligosaccharyltransferase reaction. Rather than improving the efficiency of the initial
glycosylation reaction, an alternative strategy for improving product quality is to
manipulate the cell's normal "quality control" mechanisms. The quality of the secreted
product could be improved by preventing the secretion of non-glycosylated product. A
quality control mechanism based upon the rate of protein folding is in place in the
endoplasmic reticulum which may allow underglycosylated proteins to be selectively
identified and retained for degradation.
Quality control mechanisms in the endoplasmic reticulum prevent the secretion of
improperly folded proteins. When a protein folds too slowly, chaperone proteins, which
normally prevent aggregation and non-productive folding pathways by binding to
unfolded polypeptides, remain bound until the protein is eventually degraded. Typically,
proteins that are underglycosylated have more trouble folding than their fully
glycosylated counterparts (see Chapter 2). Underglycosylated proteins are therefore
more likely to be complexed to chaperones and degraded. Chaperone proteins may thus
provide a method for identifying and retaining underglycosylated proteins. Increasing the
concentration of chaperone protein should result in more chaperone/unfolded protein
complexes with a corresponding increase in protein degradation. Because slowly folding
species would be more susceptible to chaperone complexing, underglycosylated proteins
189-

should be complexed and degraded to a larger extent than their fully glycosylated
counterparts. Hence the secreted product will have a higher percentage of glycosylation.
In order to examine the implications of this hypothesis further, it is helpful to develop a
mathematical model for protein secretion from the endoplasmic reticulum. This chapter
presents a model for the chaperone BiP and its role in mediating the secretion of
glycoproteins. The model is used to study the feasibility of overexpressing BiP to
influence protein quality.
7.1 Background
BiP, also known as GRP78, is one of the most abundant and intensively studied
chaperone proteins in the endoplasmic reticulum (other ER chaperones include GRP94
and calnexin). BiP derives its name from the fact that it was initially identified as the
immunoglobin heavy chain binding protein (Haas and Wabl, 1983). Subsequent
investigation found that BiP was identical to the glucose regulated protein 78 (GRP78), a
member of a family of stress related proteins which also includes heat shock proteins
(HSPs). Stress proteins were identified based upon their induction under a variety of
cellular stresses, including heat shock (HSPs), exposure to amino acid analogues (HSPs),
anoxia (GRPs followed by HSPs upon reoxygenation) and glucose starvation (GRPs
followed by HSPs upon glucose addition) (Beckmann et al., 1990; Sciandra and Subjeck,
1983). BiP has also been observed in association with non-glycosylated proteins in CHO
cells treated with tunicamycin, an inhibitor of N-linked glycosylation (Dorner et al.,
1987).
A common theme of induction is the accumulation of misfolded or partially denatured
proteins (Hartl et al., 1992). BiP has been observed in association with misfolded
proteins under such conditions (Gething et al., 1986; Kassenbrock et al., 1988). Peptide
binding experiments have shown that BiP binds preferentially to stretches of
hydrophobic residues in an environment that appears to be energetically equivalent to the
190

interior of a folded protein (Flynn et al., 1991). Recent work has identified a BiP binding
motif consisting of three or four hydrophobic residues in alternating positions (Blond-
Elguindi et al., 1993a; Flynn et al., 1991; Gething et al., 1994). BiP is believed to interact
transiently with all proteins as they enter the ER, aiding the folding process by
preventing inappropriate interactions between hydrophobic regions of unfolded
polypeptide. BiP does not accelerate folding, but prevents non-productive folding and
aggregation (Puig and Gilbert, 1994). BiP may also play a role in oligomer formation, as it
seems to associate with regions that form subunit interfaces (Gething and Sambrook,
1992). ATP hydrolysis is necessary for BiP to release the polypeptide, allowing it to
either fold or oligomerize into a more energetically favorable conformation. BiP binds
more permanently to misfolded proteins or aggregates by binding to exposed hydrophobic
regions.
Proteins which remain associated with BiP for an extended period are ultimately targeted
for degradation (Knittler et al., 1995; Schmitz et al., 1995). Such proteins are typically
folding mutants or underglycosylated proteins which do not fold effectively. Extent of
association with BiP has been correlated to secretion efficiency for several recombinant
proteins (Dorner et al., 1993). Studies with separate CHO cell lines producing three
different proteins (tPA, factor VIII and von Willebrand factor) correlated under utilization
of N-linked glycosylation sites to increased association with BiP and decreased secretion
efficiency (Dorner et al., 1987). Subsequent studies indicated that when levels of BiP
were decreased by co-expressing an antisense BiP gene, secretion of nonglycosylated tPA
increased proportionally (Domer et al., 1988). Overexpression of BiP, on the other hand,
lead to selective retention of proteins which normally transiently associated with BiP
(factor VIII and von Willebrand factor) (Domer et al., 1992). Secretion of M-CSF, which
was not detected in association with BiP, was not affected by BiP overexpression. The
influence of the ER BiP concentration on protein secretion correlated with the stability of
the BiP-nascent protein complex. As discussed above, the stability of the BiP-protein
complex is a function of the protein folding rate. Since underglycosylated proteins
191

typically fold more slowly and therefore associate with BiP to a greater extent, secretion
of underglycosylated proteins is more likely to be affected by altered BiP concentrations.'
Normally, the concentration of BiP in the ER is tightly regulated. The fact that
accumulation of misfolded proteins stimulates BiP expression suggests a homeostatic
mechanism of regulation similar to that proposed for HSP70 (Beckmann et al., 1990;
Blond-Elguindi et al., 1993b; Craig and Gross, 1991; DiDomencio et al., 1982). In this
model the amount of unbound BiP determines the rate of gene expression. The
mechanism for sensing the amount of unbound BiP may be related to the extent of
modification of BiP. BiP exists in vivo as an interconvertible pool of phosphorylated and
adenylated oligomers and unmodified monomers (Freiden et al., 1992). Only unmodified
monomers are found in complexes with unfolded proteins (Hendershot et al., 1988), and
binding of peptide results in the conversion of modified oligomers to unmodified
monomers (Blond-Elguindi et al., 1993b). Blond-Elguindi et al. (1993b) have proposed
that the modified oligomers may represent a storage pool, and that the amount of
unbound BiP is monitored by monitoring the size of this pool relative to the unmodified
monomers. Under conditions where many misfolded proteins are present, gene
expression is stimulated in order to maintain an adequate storage pool of modified
oligomers.
7.2 Model Development
7.2.1 Model Structure
A successful model for protein secretion from the ER must incorporate information from
the experimental evidence discussed above. Figure 7-1 presents a schematic illustration
for a model describing the interaction of BiP with a single folding species. In this model a
newly synthesized poiypeptide (P) can either fold productively to form an active species
(F), be complexed to BiP (BP) or form an aggregate (A). BiP complexed proteins may be
released with the simultaneous hydrolysis of ATP or they may be degraded (D) at a set
192

<4 I
.-co
-cr
LL
a)
10
U)V)~CO
Figure 7-1. Schematic of a single species model for BiP mediated protein
folding, secretion and degradation (B = BiP; P = unfolded
polypeptide; BP = BiP/unfolded polypeptide complex; F = folded
polypeptide; A = unfolded polypeptide aggregates; D = degradation
products).
193
I
%

rate. Experimental observations indicate that a large percentage of BiP is recycled when
the bound polypeptide is slated for degradation (Freiden et al., 1992). This model
assumes complete recycling of BiP for simplicity. It is apparent from this model that
unfolded polypeptides can undergo a series of binding ald release by BiP, and that tile
extent to which the protein folds productively will depend upon the relative rate of
folding compared to the rates of aggregate formation and BiP mediated degradation.
Another assumption implicit in the model is that once the protein assumes its correctly
folded structure, it will no longer associate with BiP and will be secreted.
Extension of this model to account for multiple folding species is conceptually straight-
forward. The same basic reactions illustrated in Figure 7-1 are assumed possible, but now
we must keep track of multiple folding species. For the case of a single protein with one
glycosylation site that is variably occupied there are two folding species. In the following
discussion the subscript 0 represents the nonglycosylated form, while 1 represents the
glycosylated form. The unfolded protein complex formation and disruption reactions are
now:
B+ P kbO )BPo
B+ P -kb- BP
BP o+ ATP kro B + Po + ADP + Pi
BP, + ATP krl + P + ADP+ Pi
where Pi represents the phosphate released during the hydrolysis of ATP to ADP. The
protein folding reactions are:
P, kfl F,
Aggregation is accounted for through the following expressions:kaOO kaOIPo +P(, Po + P, ( AkdisG0 kdis0l
kall
P,+PI " AIkdsl I
194

Finally, degradation of proteins is considered through the following reactions:
BP ° kdO D+B
BP, kdl >D+B
A kdaOO 2D A kdaO ) 0l2DkAa00 0 1> 2D
In order to put the model reactions presented above into a mathematical framework,
species balances can be performed. An overall BiP balance yields:
(i) [B]total = [B] + [BPo] + [BPI]
Species balances for the remaining species gives:
(ii d[P] = synthesiso + krO [BPo] [ATP] - kbO [B] [Po] - kfO [Po]- 2ka00 [P] 2 +(ii) dt
2kdisOO [Aoo] - kaO 1 [P] [Po ] + kdisO [A ]
d[P_] = synthesis + krl [BP ] [ATP] - kbl [B] [P ] - kfl [PI] - 2kal 1 [P ]2 +(iii) dt
2kdisl 1 [Al,] - kaOl [PO] [P ]+ kdis0l [A, ]
(iv) d[BP] = kbO [B] [PO] - krO [BPo] [ATP] - kdO [BPo]dt
(v) d[BP] = kbl [B] [P ]- krl [BP, ] [ATP] - kdl [BP,]dt
(vi) d[F°] = kfO [Po] - exitodt
(vii) = kfl [P ] - exit,dt
(viii) d[A °°] = kaOO [po]2 _ kdis00 [Aoo] - kda00 [Aoo]dt
(ix) d[A°'] = kaOl [Po] [PI]- kdisOl [Ao,]- kdaOl [Ao]dt
(x) [dd[A,,] = kal 1 [p ] 2 - kdisl 1 [A,] - kdal 1 [Al ,]dt
dtD] = kdO [BP]+ kdl [BP1 ]+ 2kda00 [Ao] + 2kda0l [Ao 1 ]+ 2kdal 1 [A]- degrade
195

Given appropriate initial conditions equations (i) through (xi) could in principle be solved
to obtain a solution for protein secretion (exit and exitl) with time. In this analysis,
however, the steady-state solution is obtained by setting all of the time derivatives to
zero. Equations (i) and (iv) through (x) allow all of the independent variables to be solved
in terms of exito and exitl. Equations (ii) and (iii) are then solved simultaneously to
determine exit and exitl.
Solving the model for the steady state solution also requires an assumption to be made
concerning the concentration of BiP. As discussed above, there is accumulating evidence
to support a homeostatic mechanism of BiP regulation. The evidence suggests that cells
will alter gene expression to maintain a relatively constant supply of BiP not complexed
to nascent polypeptides. Thus for wild-type cells the level of uncomplexed BiP ([B]) is
specified and the total BiP ([B]total) is solved for as an unknown using equation (i).
In contrast to wild-type cells, cells overexpressing BiP from a plasmid would be expected
to have overcome the homeostatic regulation mechanism. One would expect that the cells
would shut down endogenous BiP synthesis due to the negative feedback from having
excess free BiP in the ER from plasmid expression. Experimental evidence suggests that
this is indeed the case: overexpression of BiP mitigates the stress induction of BiP in
CHO cells (Dorner et al., 1992). In this case the total BiP concentration will be specified
([B]total) by the level of plasmid expression, and the uncomplexed BiP ([B]) is solved for
as an unknown using equation (i). Both wild-type expression and overexpression from a
plasmid will be considered in the following sections.
7.2.2 Parameter Estimation
Solving the above equations requires estimates for the kinetic rate constants. Estimates
for some parameters can be obtained from in vitro studies, while for others only very
crude estimates are available. In practice the oligosaccharide of a glycoprotein may affect
196

several of the kinetic rate constants including the BiP complexing reaction (kb), the
aggregate formation reactions (ka) and the protein folding reaction (kf). In order to limit
the current study to the relationship between protein folding rate and secretion, however,
only the folding rate constants are assumed to vary between the glycosylated species. All
other kinetic parameters are assumed identical.
The rate of BiP/polypeptide complex formation (kb) is an important parameter for which
there is unfortunately very little experimental data. Studies of BiP/polypeptide
complexing ordinarily use ATP hydrolysis as an endpoint. The ATP hydrolysis step is
generally considered to be limiting as opposed to the initial BP complex formation. Thus
the quantity being measured in these studies is the rate of ATP hydrolysis, kr. Complex
formation should have kinetics similar to second order aggregation kinetics. As a crude
estimate, complex formation is assumed to occur at 106 M- s- which is of the order of
magnitude of in vitro aggregation for lactic dehydrogenase (Zettlmeissl et al., 1979).
The rate of ATP hydrolysis is found to be saturable with respect to ATP concentration.
The Km for ATP is on the order of 10 gM (Flynn et al., 1989). The intracellular ATP
concentration in batch hybridoma culture was found to be constant at 4.2 m M
(Sonderhoff et al., 1992). Similarly, the ATP concentration in our y-CHO cells is
typically fairly constant around 23 gmol/g viable dry cell weight (6.0 mM intracellular
concentration). ATP is transported into the ER via a protein mediated translocation
mechanism which can concentrate ATP in the lumen of isolated vesicles up to 30 times
(Clairmont et al., 1992). Thus the conce otration of ATP in the ER should be saturating
(it should be in the mM range while the Km is in the gM range), and the rate of ATP
hydrolysis by BP complexes should be at Vmax. For short peptides kcat is found in in
vitro studies to be 0.16 (mol ATP)/(mol BiP)/min (Blond-Elguindi et al., 1993b; Flynn et
al., 1989), and an in vitro study with denatured lysozyme found kcat = 0.35 (mol
197

ATP)/(mol BiP)/min (Puig and Gilbert, 1994). Thus the quantity krO [ATP] = krl [ATP]
is taken to be 0.35 (mol ATP)/(mol BiP)/min.
The protein folding rate (kf) will vary extensively from one protein to another. The
dominant time constant for protein folding has been reported to vary from 1-1000 s
(Ptitsyn and Semisotnov, 1991). The refolding of lysozyme had a rate constant of kf =
0.039 i/min uncatalyzed and kf = 0.31 1/min when catalyzed by PDI (Puig and Gilbert,
1994). In order to reflect the difficulty underglycosylated proteins face in folding, kf0
was set to 0.1 1/min, while kfl for the glycosylated species was set at 10 1/min.
As discussed previously, an in vitro example of protein aggregation was found to have a
second order rate constant on the order of 106 M'ls -1 (Zettlmeissl et al., 1979). As
Robinson and Lauffenburger (1996) point out, the in vivo rate of aggregation is likely to
be significantly less. The presence of chaperones other than BiP (e.g. GRP94, calnexin,
PDI, etc.) should serve to reduce the in vivo aggregation significantly. For the purpose of
the model kaOO = kaOl = kal 1 = 102 M-ls- 1. The aggregate formation is assumed to be
only slightly reversible, with kdis = 0.001 1/min.
An estimate for the rate of protein degradation can be obtained from literature reports on
the in vivo degradation kinetics of secretion incompetent proteins. Ig heavy chains were
degraded with a half time of about 6 hours in Ag8(8) cells not producing light chains
(Freiden et al., 1992). Similarly, light chains in NSl cells not producing heavy chains
were degraded with half lives varying from 1 to 4 hours (Knittler et al., 1995). In CHO
cells overexpressing BiP, the half-life of retained von Willebrand factor was more than 6
hours (Dorner et al., 1992). Based upon these literatur, estimates, the first order
degradation constant was taken as kd = 0.002 /min (half life of 5.8 hours). The
degradation of aggregated protein (kda) was assumed to occur at this same rate.
Additional parameters which must be estimated in order to solve the model include the
protein synthesis rate and the concentration of BiP in the ER. The overall synthesis rate
198
for proteins in the ER can be estimated based upon the number of ribosomes bound to the
rough endoplasmic reticulum (Flynn et al., 1989). The average number of bound
ribosomes in a rat hepatocyte was found to be 13 x 106, and the volume of the ER was
calculated as 470 x 10-15 liters (Weibel et al., 1969). Given that each bound ribosome
contributes one nascent polypeptide chain, the concentration of nascent polypeptide in
the ER is approximately 50 ugM. If an average secretory protein is 400 amino acids
(Robinson and Lauffenburger, 1996) and protein translation in eukaryotes occurs at
approximately 6 amino acids/second (Haschemeyer, 1976), then protein synthesis will
take about 1 minute on average. Thus the nascent protein synthesis rate is approximately
50 gM/min.
Literature estimates for the amount of BiP in the ER range between 5 and 10% of the
lumenal content of the ER (Gething and Sambrook, 1992; Mori et al., 1992). We have
estimated the BiP concentration in our y-CHO cells as approximately 2-7% of total
protein based upon quantitative Western blots (the absolute BiP concentration could not
be determined unambiguously, because the assay was found to vary depending upon the
antibodies used in the Western blot). The average total protein for this cell line is 350
pg/cell and the volume of the ER can be estimated at between 250 x 10-15 liters (for BHK
cells (Griffiths et al., 1984)) and 470 x 10- 15 liters (for hepatocytes (Weibel et al., 1969)).
If BiP is assumed to account for 2% of cellular protein, this provides an estimate of
between 0.19 and 0.36 mM BiP. A similar estimate is obtained for yeast cells if one
assumes BiP comprises 1% of total cellular protein and an average yeast contains 6 pg
protein/cell (Robinson and Lauffenburger, 1996). The volume of a yeast ER can be
estimated as -10% of the total yeast volume, where a typical yeast volume is 40 x 10-15
liters. This estimate yields 0.19 mM BiP. A value of 0.2 mM was used as a total BiP
concentration in the simulations.
199

7.3 Model Results
Quantitative predictions of protein secretion are not feasible given the uncertainty
involved in many of the parameter estimations. The model may be used effectively,
however, to study qualitative predictions concerning the relationship between
glycosylation (i.e. protein folding rates) and protein secretion. When studying the effects
of glycosylation it will be helpful to define the oligosaccharyltransferase (OST)
efficiency:
OST Efficiency = Glycosylated Product Synthesis RateTotal Product Synthesis Rate
The OST efficiency refers to the efficiency of the transfer of precursor oligosaccharides to
a potential glycosylation site during protein synthesis (i.e. the efficiency of the
oligosaccharyltransferase reaction). An efficiency of 1 means the glycosylation site is
always occupied, while 0 indicates that the protein is not glycosylated. In terms of the
mathematical model, synthesis = (OST efficiency) x (total protein synthesis) and
synthesist = (1-OST efficiency) x (total protein synthesis).
Figure 7-2 illustrates the predicted relationship between OST efticiency and total BiP
concentration for a wild-type cell (recall that a wild-type cell will maintain a constant
amount of uncomplexed BiP by varying the total BiP concentration). This figure
illustrates that as OST efficiency decreases, more BiP is comlplexed to protein and hence
synthesis of BiP is induced. This trend is supported by experimental data where the
OST efficiency is decreased by adding the glycosylation inhibitor tunicamycin (Figure 7-
3). Tunicamycin inhibits the formation of the lipid-bound oligosaccharide precursor, and
hence inhibits glycosylation. Figure 7-3 demonstrates that BiP is synthesized in response
to glycosylation inhibitor treatment. Similarly, we found that BiP synthesis was induced
at the end of batch culture when glycosylation site occupancy deteriorated due to glucose
starvation (see Chapter 4). The model correctly accounts for changes in BiP
concentration in response to changes in glycosylation.
200

§00.4.
4)0
8
m
0
0.0 0.2 0.4 0.6 0.8
Oligosaccharyltransferase Efficiency
1.0
Figure 7-2. Model simulation of total BiP concentration versus
oligosaccharyltransferase (OST) efficiency in a wild-type cell
maintaining a constant level of uncomplexed BiP.
a)N
EOzC
-O.
3.m
m
ca- o o .. '
o E o E o E0 co U CIS O CU
._ ._ ._C C C
Figure 7-3. Experimental data for the
in the presence of the
Igg/ml).
induction of BiP synthesis in y-CHO cells
glycosylation inhibitor tunicamycin (10
201

10
81
o
eo
=20
0aL 2(
0.0 0.2 0.4 0.6 0.8 1.0
Oligosaccharyltransferase Efficiency
Figure 7-4. Model simulation of BiP overexpression: secreted product
glycosylation vs. oligosaccharyltransferase (OST) efficiency with
varying total BiP concentrations.
The model can also be used to predict the consequences of overproducing BiP. Figure 7-4
shows the relationship between the OST efficiency and the glycosylation characteristics
of the secreted product. As the concentration of total BiP is increased, the secreted
product has a higher percentage of glycosylation. The secreted product's glycosylation
pattern is also less sensitive to changes in OST efficiency. The secreted product
glycosylation can remain at high levels despite shifts in the efficiency of the
oligosaccharyltransferase reaction, because the underglycosylated protein is selectively
retained and degraded.
202
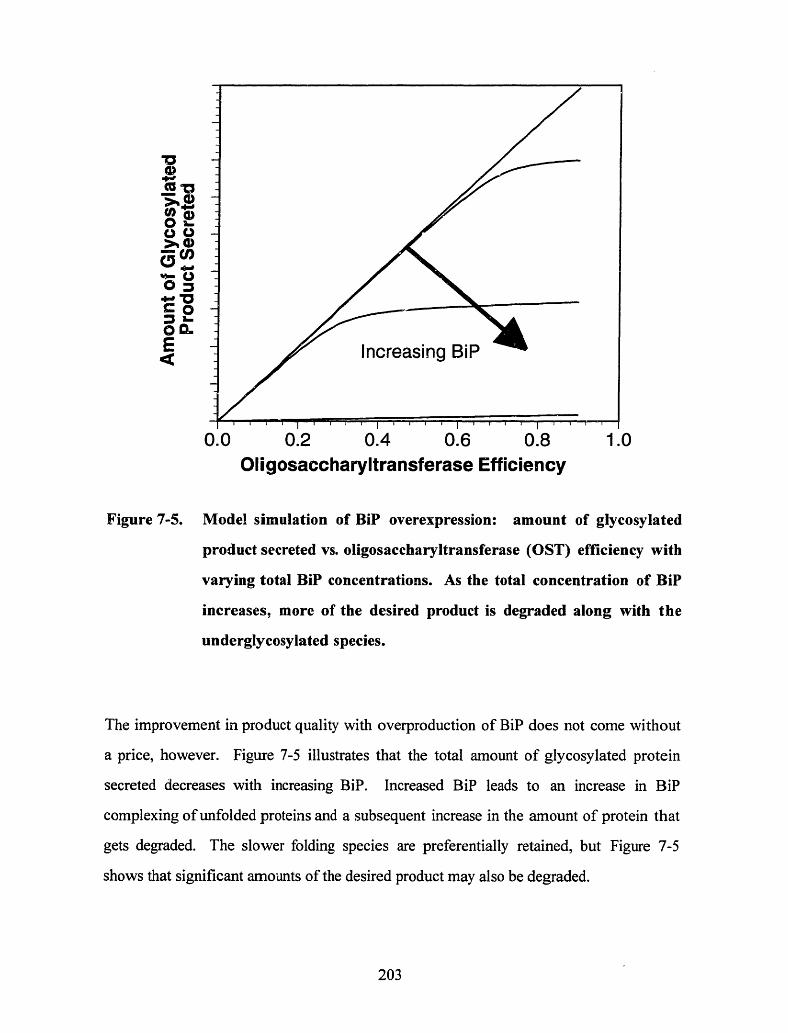
a?
-0 0
4Q.
O E46- 'a:
CE
0.0 0.2 0.4 0.6 0.8 1.0Oligosaccharyltransferase Efficiency
Figure 7-5. Model simulation of BiP overexpression: amount of glycosylated
product secreted vs. oligosaccharyltransferase (OST) efficiency with
varying total BiP concentrations. As the total concentration of BiP
increases, more of the desired product is degraded along with the
underglycosylated species.
The improvement in product quality with overproduction of BiP does not come without
a price, however. Figure 7-5 illustrates that the total amount of glycosylated protein
secreted decreases with increasing BiP. Increased BiP leads to an increase in BiP
complexing of unfolded proteins and a subsequent increase in the amount of protein that
gets degraded. The slower folding species are preferentially retained, but Figure 7-5
shows that significant amounts of the desired product may also be degraded.
203
7.4 Discussion
This chapter proposes a mathematical model for BiP mediated folding and secretion from
the endoplasmic reticulum. In this model a newly synthesized polypeptide can either
fold productively to form an active species, be complexed to BiP or form an aggregate.
BiP complexed proteins may be released with the simultaneous hydrolysis of ATP or
they may be degraded at a set rate. In order to explore how glycosylation might influence
protein secretion the model was solved for two species. The species were considered
identical except that the underglycosylated protein was assigned a slower folding rate than
its fully glycosylated counterpart.
As expected, the model was able to predict the wild-type behavior that as the OST
efficiency decreases, the level of total BiP increases. The model was designed under the
assumption that cells will regulate BiP expression to maintain a constant amount of BiP
uncomplexed to protein. A more slowly folding protein will lead to an increase in BiP
complexes because BiP will have a longer opportunity to bind the nascent chain before it
folds. Thus, increasing the percentage of slowly folding protein is sufficient to produce
the expected rise in the level of total BiP.
The model also shows that secreted product glycosylation site occupancy heterogeneity
can be influenced by BiP concentration if the folding rates between the glycosylated
species varies significantly. However the model also highlights a trade-off: as BiP
concentration increases and secreted product quality improves, the rate of secretion of the
desired product will decrease. The exact nature of this trade-off will depend upon the
ratio of the folding rates between the two species. As the difference in folding rates
becomes larger, secreted product percent glycosylation can be improved with less of a
decline in secretion of glycosylated product.
An assumption implicit in the above analysis is that the only difference between the
variably glycosylated species lies in the folding rate (kf). It is in fact a distinct possibility
204

that other kinetic parameters will be altered as a result of glycosylation. The attached
oligosaccharide may reduce the BiP/polypeptide binding rate (kbl) by shielding the
protein from the chaperone. Analogously the aggregation of glycosylated proteins (ka01
and kal 1) may be decreased as a result of enhanced solubility afforded by the polar
oligosaccharide. In fact, enhanced solubility of glycoproteins compared to their
underglycosylated counterparts is observed (Cumming, 1991). Accounting for these
changes would lead to an increase in the extent of BiP complexing with the
underglycosylated species compared to the glycosylated species. The increase in
complexing will increase the selective degradation of underglycosylated protein,
improving upon the trade-off described earlier. Product quality improvement could be
achieved with less of a reduction in glycosylated product secretion.
Another complication arises from the fact that overexpression of BiP may influence the
oligosaccharyltransferase (OST) reaction efficiency. Kinetic competition between the
oligosaccharide transfer reaction and folding of the nascent polypeptide is commonly
proposed as an explanation for observed glycosylation site-occupancy heterogeneity
(Bulleid et al., 1992; Savvidou et al., 1981; Shelikoff et al., 1996). Interaction of the
translocating polypeptide with BiP would be expected to decrease the extent of
premature folding. Even though the folding rate of the free polypeptide (kf) would not
change, complexing with BiP will decrease the amount of time during which folding may
occur and hence it will take longer for a given polypeptide to fold. Evidence supporting
the interaction of BiP with translocating nascent polypeptides comes primarily from
studies that show yeast require BiP in order to translocate nascent polypeptides into the
ER (Nguyen et al., 1991; Vogel et al., 1990). Although the exact role of BiP in
translocation is not clear, direct interaction with nascent chains seems probable. Recent
work shows that BiP can be crosslinked to secretory proteins trapped during
translocation into the ER, further suggesting that BiP interacts directly with nascent
chains co-translationally (Sanders et al., 1992). Overexpression of BiP may increase the
205

efficiency of the oligosaccharyltransferase reaction by preventing premature folding of the
polypeptide.
7.5 The Feasibility of Improving IFN-y Quality Through BiP
Overexpression in y-CHO Cells
The mathematical model described above demonstrated that overexpression of BiP has the
potential to alter secreted product glycosylation if the folding rates differ significantly
between the glycosylated and non-glycosylated species. There is experimental evidence
that in vivo folding and dimerization of IFN-y is dependent upon glycosylation. When
the Asn-25 glycosylation site was eliminated through site directed mutagenesis,
dimerization was less efficient and protein secretion dropped by more than 90%
(Sareneva et al., 1994). IFN-y was observed in insoluble aggregates which were
hypothesized to be misfolded material tightly bound to chaperone proteins. IFN-y
therefore appears to be a good candidate for quality improvement through BiP
overexpression.
In order to determine the feasibility of BiP overexpression in. our y-CHO cell line, initial
studies compared the BiP levels in our recombinant cells with BiP concentrations in non-
transfected CHO cell lines. It was of interest to determine whether BiP was already
induced in the y-CHO cells due to expression of IFN-y. BiP levels were found to be the
same for a CHO-K1 wild-type line, a dehydrofolate reductase deficient cell line and our
recombinant y-CHO cell line. Since stable overexpression of BiP has been achieved in a
dehydrofolate reductase deficient CHO cell line (Dorner et al., 1992), overexpression of
BiP in the y-CHO cell line should be possible.
7.6 Conclusions
Even if changes in glycosylation site occupancy during batch culture could be eliminated,
a significant fraction of under-glycosylated protein would continue to be produced.
206

Incomplete glycosylation of proteins would still be caused by factors such as competition
with protein folding and variable effectiveness of acceptor amino acid sequences (see
Chapter 2). Improvement in quality beyond such limits might be possible if a quality
control mechanism could prevent secretion of underglycosylated protein. This chapter
explored the feasibility of limiting the secretion of underglycosylated proteins by
overexpressing the chaperone BiP. A mathematical model suggests that overexpression of
BiP has the potential to alter secreted product glycosylation if the folding rates differ
significantly between the glycosylated and non-glycosylated species. Unfortunately
protein folding is not always influenced by glycosylation, and so the effectiveness of BiP
overexpression would be protein specific. Another potential disadvantage is that
secretion of the desired glycosylated product could be negatively impacted as well.
Despite these drawbacks, overexpression of BiP has potential as a tool to improve
product quality.
207


8. Conclusions and Recommendations
8.1 Conclusions
The goal of this thesis was to understand the causes of N-linked glycosylation site
occupancy heterogeneity. Of particular interest was the role of central carbon metabolism
in determining the availability of the nucleotide sugar precursors used in glycosylation.
The relationship between metabolism, nucleotide sugars and glycosylation was studied in
continuous culture experiments. Based upon these chemostat experiments, metabolic
factors which influence nucleotide sugar availability were identified. The extent to which
nucleotide sugars influence glycosylation site occupancy was then determined by
manipulating and monitoring nucleotide sugar concentrations in fed-batch culture.
Nucleotide sugars were found to influence glycosylation site occupancy primarily during
periods of nutrient limitation. Under starvation conditions, nucleotide sugar levels
decreased, and glycosylation site occupancy also decreased. The primary determinants of
intracellular nucleotide sugar concentrations during exponential growth were nucleoside
triphosphates, although amino sugar formation was also limiting for the synthesis of
UDP-N-acetylglucosamine (UDP-GlcNAc). During glucose limitation, nucleoside
triphosphates and nucleotide sugars were depleted. Analysis of central carbon metabolic
fluxes suggests that nucleotide synthesis was reduced during glucose limitation, because
available carbon was consumed in the TCA cycle. Potential TCA metabolites, such as
aspartate and glutamine, are important intermediates in pyrimidine and purine base
synthesis, and these metabolites were consumed for energy production during glucose
limitation. Thus, during glucose limitation nucleoside triphosphates were depleted,
causing depletion of nucleotide sugars and reduced glycosylation. Glutamine starvation
was also found to decrease glycosylation site occupancy. Since glutamine is the ammonia
donor in amino sugar formation, glutamine limitation reduced the formation of the amino
sugars which are required to synthesize UDP-GlcNAc.
209

The influence of nucleotide sugars on glycosylation site occupancy in non-starved
cultures was analyzed by feeding nucleotide sugar precursors. Consistent with the
hypothesis that hexose phosphates are not normally limiting for nucleotide sugar
formation or glycosylation, feeding various hexoses did not alter glycosylation site
occupancy. Feeding the amino sugar glucosamine, on the other hand, led to accumulation
of UDP-GlcNAc and alterations in glycosylation. Glucosamine feeding experiments
confirmed that amino sugar formation is an important regulatory step in UDP-GlcNAc
synthesis. Excessive accumulation of UDP-GlcNAc with glucosamine feeding led to
lower glycosylation site occupancy, possibly due to depletion of dolichol phosphate.
Nucleotide sugar concentrations were also altered by feeding nucleotide precursors.
Uridine feeding increased UTP and UDP-sugar concentrations without impacting cell
growth or productivity. A fed-batch experiment demonstrated that feeding 10 mM
uridine can slightly increase site occupancy. However, a three-fold increase in UDP-
GlcNAc lead to only a 4% increase in the percentage of interferon that was two site
glycosylated, indicating that nucleotide sugars have a small impact on glycosylation site
occupancy in non-starved cultures. Furthermore, glycosylation site occupancy declined
during exponential growth in both uridine-fed and control cultures. The decreases in site
occupancy were characteristic of the changes routinely observed in batch and fed-batch
cultures. By the end of the exponential growth phase, the percentage of I'N-y being
synthesized with both potential glycosylation sites occupied was typically 10-20%
lower than it had been initially. At the onset of the stationary phase, glycosylation site
occupancy quickly improved back to nearly the initial levels. Analysis of nucleotide
sugar levels revealed that the decreases in site occupancy during exponential growth were
caused by a step downstream of nucleotide sugar formation, as nucleotide sugar
concentrations actually increased during this time.
Figure 8-1 summarizes the interactions between metabolism, nucleotide sugar synthesis
and glycosylation site occupancy that were deduced in this thesis. Sugar phosphates
210

UTP, GTP d
O_ ~ GDP-Fructose 6-P - --. -P T UDP
'1- D-
UDPE
GlucoseLimitation
P- glycoprotein
GrowthPhase
Limitation Limitation? Limitation?
Figure 8-1. Interactions between metabolism, nucleotide sugar formation and
glycosylation site occupancy.
generally are not limiting for glycosylation site occupancy, except for amino sugars such
as N-acetylglucosamine-l-P, which can be limiting under giutamine restriction.
Alterations in nucleoside triphosphate levels will affect nucleotide sugar concentrations.
During glucose starvation, nucleoside triphosphates are depleted, and nucleotide sugars
can limit glycosylation. The decline in glycosylation site occupancy during normal
exponential growth in batch culture cannot be attributed to nucleotide sugars.
Downstream factors which might cause such a decline include availability of dolichol-P,
the activities of glycosyltransferase enzymes or the activity of the
oligosaccharyltransferase enzyme.
Rather than improving the efficiency of the initial glycosylation reaction, an alternative
strategy for improving product quality is to manipulate the cell's normal "quality
control" mechanisms. The quality of the secreted product could be improved by
preventing the secretion of non-glycosylated product. A quality control mechanism
designed to eliminate slowly folding proteins exists in the endoplasmic reticulum.
211
*= N-Acetylglucosamine
*= Mannose
V= Glucose
Because underglycosylated proteins typically have more trouble folding than their fully
glycosylated counterparts, this quality control may allow underglycosylated proteins to
be selectively identified and retained for degradation. A mathematical model was used to
explore the feasibility of limiting the secretion of underglycosylated proteins by
overexpressing the chaperone BiP. Model simulations suggest that overexpression of BiP
has the potential to alter secreted product glycosylation if the folding rates differ
significantly between the glycosylated and non-glycosylated species. Unfortunately,
protein folding is not always influenced by glycosylation, and so the effectiveness of BiP
overexpression would be protein specific. Another potential disadvantage is that
secretion of the desired glycosylated product could be negatively impacted as well.
Despite these drawbacks, overexpression of BiP has potential as a tool to improve
product quality.
8.2 Recommendations
The finding that nucleotide sugars do not normally limit glycosylation site occupancy
during exponential growth narrows the list of possible glycosylation bottlenecks. In the
past, sugar availability was often hypothesized to be responsible for changes in site
occupancy during exponential growth. Future efforts to explain the decrease in site
occupancy during exponential growth should focus on downstream factors. A good
starting point might be to investigate the effects of lipids on site occupancy. Lipid
supplements have been shown to influence glycosylation site occupancy of IFN-7y
produced by CHO cells with time during batch culture (Jenkins et al., 1994). Lipids
could be expected to influence glycosylation site occupancy through at least two
mechanisms. Lipid supplements could alter the activity of the oligosaccharyltransferase
(OST) enzyme due to changes in the composition of the endoplasmic reticulum
membrane. As discussed in Chapter 2, there is evidence that OST activity may be
affected by the phosphatidylcholine content of the ER membrane (Chalifour and Spiro,
1988; Chan and Wolf, 1987; Oda-Tamai et al., 1985). Alternatively, the lipid
212

supplements may influence the availability of dolichol phosphate, thereby changing the
amount of precursor oligosaccharide. Dolichol phosphate availability has been shown to
modulate N-glycosylation capacity in several cell types (Crick et al., 1994; Crick and
Waechter, 1994; Fukushima et al., 1997).
Other potential bottlenecks for site occupancy include the activities of the
glycosyltransferase enzymes which synthesize the lipid-linked precursor oligosaccharide.
In order to differentiate between changes in site occupancy due to altered OST activity
versus changes in oligosaccharide precursor availability, it may be necessary to quantify
the dolichol-sugar species involved in N-glycosylation. Changes in the distribution of the
dolichol species may aid in the identification of limiting reaction steps.
Even if the exponential growth phase limitation is not identified, the site occupancy of
recombinant IFN-y could probably be increased through other means. A simple practical
suggestion would be to alter the amino acid sequence of the Asn-97 glycosylation sequon.
The Asn-Tyr-Ser acceptor sequence could be improved by replacing the serine residue
with threonine, which is a more effective hydroxy amino acid in the Asn-Xxx-Ser/Thr
glycosylation sequon (Kasturi et al., 1995). In addition, bulky aromatic amino acids such
as Tyr in the Xxx position generally reduce the effectiveness of the glycosylation sequon
(Shakin-Eshleman et al., 1996). Alterations in the acceptor sequon are admittedly of more
practical interest than academic interest, since such improvements have been documented
in the past with other glycoproteins.
Quality control via the molecular chaperone BiP (Chapter 7) is a more innovative method
for attempting to improve site occupancy. With innovation comes added risk, however,
and there is no guarantee that BiP overexpression will work as intended. In order for the
method to be successful, the non-glycosylated protein must fold significantly more
slowly than the fully glycosylated protein. While there is some literature evidence
suggesting that IFN-y requires glycosylation at Asn-25 for efficient folding (Sareneva et
213

al., 1994), we have not observed any correlation between site occupancy and IFN-y
secretion. Overexpression of BiP may apply added selective pressure, but the possibility
remains that non-glycosylated protein will continue to be secreted. BiP overexpression is
also less likely to impact the relative secretion of one-site versus two-site glycosylated
IFN-y, and this difference constitutes the majority of IFN-y underglycosylation.
Furthermore, BiP overexpression could negatively impact secretion of the desired product
in addition to the undesired products. Even if BiP does not alter IFN-y secretion,
glycosylation site occupancy might be improved if BiP reduces the competition between
protein folding and glycosylation. Potential improvement of the oligosaccharyltransferase
reaction may offset some of the risk involved in attempting to implement the quality
control hypothesis.
A final suggestion for improving glycosylation site occupancy is to produce the product
primarily during the stationary phase or during limited cell growth. At the onset of the
stationary phase, we observed rapid increases in glycosylation site occupancy (Chapter
4). We hypothesized that the rapid improvement in site occupancy was due to reduced
biosynthesis of cellular glycoproteins. When fewer glycoproteins were being
synthesized, more oligosaccharide was available for the recombinant product. If the
product were to be produced during the stationary phase, it would be expected to be of
higher quality. Unfortunately, the y-CHO cell line had very low IFN-y productivity
during the stationary phase. Cell cycle dependent protein secretion has been observed for
other cell lines and products, and it has been suggested that the promoter might be
partially responsible for such dependencies (Gu et al., 1993; Gu et al., 1994; Gu et al.,
1996). Thus, producing high quality product during the stationary phase would require
developing a cell line that would maintain high productivity in this phase. Alternatively,
the cell growth could be artificially reduced, for example by limiting an essential amino
acid. By slowly feeding the limiting amino acid, the growth rate could be controlled.
Glycosylation site occupancy would be expected to be high under such conditions, since
glycoprotein biosynthesis would be limited without limiting oligosaccharide formation.
214

References
Abeijon, C. and C. B. Hirschberg (1990). Topography of Initiation of N-glycosylationReactions. Journal of Biological Chemistry, 265: 14691-14695.
Abeijon, C. and C. B. Hirschberg (1992). Topography of Glycosylation Reactions in theEndoplasmic Reticulum. TIBS, 17: 32-36.
Allen, S., H. Y. Naim and N. J. Bulleid (1995). Intracellular Folding of Tissue-typePlasminogen Activator: Effects of Disulfide Bond Formation on N-LinkedGlycosylation and Secretion. The Journal of Biological Chemistry, 270: 4797-4804.
Anderson, D. C. and C. F. Goochee (1995). The Effect of Ammonia on the O-linkedGlycosylation of Granulocyte Colony-Stimulating Factor Produced by ChineseHamster Ovary Cells. Biotechnology and Bioengineering, 47: 96-105.
Anfinsen, C. B. (1973). Principles That Govern the Folding of Protein Chains. Science,181: 223-230.
Arakawa, T., N. K. Alton and Y.-R. Hsu (1985). Preparation and Characterization ofRecombinant DNA-derived Human Interferon-y. The Journal of BiologicalChemistry, 260: 14435-14439.
Arakawa, T. and Y. R. Hsu (1987). Acid Unfolding and Self-Association of RecombinantEscherichia coli Derived Human Interferon y. Biochemistry, 26: 5428-5432.
Avanov, A. Y. (1991). Conformational Aspects of Glycosylation. MolekulyarnayaBiologiya, 25: 293-308.
Baumann, H. and G. P. Jahreis (1983). Glucose Starvation Leads in Rat Hepatoma Cellsto Partially N-Glycosylated Glycoproteins Including ocl-Acid Glycoproteins.The Journal of Biological Chemistry, 258: 3942-3949.
Bause, E. and G. Legler (1981). The Role of the Hydroxy Amino Acid in the TripletSequence Asn-Xaa-Thr(Ser) for the N-glycosylation Step During GlycoproteinBiosynthesis. Biochem. J., 195: 639-644.
Beckmann, R. P., L. A. Mizzen and W. J. Welch (1990). Interaction of Hsp70O withNewly Synthesized Proteins: Implications for Protein Folding and Assembly.Science, 248: 850-854.
Beeley, J. G. (1985). Glycoprotein and Proteoglycan Techniques. Elsevier, New York.
215

Berg, D. T., P. J. Burck, D. H. Berg and B. W. Grinnell (1993). Kringle Glycosylation ina Modified Human Tissue Plasminogen Activator Improves FunctionalProperties. Blood, 81: 1312-1322.
Blond-Elguindi, S., S. E. Cwirla, W. J. Dower, R. J. Lipshutz, S. R. Sprang, J. F.
Sambrook and M.-J. Gething (1993a). Affinity Panning of a Library of PeptidesDisplayed on Bacteriophages Reveals the Binding Specificity of BiP. Cell, 75:717-728.
Blond-Elguindi, S., A. M. Fourie, J. F. Sambrook and M. J. H. Gething (1993b). Peptide-dependent Stimulation of the ATPase Activity of the Molecular Chaperone BiP Isthe Result of Conversion of Oligomers to Active Monomers. Journal of BiologicalChemistry, 268: 12730-12735.
Bocci, V., A. Pacini, G. P. Pessina, L. Paulesu, M. Muscettola and G. Lunghetti (1985).Catabolic Sites of Human Interferon-y. J. Gen. Virol., 66: 887-891.
Bonarius, H. P. J., C. D. de Gooijer, J. Tramper and G. Schmid (1995). Determination ofthe Respiration Quotient in Mammalian Cell Culture in Bicarbonate BufferedMedia. Biotechnology and Bioengineering, 45: 524-535.
Bonarius, H. P. J., V. Hatzimanikatis, K. P. H. Meesters, C. D. deGooijer, G. Schmid andJ. Tramper (1996). Metabolic Flux Analysis of Hybridoma Cells in DifferentCulture Media Using Mass Balances. Biotechnology and Bioengineering, 50:299-318.
Borys, M. C., D. I. H. Linzer and E. T. Papoutsakis (1993). Culture pH AffectsExpression Rates and Glycosylation of Recombinant Mouse Placental LactogenProteins by Chinese Hamster Ovary (CHO) Cells. Bio/Technology, 11: 720-724.
Borys, M. C., D. I. H. Linzer and E. T. Papoutsakis (1994a). Ammonia Affects theGlycosylation Patterns of Recombinant Mouse Placental Lactogen-I by ChineseHamster Ovary Cells in a pH-Dependent Manner. Biotechnology andBioengineering, 43: 505-514.
Borys, M. C., D. I. H. Linzer and E. T. Papoutsakis (1994b). Cell Aggregation in aChinese Hamster Ovary Cell Microcarrier Culture Affects the Expression Rateand N-linked Glycosylation of Recombinant Mouse Placental Lactogen-1. Annalsof the New York Academy of Sciences, 745: 360-371.
Brindli, A. W. (1991). Mammalian Glycosylation Mutants as Tools for the Analysisand Reconstitution of Protein Transport. Biochem. J., 276: 1-12.
216

Bulleid, N. J., R. S. Bassel-Duby, R. B. Freedmen, J. F. Sambrook and M. J. H. Gething
(1992). Cell-Free Synthesis of Enzymatically Active Tissue-Type PlasminogenActivator. Biochemical Journal, 286: 275-280.
Carey, D. J., L. W. Sommers and C. B. Hirschberg (1980). CMP-N-Acetylneuraminic
Acid: Isolation from and Penetration into Mouse Liver Microsomes. Cell, 19:597-605.
Carlberg, M., A. Dricu, H. Blegen, M. Wang, M. Hjertman, P. Zickert, A. H66g and 0.
Larsson (1996). Mevalonic Acid Is Limiting for N-Linked Glycosylation andTranslocation of the Insulin-like Growth Factor-1 Receptor to the Cell Surface.
The Journal of Biological Chemistry, 271: 17453-17462.
Chalifour, R. J. and R. G. Spiro (1988). Effect of Phospholipids on Thyroid
Oligosaccharyltransferase Activity and Orientation: Evaluation of StructuralDeterminants for Stimulation of N-Glycosylation. The Journal of BiologicalChemistry, 263: 15673-15680.
Chan, V. T. and G. Wolf (1987). The Role of Vitamin A in the Glycosylation Reactions
of Glycoprotein Synthesis in an 'in vitro' System. Biochemical Journal, 247: 53-62.
Chapman, A. E. and J. C. Calhoun (1988). Effects of Glucose Starvation and PuromycinTreatment on Lipid-Linked Oligosaccharide Precursors and Biosynthetic Enzymesin Chinese Hamster Ovary Cells in Vivo and in Vitro. Archives of Biochemistryand Biophysics, 260: 320-333.
Chen, W., J. Helenius, I. Braakman and A. Helenius (1995). Cotranslational Folding and
Calnexin Binding During Glycoprotein Synthesis. Proc. Natl. Acad. Sci. USA, 92:6229-6233.
Chiou, S.-H. and K.-T. Wang (1988). Simplified Protein Hydrolysis With
Methanesuiphonic Acid at Elevated Temperature for the Complete Amino Acid
Analysis of Proteins. Journal of Chromatography, 448: 404-410.
Chiou, S.-H. and K.-T. Wang (1989). Peptide and Protein Hydrolysis by Microwave
Irradiation. Journal of Chromatography, 491: 424-431.
Clairmont, C. A., A. De Maio and C. B. Hirschberg (1992). Translocation of ATP into
the Lumen of Rough Endoplasmic Reticulum-derived Vesicles and Its Binding to
Luminal Proteins Including BiP (GRP 78) and GRP 94. Journal of Biological
Chemistry, 267: 3983-3990.
217

Coppen, S. R., R. Newsam, A. T. Bull and A. J. Baines (1995). Heterogeneity WithinPopulations of Recombinant Chinese Hamster Ovary Cells Expressing HumanInterferon-y. Biotechnology and Bioengineering, 46: 147-158.
Cory, J. G. (1992). Purine and Pyrimidine Nucleotide Metabolism. In: T. M. Devlin,Textbook of Biochemistry with Clinical Correlations, Third Edition. Wiley-Liss,New York.
Craig, E. A. and C. A. Gross (1991). Is Hsp70 the Cellular Thermometer? Trends inBiochemical Science, 16: 135-140.
Crick, D. C., J. R. Scocca, J. S. Rush, D. W. Frank, S. S. Krag and C. J. Waechter (1994).Induction of Dolichyl-Saccharide Intermediate Biosynthesis Corresponds toIncreased Long Chain cis-Isoprenyltransferase Activity during the MitogenicResponse in Mouse B Cells. The Journal of Biological Chemistry, 269: 10559-10565.
Crick, D. C. and C. J. Waechter (1994). Long-Chain cis-Isoprenyltransferase Activity IsInduced Early in the Developmental Program for Protein N-Glycosylation inEmbryonic Rat Brain Cells. Journal of Neurochemistry, 62: 247-256.
Cumming, D. A. (1991). Glycosylation of Recombinant Protein Therapeutics: Controland Functional Implications. 1: 115-130.
Curling, E. M. A., P. M. Hayter, A. J. Baines, A. T. Bull, K. Gull, P. G. Strange and N.Jenkins (1990). Recombinant Human Interferon-y: Differences in Glycosylationand Proteolytic Processing Lead to Heterogeneity in Batch Culture. 272: 333-337.
Dan, N. and M. A. Lehrman (1997). Oligomerization of Hamster UDP-GlcNAc:Dolichol-P GlcNAc-l-P Transferase, an Enzyme with MultipleTransmembrane Spans. The Journal of Biological Chemistry, 272: 14214-14219.
Darnell, J., H. Lodish and D. Baltimore (1990). Molecular Cell Biology. Second Edition.Scientific American Books, New York.
Datema, R. and R. T. Schwarz (1979). Interference with Glycosylation ofGlycoproteins: Inhibition of Formation of Lipid-linked Oligosaccharides In Vivo.Biochem. J., 184: 113-123.
DeFrancesco, L., I. E. Scheffler and M. J. Bissell (1976). A Respiration-deficient ChineseHamster Cell Line with a Defect in NADH-Coenzyme Q Reductase. The Journalof Biological Chemistry, 251: 4588-4595.
218
Devos, R., H. Cheroutre, Y. Taya, W. Degrave, H. Van Heuverswyn and W. Fiers (1982).Molecular Cloning of Human Immune Interferon cDNA and its Expression inEukaryotic Cells. Nucleic Acids Research, 10: 2487-2501.
DiDomencio, B., G. Bugaisky and S. Lindquist (1982). Cell, 31: 593-603.
Dordal, M. S., F. F. Wang and E. Goldwasser (1985). The Role of Carbohydrate inErythropoietin Action. Endocrinology, 116: 2293-2299.
Dorner, A. J., D. G. Bole and R. J. Kaufman (1987). The Relationship of N-linkedGlycosylation and Heavy Chain-binding Protein Association with the Secretion ofGlycoproteins. Journal of Cell Biology, 105: 2665-2674.
Dorner, A. J., M. G. Krane and R. J. Kaufman (1988). Reduction of Endogenous GRP78Levels Improves Secretion of a Heterologous Protein in CHO Cells. Molecularand Cellular Biology, 8: 4063-4070.
Dorner, A. J., L. C. Wasley and R. J. Kaufman (1992). Overexpression of GRP78Mitigates Stress Induction of Glucose Regulated Proteins and Blocks Secretion ofSelective Proteins in Chinese Hamster Ovary Cells. The EMBO Journal, 11:1563-1571.
Dorner, A. J., L. C. Wasley, M. G. Krane and R. J. Kaufman (1993). Protein Retentionin the Endoplasmic Reticulum Mediated by GRP78. In: M. S. Oka and R. G.Rupp, Cell Biology and Biotechnology: Novel Approaches to Increased CellularProductivity, Springer-Verlag, New York.
Dudich, I. V., V. P. Zav'yalov, V.-A. V. Bumyalis and D. V. Paulauskas (1992). A Studyof the Structural Properties of Recombinant y-Interferon with the Aid of CircularDichroism and Scanning Differential Microcalorimetry. MolekulyarnayaBiologya, 26: 441-451.
Ealick, S. E., W. J. Cook, S. Vijay-Kumar, M. Carson, T. L. Nagabhushan, P. P. Trottaand C. E. Bugg (1991). Three-Dimensional Structure of Recombinant HumanInterferon-y. Science, 252: 698-702.
Eigenbrodt, E., P. Fister and M. Reinacher (1985). New Perspectives on CarbohydrateMetabolism in Tumor Cells. In: R. Beitner, Regulation of CarbohydrateMetabolism, CRC Press, Inc., Boca Raton, Florida.
Elbein, A. D. (1987). Inhibitors of the Biosynthesis and Processing of N-linkedOligosaccharide Chains. Annual Review of Biochemistry, 56: 497-534.
219

Ezekowitz, R. A. B. and P. D. Stahl (1988). The Structure and Function of VertebrateMannose Lectin-like Proteins. In: S. Gordon, Macrophage Plasma MembraneReceptors: Structure and Function, The Company of Biologists Limited,Cambridge.
Farrar, M. A. and R. D. Schreiber (1993). The Molecular Cell Biology of Interferon-yand Its Receptor. Annual Reviews in Immunology, 11: 571-611.
Fedorov, A. N. and T. O. Baldwin (1995). Contribution of Cotranslational Folding to theRate of Formation of Native Protein Structure. Proc. Natl. Acad. Sci. USA, 92:1227-1231.
Fielder, K. and K. Simons (1995). The Role of N-Glycans in the Secretory Pathway.Cell, 81: 309-312.
Fischer, T., B. Thoma, P. Scheurich and K. Pfizenmaier (1990). Glycosylation of theHuman Interferon-y Receptor. N-linked Carbohydrates Contribute to StructuralHeterogeneity and are Required for Ligand Binding. The Journal of BiologicalChemistry, 265: 1710-1717.
Flesher, A. R., J. Marzowski, W.-C. Wang and H. V. Raff (1995). Fluorophore-LabeledCarbohydrate Analysis of Immunoglobulin Fusion Proteins: Correlation ofOligosaccharide Content with In Vivo Clearance Profile. Biotechnology andBioengineering, 46: 399-407.
Flynn, G. C., T. G. Chappell and J. E. Rothman (1989). Peptide Binding and Release byProteins Implicated as Catalysts of Protein Assembly. Science, 245: 385-390.
Flynn, G. C., J. Pohl, M. T. Flocco and J. E. Rothman (1991). Peptide-bindingSpecificity of the Molecular Chaperone BiP. Nature, 353: 726-730.
Freiden, P. J., J. R. Gaut and L. M. Hendershot (1992). Interconversion of ThreeDifferentially Modified and Assembled Forms of BiP. EMBO Journal, 11: 63-70.
Fukushima, K., T. Ohkura and K. Yamashita (1997). Synthesis of Lipid-LinkedOligosaccharides Is Dependent on the Cell Cycle in Rat 3Y1 Cells. Journal ofBiochemistry, 121: 415-418.
Gallagher, P. J., J. M. Henneberry, J. F. Sambrook and M.-J. Gething (1992).Glycosylation Requirements for Intracellular Transport and Function of theHemagglutinin of Influenza Virus. J. Virol., 66: 7136-7145.
Gavel, Y. and G. von Heijne (1990). Sequence Differences Between Glycosylated andNon-glycosylated Asn-X-Thr/Ser Acceptor Sites: Implications for ProteinEngineering. Protein Engineering, 3: 433-442.
220

Gawlitzek, M., U. Valley, M. Nimtz, R. Wagner and H. S. Conradt (1995a).Characterization of Changes in the Glycosylation Pattern of RecombinantProteins from BHK-21 Cells Due to Different Culture Conditions. Journal ofBiotechnology, 42: 117-131.
Gawlitzek, M., U. Valley, M. Nimtz, R. Wagner and H. S. Conradt (1995b). Effects ofAmmonia and Glucosamine on the Glycosylation Pattern of RecombinantProteins Expressed from BHK-21 Cells. In: E. C. Beuvery, J. B. Griffiths and W.P. Zeijlemaker, Animal Cell Technology: Developments Towards the 21stCentury, Kluwer Academic Publishers, Dordrecht, The Netherlands.
Gerald, C. F. and P. O. Wheatley (1994). Applied Numerical Analysis. Fifth Edition.Addison-Wesley Publishing Co., Reading, MA.
Gershman, H. and P. W. Robbins (1981). Transitory Effects of Glucose Starvation onthe Synthesis of Dolichol-linked Oligosaccharides in Mammalian Cells. Journal ofBiological Chemistry, 256: 7774-7780.
Gething, M.-J., S. Blond-Elguindi, K. Mori and J. F. Sambrook (1994). Structure,Function, and Regulation of the Endoplasmic Reticulum Chaperone, BiP. In: R. I.Morimoto, A. Tissieres and C. Georgopoulos, The Biology of Heat ShockProteins and Molecular Chaperones, Cold Spring Harbor Laboratory Press,Plainview, NY.
Gething, M. J., K. McCammon and J. Sambrook (1986). Expression of Wild-Type andMutant Forms of Influenza Hemagglutinin: The role of Folding in IntracellularTransport. Cell, 46: 939-950.
Gething, M. J. and J. Sambrook (1992). Protein Folding in the Cell. Nature, 355: 33-45.
Glabe, C. G., J. A. Hanover and W. J. Lennarz (1980). Glycosylation of OvalbuminNascent Chains: The Spatial Relationship Between Translation andGlycosylation. The Journal of Biological Chemistry, 255: 9236-9242.
Goechee, C. F., M. J. Gramer, D. C. Anderson and J. B. Bahr (1991). TheOligosaccharides of Glycoproteins: Bioprocess Factors Affecting OligosaccharideStructure and Their Effect on Glycoprotein Properties. Bio/Technology, 9: 1347-1355.
Goochee, C. F., M. J. Gramer, D. C. Anderson and J. B. Bahr (1992). TheOligosaccharides of Glycoproteins: Factors Affecting their Synthesis and theirInfluence on Glycoprotein Properties. In: P. Todd, S. K. Sikdar and M. Bier,Frontiers in Bioprocessing II, American Chemical Society, Washington, D.C.
221

Goochee, C. F. and T. Monica (1990). Environmental Effects on Protein Glycosylation.8: 421-427.
Goswami, J., A. J. Sinskey, H. Steller, G. N. Stephanopoulos and D. I. C. Wang (1998).Apoptosis in Batch Cultures of Chinese Hamster Ovary Cells. Biotechnologyand Bioengineering (Submitted),
Griffiths, G., G. Warren, P. Quinn, O. Mathieu-Costello and H. Hoppeler (1984).Density of Newly Synthesized Plasma Membrane Proteins in IntracellularMembranes. I. Stereological Studies. Journal of Cell Biology, 98: 2133-2141.
Gross, V., P. C. Heinrich, D. vom Berg, K. Steube, T. Andus, T.-A. Tran-Thi, K. Deckerand W. Gerok (1988). Involvement of Various Organs in the Initial PlasmaClearance of Differently Glycosylated Rat Liver Secretory Proteins. EuropeanJournal of Biochemistry, 173: 653-659.
Gross, V., K. Steube, T.-A. Tran-Thi, W. Gerok and P. C. Heinrich (1989). Role of N-glycosylation for the Plasma Clearance of Rat Liver Secretory Glycoproteins.Biochemical Society Transactions, 17: 21-23.
Gu, M. B., P. Todd and D. S. Kompala (1993). Foreign Gene Expression ([-Galactosidase) During the Cell Cycle Phases in Recombinant CHO Cells.Biotechnology and Bioengineering, 42: 1113-1123.
Gu, M. B., P. Todd and D. S. Kompala (1994). Analysis of Foreign ProteinOverproduction in Recombinant CHO Cells. Annals of N.Y. Acad. Sci., 721:194-207.
Gu, M. B., P. Todd and D. S. Kompala (1996). Cell Cycle Analysis of Foreign Gene (3-Galactosidase) Expression in Recombinant Mouse Cells under Control of MouseMammary Tumor Virus Promoter. Biotechnology and Bioengineering, 50: 229-237.
Gu, X. (1997). Characterization and Improvement of Interferon-, Glycosylation inChinese Hamster Ovary Cell Culture. Ph.D. Massachusetts Institute ofTechnology.
Gu, X., B. J. Harmon and D. I. C. Wang (1997). Site- and Branch-Specific Sialylation ofRecombinant Human Interferon-y in Chinese Hamster Ovary Cell Culture.Biotechnology and Bioengineering, 55: 390-398.
Haas, I. G. and M. Wabl (1983). Immunoglobulin Heavy Chain Binding Protein. Nature,306: 387-389.
222

Hamilton, W. G. and R. G. Ham (1977). Clonal growth of Chinese Hamster Cell lines inprotein-free media. In Vitro, 13: 537-547.
Harlow, E. and D. Lane (1988). Antibodies: A Laboratory Manual. Cold Spring HarborLaboratory,
Harmon, B. J., X. Gu and D. I. C. Wang (1996). Rapid Monitoring of Site-SpecificGlycosylation Microheterogeneity of Recombinant Human Literferop.-y.Analytical Chemistry, 68: 1465-1473.
Hartl, F. U., J. Martin and W. Neupert (1992). Protein Folding in the Cell: The Role ofMolecular Chaperones Hsp70 and Hsp60O. Annual Rev. Biophys. Biomol.Struct., 21: 293-322.
Haschemeyer, A. E. V. (1976). Kinetics of Protein Synthesis in Higher Organisms InVivo. Trends Biochem. Sci., 1: 133.
Hayter, P. M., E. M. A. Curling, A. J. Baines, N. Jenkins, I. Salmon, P. G. Strange, J. M.Tong and A. T. Bull (1992). Glucose-Limited Chemostat Culture of ChineseHamster Ovary Cells Producing Recombinant Human Interferon-y:.Biotechnology and Bioengineering, 39: 327-335.
Hayter, P. M., E. M. A. Curling, M. L. Gould, A. J. Baines, N. Jenkins, I. Salmon, P. G.Strange and A. T. Bull (1993). The Effect of the Dilution Rate on CHO CellPhysiology and Recombinant Interferon-y Production in Glucose-LimitedChemostat Culture. Biotechnology and Bioengineering, 42: 1077-1085.
Helenius, A. (1994). How N-linked Oligosaccharides. Affect Glycoprotein Folding in theEndoplasmic Reticulum. Molecular Biology of the Cell, 5: 253-265.
Hendershot, L. M., J. Ting and A. S. Lee (1988). Identity of the Immunoglobulin Heavy-chain -binding Protein with the 78,000-dalton Glucose-regulated Protein and theRole of Posttranslational Modifications in Its Binding Function. Molecular andCellular Biology, 8: 4250-4256.
Hirschberg, C. B. and M. D. Snider (1987). Topography of Glycosylation ih the RoughEndoplasmic Reticulum and Golgi Apparatus. Annual Review of Biochemistry,56: 63-87.
Hoist, B., A. W. Bruun, M. C. Kielland-Brandt and J. R. Winther (1996). CompetitionBetween Folding and Glycosylation in the Endoplasmic Reticulum. The EMBOJournal, 15: 3538-3546.
223

Imperiali, B., K. L. Shannon and K. W. Rickert (1992a). Role of Peptide Conformation inAsparagine-Linked Glycosylation. Journal of the American Chemical Society,114: 7942-7944.
hnperiali, B., K. L. Shannon, M. Unno and K. W. Rickert (1992b). A MechanisticProposal for Asparagine-Linked Glycosylation. Journal of the AmericanChemical Society, 114: 7944-7945.
James, D. C., R. B. Freedman, M. Hoare and N. Jenkins (1994). High-ResolutionSeparation of Recombinant Human Interferon-y Glycoforms by MicellarElectrokinetic Capillary Chromatography. Analytical Biochemistry, 222: 315-322.
James, D. C., R. B. Freedman, M. Hoare, O. W. Ogonah, B. C. Rooney, O. A. Larionov,V. N. Dobrovolsky, O. V. Lagutin and N. Jenkins (1995). N-Glycosylation ofRecombinant Human Interferon-y Produced in Different Animal ExpressionSystems. Bio/Technology, 13: 592-596.
Jenkins, N. (1991). Growth Factors. In: M. Butler, Mammalian Cell Biotechnology: APractical Approach, Oxford University Press,
Jenkins, N., P. Castro, S. Menon, A. Ison and A. Bull (1994). Effect of LipidSupplements on the Production and Glycosylation of Recombinant Interferon-yExpressed in CHO Cells. Cytotechnology, 15: 209-215.
Jenkins, N. and E. M. A. Curling (1994). Glycosylation of Recombinant Proteins:Problems and Prospects. Enzyme Microb. Technol., 16: 354-364.
Jenkins, N., R. B. Parekh and D. C. James (1996). Getting the Glycosylation Right:Implications for the Biotechnology Industry. Nature Biotechnology, 14: 975-981.
Kaiden, A. and S. S. Krag (1992). Dolichol Metabolism in Chinese Hamster Ovary Cells.Biochem. Cell Biol., 70: 385-389.
Kaminskas, E. (1979). Ribonucleotide Depletion in Glucose-Deprived Tumor Cells: TheRole of RNA Synthesis. Biochemical and Biophysical Research Communications,88:1391-1397.
Kanwar, Y. S. (1984). Biology of Disease: Biophysiology of Glomerular Filtration andProteinuria. Laboratory Investigation, 51: 7-21.
Kaplan, H. A., J. K. Welply and W. J. Lennarz (1987). Oligosaccharyl Transferase: TheCentral Enzyme in the Pathway of Glycoprotein Assembly. Biochimica etBiophysica Acta, 906: 161-173.
224

Kassenbrock, C. K., P. D. Garcia, P. Walter and R. B. Kelly (1988). Heavy-chainBinding Protein Recognizes Aberrant Polypeptides Translocated in-vitro. Nature,333: 90-93.
Kasturi, L., J. R. Eshleman, W. H. Wunner and S. H. Shakin-Eshleman (1995). TheHydroxy Amino Acid in an Asn-X-Ser/Thr Sequon Can Influence N-linked CoreGlycosylation Efficiency and the Level of Expression of a Cell SurfaceGlycoprotein. The Journal of Biological Chemistry, 270: 14756-14761.
Kaufmian, R. J. and P. A. Sharp (1982). Amplification and Expression of SequencesCotransfected with a Modular Dihydrofolate Reductase Complementary DNAGene. Journal of Molecular Biology, 159: 601-621.
Kean, E. L. (1991 a). Studies on the Activation by Dolichol-P-mannose of theBiosynthesis of GlcNAc-P-P-dolichol and the Topography of the GlcNAc-transferases Concerned with the Synthesis of GlcNAc-P-P-dolichol and(GlcNAc) 2 -P-P-dolichol: A Review. Biochem. Cell Biol., 70: 413-421.
Kean, E. L. (1991b). Topographical Orientation in Microsomal Vesicles of the N-acetylglucosaminyltransferases Which Catalyze the Biosynthesis of N-acetylglucosaminylpyrophosphoryldolichol and N-acetylglucosaminyl-N-acetylglucosaminylpyrophosphoryl-dolichol. Journal of Biological Chemistry,266: 942-946.
Keen, M. J. and N. T. Rapson (1995). Development of a Serum-free Culture Medium forthe Large Scale Production of Recombinant Protein from a Chinese HamsterOvary Cell Line. Cytotechnology, 17: 153-163.
Kelleher, D. J., G. Kreibich and R. Gilmore (1992). Oligosaccharyltransferase Activity IsAssociated with a Protein Complex Composed of Ribophorins I and II and a 48kd Protein. Cell, 69: 55-65.
Kern, G., M. Schmidt, J. Buchner and R. Jaenicke (1992). Glycosylation Inhibits theInteraction of Invertase with the Chaperone GroEL. FEBS Letters, 305: 203-205.
Kitagawa, Y., Y. Sano, M. Ueda, K. Higashio, H. Narita, M. Okano, S.-I. Matsumoto andR. Sasaki (1994). N-Glycosylation of Erythropoietin Is Critical for ApicalSecretion by Madin-Darby Canine Kidney Cells. Experimental Cell Research,213: 449-457.
225

Knittler, M. R., S. Dirks and I. G. Haas (1995). Molecular Chaperones Involved inProtein Degradation in the Endoplasmic Reticulum: Quantitative Interaction ofthe Heat Shock Cognate Protein BiP with Partially Folded Immunoglobulin LightChains That Are Degraded in the Endoplasmic Reticulum. Proc. Natl. Acad. Sci.USA, 92: 1764-1768.
Koch, H. U., R. T. Schwarz and C. Scholtissek (1979). Glucosamine Itself Mediates
Reversible Inhibition of Protein Glycosylation. European Journal ofBiochemistry, 94: 515-522.
Konrad, M. and W. E. Merz (1994). Regulation of N-Glycosylation: Long Term Effectof Cyclic AMP Mediates Enhanced Synthesis of the Dolichol PyrophosphateCore Oligosaccharide. Journal of Biological Chemistry, 269: 8659-8666.
Kopp, K., W. Nod, M. Schliiter, R. Werner and F. Gtz (1995). The Role ofPhysiological Cell Parameters and Culture Conditions on Product Consistency andGlycosylation Pattern of Recombinant CHO Expressed Glycoproteins -Interferon Omega and Tissue Plasminogen Activator. In: E. C. Beuvery, J. B.
Griffiths and W. P. Zeijlemaker, Animal Cell Technology: DevelopmentsTowards the 21st Century, Kluwer Academic Publishers, Dordrecht, TheNetherlands.
Kornfeld, R. and S. Kornfeld i:985). Assembly of Asparagine-linked Oligosaccharides.54: 631-664.
Kornfeld, S. and V. Ginsburg (1966). The Metabolism of Glucosamine by Tissue CultureCells. Experimental Cell Research, 41: 592-600.
Kornfeld, S. and I. Mellman (1989). The Biogenesis of Lysosomes. Annual Reviews inCell Biology, 5: 483-525.
Kozutsumi, Y., M. Segal, K. Normington, M.-J. Gething and J. Sambrook (1988). ThePresence of Malfolded Proteins in the Endoplasmic Reticulum Signals theInduction of Gluocose-Regulated Proteins. Nature, 332: 462-464.
Krebs, H., F. X. Schmid and R. Jaenicke (1983). Folding of Homologous Proteins: TheRefolding of Different Ribonucleases is Independent of Sequence Variations,Proline Content and Glycosylation. The Journal of Molecular Biology, 169: 619-635.
Langer, B. G., J. W. Weisel, P. A. Dinauer, C. Nagaswami and W. R. Bell (1988).Deglycosylation of Fibrinogen Accelerates Polymerization and Increases LateralAggregation of Fibrin Fibers. Journal of Biological Chemistry, 263: 15056-15063.
226

Lanks, K. W., J.-P. Gao and E. J. Kasambalides (1988). Nucleoside Restoration of HeatResistance and Suppression of Glucose-regulated Protein Synthesis by Glucose-deprived L929 Cells. Cancer Research, 48: 1442-1445.
Lee, A. S. (1987). Coordinated Regulation of a Set of Genes by Glucose and CalciumIonophores in Mammalian Cells. TIBS, 12: 20-23.
Lehrman, M. A. and Y. Zeng (1989). Pleiotropic Resistance to Glycoprotein ProcessingInhibitors in Chinese Hamster Ovary Cells. The Journal of Biological Chemistry,264: 1584-1593.
Lennon, K., R. Pretei, J. Kesselheim, S. te Hessen and M. A. Kukuruzinska (1995).Proliferation-Dependent Differential Regulation of the Dolichol Pathway Genes inSaccharomyces cerevisiae. Glycobiology, 5: 633-642.
Lodish, H. F., N. Hong, M. Snider and G. J. Strous (1983). Hepatoma Secretory ProteinsMigrate from Rough Endoplasmic Reticulum to Golgi at Characteristic Rates.Nature, 304: 80-83.
Ma, J., H. Saito, T. Oka and I. K. Vijay (1996). Negative Regulatory Element Involved inthe Hormonal Regulation of GlcNAc-I-P Transferase Gene in Mouse MammaryGland. The Journal of Biological Chemistry, 271: 11197-11203.
Marcantonio, E. E., A. Amar-Costesec and G. Kreibich (1984). Segregation of thePolypeptide Translocation Apparatus to Regions of the Endoplasmic ReticulumContaining Ribophorins and Ribosomes. II. Rat Liver Microsomal SubfractionsContain Equimolar Amounts of Ribophorins and Ribosomes. The Journal of CellBiology, 99: 2254-2259.
Maron, M. J. and R. J. Lopez (1991). Numerical Analysis: A Practical Approach.Wadsworth Publishing Company, Belmont, CA.
Marshall, R. D. (1972). Glycoproteins. Annual Reviews in Biochemistry, 41: 673-702.
Misaizu, T., S. Matsuki, T. W. Strickland, M. Takeuchi, A. Kobata and S. Takasaki(1995). Role of Antennary Structure of N-linked Sugar Chains in Renal Handlingof Recombinant Human Erythropoeitin. Blood, 86: 4097-4104.
Monroe, R. S. and B. E. Huber (1994). The Major Form of the MurineAsialoglycoprotein Receptor: cDNA Sequence and Expression in Liver, Testisand Epididymis. Gene, 148: 237-244.
Mori, K., A. Sant, K. Kohno, K. Normington, M. J. Gething and J. F. Sambrook (1992).A 22 bp Cis-acting Element is Necessary and Sufficient for the Induction of theYeast KAR2 (BiP) Gene by Unfolded Proteins. EMBO Journal, 11: 2583-2593.
227
Mortz, E., T. Sareneva, I. Julkunen and P. Roepstorff (1996). Does Matrix-assistedLaser Desorption/Ionization Mass Spectrometry Allow Analysis of CarbohydrateHeterogeneity in Glycoproteins? A Study of Natural Human Interferon-y.Journal of Mass Spectrometry, 31: 1109-1118.
Mota, O. M., G. T. Huang and M. A. Kukuruzinska (1994). Developmental Regulationand Tissue-Specific Expression of Hamster Dolichol-P-Dependent N-Acetylglucosamine-l-P Transferase (GPT). Biochemical and BiophysicalResearch Communications, 204: 284-291.
Mutsaers, J. H. G. M., J. P. Kamerling, R. Devos, Y. Guisez, W. Fiers and J. F. G.Vliegenthart (1986). Structural Studies of the Carbohydrate Chains of Human y-interferon. 156: 651-654.
Nguyen, T. H., D. T. S. Law and D. B. Williams (1991). Binding Protein BiP is Requiredfor Translocation of Secretory Proteins into the Endoplasmic Reticulum inSaccharomyces cerevisiae. Proceedings of the National Academy of Sciences ofthe United States of America, 88: 1565-1569.
Nilsson, I. M. and G. von Heijne (1993). Determination of the Distance Between theOligosaccharyltransferase Active Site and the Endoplasmic Reticulum Membrane.Journal of Biological Chemistry (?), 268: 5798-5801.
Oda-Tamai, S., S. Kato, S. Hara and N. Akamatsu (1985). Decreased Transfer ofOligosaccharide from Oligosaccharide-Lipicd to Protein Acceptors in RegeneratingRat Liver. The Journal of Biological Chemistry, 260: 57-63.
Ohkura, T., K. Fukushima, A. Kurisaki, H. Sagami, K. Ogura, K. Ohno, S. Hara-Kuge andK. Yamashita (1997). A Partial Deficiency of Dehydrodolichol Reduction Is aCause of Carbohydrate-deficient Glycoprotein Syndrome Type I. The Journal ofBiological Chemistry, 272: 6868-6875.
Orlean, P. (1992). Enzymes That Recognize Dolichols Participate in ThreeGlycosylation Pathways and Are Required for Protein Secretion. Biochem. CellBiol., 70: 4?8-447.
Pan, Y.-T. and A. D. Elbein (1982). The Formation of Lipid-linked Oligosaccharides inMadin-Darby Canine Kidney Cells. The Journal of Biological Chemistry, 257:2795-2801.
Pels Rijcken, W. R., W. Ferwerda, D. H. Van den Eijnden and B. Overdijk (1995a).Influence of D-Galactosamine on the Synthesis of Sugar Nucleotides andGlycoconjugates in Rat Hepatocytes. Glycobiology, 5: 495-502.
228

Pels Rijcken, W. R., B. Overdijk, D. H. van den Eijnden and W. Ferwerda (1993).Pyrimidine Nucleotide Metabolism in Rat Hepatocytes: Evidence forCompartmentation of Nucleotide Pools. Biochem. J., 293: 207-213.
Pels Rijcken, W. R., B. Overdijk, D. H. Van Den Eijnden and W. Ferwerda (1995b). TheEffect of Increasing Nucleotide-Sugar Concentrations on the Incorporation ofSugars into Glycoconjugates in Rat Hepatocytes. Biochemistry Journal, 305:865--870.
Popov, M., L. Y. Tam, J. Li and R. A. F. Reithmeier (1997). Mapping the Ends ofTransmembrane Segments in a Polytopic Membrane Protein: Scanning N-Glycosylation Mutagenesis of Extracytosolic Loops in the Anion Exchanger,Band 3. The Journal of Biological Chemistry, 272: 18325-18332.
Ptitsyn, O. B. and G. V. Semisotnov (1991). In: B. T. Nall and K. A. Dill,Conformations and Forces in Protein Folding, AAAS, Washington, D.C.
Puig, A. and H. F. Gilbert (1994). Anti-chaperone Behavior of BiP during the ProteinDisulfide Isomerase-catalyzed Refolding of Reduced Denatured Lysosyme.Journal of Biological Chemistry, 269: 25889-25896.
Putnam, R. and A. Roos (1991). Which Value for the First Dissociation Constant ofCarbonic Acid Should Be Used in Biological Work? American Journal ofPhysiology, 260: C11 13-C1116.
Rademacher, T. W., R. B. Parekh and R. A. Dwek (1988). Glycobiology. AnnualReviews in Biochemistry, 57: 785-838.
Rapaport, E., C. W. Christopher, S. K. Svihovec, D. Ullrey and H. M. Kalckar (1979).Selective High Metabolic Lability of Uridine, Guanosine and CytosineTriphosphates in Response to Glucose Deprivation and Refeeding ofUntransformed and Polyoma Virus-transformed Hamster Fibroblasts. Journal ofCellular Physiology, 101: 229-236.
Rearick, J. I., A. Chapman and S. Kornfeld (1981). Glucose Starvation Alters Lipid-linked Oligosaccharide Biosynthesis in Chinese Hamster Ovary Cells. Journal ofBiological Chemistry, 256: 6255-6261.
Riederer, M. A. and A. Hinnen (1991). Removal of N-Glycosylation Sites of the YeastAcid Phosphatase Severely Affects Protein Folding. Journal of Bacteriology, 173:3539-3546.
Rinderknecht, E., B. H. O'Conner and H. Rodriques (1984). Natural Human Interferon-y:Complete Amino Acid Sequence and Determination of Sites of Glycosylation.Journal of Biological Chemistry, 259: 6790-6797.
229
Robinson, A. S. and D. A. Lauffenburger (1996). Model for ER Chaperone Dynamicsand Secretory Protein Interactions. AIChE Journal, 42: 1443-1453.
Robinson, D. K., C. P. Chan, C. Yu Ip, P. K. Tsai, J. Tung, T. C. Seamans, A. B. Lenny,D. K. Lee, J. Irwin and M. Silberklang (1994). Characterization of a RecombinantAntibody Produced in the Course of a High Yield Fed-Batch Process.Biotechnology and Bioengineering, 44: 727-735.
Romagnoli, J. A. and G. Stephanopoulos (1981). Rectification of Process MeasurementData in the Presence of Gross Errors. Chemical Engineering Science, 36: 1849-1863.
Rosenwald, A. G., J. Stoll and S. S. Krag (1990). Regulation of Glycosylation: ThreeEnzymes Compete for a Common Pool of Dolichyl Phosphate In Vivo. TheJournal of Biological Chemistry, 265: 14544-14553.
Rothman, J. E. and H. F. Lodish (1977). Synchronised Transmembrane Insertion andGlycosylation of a Nascent Membrane Protein. Nature, 269: 775-780.
Ryll, T., U. Valley and R. Wagner (1994). Biochemistry of Growth Inhibition byAmmonium Ions in Mammalian Cells. Biotechnology and Bioengineering, 44:184-193.
Ryll, T. and R. 7agner (1991). Improved Ion-Pair High-Performance LiquidChromatographic Method for the Quantification of a Wide Variety of Nucleotidesand Sugar-Nucleotides in Animal Cells. Journal of Chromatography, 570: 77-88.
Sagami, H., Y. Igarashi, S. Tateyama, K. Ogura, J. Roos and W. J. Lennarz (1996).Enzymatic Formation of Dehydrodolichal and Dolichal, New Products Related toYeast Dolichol Biosynthesis. The Journal of Biological Chemistry, 271: 9560-9566.
Sagami, H., A. Kurisaki and K. Ogura (1993). Formation of Dolichol fromDehydrodolichol Is Catalyzed by NADPH-dependent Reductase Localized inMicrosomes of Rat Liver. The Journal of Biological Chemistry, 268: 10109-10113.
Sanders, S. L., K. M. Whitfield, J. P. Vogel, M. D. Rose and R. W. Schekman (1992).Sec6lp and BiP Directly Facilitate Polypeptide Translocation into the ER. Cell,69: 353-365.
Sareneva, T., K. Cantell, L. Pyhdi, J. Pirhonen and I. Julkunen (1993). Effect ofCarbohydrates on the Pharmacokinetics of Human Interferon-y. Journal ofInterferon Research, 13: 267-269.
230

Sareneva, T., J. Pirhonen, K. Cantell and I. Julkunen (1995). N-glycosylation of HumanInterferon-y: Glycans at Asn-25 Are Critical for Protease Resistance. Biochem.J., 308: 9-14.
Sareneva, T., J. Pirhonen, K. Cantell. N. Kalkkinen and I. Julkunen (1994). Role of N-Glycosylation in the Synthesis, Dimerization and Secretion of Human Interferon-y. Biochem. J., 303: 831-840.
Savinell, J. M. and B. O. Palsson (1992). Network Analysis of Intermediary Metabolismusing Linear Optimization. I. Development of Mathematical Formalism. Journalof Theoretical Biology, 154:421-454.
Sawidou, G., M. Klein, C. Home, T. Hofmann and K. J. Dorrington (1981). AMonoclonal Immunoglobulin G1 in which Some Molecules Possess GlycosylatedLight Chains-I. Site of Glycosylation. Molec. Immun., 18: 793-805.
Scahill, S. J., R. Devos, J. Van der Heyden and W. Fiers (1983). Expression andCharacterization of the Product of a Human Immune Interferon cDNA Gene inChinese Hamster Ovary Cells. 80: 4654-4658.
Schachter, H. (1978). Glycoprotein Biosynthesis. In: M. I. Horowitz and W. Pigman,The Glycoconiugates. Volume II: Mammalian Glycoproteins, Glycolipids, andProteoglycans, Academic Press, New York.
Schachter, H. (1986). Biosynthetic Controls that Determine the Branching andMicroheterogeneity of Protein-Bound Oligosaccharides. Biochem. Cell Biol., 64:163-181.
Schmitz, A., M. Maintz, T. Kehle and V. Herzog (1995). In Vivo Iodination of aMisfolded Proinsulin Reveals Co-localization Signals for BiP Binding and forDegradation in the ER. The EMBO Journal, 14: 1091-1098.
Schtilke, N. and F. X. Schmid (1988). Effect of Glycosylation on the Mechanism ofRenaturation of Invertase from Yeast. The Journal of Biological Chemistry, 263:8832-8837.
Schumpe, A., G. Quicker and W. D. Deckwer (1982). Gas Solubilities in MicrobialCulture Media. Advances in Biochemical Engineering, 24: 1-38.
Schumpp, B. and E. J. Schlaeger (1990). Optimization of Culture Conditions for HighCell Density Proliferation of HL-60 Human Promyelocytic Leukemia Cells.Journal of Cell Science, 97: 639-647.
231

Sciandra, J. J. and J. R. Subjeck (1983). The Effects of Glucose on Protein Synthesis andThermosensitivity in Chinese Hamster Ovary Cells. The Journal of BiologicalChemistry, 258: 12091-12093.
Severinghaus, J. W. (1965). Chapter 61: Blood Gas Concentrations. In: W. O. Fenn andH. Rahn, Hanbook of Physiology Section 3: Respiration, American PhysiologicalSociety, Washington, D.C.
Shakin-Eshleman, S. H., S. L. Spitalnik and L. Kasturi (996). The Amino Acid at the XPosition of an Asn-X-Ser Sequon Is an Important Determinant of N-Linked Core-glycosylation Efficiency. The Journal of Biological Chemistry, 271: 6363-6366.
Shelikoff, M., A. J. Sinskey and G. Stephanopoulos (1994). The Effect of ProteinSynthesis Inhibitors on the Glycosylation Site Occupancy of RecombinantHuman Prolactin. Cytotechnology, 12: 1-14.
Shelikoff, M., A. J. Sinskey and G. Stephanopoulos (1996). A Modeling Framework forthe Study of Protein Glycosylation. Biotechnology and Bioengineering, 50: 73-90.
Silberstein, S. and R. Gilmore (1996). Biochemistry, Molecular Biology, and Genetics ofthe Oligosaccharyltransferase. FASEB J., 10: 849-858.
Silberstein, S., D. J. Kelleher and R. Gilmore (1992). The 48-kDa Subunit of theMammalian Oligosaccharyltransferase Complex Is Homologous to the EssentialYeast Protein WBP1. The Journal of Biological Chemistry, 267: 23658-23663.
Sokoloski, J. A. and A. C. Sartorelli (1987). Inhibition of the Synthesis of Glycoproteinsand Induction of the Differentiation of HL-60 Promyelocytic Leukemia Cells by6-Methylmercaptopurine Ribonucleoside. Cancer Research, 47: 6283-6287.
Sonderhoff, S. A., D. G. Kilburn and J. M. Piret (1992). Analysis of Mammalian ViableCell Biomass Based on Cellular ATP. Biotechnology and Bioengineering, 39:859-864.
Sousa, M. C., M. A. Ferrero-Garcia and A. J. Parodi (1992). Recognition of theOligosaccharide and Protein Moities of Glucoproteins by the UDP-Glc:glycoprotein Glucosyltransferase. Biochem., 31: 97-105.
Spiro, R. G., Q. Zhu, V. Bhoyroo and H.-D. S1ing (1996). Definition of the Lectin-likeProperties of the Molecular Chaperone, Calreticulin, and Demonstration of ItsCopurification with Endomannosidase from Rat Liver Golgi. The Journal ofBiological Chemistry, 271: 11588-11594.
232

Spivak, J. L. and B. B. Hogans (1989). The in vivo Metabolism of Recombinant HumanErythropoietin in the Rat. Blood, 73: 90-99.
Stanley, P. (1983). Selection of Lectin-Resistant Mutants of Animal Cells. Methods illEnzymology, 96: 157-185.
Stark, N. J. and E. C. Heath (1979). Glucose-Dependent Glycosylation of SecretoryGlycoprotein in Mouse Myeloma Cells. Archives of Biochemistry andBiophysics, 192: 599-609.
Stoll, J. and S. S. Krag (1988). A Mutant of Chinese Hamster Ovary Cells with aReduction in Levels of Dolichyl Phosphate Available for Glycosylation. TheJournal of Biological Chemistry, 263: 10766-10773.
Stoll, J., A. G. Rosenwald and S. S. Krag (1988). A Chinese Hamster Ovary Cell MutantF2A8 Utilized Polyprenol Rather Than Dolichol for Its Lipid-dependentAsparagine-linked Glycosylation Reactions. The Journal of Biological Chemistry,263: 10774-10782.
Strang, G. (1988). Linear Algebra and Its Applications. Third Edition. Harcourt BraceJovanovich, Inc., San Diego.
Strickland, T. W., A. R. Thomason, J. H. Nilson and J. G. Pierce (1985). The Common axSubunit of Bovine Glycoprotein Hormones: Limited Formation of NativeStructure by the Totally Nonglycosylated Polypeptide Chain. Journal of CellularBiochemistry, 29: 225-237.
Stryer, L. (1988). Biochemistry. Third Edition. W. H. Freeman and Company, NewYork.
Tatu, U. and A. Helenius (1997). Interactions Between Newly SynthesizedGlycoproteins, Calnexin and a Network of Resident Chaperones in theEndoplasmic Reticulum. J. Cell Biol., 136: 555-565.
te Heesen, S., B. Janetzky, L. Lehle and M. Aebi (1992). The Yeast WBP1 Is Essentialfor Oligosaccharyl Transferase Activity in vivo and in vitro. The EMBO Journal,11: 2071-2075.
Thorens, B. and P. Vassalli (1986). Chloroquine and Ammonium Chloride PreventTerminal Glycosylation of Immunoglobulins in Plasma Cells without AffectingSecretion. Nature, 321: 618-620.
Traxinger, R. R. and S. Marshall (1991). Coordinated Regulation of Glutamine:Fructose-6-phosphate Amidotransferase Activity by Insulin, Glucose, and Glutamine. TheJournal of Biological Chemistry, 266: 10148-10154.
233

Turco, S. J. (1980). Modification of Oligosaccharide-Lipid Synthesis and ProteinGlycosylation in Glucose-Deprived Cells. Archives of Biochemistry andBiophysics, 205: 330-339.
Ullrey, D. B. and H. M. Kalckar (1979). Methods for Specific Characterization of TraceAmounts of Uridine Nucleotides in Animal Cell Cultures. AnalyticalBiochemistry, 95: 245-249.
Umafia, P. and J. E. Bailey (1997). A Mathematical Model of N-Linked GlycoformBiosynthesis. Biotechnology and Bioengineering, 55: 890-908.
Vallino, J. J. and G. Stephanopoulos (1990). Flux Determination in Cellular BioreactionNetworks: Applications to Lysine Fermentations. In: S. K. Sikdar, M. Bier andP. Todd, Frontiers in Bioprocessing, CRC Press, Boca Raton, FL.
Velez, D.. S. Reuveny, L. Miller and J. D. Macmillan (1986). Kinetics of MonoclonalAntibody Production in Low Serum Growth Medium. Journal of ImmunologicalMethods, 86: 45-52.
Vogel, J. P., L. M. Misra and M. D. Rose (199C;. Loss of BiP/GRP78 Function BlocksTranslocation of Secretory Proteins in Yeast. Journal of Cell Biology, 110: 1885-1895.
Waldman, B. C., C. Oliver and S. S. Krag (1987). A Clonal Derivative of Tunicamycin-Resistant Chinese Hamster Ovary Cells -With Increased N-Acetylglucosamine-Phosphate Transferase Activity Has Altered Asparagine-Linked Glycosylation.Journal of Cellular Physiology, 131: 302-317.
Wang, F.-F. C. and C. H. W. Hirs (1977). Influence of the Heterosaccharides in PorcinePancreatic Ribonuclease on the Conformation and Stability of the Protein. TheJournal of Biological Chemistry, 252: 8358-8364.
Wang, N. S. and G. Stephanopoulos (1983). Application of Macroscopic Balances to theIdentification of Gross Measurement Errors. Biotechnology and Bioengineering,25: 2177-2208.
Ware, F. E., A. Vassilakos, P. A. Peterson, M. R. Jackson, M. A. Lehrman and D. B.Williams (1995). The Molecular Chaperone Calnexin Binds GlclMan 9 GlcNAc2
Oligosaccharide as an Initial Step in Recognizing Unfolded Glycoproteins. TheJournal of Biological Chemistry, 270: 4697-4704.
Weibel, E. R., W. Staubli, H. R. Gnagi and F. A. Hess (1969). Correlated Morphometricand Biochemical Studies on the Liver Cell. I. Morphometric Model, StereologicMethods and Normal Morphometric Data for Rat Liver. Journal of Cell Biology,42: 68-91.
234

Weiss, P. and G. Ashwell (1989). The Asialoglycoprotein Receptor: Properties andModulation by Ligand. In: P. Baumann, C. B. Eap, W. E. Muller and J.-P.Tillement, Alphal-Acid Glycoprotein: Genetics, Biochemistry, Physiological
Functions, and Pharmacology, Alan R. Liss, Inc., New York.
Wittwer, A. J. and S. C. Howard (1990). Glycosylation at Asn-184 Inhibits theConversion of Single-Chain to Two-Chain Tissue-Type Plasminogen Activator byPlasmin. Biochemistry, 29: 4175-4180.
Wooden, S. K., L.-J. Li, D. Navarro, I. Qadri, L. Pereira and A. S. Lee (1991).Transactivation of the grp78 Promoter by Malfolded Proteins, GlycosylationBlock, and Calcium Ionophore Is Mediated through a Proximal Region Containinga CCAAT Motif Which Interacts with CTF/NF-I. Molecular and CellularBiology, 11: 5612-5623.
Xie, L., G. Nyberg, X. Gu, H. Li, F. Mllborn and D. I. C. Wang (1997). Gamma-Interferon Production and Quality in Stoichiometric Fed-Batch Cultures ofChinese Hamster Ovary (CHO) Cells Under Serum-Free Conditions.Biotechnology and Bioengineering, 56: 577-582.
Xie, L. and D. I. C. Wang (1994a). Applications of Improved Stoichiometric Model inMedium Design and Fed-Batch Cultivation of Animal Cells in Bioreactor.Cytotechnology, 15: 17-29.
Xie, L. and D. I. C. Wang (1994b). Fed-Batch Cultivation of Animal Cells UsingDifferent Medium Design Concepts and Feeding Strategies. Biotechnology andBioengineering, 43: 1175-1189.
Xie, L. and D. I. C. Wang (1994c). Stoichiometric Analysis of Animal Cell Growth andIts Application in Medium Design. Biotechnology and Bioengineering, 43: 1164-1174.
Xie, L. and D. I. C. Wang (1996a). High Cell Density and High Monoclonal AntibodyProduction Through Medium Design and Rational Control in a Bioreactor.Biotechnology and Bioengineering, 51: 725-729.
Xie, L. and D. I. C. Wang (1996b). Material Balance Studies on Animal Cell MetabolismUsing a Stoichiometrically Based Reaction Network. Biotechnology andBioengineering, 52: 579-590.
Yu, Y., D. D. Sabatini and G. Kreibich (1990). Antiribophorin Antibodies Inhibit theTargeting to the ER Membrane of Ribosomes Containing Nascent SecretoryPolypeptides. The Journal of Cell Biology, 111: 1335-1342.
235
Yurchenco, P. D., C. Ceccarini and P. H. Atkinson (1978). Labeling ComplexCarbohydrates of Animal Cells with Monosaccharides. In: V. Ginsburg, ComplexCarbohydrates, Part C, Academic Press, New York.
Zettlmeissl, G., R. Rudolph and R. Jaenicke (1979). Reconsitution of LacticDehydrogenase. Noncovalent Aggregation vs. Reactivation. 1. PhysicalProperties and Kinetics of Aggregation. Biochemistry, 18: 5567-5571.
Zhang, Z., K.-T. Tong, M. Belew, T. Pettersson and J.-C. Janson (1992). Production,Purification and Characterization of Recombinant Human Interferon y. Journal ofChromatography, 604: 143-155.
Zhu, X., Y. Zeng and M. A. Lehrman (1992). Evidence That the Hamster TunicamycinResistance Gene Encodes UDP-GlcNAc:Dolichol Phosphate N-Acetylglucosamine-l-phosphate Transferase. The Journal of BiologicalChemistry, 267: 8895-8902.
Zupke, C. and G. Stephanopoulos (1995). Intracellular Flux Analysis in Hybridomas
Using Mass Balances and In Vitro 13C NMR. Biotechnology and Bioengineering,45: 292-303.
236

THESIS PROCESSING SLIP
FIXED FIELD: ill. name
Index biblio
COPIES: S Aero Dewey Eng Hum
Lindgren Music Rotch Scie
TITLE VARIES __
NAME VARIES:
IMPRINT
I COLLATION:
v qr Th. 4,- feI
(COPYRIGHT)
ADD. DEGREE: ' DEPT.:
SUPERVISORS:
NOTES:
cat'r: date:
ADEPT: Cke vw C ge
*YEAR: - /D -*DEGREE:
PNAME: A(6 G6 , Get S.
-
-
_
__ ->_
5 _ _ _ .. . .
;;'1'