globalization and technology diffusion richard newfarmer special representative to the wto and un...
TRANSCRIPT

Globalization and Technology
Diffusion
Richard Newfarmer
Special Representative
to the WTO and UN
World BankMarch 10, 2008
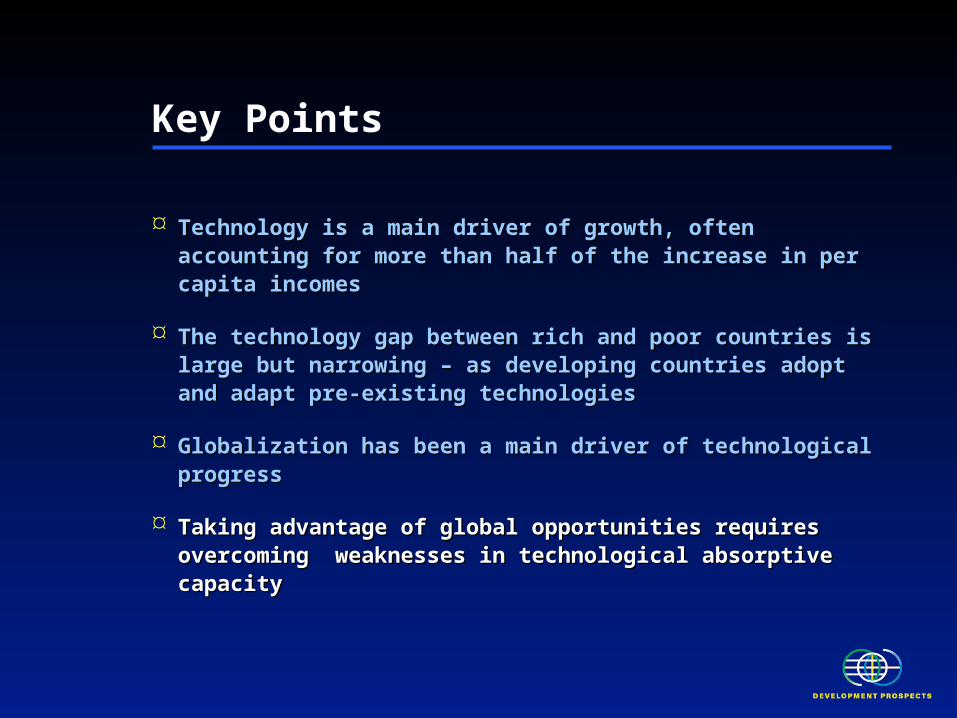
Key Points
Technology is a main driver of growth, often accounting for Technology is a main driver of growth, often accounting for more than half of the increase in per capita incomesmore than half of the increase in per capita incomes
The technology gap between rich and poor countries is large The technology gap between rich and poor countries is large but narrowing – as developing countries adopt and adapt but narrowing – as developing countries adopt and adapt pre-existing technologiespre-existing technologies
Globalization has been a main driver of technological Globalization has been a main driver of technological progressprogress
Taking advantage of global opportunities requires Taking advantage of global opportunities requires overcoming weaknesses in technological absorptive overcoming weaknesses in technological absorptive capacitycapacity
0
1
2
3
4
5
6
7
8
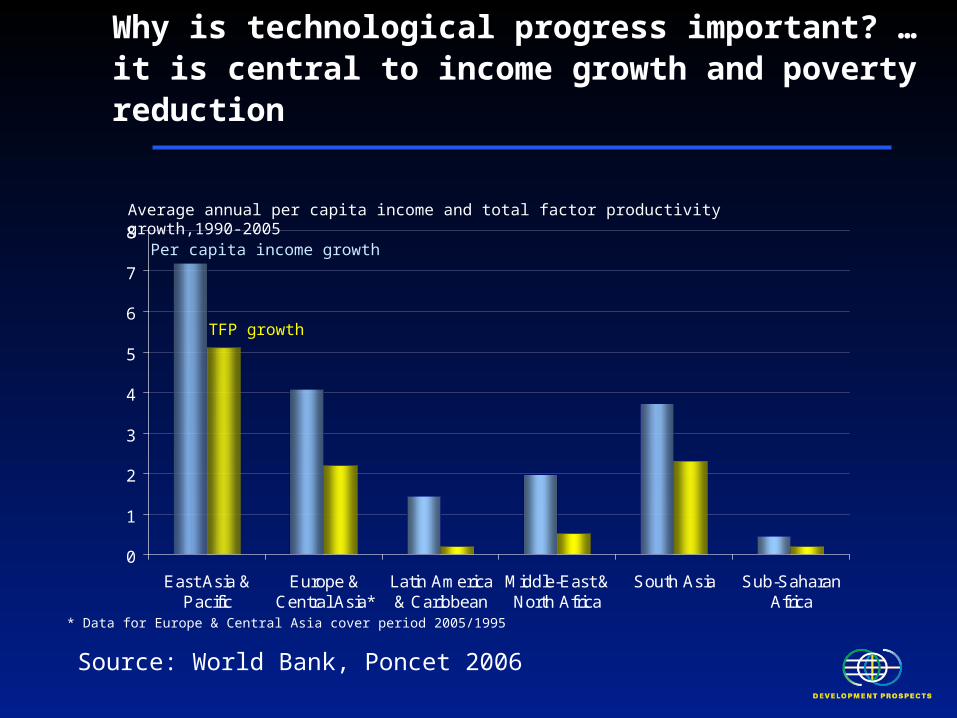
East Asia &Pacific
Europe &Central Asia*
Latin America& Caribbean
Middle-East &North Africa
South Asia Sub-SaharanAfrica
Why is technological progress important? … it is central to income growth and poverty reduction
Source: World Bank, Poncet 2006
* Data for Europe & Central Asia cover period 2005/1995
Average annual per capita income and total factor productivity growth,1990-2005
Per capita income growth
TFP growth
-4
-3
-2
-1
0
1
2
3
4
5
6
7
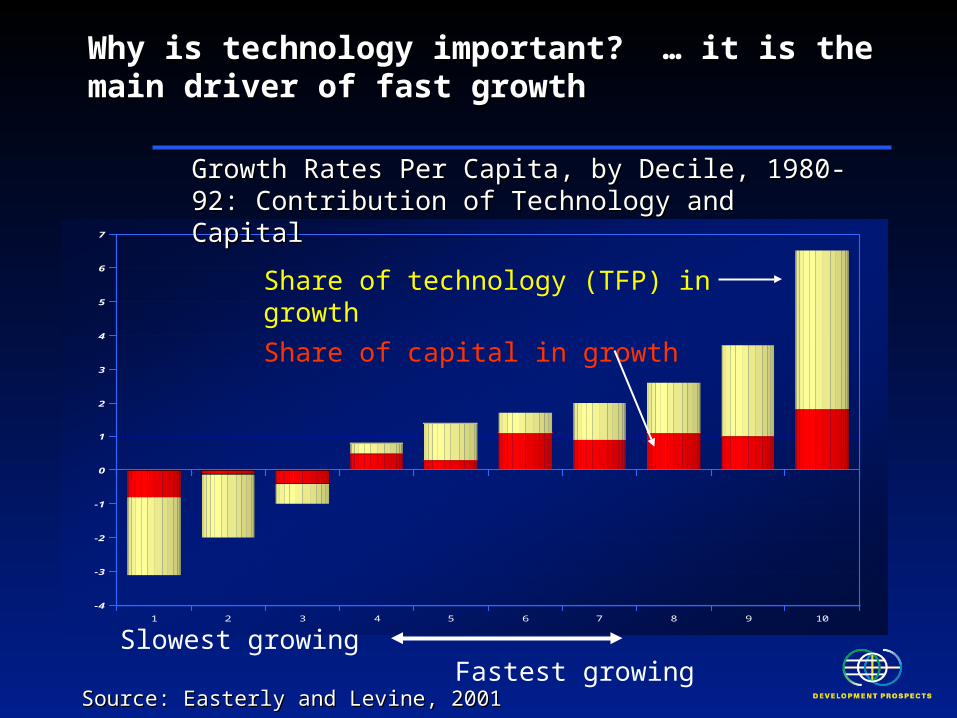
1 2 3 4 5 6 7 8 9 10
Source: Easterly and Levine, 2001Source: Easterly and Levine, 2001
Why is technology important? … it is the main driver Why is technology important? … it is the main driver of fast growthof fast growth
Growth Rates Per Capita, by Decile, 1980-92: Growth Rates Per Capita, by Decile, 1980-92: Contribution of Technology and Capital Contribution of Technology and Capital
Slowest growing Fastest growing
Share of technology (TFP) in growth
Share of capital in growth
Key Points
Technology is a main driver of growth, often Technology is a main driver of growth, often accounting for more than half of the increase in per accounting for more than half of the increase in per capita incomescapita incomes
The technology gap between rich and poor countries is The technology gap between rich and poor countries is large but narrowing – as developing countries pre-large but narrowing – as developing countries pre-existing technologiesexisting technologies
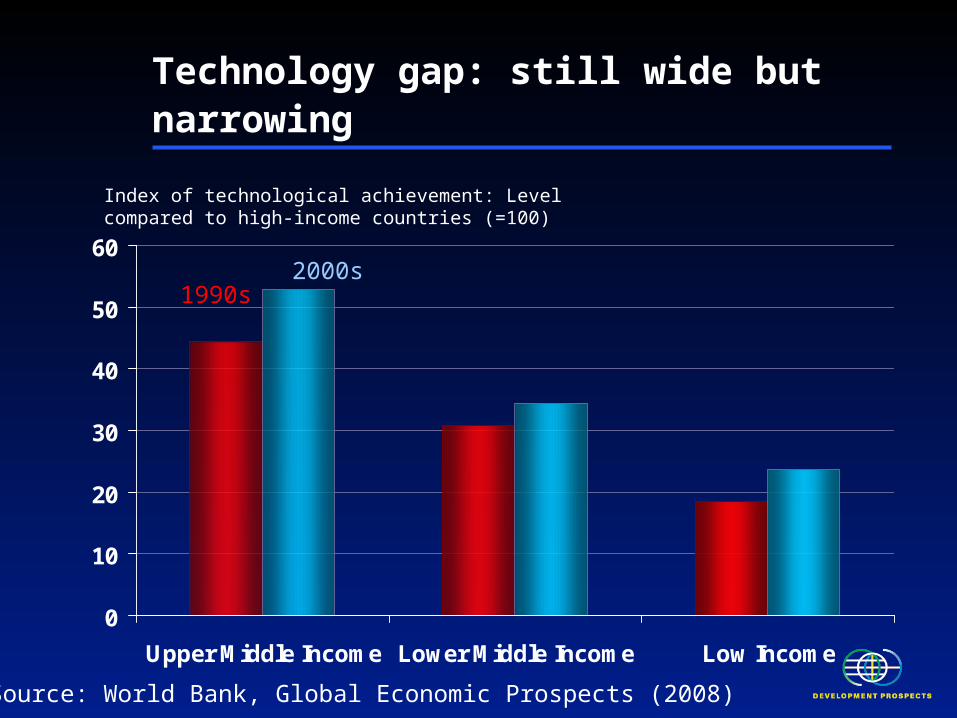
Technology gap: still wide but narrowing
0
10
20
30
40
50
60
Upper Middle Income Lower Middle Income Low Income
Index of technological achievement: Level compared to high-income countries (=100)
1990s2000s
Source: World Bank, Global Economic Prospects (2008)
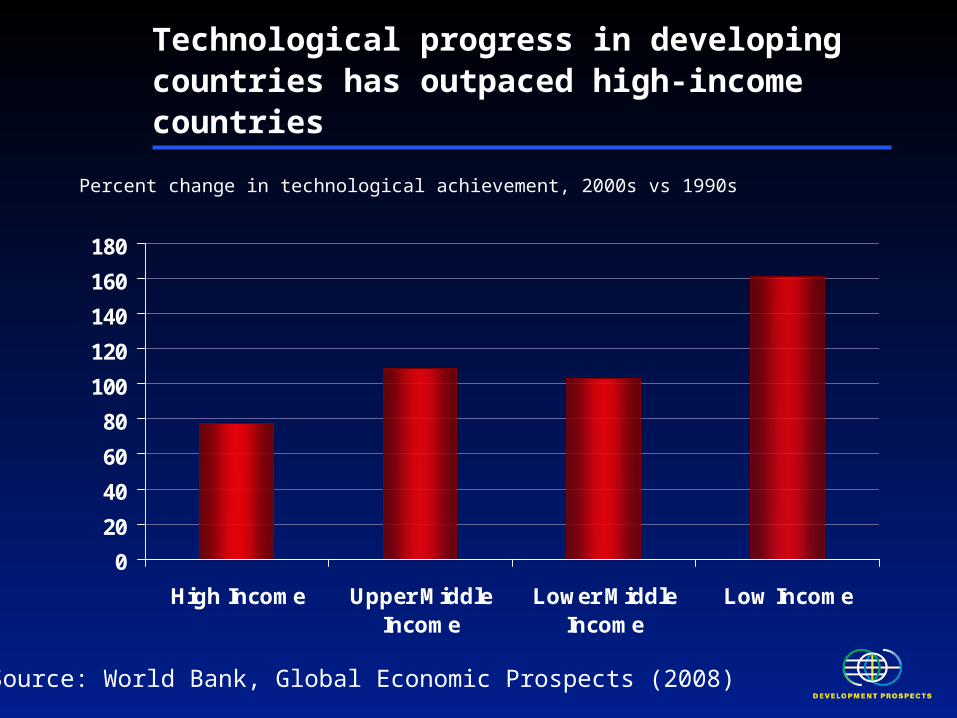
Technological progress in developing countries has outpaced high-income countries
0
20
40
60
80
100
120
140
160
180
High Income Upper MiddleIncome
Lower MiddleIncome
Low Income
Percent change in technological achievement, 2000s vs 1990s
Source: World Bank, Global Economic Prospects (2008)
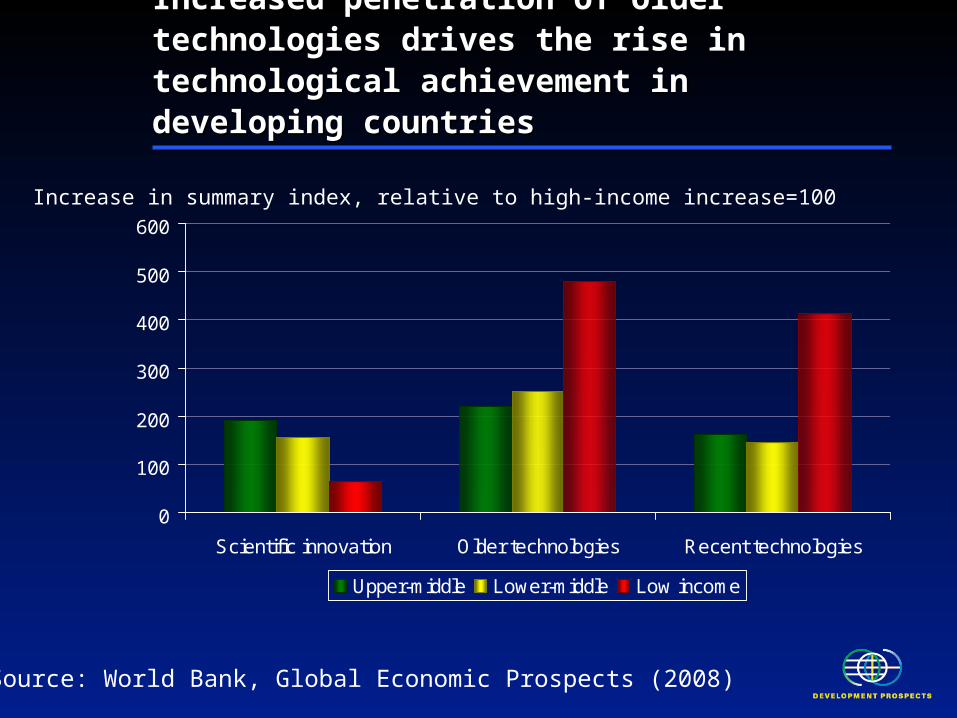
Increased penetration of older technologies Increased penetration of older technologies drives the rise in technological achievement in drives the rise in technological achievement in developing countriesdeveloping countries
0
100
200
300
400
500
600
Scientific innovation Older technologies Recent technologies
Upper-middle Lower-middle Low income
Increase in summary index, relative to high-income increase=100
Source: World Bank, Global Economic Prospects (2008)
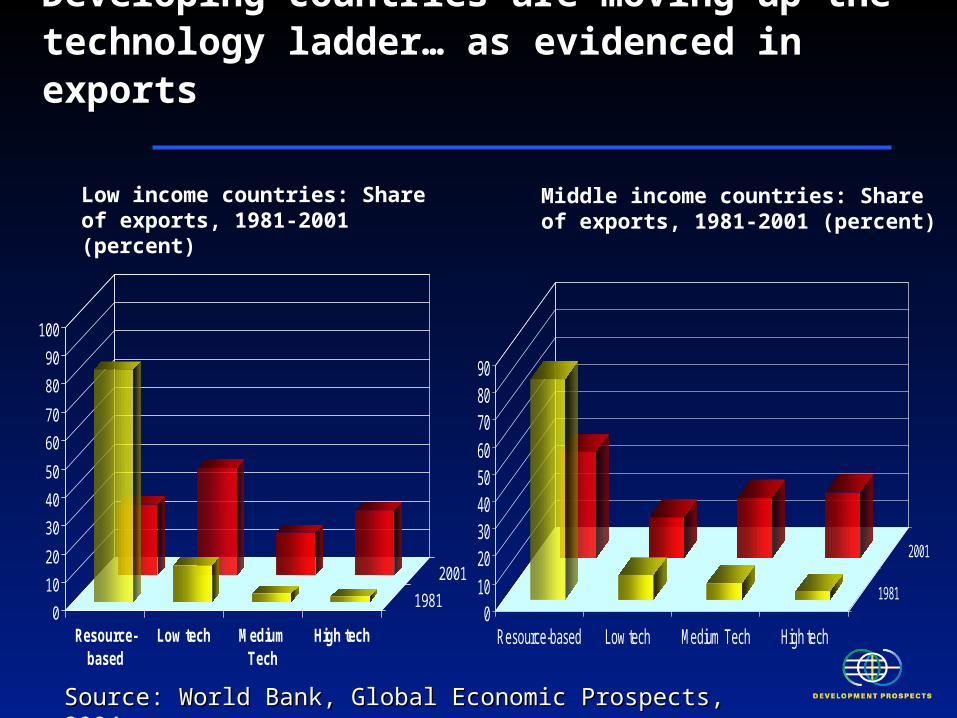
Developing countries are moving up the Developing countries are moving up the technology ladder… as evidenced in exportstechnology ladder… as evidenced in exports
0
10
20
30
40
50
60
70
80
90
100
Resource-based
Low tech MediumTech
High tech
1981
2001
Low income countries: Share of exports, 1981-2001 (percent)
0102030405060708090
Resource-based Low tech Medium Tech High tech
1981
2001
Middle income countries: Share of exports, 1981-2001 (percent)
Source: World Bank, Global Economic Prospects, 2004Source: World Bank, Global Economic Prospects, 2004
Key Points
Technology is a main driver of growth, often accounting for more than half of the increase in per capita incomes
The technology gap between rich and poor countries is large but narrowing – as developing countries pre-existing technologies
Globalization has been a main driver of technological progress
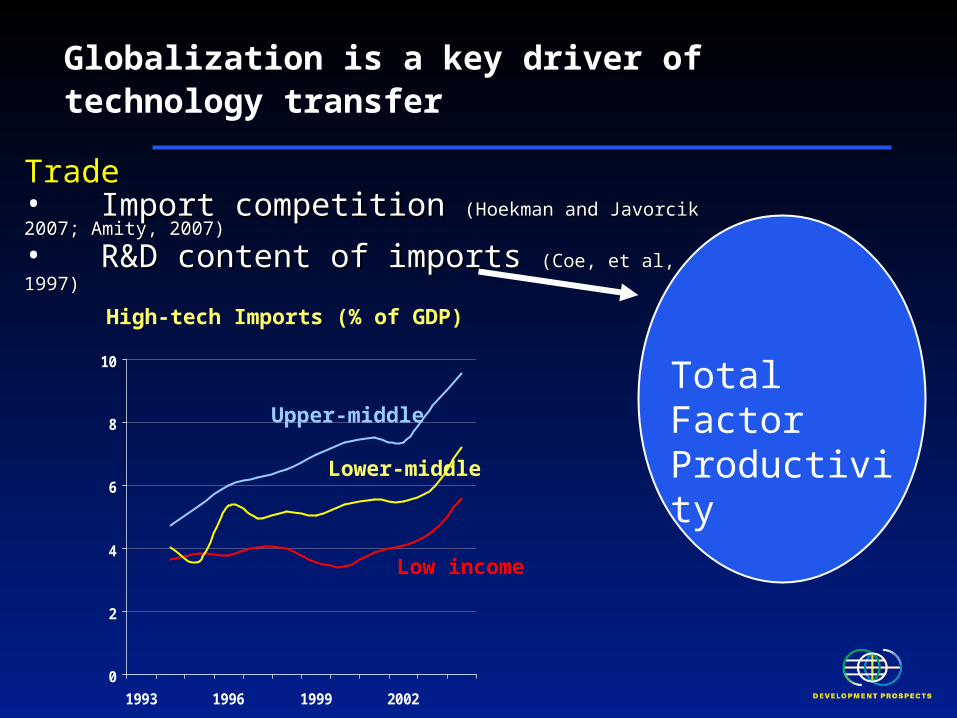
Globalization is a key driver of technology transfer
TradeTrade• Import competition Import competition (Hoekman and Javorcik 2007; Amity, 2007)(Hoekman and Javorcik 2007; Amity, 2007)
• R&D content of imports R&D content of imports (Coe, et al, 1997)(Coe, et al, 1997)
Total Factor Productivity
0
2
4
6
8
10
1993 1996 1999 2002
High-tech Imports (% of GDP)
Upper-middle
Low income
Lower-middle
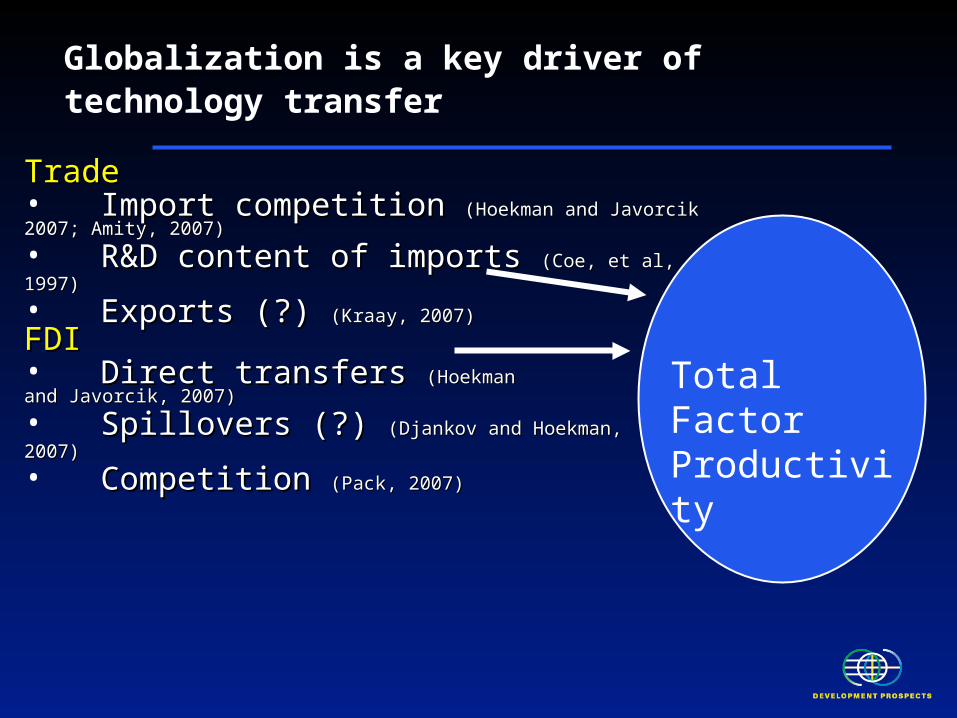
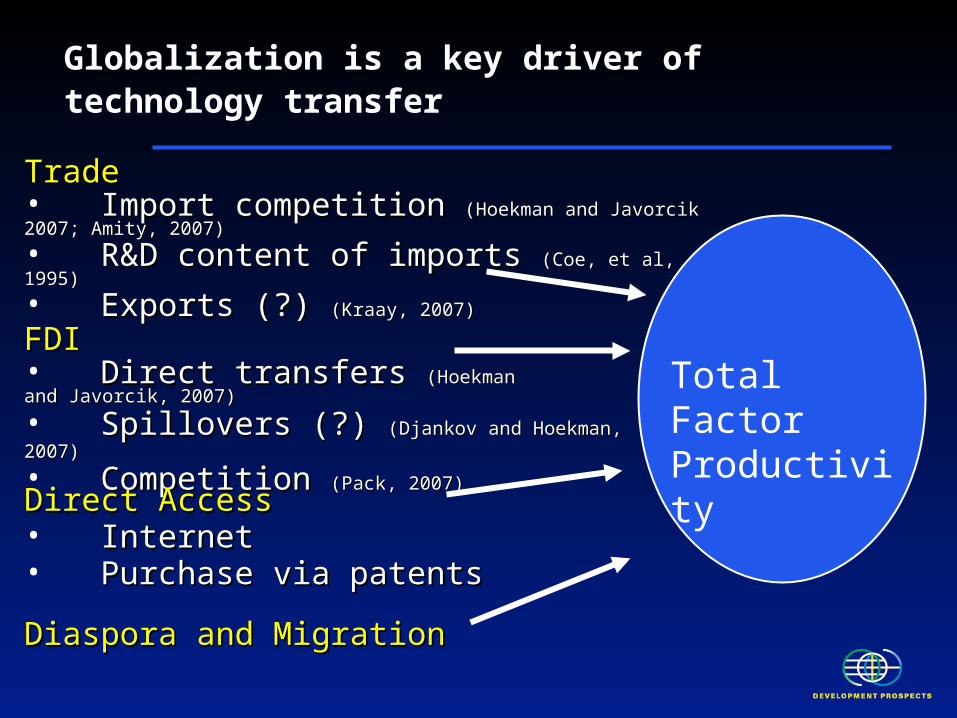
Globalization is a key driver of technology transfer
TradeTrade• Import competition Import competition (Hoekman and Javorcik 2007; Amity, 2007)(Hoekman and Javorcik 2007; Amity, 2007)
• R&D content of imports R&D content of imports (Coe, et al, 1997)(Coe, et al, 1997) • Exports (?) Exports (?) (Kraay, 2007)(Kraay, 2007)
Total Factor Productivity
FDIFDI• Direct transfers Direct transfers (Hoekman (Hoekman and Javorcik, 2007)and Javorcik, 2007)
• Spillovers (?) Spillovers (?) (Djankov and Hoekman, 2007)(Djankov and Hoekman, 2007) • Competition Competition (Pack, 2007)(Pack, 2007)
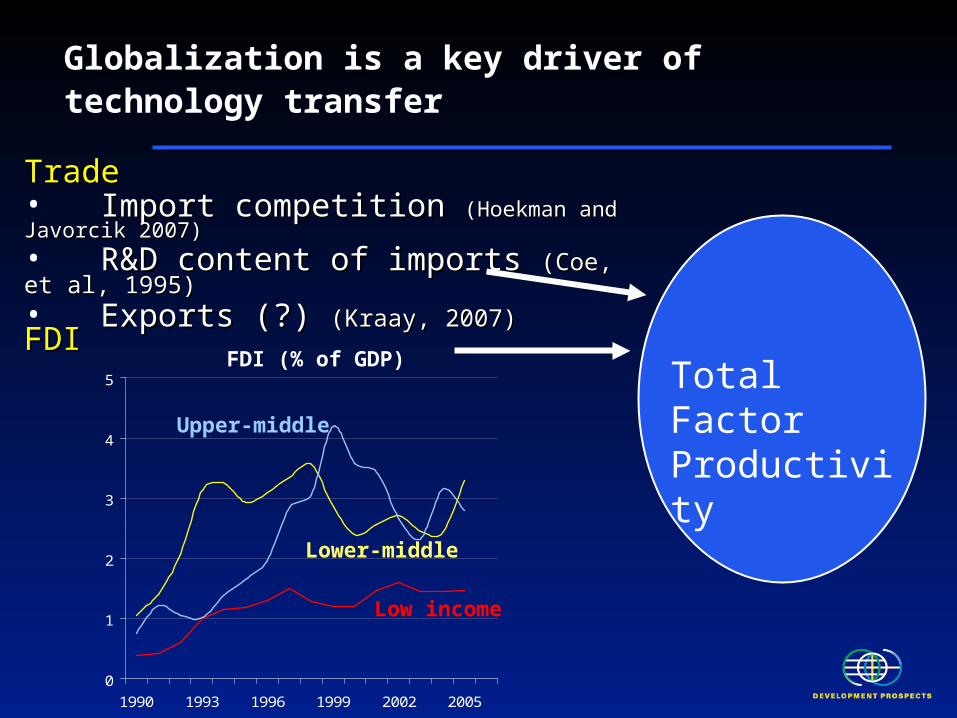
Globalization is a key driver of technology transfer
TradeTrade• Import competition Import competition (Hoekman and Javorcik 2007)(Hoekman and Javorcik 2007)
• R&D content of imports R&D content of imports (Coe, et al, 1995) (Coe, et al, 1995) • Exports (?) Exports (?) (Kraay, 2007)(Kraay, 2007)
Total Factor Productivity
FDIFDI
0
1
2
3
4
5
1990 1993 1996 1999 2002 2005
FDI (% of GDP)
Low income
Upper-middle
Lower-middle
Globalization is a key driver of technology transfer
TradeTrade• Import competition Import competition (Hoekman and Javorcik 2007; Amity, 2007)(Hoekman and Javorcik 2007; Amity, 2007)
• R&D content of imports R&D content of imports (Coe, et al, 1995) (Coe, et al, 1995)
• Exports (?) Exports (?) (Kraay, 2007)(Kraay, 2007)
Total Factor Productivity
FDIFDI• Direct transfers Direct transfers (Hoekman (Hoekman and Javorcik, 2007)and Javorcik, 2007)
• Spillovers (?) Spillovers (?) (Djankov and Hoekman, 2007)(Djankov and Hoekman, 2007) • Competition Competition (Pack, 2007)(Pack, 2007)
Direct AccessDirect Access• InternetInternet• Purchase via patents Purchase via patents
Diaspora and MigrationDiaspora and Migration
Key Points
Technology is a main driver of growth, often accounting for Technology is a main driver of growth, often accounting for more than half of the increase in per capita incomesmore than half of the increase in per capita incomes
The technology gap between rich and poor countries is large The technology gap between rich and poor countries is large but narrowing – as developing countries adopt and adapt but narrowing – as developing countries adopt and adapt pre-existing technologiespre-existing technologies
Globalization has been a main driver of technological Globalization has been a main driver of technological progressprogress
Taking advantage of global opportunities requires Taking advantage of global opportunities requires overcoming weaknesses in technological absorptive overcoming weaknesses in technological absorptive capacitycapacity
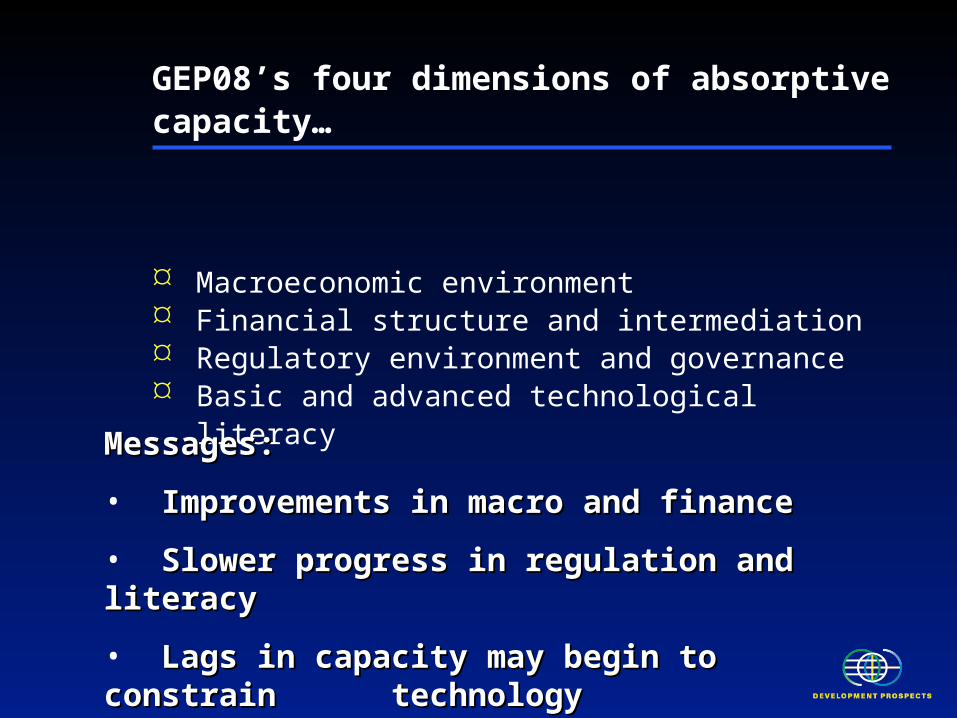
GEP08’s four dimensions of absorptive capacity…
Macroeconomic environment Financial structure and intermediation Regulatory environment and governance Basic and advanced technological literacy
Messages:Messages:
• Improvements in macro and finance Improvements in macro and finance
• Slower progress in regulation and literacySlower progress in regulation and literacy
• Lags in capacity may begin to constrain Lags in capacity may begin to constrain technology achievementtechnology achievement
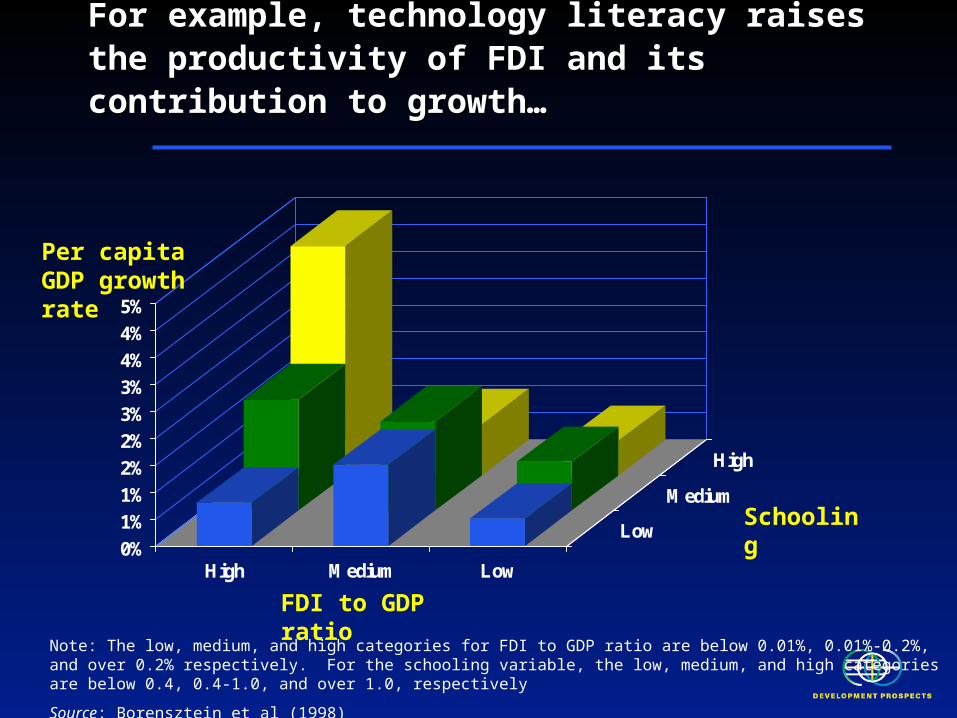
For example, technology literacy raises the For example, technology literacy raises the productivity of FDI and its contribution to growth…productivity of FDI and its contribution to growth…
0%
1%
1%
2%
2%
3%
3%
4%
4%
5%
High Medium Low
Low
Medium
High
Per capita GDP growth rate
FDI to GDP ratio
Schooling
Note: The low, medium, and high categories for FDI to GDP ratio are below 0.01%, 0.01%-0.2%, and over 0.2% respectively. For the schooling variable, the low, medium, and high categories are below 0.4, 0.4-1.0, and over 1.0, respectively
Source: Borensztein et al (1998)
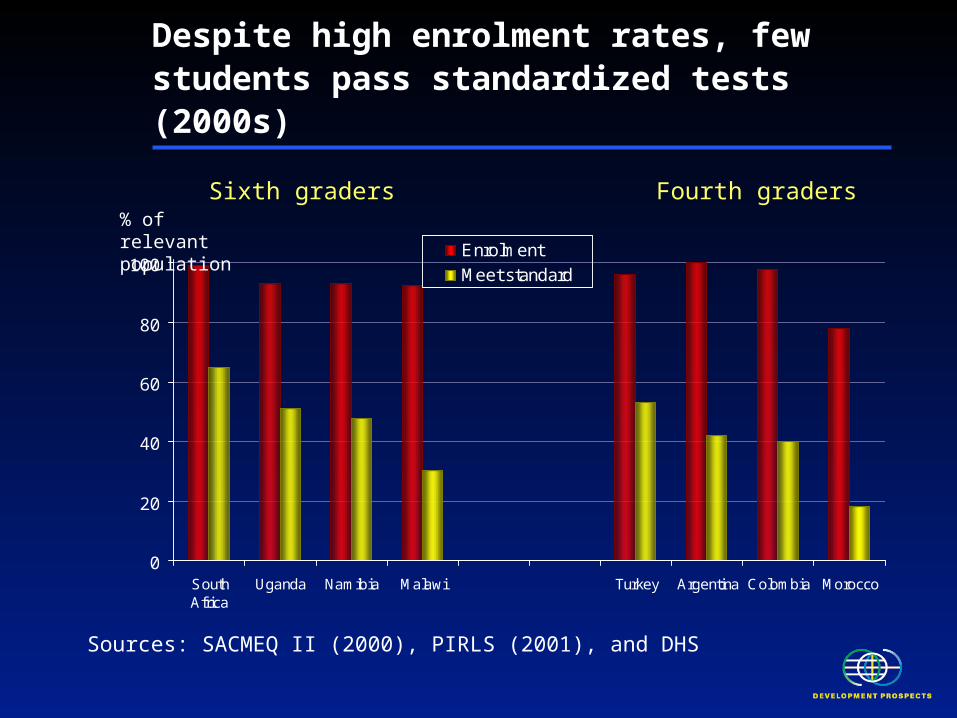
Despite high enrolment rates, few students pass standardized tests (2000s)
0
20
40
60
80
100
SouthAfrica
Uganda Namibia Malawi Turkey Argentina Colombia Morocco
Enrolment
Meet standard
Sixth graders Fourth graders
Sources: SACMEQ II (2000), PIRLS (2001), and DHS
% of relevant population
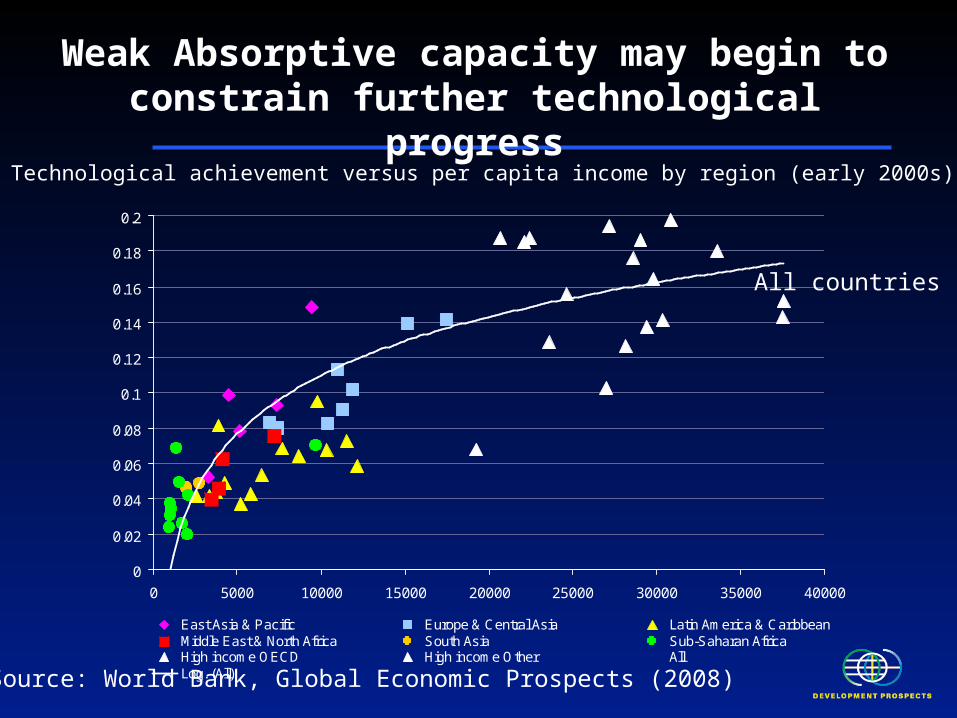
0
0.02
0.04
0.06
0.08
0.1
0.12
0.14
0.16
0.18
0.2
0 5000 10000 15000 20000 25000 30000 35000 40000
East Asia & Pacific Europe & Central Asia Latin America & CaribbeanMiddle East & North Africa South Asia Sub-Saharan AfricaHigh income OECD High income Other AllLog. (All)
Technological achievement versus per capita income by region (early 2000s)
Weak Absorptive capacity may begin to constrain further technological progress
All countries
Source: World Bank, Global Economic Prospects (2008)
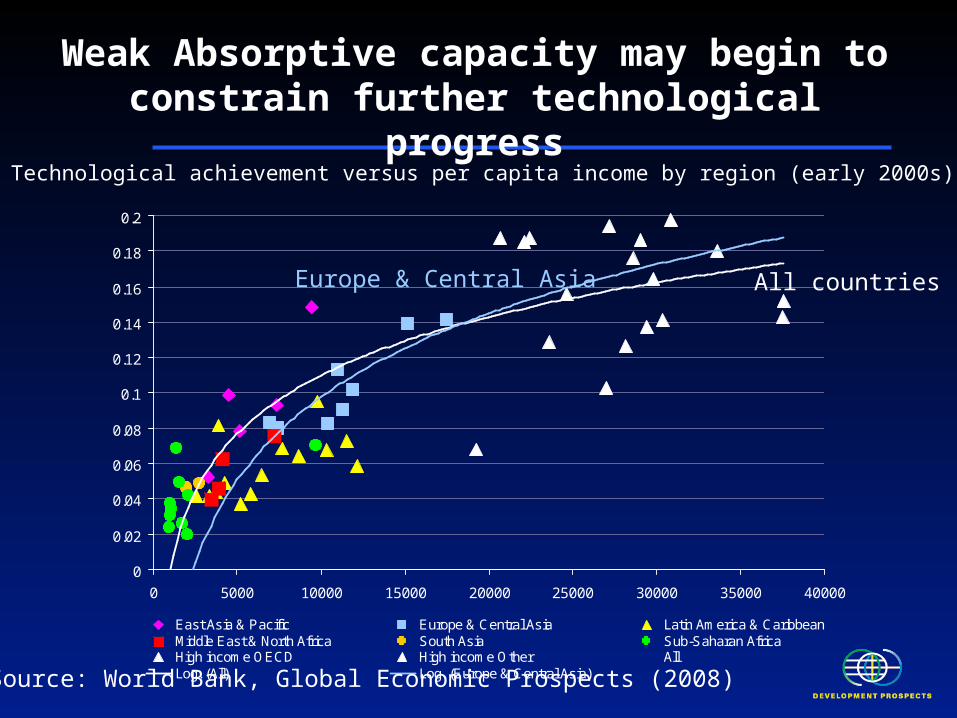
0
0.02
0.04
0.06
0.08
0.1
0.12
0.14
0.16
0.18
0.2
0 5000 10000 15000 20000 25000 30000 35000 40000
East Asia & Pacific Europe & Central Asia Latin America & CaribbeanMiddle East & North Africa South Asia Sub-Saharan AfricaHigh income OECD High income Other AllLog. (All) Log. (Europe & Central Asia)
Weak Absorptive capacity may begin to constrain further technological progress
All countriesEurope & Central Asia
Source: World Bank, Global Economic Prospects (2008)
Technological achievement versus per capita income by region (early 2000s)
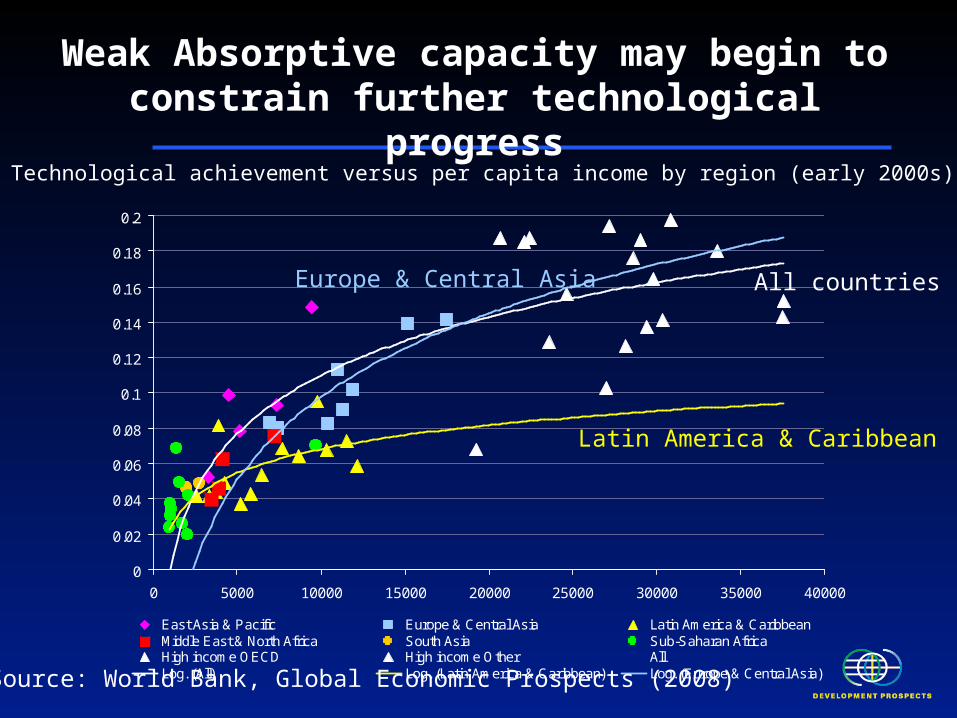
0
0.02
0.04
0.06
0.08
0.1
0.12
0.14
0.16
0.18
0.2
0 5000 10000 15000 20000 25000 30000 35000 40000
East Asia & Pacific Europe & Central Asia Latin America & CaribbeanMiddle East & North Africa South Asia Sub-Saharan AfricaHigh income OECD High income Other AllLog. (All) Log. (Latin America & Caribbean) Log. (Europe & Central Asia)
Weak Absorptive capacity may begin to constrain further technological progress
All countries
Latin America & Caribbean
Europe & Central Asia
Source: World Bank, Global Economic Prospects (2008)
Technological achievement versus per capita income by region (early 2000s)
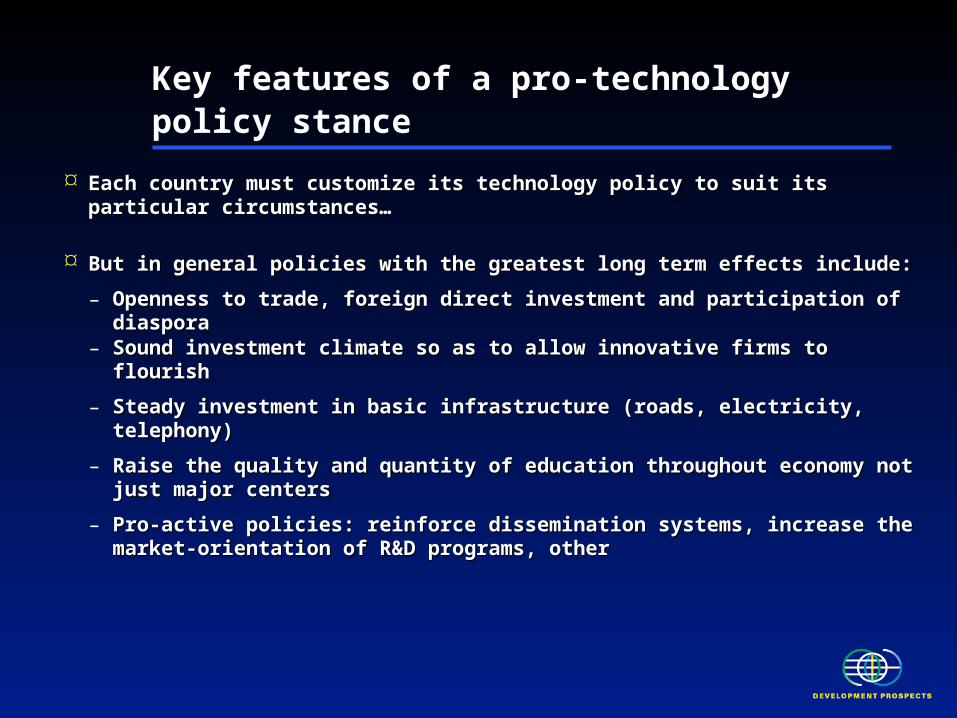
Key features of a pro-technology policy stance
Each country must customize its technology policy to suit its particular Each country must customize its technology policy to suit its particular circumstances… circumstances…
But in general policies with the greatest long term effects include:But in general policies with the greatest long term effects include:
– Openness to trade, foreign direct investment and participation of Openness to trade, foreign direct investment and participation of diasporadiaspora
– Sound investment climate so as to allow innovative firms to flourishSound investment climate so as to allow innovative firms to flourish
– Steady investment in basic infrastructure (roads, electricity, telephony) Steady investment in basic infrastructure (roads, electricity, telephony)
– Raise the quality and quantity of education throughout economy not just Raise the quality and quantity of education throughout economy not just major centersmajor centers
– Pro-active policies: reinforce dissemination systems, increase the Pro-active policies: reinforce dissemination systems, increase the market-orientation of R&D programs, othermarket-orientation of R&D programs, other

References and further reading
Amity, Mary and J. Konings 2007 “Trade Liberalization, Intermediate Inputs, and Productivty: Evidence From Indonesia”, American Economic Review 97:5 pp 1611-1638
Borenstein, Eduardo, J. de Gregirio, andJ. W. Lee 1998 “How does Foreign Direct Investment Affect Economic Growth?” Journal of International Economics 45 (1): 115-35
Coe, David, E. Helpman and W. Hoffmaister, 1997. “North South R&D Spillovers Economic Journal 107 (January 134-149)
Djankov, Simeon and Bernard Hoekman 2007 “Market Discipline and Corporate Efficiency:Evidence from Bulgaria” in Hoekman and Javorcik, 2007 (cited below).
Easterly, William and Ross Levine “Its not Factor Accumulation: Stylized Facts and Growth Models” World Bank Economic Review Vol. 15 No 2 pp 177-219
Fink, Carsten, A. Matoo, and R. Rathindran 2002 “Liberalizing Basic Telecommunications: Evidence from Developing coutnries: World Bank Working Paper: Washington DC
Hallward-Dreimeirer, Mary and G. Iarossi, and K. Sokoloff 2002. “Exports and Manufacturing Productivity in East Asia: A Comparative Analysis with Firm-Level Data” National Bureau of Economic Research Working Paper no. 8894 Cambridge, Mass.
Hoekman, Bernard and Beata S. Javorcik, 2007. (eds.) Global Integration and Technology Transfer Palgrave-McMillan and World Bank: Washington DC
This presentation is adapted from that of the This presentation is adapted from that of the Global Economic Prospects 2008Global Economic Prospects 2008 team, led by Andrew Burns, World Bankteam, led by Andrew Burns, World Bank
References and further reading (con’d)
Kraay, Aart 2007 “Exports and Economic Performance: Evidence from a Panel of Chinese Enterprises” in Hoekman and Javorcik, 2007 (above).
Pack, Howard “Econometric versus Case Study Approaches to Technology Transfer” in Hoekman and Javorcik ,2007 (cited above)
Poncet, Sandra 2006 “The long-Term Growth Prospects of he Wrold Economic Horizon 2050 Working Paper 2006-16 Centre d’Etudes Prospectives et d’Informations Internationale
World Bank, Global Economic Prospects 2003: Investing to Unlock Global Opportunities World Bank: Washington
World Bank, Global Economic Prospects 2004: Realizing the Development Promise of the Doha Agenda World Bank: Washington DC.
World Bank Global Economic Prospects 2008: Technology Diffusion in the Developing World World Bank: Washington DC.
Technology diffusion in the
developing world
For more info:
GEP: http://www.worldbank.org/gep2008
Trade: http://www.worldbank.org/trade