accession to wto and asymmetric globalization -...
TRANSCRIPT

International Journal of Academic Research in Business and Social Sciences March 2014, Vol. 4, No. 3
ISSN: 2222-6990
557 www.hrmars.com
Accession to WTO and Asymmetric Globalization
Hamid Reza Ashrafzadeh Institute for Trade Studies and Research, Tehran, Iran
Maysam Musai Professor of Economics, University of Tehran, Tehran, Iran
E-mail: [email protected]
Mohsen Mehrara Professor of Economics, University of Tehran, Tehran, Iran
DOI: 10.6007/IJARBSS/v4-i3/737 URL: http://dx.doi.org/10.6007/IJARBSS/v4-i3/737
Abstract In this paper, using LSDV approach to testing the effects of accession to GATT/WTO in a panel of developed and developing countries, we find that accession, on average has positive effects on the GDP and export of developed countries and has negative impact on GDP of many developing countries with the negative effects on export for a number of them. Especially in Africa this negative effects is remarkable and this results, while shed some light on the conflicts in the literature on links between trade policy and growth, point to the challenges confront many countries in the process of globalization. It is shown that for 31 out of 46 developing countries in the sample the effects of membership on GDP are negative while only for 15 out of 46 the impact on export is negative. Keywords: Asymmetry, Globalization, WTO, GATT. 1-Introduction The process of globalization started from intensified trade flows in seventeen and eighteen centuries and became the dominant pattern of economic growth for today's developed countries in nineteen century. This process came to a tentative halt in the first half of twenty century, especially after WWI and great depression. From the WWII onward, after a period of rapid growth in 1960s, a decade came when the growth process went slow in 1970s, and 1980 was the decade of lost growth. But, after a brief review of economic history in the 1980s and 1990s it is become clear that the process of Technology Transfer (TT), Foreign Direct Investment (FDI), and Economic Liberalization (EL) led to rapid growth in emerging markets in the East Asia, Some part of Latin America (although with some crisis scenario), Turkey, in Eastern European countries, some CIS countries, and especially in people’s Republic of China after sweeping reforms in Socialistic system.

International Journal of Academic Research in Business and Social Sciences March 2014, Vol. 4, No. 3
ISSN: 2222-6990
558 www.hrmars.com
It is clear from this brief historical and current review that in a great deal of countries, the process of growth and development was not, and is not, smooth. The main hypothesis of this paper is that the process of globalization, marked with TT, FDI and EL and Trade Liberalization (TL), had not the same effects on all countries, and to some degree, even the emerging market economies. This asymmetric effect is the main challenge of globalization which is deserved to be studied deeply. In this paper we take an especial theme of globalization, i.e. trade liberalization in the form of World Trade Organization (WTO) membership. We hypothesize that accession to GATT/ WTO has asymmetric effects on the export and GDP of developed and developing countries. For the purposes of demonstrating this issue, we construct a large panel of 136 countries, Developed and Developing, and measuring the effects of accession to GATT/WTO on export and GDP level by using dummy variables and estimating the pooled model of export and GDP by Least Square Dummy variables (LSDV). Results show that accession to GATT/WTO has, in general, Positive effects on export and GDP of Developed countries, while has negative effects on these variables for a large number of Developing countries. The contribution of paper is that while testing the cross effects of export and GDP on each other and confirming the positive effects of these two variables on each other, and thereby affirming the positive side of globalization on growth, assert that the effect of globalization on the GDP and export levels of countries is asymmetric, which pose serious problems for the process of trade liberalization in the form of GATT/WTO accession, both in the past and at the present time. After a brief review of literature in section 2, we present the econometric models in section 3. In section four the results is presented and section five devoted to conclusion. 2-Literature review First of all, it is interesting to review the recent literature on trade liberalization and growth, which is the clue to the study of the effects of GATT and WTO on export and GDP. There is a very huge literature concerning the relationship between export and GDP, Which is, in nature, and to a great deal, empirical. Krueger (1978) is pioneer on this subject, which takes a measure of trade Liberalization and studies its effects on export and GDP. Since then, came huge empirical papers concerning the issue, some confirming positive relationship and others negate such a relation. Since these works was empirical, there came no consensus on the relationship and literature continues even to this date, a glance at which we have here.
Sebastian Edwards (1993) believe that there is not a theory which relates trade policy to

International Journal of Academic Research in Business and Social Sciences March 2014, Vol. 4, No. 3
ISSN: 2222-6990
559 www.hrmars.com
growth, and in the neoclassical framework it can be only seen the effects of policies on the output level, not on the growth rate. Sachs and Warner (1995) provide an index of trade openness and Using Summers and Heston's data, Show the Positive relationship between open trade policy and economic growth for 1970-89 in 117 countries.
Baldwin and Forslid (1998, 2000) argues that many of the Links between trade and growth is not formally presented theoretically and while in their first paper, they show that policy changes, such as trade liberalization, can have positive effects on firms profit and investment and innovation, in the second paper analyze the effects of endogenous growth theory, and provide two links between trade and growth: economies of scale and imperfect competition, in R&D and financial intermediaries. They show that trade liberalization can enhance growth via the promotion effects of R&D and financial intermediaries on growth.
For China, Qiao Yu (1998) Shows that investment in fixed capital, and merchandize exports, are two important determinants of china’s economic growth and while finds a one way causal relation between export and industrial output, there is not such a relationship between "imports” and output. In other words, China’s export promotion strategy promote economic growth, open “import” policy did not help economic performance.
These results are very important because have some implications for our hypothesis. Developing countries need access to Developed countries markets to grow via export, and while is in need of an open import policy for inputs used in the manufacturing of export products (Ianchovichina, Martin, and Fukase (2001)), this open import policy (Which is the byproduct of WTO accession) has not any effect on output (and so exports). This is a contradictory result, since inputs used in the production of export products, but contrary to the fact that export constitutes a big fraction of China's GDP, the import regime (open import policy) has no effect on economic performance. Combining these results, one may conclude that market access is key factor in having globalization positive effects on development (and growth) of Developing countries, but open trade policy may have not any effect on economic performance. Is there a mysterious relationship between overall trade policy direction and economic growth, or this is an asymmetric trade liberalization effect between developed and developing countries, or two different impact of WTO on these groups of countries? This paper believes in asymmetric effects of GATT and WTO membership on export and GDP (an Index of economic performance). In our view, these asymmetric effects are first of all seen for some group of developing countries, especially in Africa, and this can be traced back to weak infrastructure for technology transfer, attracting FDI, and weak institutional infrastructure, which can guide open trade policy to promote export and economic performance. It is interesting to test the political and Institutional infrastructure of negatively impacted countries from accession to GATT and WTO, and find that whether weaknesses in these two areas lead to these results or the international Institutional or political weakness deliver such a results. We have not any position regarding this question, only report results.
Some writers like Stiglitz relate this uneven effect of globalization to pressure of international institutions on some countries for undue liberalization and aggregate demand policies which expose developing countries to vulnerability from any policy changes. Others such as Ha Joon Chang (2005), put emphasize on the unbalancing power of countries in the process of trade negotiation and especially put great importance to NAMA market access negotiations. Some argue that developing countries have not balancing power to counter the

International Journal of Academic Research in Business and Social Sciences March 2014, Vol. 4, No. 3
ISSN: 2222-6990
560 www.hrmars.com
pressure of Developed countries and reaching the desired results from negotiation. In any event, we can enter in two early conclusions regarding these issues. First, due to the lack of industrial capacity in these countries, they have not sufficient ability to exert maximum possible benefit from market access capacity of WTO. This leads us to two different strands of reasoning. First, lacking industrial capacity means losing opportunity to stronger rivals. This is in essence a result of political inability to develop better policies and opportunities. This in turn is due to corruption and opportunistic and predatory nature of governments. Second, lacking industrial capacity is a result of nonexistence of equal opportunity in the global market and favoring some especial developing countries by multinationals and channeling their investment flows and technological transfers to them.
In our view, it is the fundamental cause of mixed results of empirical literature on the trade policy and growth relationship. This pose very complex situation in the globalization process because establishing sound institutions in developing countries require a coherence in political arena but pursuing ideological or class interests is the main cause of lacking coherence and consensus in development policy. This characteristics often makes development strategies in some developing countries a tools in the hands of dominant interest groups or dictatorship governments, appropriating the benefit of import liberalization to themselves, while leaving exporters or industrial capitalists to a great deal of risk and all the difficulties of competition, which reduce the scope of economies of scale and R&D which contribute to output and export.
This is in contrast to WTO membership goals as stated by Mansfield and Reinhardt (2008) who state that "Governments seek to insulate their economies from such instability in trade Institutions, particularly WTO and PTAs”. They hypothesize that this institutions reduce the volatility of overseas commerce, and because market actors prefer price stability, trade institutions increase the volume of foreign commerce by reducing trade variability.
With respect to international institution Hoekman and Saggi (2004) Suggest a model which explores the incentives of a developing country to offer increased market access (by way of a tariff reduction) in exchange for a ban on foreign export cartels by its developed country trading partner. They show that such a bargain is feasible and can generate a globally welfare-maximizing outcome. Export cartels of developed countries are seen as a hindrance to a developing country export and these countries have incentive to “pay” for competition enforcement by the developed countries. They show that there exist circumstances in which tariff is more effective in sustaining cooperation than the transfer, and scope for cooperation is maximized when both instruments (tariff concessions and transfers) are used. The implication of their analysis is that developing countries have incentives to support an explicit WTO Prohibition of export cartels.
These results are of sharp contrast to Ha Joon Chang (2005) analysis which states that developing countries need tariffs.
Now we can return to literature concerning import regimes of developing countries, and specifically to China’s accession to WTO. Ianchovichina, Martin and Fukase(2001) argue that accession to WTO will be a turning point for china. It involves reforms across a wide range of sectors in china and the implications of these reforms are greatly influenced by the starting point- a partially reformed economy with relatively high import duties, but in which export sectors benefit from liberal duty exemption on the input used in the production of exports. They continue to say that China and its major trading partners are estimated to gain from

International Journal of Academic Research in Business and Social Sciences March 2014, Vol. 4, No. 3
ISSN: 2222-6990
561 www.hrmars.com
accession, and some competing countries to suffer small lose. Yuefen li (2003) also points to high import contents of China's exports and the fact that
foreign funded companies account for about half of China’s international trade. Future growth in China’s international trade will benefit to various degrees China’s trading partners as well as home countries of transnational corporation.
Jayanthakumaran and Lee (2007) points to the institutional changes which have impacted on China and Taiwan export and FDI, argues that significant trend breaks in the FDI and export time series detected in both countries coincided with extensive government interventions, mainly in the form of export processing Zones (EPZ), encouraging FDI during a transition period from import substitution to export orientation. Their results indicate one way causal relationship flows from exports to FDI in China and FDI to exports in Taiwan.
But beside these optimistic results regarding the effects of globalization (Trade Liberalization) on export and growth, Rodriguez and Rodrik (2000) provides an opposite view of the relationship between trade policy and economic growth, arguing that methodological problems lead to various result about this relationship. Wacziarg (2001) provide a positive empirical evidence of the relationship between trade openness and growth.
Greenaway et al (2002) points to a J curve relationship between trade policy and growth, argues that at first trade openness has negative impact on growth but as time goes, increases the growth. Yanikkaya (2003), using a panel data approach, finds that as opposed to current literature on the effects of trade openness on growth, all trade barriers indicators have positive and significant relationship with growth and Jin (2005), using a VAR approach, test trade openness effects on growth for Japan and South Korea, and finds that shocks to trade openness have negative and significant effects on economic growth. This result holds for short run and there is not any effect for Long run. 3-The Model
As stated, various authors use different approach to test the relationship between globalization (defined here as trade openness and liberalization) and export and GDP growth. Here we use simple models for export and GDP, testing whether export could enhance GDP, and vice versa. And on the other hand, using dummy variables which control the effect of accession to GATT/ WTO, during a long period from 1965 to 2004, we test whether membership could enhance export and GDP. The Model is as follows:
expit=α0+α1gdpit+∑βjDWTOit+εit (1)
gdpit=δ0+δ1expit+∑γjDWTOit+υit (2)
i=1,…,N, t=1965,…,2004. Here expit is the logarithm of export flows of countries in the model, gdpit is the logarithm of GDP of these countries and DWTO stands for dummy variables for each country which is equal to zero before accession to GATT/WTO and one afterwards. These simple models ignores testing the causal relationship between export and GDP, and also ignores endogenity of these two variables in the system, wave to estimate them simultaneously and only want to concentrate on the coefficients of dummy variables which reveal the effects

International Journal of Academic Research in Business and Social Sciences March 2014, Vol. 4, No. 3
ISSN: 2222-6990
562 www.hrmars.com
of membership on GDP and export. Perhaps the very heavy duty of gravity equation is better than this simple approach, but it is
very demanding, and we do not want to concentrate on bilateral flows of pairs of countries. Some authors, like Disdier and Fontagne (2008), Grant and Parmeter (2008), Filip and Van Hove (2005), Keith and Ries (2004) Koukhartchouk and Mathilde (2003), Inmaculada and Marquez-Ramos (2007), and Disdier, Fontagne and Mimouni (2007), have used gravity equation approach to estimate some kinds of trade liberalization, accession to WTO and regionalization effects of trade flows. Some other authors like Martin and Winter (1995) have used CGE models to assess the effects of Uruguay round negotiations on trade flows and welfare. But the approach here has simplicity and some relevance to literature on openness and growth, in which we measure the effect of openness by using dummy variables. The results are interesting which can contribute to the literature that produces no conclusive evidence of relationship between trade barriers, or openness, and growth. But we must be noticed that equations (1) and (2) speak only about the level of variables not the growth rate.
Before proceeding, some remarks on the data are needed. The data on GDP of countries are collected from WDI 2006 CD-ROM of World Bank from 1965 to 2004. The data for exports downloaded from UNCTAD BEYOUND 20-20 from 1948 to 2006. There are 136 countries as cross sections in the Panel but estimation is done using only 131 countries (after adjustment by software). The list of countries for which we provide estimates for DWTO is appeared at annex (1). Here it is necessary to note that it is not possible to include dummy variables for all countries and therefore we confined the number of countries to 71 as appeared in annex one. This was done because including dummies for other countries lead to perfect co linearity, and therefore we have to exclude some of them
4-Results of Estimation
The results of estimating equations (1) and (2) are appeared in tables (4-1) and (4-2). Here, in the panel, we enter 136 countries as cross sections, and then enter dummy variables for 71 developed and developing countries. Also we enter a dummy variable DWTO, to measure the effect of entering into force of WTO agreements from 1995 onward for all 136 countries. DWTO is zero before 1995 and equal one from this year to 2004. We confine the number of dummy variables for 71 countries in order to escape multi co linearity problem. As stated, these dummies is equal to Zero before the country in question become a member of GATT/WTO, and equal to one after the time of membership.
For each of the equation, we use ISDV approach to estimating the coefficients, but for each equation we provide two estimates, one with period effects and the other without these. In each ease, use has been made of a simple F test to choose between these two estimations for each equation. The results of F tests show that the estimation with period effect is selected and the panel equations estimated by a two way fixed effect LCDV procedure. Let’s take the export equation first. As is clear from table (4_1), GDP has a positive effect on export; each one percent increase in GDP will lead to 0.95 percent increase in export. On the other hand, from table (4-2), we can infer that each one percent increase in export will lead to 0.85 percent increase in GDP.
Now, it is interesting to note that entering into force of WTO agreements, while increases
International Journal of Academic Research in Business and Social Sciences March 2014, Vol. 4, No. 3
ISSN: 2222-6990
563 www.hrmars.com
GDP (the coefficient is equal to 0.17), but reduce the export flows of the countries in the sample, the 131 countries (the coefficient is equal to- o.13). Both coefficients are statistically highly significant.
Now we can check the coefficients of each country dummies for export and GDP. As is shown in tables, Albania is stand to enjoy the positive effect of membership on her GDP (0.76 for GDP equation) while the membership is negatively impacted her exports (-0.58 for exp equation). But on average, nearly all developed countries in the sample has positive coefficient for the effect of membership on their GDP (except for Austria, Belgium, Iceland, Luxembourg and Netherlands), but some of them has negative coefficient for the effect of membership on their export, like, Australia, Japan, Portugal, Spain and United States of America. Other developed countries in the sample enjoy positive effects of membership on their export. Israel have positive coefficient for GDP, but negative one for her export. In some, it is safe to say that developed countries as a whole, benefited from accession to GATT/WTO. Neither of them have simultaneously negative impact for both export and GDP. But the situation differs markedly for developing countries. For the export equation, Pakistan, Uruguay, Antigua, Colombia, Congo Democratic republic, Cyprus, Dominica, Dominican Republic, Gambia, Grenada, Nicaragua, Paraguay, Sierra Leone Uganda and Venezuela have negative coefficient for export. For the GDP, negative impact becomes wider. Singapore, Malaysia, Zambia, Tunisia, Trinidad and Tobago, Antigua, Bahrain, Bulgaria, Cameron, Belize, Costa Rica , Cote de ivre, Croatia, Czech Republic, Dominican, Ecuador, Fiji, Gabon, Gambia, Ghana, Guyana.
Hungary, Lesotho, Malta, Moldavia, Nicaragua, Papua New Guinea, Romany, Sierra Leone, Togo, and Ukraine all have negative coefficient for their GDPs. Sierra Leone has both her coefficients negative. Others which follow her are Nicaragua, Gambia, Cameron and Antigua. The results clearly show asymmetric globalization effects on developed and developing countries and also on GDP and export. Also, these results lead to some hesitation regarding the effects of trade liberalization on export and growth in developing countries. Of the 46 developing countries for them we enter dummy variables, 31 of them have negative coefficient in the GDP equation, while for only 15 of them the coefficient of dummies in the export equation is negative. What this result purports to say is that while trade liberalization may have positive effect on export of developing countries, it has not positive effect on economic performance on average, and shed some light on the contrary results other authors entered into after empirical investigation about the relation of GDP and export, and trade policy and economic performance. But China stands to enjoy positive coefficients for both her export and GDP.
Therefore we have two distinct pictures from our exercise: 1) Trade liberalization has asymmetric effects on developed and developing countries GDP and
export. While nearly many developed countries enjoyed positive effects of GATT/WTO membership on GDP and export (United States of America has negative coefficient for her export, but large and positive effects for her GDP (1.933) which is even larger than the coefficient of Japan (1.68), the rapidly growing developed country which has negative coefficient for her export).
2) Trade liberalization has not equivalent effects on GDP and export (the number of negative coefficient for GDP is larger than the number of negative coefficient for export). On the contrary, effects of WTO enforcement are negative for export (but positive for GDP). Dan

International Journal of Academic Research in Business and Social Sciences March 2014, Vol. 4, No. 3
ISSN: 2222-6990
564 www.hrmars.com
Ben David (2001) says that the degree of liberalization and the extent of trade between the liberalizing countries are important factors that influence the link between liberalization and convergence. Evidence suggests that postwar trade reforms in which major trade partners substantially reduced barriers on trade with one another culminated in income convergence between the trade- liberalizing countries.
But here we see that the degree of income convergence between developed and developing countries on the one hand and between groups of developing countries on the other hand is not so great. Even there is a marked difference between developing countries and this is most acute in African countries.
Oskam et al (2004), provides evidence that "in which direction and to what extent trade policy may affect the development of LFAs (Less-Favored Areas). The literature on modern trade and growth theory spells out conditions of sustained economic growth that are, nearly by definition, opposite to the conditions that hold for LFAs. Although the institutional economics literature is very much focused at the country level, it is clear that for LFAs with inadequate institutions and infrastructure, the effects of trade-led growth is often irrelevant. Further trade liberalization will entail small or even detrimental effects for LFAs…. The prevailing problem seems to be the lacking supply response to (international) price changes. The literature contains evidence that long-term growth strategies for LFAs require the development of institutions and infrastructure”.
In other words, this paper’s finding is more consistent with results of Oskam et al (2004), which both emphasizing more on infrastructure and institutional changes required to be better prepared for trade liberalization consequences for growth and export led strategy for economic development.
5-Conclusion In this paper, in line with the current literature on trade policy and growth links, we
estimate two separate equation for a panel of 136 countries among developed and developing countries and find that while GATT/WTO membership scenario of globalization have, in general, positive effects on export and GDP of developed countries, there exist not the same conclusion regarding developing countries. For the latter group of countries we find that membership in GATT/WTO, has not a clear cut positive effects on GDP and export and for a great deal of these countries the effect of membership on GDP is negative, and for 15 out of 46 developing countries, this effect is also negative for export. So the path of globalization is not so smooth for all countries, favored more the developed countries and less the developing one.
Among developing countries themselves, the effects differ, with countries having access to FDI and technology of transnational companies the impact is positive while for other countries the impact is negative. These results show that globalization has asymmetric impact on countries and pose serious problem for the even process of globalization.

International Journal of Academic Research in Business and Social Sciences March 2014, Vol. 4, No. 3
ISSN: 2222-6990
565 www.hrmars.com
Acknowledgement
The authors would like to acknowledge the financial of University of Tehran for this research under grant number 4460001/1/3-12. Corresponding Author
Maysam Musai, Faculty of social Sciences, university of Tehran, Tehran, Iran, [email protected]
Table 4-1-Estimation of export Equations (Dependent variable is log export)
Variable Coefficient t-Statistic Coefficient t-Statistic C -14.578 -98.8689 -16.0532 -49.8996 LGDP 0.947538 151.6137 1.004284 90.89698 DWTOALBA -0.49346 -6.82261 -0.56391 -5.90938 DWTOAUS 0.833565 13.8421 0.502112 4.358182 DWTOAUSR -0.03337* -1.17716 -0.46946 -5.99491 DWTOBELG 1.62738 82.42685 2.024859 17.89725 DWTOCAN 0.596181 22.5902 0.123736 1.50432 DWTOCH 0.333761 6.220666 0.587299 4.415654 DWTODEN 0.409801 16.47694 0.013441 0.15808 DWTOFIN 0.470223 23.65455 0.09602 1.258886 DWTOFRA 0.243052 11.71679 -0.26955 -2.56004 DWTOGER 0.662405 18.50754 0.715452 7.576133 DWTOICE 0.217206 8.016169 0.097615 1.723324 DWTOISR 0.005991* 0.294492 -0.34762 -5.3039 DWTOITA 0.105924 4.576708 -0.39673 -3.83769 DWTOJAP -0.66394 -21.9644 -1.24516 -9.96079 DWTOLUX 0.934672 32.72323 1.469262 11.79303 DWTONETH 1.140129 62.88767 0.702373 7.733856 DWTONOR 0.449834 25.63557 0.062965 0.769426 DWTONZL 0.299342 13.20438 -0.03336 -0.53009 DWTOPOR -0.10152 -2.13087 -0.46324 -5.81817 DWTOSAF 0.395757 10.59034 0.009596 0.129648 DWTOSIN 1.870072 58.49173 1.618127 33.81964 DWTOSPA -0.45318 -6.74784 -0.91493 -6.75418 DWTOSWE 0.585867 29.78742 0.167346 2.030518 DWTOSWI 0.40139 11.75612 -0.01544 -0.1551 DWTOUK 0.057012 2.624823 -0.46115 -4.53 DWTOUS -0.80755 -26.7701 -1.42716 -12.2361 DWTOPHI 0.139647 2.635654 -0.09289 -1.80931 DWTOMAL 1.435738 72.69483 1.111352 20.36597 DWTOPAK -0.33179 -11.1314 -0.41681 -6.77069

International Journal of Academic Research in Business and Social Sciences March 2014, Vol. 4, No. 3
ISSN: 2222-6990
566 www.hrmars.com
DWTOURU -0.58984 -31.4989 -0.86925 -15.2507 DWTOZAM 0.991589 9.0337 0.94198 7.821784 DWTOTUN 0.330406 9.375004 0.276343 8.951486 DWTOTRI 0.903262 15.15579 0.673261 10.87637 DWTOANTIG -0.7721 -7.18577 -0.28565 -1.70286 DWTOBAHR 1.085081 26.228 1.509703 15.53258 DWTOBUL 0.693325 12.91732 1.141326 10.15594 DWTOCAM 0.198177 3.23306 -0.02903 -0.44892 DWTOBELZ 0.234198 2.827256 0.61866 5.190627 DWTOBOL -0.3161 -9.60644 0.046963 0.508997 DWTOCHI 0.230773 9.782817 -0.09828 -1.80698 DWTOCOL -0.40418 -15.4305 -0.31498 -4.2973 DWTOCONDR DWTOCOS 0.339768 6.474916 0.66946 .625837 DWTOCOT 0.884409 28.53073 0.645304 14.53299 DWTOCRO 0.172603 6.675474 0.655577 5.898173 DWTOCYP -0.24348 -3.31259 -0.11902 -1.10578 DWTOCZER 0.962685 14.88637 1.275169 11.23203 DWTODOM -0.30419 -4.02734 0.313131 2.761031 DWTODOMR -0.01258* -0.16852 -0.26528 -4.37609 DWTOECU 0.357181 13.75624 0.790162 8.064952 DWTOFIJ 0.419118 7.37717 0.93039 8.865785 DWTOGAB 1.063812 23.54282 0.870346 13.37438 DWTOGAM -0.17635* -0.95359 -0.19021 -0.98557 DWTOGHA 0.96956 11.6898 0.77798 9.911094 DWTOGRN -0.99703 -9.83583 -0.37217 -2.74727 DWTOGUY 1.28511 24.74619 1.221832 22.15409 DWTOHUN 0.721218 17.52272 0.676286 11.91827 DWTOLES 0.264729 2.094905 0.879773 4.790731 DWTOMALT 0.776895 18.8634 0.624322 13.12224 DWTOMOL 0.584676 27.87555 1.22904 10.88475 DWTOMOR 0.025906* 0.887245 0.254066 2.955734 DWTONIC -0.10755* -1.54055 -0.30327 -4.89549 Table 4-2-Estimation of GDP Equations (dependent variable is log GDP) Variable Coefficient t-Statistic Coefficient t-Statistic C 16.74966 412.1422 17.78043 85.14709 LEXP 0.85544 168.2983 0.721955 33.15341 DWTO 0.172355 7.828902 -0.01864 -0.35828 DWTOALBA 0.765765 8.078336 0.911847 7.315941 DWTOAUS -0.54069 -6.33231 -0.14173 -1.07234 DWTOAUSR 0.65869 21.91219 1.230078 13.98412 DWTOBELG -0.81895 -32.9143 -0.5659 -5.23178

International Journal of Academic Research in Business and Social Sciences March 2014, Vol. 4, No. 3
ISSN: 2222-6990
567 www.hrmars.com
DWTOCAN 0.241514 8.988087 0.977972 8.784398 DWTOCH 0.639699 14.97267 0.978203 8.329815 DWTODEN 0.146949 5.197476 0.68894 6.995444 DWTOFIN 0.021292* 0.970253 0.52196 6.179149 DWTOFRA 0.67764 22.10688 1.456459 10.94707 DWTOGER 0.409094 12.04655 0.933507 8.393163 DWTOICE -0.27863 -9.68045 -0.21758 -5.24058 DWTOISR 0.349671 19.30861 0.742475 12.89885 DWTOITA 0.761752 25.54841 1.500104 11.88775 DWTOJAP 1.682595 52.30684 2.493294 18.10548 DWTOLUX -0.6841 -26.1741 -0.82913 -10.4309 DWTONETH -0.33961 -11.312 0.392137 3.126011 DWTONOR 0.08102 3.309648 0.607201 6.754271 DWTONZL 0.028935* 1.167179 0.414298 6.387013 DWTOPOR 0.468692 12.34184 0.865206 12.88613 DWTOSAF 0.124913 3.497077 0.642294 7.927265 DWTOSIN -1.35924 -60.3167 -0.83583 -11.2501 DWTOSPA 1.103452 17.4714 1.675981 13.1442 DWTOSWE 0.070319 2.679242 0.685207 6.596802 DWTOSWI 0.250616 6.085932 0.850657 7.211612 DWTOUK 0.855366 31.73699 1.621755 12.49976 DWTOUS 1.933633 66.92427 2.81075 19.76139 DWTOPHI 0.225055 5.282641 0.555519 10.75308 DWTOMAL -0.97096 -52.5637 -0.45244 -6.44885 DWTOPAK 0.572235 15.69135 0.718677 15.5503 DWTOURU 0.611635 29.69947 0.759498 21.89551 DWTOZAM -1.03 -11.0692 -0.9529 -12.1894 DWTOTUN -0.22444 -9.04545 -0.11727 -5.09551 DWTOANTIG -0.12242* -1.09099 -0.91231 -4.68497 DWTOBAHR -0.99093 -25.9565 -1.1405 -18.7445 DWTOBUL -0.56076 -11.9666 -0.72934 -10.3833 DWTOCAM -0.23672 -3.90951 -0.1 -1.74793 DWTOBELZ -0.74379 -8.4911 -1.21692 -10.3944 DWTOBOL 0.211201 6.241616 -0.086 -1.31207 DWTOCHI 0.075381 2.760704 0.443438 7.676432 DWTOCOL 0.718325 33.38822 0.782059 19.17125 DWTOCONDR 0.278228 2.334739 0.347147 3.315634 DWTOCOS -0.23846 -6.07416 -0.37373 -6.72696 DWTOCOT -0.78403 -24.0359 -0.5292 -13.7054 DWTOCRO -0.03591 -1.65783 -0.25464 -3.83829 DWTOCYP 0.104107* 1.374433 -0.05988 -0.64246 DWTOCZER -0.51186 -9.11437 -0.42783 -5.66829 DWTODOM -0.4458 -7.01923 -1.21034 -10.3841 DWTODOMR 0.028697 0.442329 0.194114 4.00391
International Journal of Academic Research in Business and Social Sciences March 2014, Vol. 4, No. 3
ISSN: 2222-6990
568 www.hrmars.com
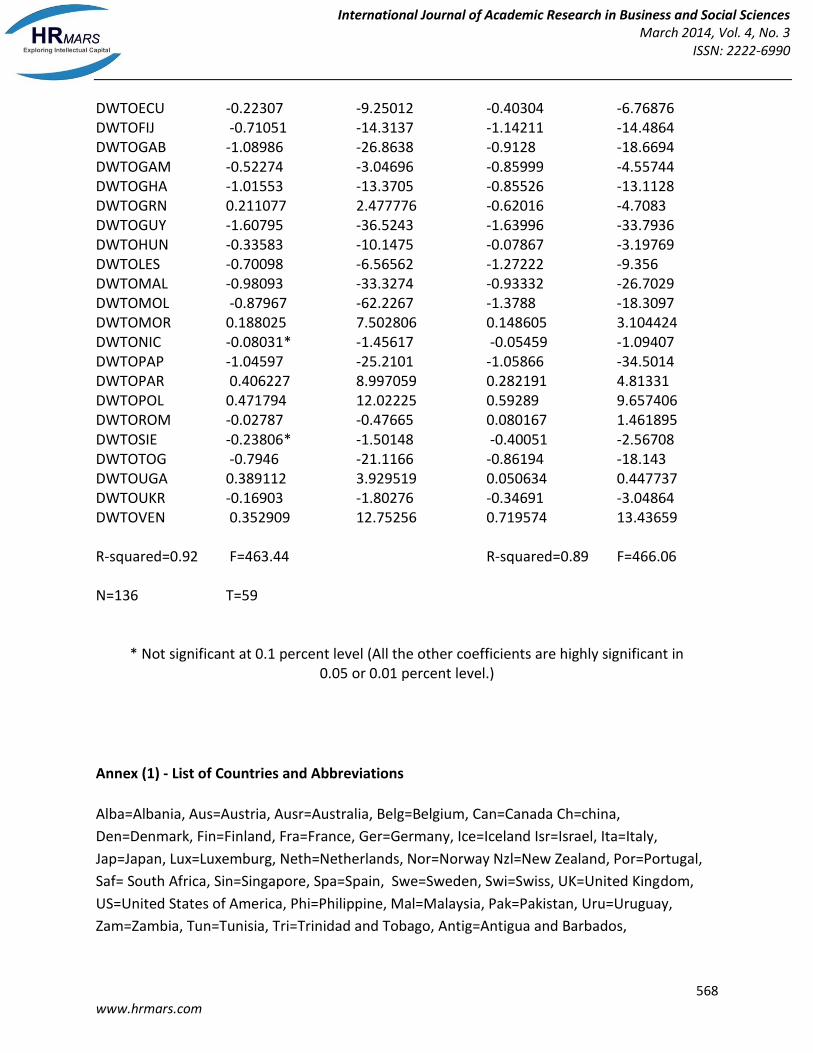
DWTOECU -0.22307 -9.25012 -0.40304 -6.76876 DWTOFIJ -0.71051 -14.3137 -1.14211 -14.4864 DWTOGAB -1.08986 -26.8638 -0.9128 -18.6694 DWTOGAM -0.52274 -3.04696 -0.85999 -4.55744 DWTOGHA -1.01553 -13.3705 -0.85526 -13.1128 DWTOGRN 0.211077 2.477776 -0.62016 -4.7083 DWTOGUY -1.60795 -36.5243 -1.63996 -33.7936 DWTOHUN -0.33583 -10.1475 -0.07867 -3.19769 DWTOLES -0.70098 -6.56562 -1.27222 -9.356 DWTOMAL -0.98093 -33.3274 -0.93332 -26.7029 DWTOMOL -0.87967 -62.2267 -1.3788 -18.3097 DWTOMOR 0.188025 7.502806 0.148605 3.104424 DWTONIC -0.08031* -1.45617 -0.05459 -1.09407 DWTOPAP -1.04597 -25.2101 -1.05866 -34.5014 DWTOPAR 0.406227 8.997059 0.282191 4.81331 DWTOPOL 0.471794 12.02225 0.59289 9.657406 DWTOROM -0.02787 -0.47665 0.080167 1.461895 DWTOSIE -0.23806* -1.50148 -0.40051 -2.56708 DWTOTOG -0.7946 -21.1166 -0.86194 -18.143 DWTOUGA 0.389112 3.929519 0.050634 0.447737 DWTOUKR -0.16903 -1.80276 -0.34691 -3.04864 DWTOVEN 0.352909 12.75256 0.719574 13.43659 R-squared=0.92
F=463.44
R-squared=0.89
F=466.06
N=136 T=59
* Not significant at 0.1 percent level (All the other coefficients are highly significant in 0.05 or 0.01 percent level.)
Annex (1) - List of Countries and Abbreviations
Alba=Albania, Aus=Austria, Ausr=Australia, Belg=Belgium, Can=Canada Ch=china,
Den=Denmark, Fin=Finland, Fra=France, Ger=Germany, Ice=Iceland Isr=Israel, Ita=Italy,
Jap=Japan, Lux=Luxemburg, Neth=Netherlands, Nor=Norway Nzl=New Zealand, Por=Portugal,
Saf= South Africa, Sin=Singapore, Spa=Spain, Swe=Sweden, Swi=Swiss, UK=United Kingdom,
US=United States of America, Phi=Philippine, Mal=Malaysia, Pak=Pakistan, Uru=Uruguay,
Zam=Zambia, Tun=Tunisia, Tri=Trinidad and Tobago, Antig=Antigua and Barbados,

International Journal of Academic Research in Business and Social Sciences March 2014, Vol. 4, No. 3
ISSN: 2222-6990
569 www.hrmars.com
Bahr=Bahrain, Bul=Bulgaria, Cam=Cameron, Belz=Belize, Bol=Bolivia, Chi=Chili, Col=Colombia,
Cndr=Congo Democratic Republic, Cos=Costa Rica, Cot=Cote de Ivre, Cro=Croatia, Cyp=Cyprus,
Czer=Czech Republic, Dom=Dominican, Domr=Dominican Republic, Ecu=Ecuador,
Fij=Fiji,Gab=Gabon, Gam=Gambia, Gha=Ghana, Grn=Grenada, Guy=Guyana, Hun=Hungary,
Les=Lesotho, Malt=Malta, Mor=Morocco, Nic=Nicaragua, Pap=Papua new Guiana,
Par=Paraguay, Pol=Poland, Rom=Romania, Sie=Sierra Leone, Tog=Togo, Uga=Uganda, Uk
References Baldwin, R.E et al. (2000), “Trade liberalization and Endogenous Growth A q-theory Approach”, Journal of International Economics. 50. Baldwin, R. E et al. (1998), “Trade and Growth, Any Unfinished Business?" , European Economic Review, vol. 42. Chang, H. (2005),’Why Developing countries Need Tariffs, South center Oxfam. Dan Ben-D. (2001),”Trade liberalization and income convergence: a comment”, Journal of International Economic. Disdier, A. et al. (2008), “Trade Impact of European Measures on GMOs Condemned by the WTO Panel”, paper provided by European Association of Agricultural Economists in 2008 International Congress, August 26-29, 2008, Ghent, Belgium, No. 44392. Disdier, A. et al. (2007)”, The Impact of Regulations on Agricultral Trade: Evidence from SPS and TBT Agreements” Article provided by American Agricultural Economics Association in its journal American Journal of Agricultural Economics.http://ideas.repec.org/opocoo/cepodty. Edwards, S.(1993), “Openness, Trade Liberalization, and Growth in eveloping countries”, Journal of Economic literature, Vol. XXXIcsep. (1993). Filip A. et al. (2005)” The Rise of China: Propects of Regional Trade Policy”,Katholieke University Leuven. No. Ces0506. Grant, J. et al. (2008),"Has the World Trade Organization Promoted Successful Regional Trade Agreements”? Paper provided by American Agricultural Economies Association in 2008 Annual Meeting, July 27-29, 2008, Orlando, Florida. Greenaway, D. et al. (2002) "Trade Liberalization and Growth in Developing Countries," Journal of Development Economics, Vol. 76. Hoekman, B. et al. (2004),”Trading Market Access for competition policy Enforcement”, World Bank, Policy Research Working Paper Series, No. 3188. Ianchovichina, E. et al. (2001), “Assessing the Implications of Merchandize Trade Liberalization in China’s Accession to WTO”, paper provided by East Asian Bureau of Economic Research, trade working papers, No.192. Jayanthakumaran K. et al. (2007),"An initial push for successful transition from import substitution to export-orientation in Taiwan and China: The FDI-led hypothesis", Paper provided by School of Economics, University of Wollongong, NSW, Australia in its series Economics Working Papers No. wp07-03. Jin, Jang C. (2005), Can Openness be an Engine of Sustained High Growth Rates and Inflation? Evidence from Japan and Korea”, International Review of Economical and Finanu,15. Keith (2004),”Regionalism within Multilateralism: The WTO Trade Policy Review of Canada”, article provided by Blackwell Publishing in the World Economy Journal.

International Journal of Academic Research in Business and Social Sciences March 2014, Vol. 4, No. 3
ISSN: 2222-6990
570 www.hrmars.com
Koukhartchouk, O. et al. (2005), “Accession to the WTO and EU Enlargement: What Potential for Trade Increase”? Paper provided by C.E.P.R. Discussion paper No.3944. Krueger, A.O. (1978), Foreign Trade Regimes and Economic Development: Liberalization Attempts and Consequences’, Cambridge, A. Ballinger Publishers co. for NBER. Mansfield, E.D. et al. (2008), "International Institutions and the Volatility of International Trade”, International Organization. Vol.62. issue 04.621-652. Martin, W. et al. (1995),The Uruguay Round: Widening and deepening the World Trading System, World Bank, Washington D.C. Oskam, A.J., et al. (2004), “Trade Policies and Development of Les-Favored Areas: Evidence from the literature”, Food policy, 29. Rodriguez, F. et al. (2000),”Trade Policy and Economic Growth: A Skeptical Guide to the Cross – National Evidence” Revised May (2000). Sachs, J. D. et al. (1995), “Economic Reform and the Process of Global Integration”, Broking papers on Economic Activity. Wacziarg, R. (2001),"Measuring the Dynamic Gains of Trade", The World Bank Economic Review. Yanikkaya, H. (2003),”Trade openness and Economic Growth: a Cross-Country Empirical Investigation”, Journal of Development Economies 72. Yu, Q. (1998),”Capital Investment, International Trade and Economic Growth in China: Evidence in the 1980-90s”, China’s Economic Review, vol. 9, Number 1. Yuefen L. (2003).”China’s Accession to WTO: exaggerated fears? Paper provided by United Nations conference on Trade and Development, UNCTAD Discussion papers, No.165. http://ideas. Repec. Org/p/UNC/dispap/165.html.