globalised financial flows - university of nigeria
TRANSCRIPT

University of Nigeria Research Publications
Aut
hor
AGU, Reuben Amaechi PG/MSC/02/33751
Title
Globalised Financial Flows, Capital Market
Deepening, and Economic Growth: the Nigerian Experience
Facu
lty
Social Sciences
Dep
artm
ent
Economics
Dat
e
August, 2007
Sign
atur
e

TITLE PAGE
GLOBALSED FINANCIAL FLOWS, CAPITAL MARKET DEEPENING, AND
ECONOMIC GROWTH: THE NIGERIAN EXPERIENCE.
AGU, REUBEN AMAECHI
PGIM.ScIO213375 1
DEPARTMENT OF ECONOMICS
UNIVERSITY OF NIGERIA,
NSUKKA
AUGUST 2 0 0 7

I
This work has been read and approved for the award of M.Sc Degree in I
the Department of Economics, University of Nigeria Nsukka. I I -
~ e a d of Department
--.---.--------------------____________________________ Date
Dean, Faculty of Social Sciences

CERTIFICATION
AGU, REUBEN AMAECHI, a postgraduate student in the Department of Economics with Reg.
No. PG/M.Sc/02/33751 has satisfactorily completed the requirements for course and
research work for M.Sc Degree in Economics.
The work embodied in this dissertation i s original and has not been submitted in part or full
for any other diploma or degree of this or any other University.
AGU, RE EN AMAECHI I?
H? OF DEPARTMENT

P DEDICATION
This i s dedicated with warmth and love to my parents: Alexander Agu-Ugwu, my father;
and Victoria Morenike Agu-Ugwu, my late mother; for their love and foresight in laying
the basic foundation of this project many years ago - in my formative years.
And also to my loving and wonderful wife - Victoria, whose show of love, understanding
and care has been a source of inspiration. And mostly to God who i s the actual owner of
the knowledge and energy expended on this project.

ACKNOWLEDGEMENT
In the course of carrying out this study, I received helps, in one way or the other, from many
people. As such it would seem invidious of me to select just a few of them for mention here,
since mentioning al l of them would create a rather long l i s t . However, even at the risk of
appearing so (invidious) some individuals must necessarily be mentioned for the very special
helps they offered to me.
Firstly I wish to express my thanks to Moses Oduh (Chairman), who helped me with his data
bank and for his useful remarks and advice on the methodology used. I equally wish to
express my appreciation to my senior research friend, Dr. Patterson Ekeocha (Papa), for his
witty comments and advice on the empirical literature. I am also fu l l of appreciation for Dr.
F.I. Njoku, of Mathematics Department, for his useful suggestions regarding some of the
mathematical derivations used in this work. My thanks also go t o Rev. Fr. Dr. lchioku and Dr. '. Fonta for their useful advice during the period of this work. I equally received help and
encouragement from some of my classmates: Richard Ojike, Charles Manasseh, and Victor
Malolu, therefore my thanks also go to them.
I found the library of the Nigerian Stock Exchange (NSE) very useful, and their staffs were
really helpful; I am therefore immensely grateful to them.
I am highly appreciative of members of my family - my wife, Victoria; Ikechukwu;
Nwanneka; and my father, Elder Alexander Agu - Ugwu - for their encouragement and
prayers.
I owe the greatest debt of thanks to Prof. F.E. Onah, my project supervisor, who
incidentally i s instrumental to my developing interest i n International Economics, (and who 4
equally, i s the Head of Department of Economics) -for his fatherly disposition and patience
i n guiding me throughout the period of this work.
However, I remain solely responsible for the views and accuracy of information contained in
this work.
Agu, Reuben Amaechi
Postgraduate School of Economics
University of Nigeria, Nsukka
August, 2007

TABLE OF CONTENTS
Title Page
Approval Page
Certification
Dedication
Acknowledgement
Table of Contents
Abstract
List of Tables
List of Charts
CHAPTER ONE
INTRODUCTION
1.1 Background of the Study
1.2 Statement of the Problem
1.3 Objectives of the Study
1.4 Statement of Hypothesis
1.5 Importance of the Study
1.6 Scope and Limitations of the Study
CHAPTER TWO
LITERATURE REVIEW
2.1 Globalisation Finance and Economic Growth
2.2 Foreign Capital Flows to Nigeria: Nature, Trend and Impact
On the Capital Market
2.3 Determinants of Foreign Portfolio Investment (FPI) in Nigeria
2.4 The Nigerian Capital Market: Developments and Reforms
2.4.1 The Capital Market and i t s Institutions
7.4.7 D e v d o n r n ~ n t z and R ~ f o r r n z i n the N i w r i a n Canital Market
Page
i . . 11
iii
i v
v
vi
vii
i x
X

CHAPTER THREE RESEARCH METHODOLOGY
3.1 Theoretical Model Specification
3.2 Derivation of the Theoretical Model
3.3 Choice of Proxies for GFF and Financial Deepening of the
Capital Market 3.3.1 Other Proxies
3.3.2 Capital Market Deepening and Financial Deepening of The External Segment of the Nigerian Capital Market (IFD)
3.4 Functional Model Specifications
3.4.1 Modeling Impact of Globalization on FPI
. 3.4.2 Model 2: Modeling the financial Deepening of ESNCM (IFD)
3.4.3 Model 3: Modeling the Financial Deepening of the Nigeria Capital Market (NCM)
3.4.4 Model 4: Modeling the Impact of Globalized Financial flows (GFF) on the Growth rate
3.5 Justification of the Model
3.6 Data Required and sources1 software for Estimation
CHAPTER FOUR ANALYSIS AND ESTIMATION OF REUSULTS 4.1 Results of Econometric Tests 4.2 Interpretation of Results 4.3 Granger Causality Tests 4.4 Other Econometric Tests
CHAPTER FIVE SUMMARY, CONCLUSION AND RECOMMENDATION 5.1 iummary of Findings
5.2 Conclusion ' 5.3 Recommendations
REFERENCES
CHARTS
Econometric Result Print Out

Of the whole complexion of globalized financial flows (GFF), Foreign Portfolio lnvestment (FPI)
stands out uniquely on account of i t s dual characterization of being distinct and essential. It i s
distinct in the sense that it i s the only type of GFF that must necessarily util ize the framework of
capital markets t o transmit from one country to another. I t s essential feature derives from i t s
potential to excite economic growth positively. Literature shows that GFF, of the FPI type, can foster
financial development through capital market deepening, which then engenders economic growth.
Opposing views posit that GFF in the form of FPI i s of "foot loose" nature and thus can lead to crisis
and contagion and as such should not be relied on for purposes of strategizing for economic growth.
Since 1998, the rise i n the volume of FPI inflow has been so impressive that it can no longer be
ignored. In fact by 2005, the inflow of FPI has surpassed that of Foreign Direct lnvestment (FDI).
This study therefore sets out t o find whether GFF flow (of the FPI type) into Nigeria has improved
under the policy financial globalization and financial integration (financial openness). And also
confirm whether this policy has impacted positively on economic growth. The relevance of this study
derives from the fact that available studies on FPI inflow are just a handful and recent, and there is
no country specific study regarding the effect of foreign portfolio investment on financial sector
development and economic growth. This study hopes contribute t o the literature in this gray area
using Nigerian data.
The study applied the dynamic distr ibuted lag model, w i th error correction, on a set of relevant
t ime series data and finds that FPI inflow has improved under the policy of financial openness. It was
also confirmed that the policy of financial openness i s positively related to capital market deepening
and hence financial sector development. Finally, it was discovered that the inflow of FPI within the
policy context of financial openness i s positively related to economic growth via capital market
deepening. Granger causality tests reveal that: financial openness, and market size, does not
granger cause FPI inflow; real rate of return (RRR) of investments granger causes FPI inflow; while
market size granger causes capital market deepening. Finally the tests revealed that there i s a bi-
directional causality relationship between capital market deepening and economic growth.
It was therefore concluded that the lure for superior rate of return causes FPI inflow, while the
policy of financial openness facilitates it. Financial openness facilitated deepening of the capital
market which led to economic growth.
Based on the results, it is recommended that there i s need that the present reforms going on in the
capital market, and the financial sector in general, be sustained given the fact that the Nigerian
financial sector has a prominent role t o play in channeling resources for investment and productive
purposes. Again, government should put i n place appropriate policies that wi l l boost continuous
inflow of foreign portfolio investment in Nigeria.
viii

> LIST OF TABLES
4.2 Table 1: Foreign Direct lnvestment and Foreign Portfolio lnvestment Inflow in Nigeria (1 996-2005).
4.1 Table 4.1 Model 1 : ADF Unit Root Test on the Quarterly series
4.1 Table 4.2 Results from Co Integration Test on Model I Estimation
4.1 Table 4.3 Result Summary for Model 1
4.1 Table 4.4 Model 2 ADF Unit Root Test on the Quarterly Series
4.1 Table 4.5 Results from Co integration Test on model 2
4.1 Table 4.6 Estimation Result Summary for model 2
4.1 Table 4.7 Model 3 ADF Unit Root Test on the Quarterly Series
4.1 Table 4.8 Co integration Results Test on Model 3
4.1 Table 4.9 Estimation Result Summary for Model 3
4.1 Table 4.10 Model 4 ADF Unit Root Test on the Quarterly Series
4.1 Table 4.11 Co integration Result Test on Model 4
4.1 Table 4.12 Estimation Result Summary for Model 4
4.3 Table 4.3.1 Direction of Causality between FPI and FG proxied by (GFR)
4.3 Table 4.3.2 Direction of Causality between FPI and RRR 60
4.3 Table 4.3.3 Direction of Causality between FPI and Map 60
4.3 Table 4.3.4 Direction of Causality IFD and RGDP 60
% 4.3 Table 4.3.5 Direction of Causality between FD and RGDP 6 1
4.3 Table 4.3.6 Direction of Causality between IFD and Mcap 6 1
4.3 Table 4.3.7 Direction of Causality between FD and IFD 6 1
5.1 Table 5.1 Annual Rates of Return on Stock Investments in NCM (A Foot Note) 63

LIST OF CAHRTS -
1.1 Chart 1 : World Export of Goods and Series
1.1 Chart 2: Foreign Direct lnvestment
1 .I Chart 3: Annual Rate of Return on lnvestment at the Nigeria Capital Market
1.1 Chart 4: Global FPI Compared to ODA (Footnote)
5.1 Chart 5.1: Determinants of FPI in flow in Nigeria
5.1 Chart 5.2: Effect of Factors changes on Financial Depending of ESNCM
5.1 Chart 5.3: Effects of factor changes on capital Market deepening
7 5.1 Chart 5.4: Effects of factor changes on the growth rate of real GDP
5.2 Chart 5.1: Globalized flow (GFF), Transmission channels and Impacts

CHAPTER 1
b INTRODUCTION
1.1 Background of t he Study
A consensus seems to have emerged amongst economists that economic growth is
inextricably tied to globalised financial flows (GFF). This GFF - growth nexus is
implicitly implicated in the relation showing domestic savings and net capital inflows
as the main sources of financing domestic investment and budget deficit*. On
exploring the equality relationship between current account balance (CAB) and the
capital account balance (CAP) of a country, it becomes obvious that a deficit on the
CAB implicitly measures the financial inflows into the country's economy and there-
fore measures the resources coming into a country to finance investment demand in
excess of national savings, i.e. savings - investment gap - 51 gap (Diwivedi, 2006; T
Okojie, 2005; Roubini and Watchel, 1997). Since globalised financial flows into a
country indicate the resources flowing into the country, an inference could be made
motivated by the fact that i f GFF equals CAB which also equals CAP, then GFF is an
alternative for financing the SI gap when confronted with difficult domestic con-
straints". Economic theory based on: Harrod-Domar; Neoclassical; and Endogenous
Growth models, recognizes SI gap as being correlated with growth, therefore GFF is
intrinsically tied to growth (Hakkio, 1995; Ayhan et al, 2003; Calvo and Reinhart,
1999; and Smith e t al, 2003).
GFF needs the framework of financial globalization (FG) and financial integration (FI).
FG and FI are in principle different concepts. FG is an aggregate concept that refers f
to rising global linkages through cross - border financial flows. FI on the other hand
refers to an individual country's linkages to international capital markets. Obviously
the two concepts are intimately related. For instance, increasing FG is perforce
associated with FI on average and together they. imply increasing GFF (Ayhan e t al,
* Recall that Uses = Sources. Uses are usually for Investment (I) and Budget Deficit (BD), while Sources are
domestic Savings (S) and Net Capital Inflow (i.e. net of GFF) Hence: I + RD - S + GFF , 'd Domestic uses >
Domestic Sources, GFF > 0, GFF = I + BD - S
* CAD 2 CAP - GFF, but ?
CAP = CAD + AR = FDI + FPI + ODA but GFF = CAD + AX
i.2 GFF = FDI + FPI t- ODA .. . - -. .. -. ~- .- ~ . . ... . .. ..-.- .- . -- ..- .
Depczrtment yf Economics, Universify ryf Nigeria Nsukkn 1 of 108

~. .~ . -~ ~ . . . . --p--.----.-.--....---.-....-...--
2003). In this study, these terms are looseiy used, i n te r~hangeab~~ , without loss of
rigor in the pursuance of the central theme.
By definition GFF includes: official development assistance (ODA) and other official
development flows (ODF) -. i.e. grants or soft loans from government and mulhtilat-
eral institutions; export credit (EC) - i.e. all forms of international trade credits by
individuals or banks; and foreign private flows international bank loans and bond
issues, foreign direct investment (FDI), and foreign portfolio investment (FPI) - which
could be debt or equity (Obadan, 2004; and Okojie, 2006).
The GFF - economic growth relation i s usually explained in mainly two ways. One way
considers the relation to crystallize through two main channels: the direct and
indirect channels. The direct channels' GFF - growth link i s brought about by:
augmentation of domestic savings; lower cost of capital due to better risk allocation;
transfer of technology; and financial sector development of the capital market. The
indirect channels' categorization rationalizes the link on the ground that GFF:
promotes specialization; induces better policies; and enhances capital inflows by
signaling better policies (Ayhan et al, 2003). The other way sees GFF as being trans-
mitted through quantity and quality effects (Abiad et al, 2006).
ODA, EC, and FDI can be transmitted without the aid of the capital market, but FPI
necessarily requires the capital market to be transmitted to any nation. Capital
markets promote economic efficiency and productive investment by channeling funds
from surplus units to deficit units who have immediate productive use for it (Woep-
king, 2004). Therefore, GFF transmitted through the international capital market into
any nations capital market (ESCM) i s strictly of FPI type. The fact that FPI i s transmit-
ted through the capital market implies that it flows to those investments that
guarantee the highest rate of return (Dodd, 2004), thereby ensuring strict allocative
efficiency in the use of FPI (Chalapati,, 1999). Thus it promotes efficiency and aids
productive investment. Some countries, especially in Asia and Latin America have
been able to utilize it (FPI) for growth, even though there are reversals in the
aftermath of the 1982 debt crisis and in the middle 1990s respectively in Latin
America and Asia (Halac, 2005) . FPI comes with some benefits which includes the
following: spreadsldiversifies risk for foreign; provides an opportunity, for other
nations, to share the fruits of growth of developing countries; provides investment
T- outlet for foreign investors that promises a better return on investment - especially
.. for pension funds; it supplements foreign exchange availability and domestic savings;
l)epar/tnen/ of'Econoniics, Univer.~i/y of' Nigeria Nsukkrr 2 of 108

M.Sc Dissertation: Globdised Financinl,flows, C ~ ~ p i t a l mar.liet deepening, and Econonzic Growth: Nigerian Erperience ~ ~ . .. . . .... .... ~ ~. ~ .... - . .. .- .
it i s non debt creating; i f involved in primary issues provides critical risk capital for
new projects; expectedly, it could help to achieve a higher degree of liquidity at > capital markets; thereby causing an increase in the price - earning (PE) ratios and
consequently reduce the cost of capital for investment; and it helps to improve the
functioning of the financial system through increased availability of funds and
improvement of the financial infrastructure thereby reducing adverse selection and
moral hazard (Chalapati, e t al, 1999; Schmukler, 2003).
I t is probable that increasing confidence in the FPI - growth nexus inspired policy
makers world over - mainly encouraged by multilateral agencies - to opt for liberali-
zation of both the financial and commodity markets and also the capital account of
their respective countries. Under this policy of trade and financial liberalization,
there was a gradual dismantling of official controls on trade and capital. Conse-
T
quently, there has been a rapid growth in international trade and services, and also
in cross border financial flows. A trend catalysed by gradual removal of official
controls on trade and capital. Statistics show that between 1970 and 2000, the value
of world exports of goods of goods and services increased by 25 percent, while
foreign direct investment (FDI) increased by 50 percent (Rybinski, 2006; Dodd, 2000
(See charts 1, 2)). At the same time private flows (debt plus equity (FPI)) surpassed
official flows (aid plus debt (ODA)) by more than seven fold by 1997 and maintained
dominance till 2003 (Rybinski, 2006)*.
In this regard, Ayhan Kose e t al, (2003) and Woepking (2004) had noted that one of
the most important developments over the past three decades has been the interna-
tionalization, and now globalization, of capital markets which gave rise to the
International Capital Market (ICM) that is composed of a number of closely integrated
markets with an international dimension. ICM allows the possibility of fund mobiliza-
tion from all over the world for subsequent investment at any point on the globe.
Source: World -. Bank's Global Development - Finance. ~ - - .. ~
Depnrtnwnt of Econonzics, Universi[v of Nigeria Nsukka 3 of 108

Al.Sc Dissertation: Glol~crlised Financinl,fTows, Capitol nlarltet deepening, and Econon~ic Growth: Nigerian Experience -.-- -- ~~ . .... .. . . - .- .. - In 1993, the Federal Government of Nigeria liberalized the Nigerian Capital Market
(NCM) and subsequently internationalized it in 1995 with the abolition of the laws
that constrained foreign participation in the NCM. Specifically, the Exchange Control
Act, 1962 was abrogated together with the Nigerian Enterprises Promotion Act, 1989
(NigeriaBusinessinfo.com, 2001). Also a lot of improvements have been made on the
operational fundamentals of the stock exchange. For instance: it operates a comput-
erized clearing and delivery system for transaction in securities listed on The Nigerian
Stock Exchange; and settlement cycle i s now T + 3. These developments paved the
way for foreigners to participate in the NCM both as operators and investors (Nigeri-
aBusinessinfo.com, 2001). In fact the International Finance Corporation, in the year
2005, rated the Nigerian Stock Market as the best in terms of returns on investment
universally (Abodunde e t al, 2007 -See chart 3). Nigeria was, as a result of al l these
development, placed on a vantage point for reaping the inherent benefits in both FI
and FG even as GFF increases with more FPI flowing in to the Nigerian capital market.
With increased inflow of FPI into Nigeria, it i s expected that: the capital market's
liquidity would improve; and there wi l l be enhanced capital market efficiency, and
reduced information asymmetry. Simply put, there would be deepening of the capital
market and, filling of SI gap' in the domestic economy which has been characterized
by inadequate savings, these would bring about economic growth.
Available literature reveal that finance matter in engendering growth, as such, since
GFF i s part of the financial flows critical for financing investment, it equally matters.
Arising from this backdrop, what i s the relationship between GFF and economic
growth in Nigeria? Particularly, does the inflow of FPI contribute to financial sector
development and through that means associated with growth?
1.2 *STATEMENT OF THE PROBLEM
The NEEDS document (NPC, 2004) has indicated a savings - investment (SI) gap of
about 20 percent for Nigeria, with the consequence that the annual average invest-
ment rate was about 16 percent of the GDP, clearly below the minimum investment
rate of about 30 percent needed to unleash a poverty - reduction growth rate of at
least 7 - 8 percent per year (NPC, 2004). The sovereign risk premium for Nigeria i s
In the National Economic, Empowerment and Development Strategy (NEEDS) document it has been
estimated that Nigeria has a savings investment gap of 7 percent. Note also that capital market
elopment. . - . .... ~... . .- . . . . .. . - -. ..
Dep~rtmerrt of Economics, University qf Nigerirr Nsukkrr 4 of 108

M S c Dissertation: Globalised Financial,flows, Capital n~orliet deepening, and Econoniic Growth: Nigerian E.xperierm --pppppp--.--.--.p--p ~ ~p~ ...............................................
perceived to be high. Equally the cost of doing business i s also high, thus private
business agents kept the bulk of their money abroad (NPC, 2004). In view of these,
coupled with the fact of wide spread mass poverty, it i s substantially difficult to raise
national aggregate savings rate to cover the SI gap. Measures to f i l l 51 gap have to be
provided i f Nigeria i s to be placed back on the path of economic prosperity.
Received theory from the Harrod -- Domar growth model shows that a basic growth
strategy i s to reduce the 51 gap by increasing the proportion of national income
saved, and this can be done through general consumption sacrifices. Recourse could
also be made to GFF (Smith et al, 2003). In other words, growth can take place if,
among other things, observed 51 gap is filled. Plethoras of literature exist to show
that foreign capital inflows could play critical roles in the filling 51 gap (Hakkio, 1995;
Okojie, 2005). Indeed, Capital flows have contributed in fi l l ing the resource gap in
countries where domestic savings are inadequate to finance investment (Mailafia, -?
2005). Therefore it i s envisaged that capital inflow would help Nigeria fast track
higher production levels and hence attain the Millennium Development Goals (MDGs)
and the objectives of NEEDS (Mailafia, 2005). FPI i s also expected to have a positive
impact on the levels of savings and investment, efficiency of investment, and also
enhance best practice, hence leading to higher productivity.
Recent works have shown some causal relationships between GFF and positive
quantity effects', the works of McKinnon (1973), Shaw (1973), Obstfeld (1994), and
Ueda (2000) generally show that increases in GFF positively impact output growth
through quantity effects. However, some economists have cautioned that it might not
be correct to always expect quantity effects under libralisation (Devereux and smith 1
1994; Bandiera and others 2000; Jayaratne and Strahan, 1996; and Sancak, 2000).
Quality effects2 due to GFF have been established by the works of many scholars.
Abiad'et al (2004) showed that financial libralisation (FL) brings about improved
allocative efficiency of the capital market. Corroborating this, King and Levine (1993)
have argued in their work that FD results i n economic growth. De Gregorio (2004)
showed that FD brought about increases i n GDP by increasing the efficiency of
investment. The works of Rajan and Zingales (1998); Wurgler (2000); Beck, Levine,
I Quantity effect refers to increase in the magnitude of savings and investments as a result of financial globalization.
-v ' Quality effect refers to increases in efficiency levels as a result of financial globalization. (See Abiad, et al, 2004.
The Quality Effect: Does Financial 1,ibralization Improve the Allocation of Capital'? IMF working paper
wp/04/1 12. . - ~.
Dqnr tn tmt qf Econonlics, University ofNigerin Nsukko 5 of 108

A1 Sc Dr wertcrtron Globalrwd Flnuncd flow^, Cnprtcd niurltet deepenrng, ond Econonllc Growth Nrgenun Experience .- -- - - - - - - . . - -- -- - - - - - - - .. - - . - - - -
and-loayza (2000); and Love (2001); argue: that industries which are more dependent
on external finance grow more slowly than other industries in countries with less A. developed financial markets (whether measured by financial depth or improved
accounting standards); and that in countries with deeper financial sectors, capital i s
better allocated in the sense that it tends to flow to growing industries. FPI leads to
FD which then affects GDP growth through increases in total factor productivity,
rather than through factor accumulation. FD i s associated with a drop in the sensitiv-
i ty of investment to the availability of internal funds (Abiad et al, 2006).
Thus, as the beam of globalisation settles on Nigeria, the following questions are apt
to be asked:
a. Has globalisation brought about increased flow of FPI into Nigeria?
b. Has financial globalisation brought about capital market deepening in Nige-
ria?
c. Has the deepening of the capital market engendered economic growth in
Nigeria?
1.3 OBJECTIVES OF THE STUDY
Generally, this research work seeks to confirm i f the inflow of FPI engendered by GFF
has impacted Nigeria's economic growth positively. However, the following particular
objectives wi l l be pursued:
a. To determine whether increased globalisation 1 financial liberalization has
positive relationship with increased inflow of FPI into Nigeria.
b. To ascertain whether globalised financial flows has engendered capital
market deepening in Nigeria.
' c. To find out i f the stock market deepening precipitated by globalised finan-
cial flows has brought about economic growth in Nigeria.
1.4 STATEMENT OF HYPOTHESES
In line with the preceding objectives, the following hypotheses are formulated:
a. Globalisation has not facilitated increased inflow of FPI into Nigeria.
b. Financial globalisation has not contributed to capital market deepening
in Nigeria.
Drynrtment of l:'cononlics, University yf Nigrrirr Nsukkrr 6 of 108

h1.S~ Dissertation: Clobnlised Fit~uncial,flows, Capital marltet deepening, and Economic Growth: Nigerian Experience ~ ~ .... ~~~ ~.. -
c. Capital market deepening as a result of globalised financial flows has
not brought economic growth in Nigeria.
1.5 IMPORTANCE OF THE STUDY
Some studies have been carried out to show the relationship between financial
deepeningjfinancial development and economic growth (Wallich, 1969; Schmidt -
Hebble, 1994; McKinnon, 1973; King and Levine, 1994; Levine and Zervous, 1998;
Montiel, 1994; De Gregorio, 1998; Schmuckler, 2003; Adiad et al, 2006; and Ndebbio,
2004). One way in which this study is essentially different from them is that it
particularizes on capital market deepening as an aspect of financial sector develop-
ment.
Particularly, the works of Wallich, 1969; De Gregorio (1994); and Ndebbio (2004)
share certain similar features with this study. For instance, the cross country study by
De Gregorio (1998) used indicators based on: lnternational Arbitrage Pricing Model - lAPM - as developed by Levine and Zervous in 1995; lnternational Capital Asset Pricing
Model - ICAPM - also as developed by Levine and Zervous (1998); Gross Capital Flows
Ratio - GFR - developed by Montiel in 1994, but transformed into discrete values; as
proxies for financial integration - FI - (i.e. globalisation), while variables such as:
Bank Credit; Market Capitalization; Total value of Shares Traded in a year; and Stock
Market Volatility were used as proxies for financial deepening (FD). He showed that FI
(FG or GFF) leads to FD of the domestic financial market, and through that channel
foster economic growth.
Though a part of this study investigates the relationship between FI and FD, it differs
from the work of De Gregorio in the sense that it typifies the Nigeria experience
under financial Globalization. Another difference is that this study avoided the use
IAPM and ICAPM as they have some shortcomings. This derives from the observation
that tests of any sort using IAPM require the identification of an adequate interna-
tional factor model, and since such a model is lacking at present, it is not possible to
say whether or not arbitrage pricing relationships hold internationally (Sharpe, 1985).
Also, if international capital markets are completely integrated, a type of ICAPM
might hold, while i f the markets are completely separated different Capital Asset
Pricing Models (CAPM) might hold for each country, but recent researches were
inconclusive on whether international markets are completely integrated or com-
pletely separated (Sharpe, 1985). Hence, IAPM and ICAPM were not used in this work.
. ~ ... - ~ - .. - .
Depprrrmtrnt of Ecoaotnics, Universiv of Nigeria Nsukkn 7 of 108

M S c Dlssertntroii Global~sed F ~ n n n c ~ a l j l o w ~ . Cnp~tol imrXet deepenlng, ond E c o n o i n ~ ~ Growth Niger~an Experience . --A --- - . -- - . -- -
Equally, GFR transformed into discrete flow was considered inferior to GFR in the
continuous mode for the purpose conducting impact analysis. Hence, unlike the work b De Gregorio, this study used GFR in continuous flow to proxy globalisation, and as
such expects a more robust result. Finally, it differs from the work of De Gregorio in
the sense that he (De Gregorio) related GFF to FD, and through that means to growth
- this study first relates GFF to the financial deepening of the external (international)
segment of the nation's capital market (IFD) and from there it i s linked to growth
through capital market deepening (FD).
Similarly, this work can be likened to Ndebbio's work (Ndebbio, 2004) in the sense
that they both analysed the relationship between financial development and eco-
nomic growth. Particularly, Ndebbio (2004) has shown for Sub Saharan African (SSA)
countries that FD leads to economic growth and development. He proxied FD in SSA
M .r countries by the degree of financial intermediation - measured as---", and the
Y
growth rate of per capita real money balances (GPRMB). In this vein also, De Gregorio
used: Credit by the Banking sector to the private sector; market capitalization as a
fraction of GDP - MCAP; total value of shares traded as a fraction of GDP - TVT;
volatility index for the stock market - VOL. to proxy FD. Clearly, these proxies do not
clearly show FD due to GFF; of FPI type equally these proxies are affected by internal
factors and hence would not show FD mainly due to GFF. However this study
uses - FPI
- - , i.e. the ratio of foreign portfolio investment in the external Re a1 Non GDP
segment of the Nigerian capital market to real non oil GDP (IFD) as a proxy for the
+ capital market deepening of the international segment of the Nigerian capital
market. This allows the liberty to specifically look at financial deepening 1 develop-
ment from the perspective of developments in the offshorelinternational segment of
the Nigerian capital market or due to GFF. Also Ndebbio's work was interested in
fineancia( development3 in general while this work particularizes on the effects of
deepening of both the domestic and external segments of the capital market. In
these ways, this study i s different from the works of Ndebbio (2004) and De Gregorio
(1998). It i s equally the first of i t s kind to use stylized facts to link GFF of the FPI
type, to economic growth in Nigeria.
' There is a strict difference between financial sector development (FSD) and capital market deepening (FD). FD is
in fict a subset of FSD. - - -
Department 01 Econonricr. Univer5ify of Nigeria Nsukkn 8 of108

A4.Sc Dissertation: Globalised Financialjlows, Capital market deepening, and Economic Growth: Nigerian Experience ~
Presently, there i s dearth of empirical literature linking FPI to economic growth in
Nigeria; therefore this study would add to empirical literature in this gray area.
1.6 Scope and Limitations o f the Study.
This study i s restricted to analyzing the impact of GFF of the FPI type on, firstly,
capital market deepening in Nigeria and ultimately, on economic growth. In doing
this, our main interest i s mainly the foreign portfolio investment flows to Nigeria.
This means that even though FDI, foreign commercial bank loans, ODA (whether
multilateral or bilateral) were al l mentioned in this study, our analysis mainly
centered on FPI and i t s effects on the capital market and economic growth in Nigeria.
This study i s also limited to some extent due to lack of data. For instance, in model-
ing the impact globalization on FPI flows to Nigeria, available literature show that
Nigerian Sovereign Risk Premium ought to be included as one of the explanatory
variables, but this was not possible due to non availability of data. Use was therefore
made of the size of sovereign national debt. Equally, the non availability of data on
FPI flows into Nigeria for the period 1986 downwards constrained this study to work
from I986 upwards.
~ . ....
Depnrtmenl @Economics, University of Nigerirr Nsrrkkn 9 of 108

M Sc D~ss~.rtutrovr Globnlrred F~nunclal flows Cnpltal 17znrket deepening, and Econonzic Growth Nlgerian Experience - --- - . . - - - -- - - - - --- -
CHAPTER TWO r
LITERATURE REVIEW
2.1. Globalization Finance and Economic Growth.
The ultimate yardstick of a country's economic success i s i t s ability to generate a
high level of production of goods and services for i t s population (Oduh, 2006). In
other words, productivity i s central to societal welfare. Therefore sustained increase
in productivity, i.e. economic growth, i s arguably an issue of primary concern to
economists in both developed and developing countries (Turnovsky, 2000). In fact,
economic theory shows that economic growth can be realized in two ways: increase
in the amount of factors of production; or increase in the efficiency with which those
factors are used. Thus, growth i s induced by the increases in investments (i.e. capital
accumulation) and the efficiency of investments (De - Gregorio, 1998).
There i s growing awareness among economists that capital accumulation plays a vital
role in economic growth. This can be discerned from the Harod - Domar, neo classical
and endogenous growth models (Smith et al, 2003; Aysit and Nil - Demet, 1997; and
Turnovsky, 2000). Therefore in economies where capital i s deficient, economic
growth is most likely to be hampered. In situations where it i s not possible to raise
investment levels due to deficient savings, recourse could be made to foreign inflows
(Baye et al, 2006; Hakkio, 1995). In fact, investment in an open economy i s equal to
the sum of domestic savings, capital inflow and budget deficit. The relation between
investment, capital inflows and domestic savings i s positive, while it i s negatively
related to budget deficits. Therefore, i f there i s no budget deficits and domestic
savings are inadequate, then capital inflows become critical to investment and by
externion to economic growth (Hakkio, 1995).
Thus foreign sources could be a good alternative of filling observed savings - invest-
ment gap in any given economy (Schmuckler, 2003). In this regard, it has also been
observed that foreign inflows can bring about capital formation, and also lower the
cost of capital to firms, especially those with access to the capital market (Schmuck-
ler, 2003; De - Gregorio, 1998). In fact, when international financial flows are
allowed into a country, it helps the functioning of the financial system through:
increased availability of funds; and improvement in the financial infrastructure
/Schmuckler, 2003). Simply put, financial globalization brings about financial sector

MSc Dissertntiori: Globtrlised Firiarzcia/,f~o~:s. Capital nzarlcet deepening, a d dcorzonzic Growth: Nigerian Experience . . .. . ... .- ~~ ~~
~ .. , - ~ -
development (De Gregorio, 1998; Schmuckler, 2003), while financial sector develop-
ment brings about growth (Ardic, Oya Pinar and Damar, H. Evren, 2006). Oks (2001 )
argued that existing finance - growth nexus literature which started with Bagehot
(1873), Schumpeter (191 1 ), Hicks (1969), and Mckinnon (1973) showed that there is a
positive relationship between financial development and growth. This conforms to
later studies on the finance growth nexus by Levine (2005), De Gregorio (1998), and
Levine and King (1994).
International financial flows have its surges closely linked to financial globalisation.
Financial globalisation, besides engendering improvements in the financial sector
infrastructure, brings about the maximization of the benefits of credits; it catalyses
competition in the provision of funds - thereby generating efficiency gains; i t makes
way for the adoption of international accounting standards, thereby increasing
transparency and good corporate governance - brought about by the introduction of
international financial intermediaries and new shareholders who now monitor the
management, which results in pushing the financial sector towards the international
frontier; i t allows the increase in the technical capabilities for engaging in precision
financing to be passed on to local and global markets; stringent market discipline
imposed by financial globalization has consequences not only on the macro-economy,
but also on the business environment and other institutional factors (Stulz, 1999;
Crockett, 2000; and Stiglitz, 2000). Financial globalization brings about financial
development which has a dual effect on economic growth. On the one hand, the
development of domestic financial markets may enhance the efficiency of capital
accumulation. On the other hand, financial intermediation may contribute to raising
the savings rate and, thus, the investment rate. The former effect was first empha-
sized by Goldsmith (1969), who also finds some positive correlation between financial
development and the level of real per capita GNP. In addition, Goldsmith (1969) also
argues that the process of growth has feedback effects on financial markets by
.creating incentives for further financial development.
Nevertheless, it is not deterministic that financial globalization must bring about
economic growth. This i s because of the existence of some puzzles i n international
financial economics - the home bias puzzle i n portfolio investment and the high
correlation between saving and investment within an economy with no or limited
barriers to cross-border financial flows. The home bias puzzle was identified by
French and Poterba (1991), who noted the low proportion of foreign stocks in
--
Depnrtntent o f Economics, University of Nigerin Nsri kkn 1 1 of 108

MSc Dissertation: Globalised Financialjlows, Capital market deepening, and Economic Growth: Nigerian Experience - - portfolio investment compared with the optimal levels suggested by the trade-off.
between risk and return. Investors seem to totally or partly ignore the benefits > associated with the diversification of the sources of risks, as may be achieved through
a wider geographical coverage. As emphasised for example by Obstfeld and Rogoff
(2000) in lssing (2000)) a possible explanation for home bias is the existence of
various forms of transaction costs for cross-border purchases and sales of financial
instruments. However, Tesar, L., and I. Werner (1995) point out that such transaction
costs are unlikely to be very high since turnover in foreign stocks is larger than for
domestic stocks. Hasan and Simaan (2000) focus on information asymmetries. They
show that home bias in portfolios of stocks can be reconciled with theory in the
presence of uncertainty regarding the estimation of returns and risks on foreign
stocks, provided such uncertainty i s higher than for domestic stocks. In some
countries, a further explanation for home bias i s the existence of restrictions on the f
range of instruments which can be held by certain categories of investors, such as
quotas on foreign country exposures of investment funds for example.
Feldstein and Horioka (1980) identified another puzzle. They remarked that, over the
long run, developments in domestic saving and investment rates were highly related
than theory would suggest. Thus, by implication, the financing of investment and the
placement of savings seem not to take ful l advantage of international financing and
placement opportunities. Plethora of explanations have been proffered to clarify the
Feldstein- Horioka puzzle, many are similar to the explanations envisaged for the
home bias puzzle. For instance, Obstfeld and Rogoff (2000) posit that transaction
costs can help explain not only the home bias puzzle, but also the Feldstein-Horioka C puzzle as well as other puzzles i n international economics such as the low cross-
country correlation of growth rates in consumption.
As poir~ted by several authors, however, there i s evidence that, although they s t i l l
exist, the puzzles have become less pronounced over recent years, as net cross-
border financial flows have increased. Specifically, international banking activity has
increased steadily i n recent decades as large banking institutions developed activities
at the global level. In addition, both the amount outstanding of securities issued in
foreign currencies and the amount outstanding of securities held by foreign investors
increased rapidly over recent years. As a result of these developments, there seems
t o be a progressive shift in the average composition of portfolios by currency and
issuer, towards patterns more in line with those suggested by the theory.
- . .
Departnzent of Ecotionzics. U11iversi1~- qf Nigeria Nsukka 12 of 108

MSc Dissertation: Globalised Finuncial~flows, Cup&~l market deepening, and Econonzic Growth: Nigerian Experience -. - -- - - - .- -. -- -
Some economists have gone beyond how the puzzles play out themselves to actually
say that there is a negative relationship between globalization and economic growth.
For instance, Oks (2001) has pointed out the work of Jappelli and Pagano as
emphasizing the possibility that the relation between financial intermediaries'
development and economic growth can be negative.
Today the endogenous growth theory i s prevailing and the existence of the
relationship between financial sector development and economic growth i s set
beyond doubt by the scientists. The matters of direction, robustness and, of course,
causation s t i l l provoke interest (Oks, 2001).
Finally, five views regarding finance growth nexus debate have been identified by
Levine (1997): first, one of the views attributable to Hamilton, Bagehot, and
Schumpeter, argues that finance ignites growth; a second view traceable to Adam
Smith opines that finance hurts growth; a third view due to Robinson is that finance i s
growth led; a fourth view credited to Lucas avers that growth is finance neutral; and
a f i f th view, mainly canvassed by World Bank and IMF emphasize that finance matter
because there is financial crisis.
Finally, we conclude by deducing that i f finance matters, then GFF being a part of
the financial flows, needed to finance investments, equally matters.
2.2 FOREIGN CAPITAL FLOWS T O NIGERIA: NATURE, TREND AND IMPACT ON THE
CAPITAL MARKET.
Of al l the foreign capital flowing into Nigeria, which comprises of: Official develop-
ment assistance - which could be either multilateral flow or bilateral flow; commer-
cial bank loans; commercial credits - which could be either buyers' credit or suppli-
ers' credit; foreign direct investment; and foreign portfolio investment, foreign
portfolio is totally distinct from the others in the sense that it i s the only type of
foreign capital inflow that passes through the capital market.
L)eprirtnzeat of Ecoaonzics, University of Nigerin Nsukka 13 of 108

MSc Dissertcrtion: Globnlised Finnncial,flows, Capital nzar.ltet deepening, and Econonlic Growth: Nigerian Experience -. -- .... -- ............ .. - .................... .....................
Table 1 - - - -- -
FPI -.-......- - . I -- - -- - - - - --- . . 7 FDI
Table 1 reveals that from 1986 FPI started featuring in the nation's balance of
payment account. From this time to 1997, the volatility of FPI flows has been
high as FPI hovers between positive and negative values. I t is worthy to note
that the period coincide with when the country was characterized by political
instability occasioned by unending transition programme of the Babangida re-
gime, the annulment of the June 12 election in 1993. The short lived Interim Na-
tional Government headed by Chief Ernest Shonekan, the 1993 coup by Abacha
and the draconian style of leadership that characterized Abacha' regime. Within
these periods, net FPI was mostly negative. I t could be argued that the sovereign
risk premium was high for the country. This most likely disturbed the investment
activities of foreign investors. By 1998, with the return of democratic govern-
ance, FPI flow into the country (Nigeria) improved from negative to positive. I t
(FPI) had kept improving that by 2005 the value of FPI has surpassed FDI flow
........ . . . - . . . . . -. . - .... ..-..... - - .. ...
L)epnrlnzenl of Econonlics, University of Nigerin Nsrrkkn 14 of 108

MSc Dissertation: Globalised Financialjlows, Capital madcet deepening, and Econonzir Growth: N~gerian Experience p--...-.--p.p--. -. .. . . . -.. . -.-.--- ~. - -~.. ..
into the country.
The relative importance of Portfolio investment to a small emerging market like
Nigeria has risen in recent years and this has led to the libralisation and internation-
alization of the capital market. Since the internationalization of the Nigerian stock
exchange, which i s a part of the financial liberalization policy of Nigeria, there has
been increased inflow of foreign portfolio investment into the Nigerian economy
through the capital market (Obadan, 2004). Thus, for Nigeria, the increase in foreign
portfolio investment has been fueled, partly by the process of globalization and the
ensuing deregulation of the capital market. A fact that i s hard to ignore i s that the
stock market i s getting good attention from foreign investors and fund managers with
its exceptionally good returns becoming too good to ignore (Uzor, 2007).
The increase in private capital flows especially foreign portfolio investment has
stimulated an intense debate about the impact of such on an emerging market like
Nigeria. Proponents emphasize the positive impacts of such flows on growth and
financial sector development, while critics express concern about i ts volatile nature.
A common concern however is that economic growth resulting from such volatile
flows is unsustainable and adversely affects the financial sector of the economy.
However, the potential contribution that FPI can make to financial sector develop-
ment and economic growth especially when regulated is enormous.
2.3 DETERMINANTS OF FOREIGN PORTFOLIO INVESTMENT (FPI)
Portfolio investment flow into Nigeria is quite a recent phenomenon. Up to the mid
1980s, Nigeria did not record any figures on Foreign Portfolio investmenred inflow in
her balance payment accounts (Okojie, 2005; Soludo, 2006). The reason for non
participation of foreign investors derives from the non- iberalization and internation-
alization of the country's money and capital markets (NSE, 2006). Thus the interna-
tionalization of the Nigeria Capital Market in 1995 is one of the reasons for enhanced
'in flow of FPI (NSE, 2006).
In Nigeria, the composition of Foreign Portfolio Investment are: Transactions in
bonds, debentures and notes as well as non-direct investor equity, preferred stocks,
mutual funds and investment trusts, also are transactions in money market instru-
ments like treasuring bills (Olisadebe, 1995). Many nations have taken steps to lure
foreign investors by tinkering with their fiscal and monetary policies to create an
.economic climate that is conducive. This is because reformed markets and increased
Ueprtnzent qf Bmnomics, University qf Nigerin Nsrikk(1 15 of 108

AbSc Dissertation: Globalised Fin~~ncial flows, Capital nzarlcet deepening, and Economic Growth: Nigeritm Experience ~ ~
legal protection for foreign investors are very necessary in attracting NPI (Macdonald
e t al, 2006; and Levine, 1995). > Reforms are facilitative of FPI in flow while the pursuit of higher rates of returns is
central to FPI inflow (Dodd, 2004). High rates of return are indicative of enhanced
economic growth. Increasing marginal efficiency of capital leads to increases in
economic growth (Jhingan, 2003). This derives from the Passinette's Profit- growth
model which stipulates that growth could be accounted for by sustained profitability
of economic activities. Thus sustained increases in growth rate can spur inflow of FPI.
Equally a surge of capital inflows into a developing country can be triggered by the
lift ing of restrictions on the capital account, know as capital account liberalization,
and by a policy to privatize what were formerly publicly owned assets such as the
telephone or rail way system (Dodd, 2005; Uzor, 2006). The policy of privatization
opens up avenues of investment for FPI, and availability of such investments could a-
course a surge of capital inflows in a developing country.
Foreign portfolio investment flow is also affected by the risk of changes in exchange
rates and interest rate, otherwise known as market risks (Hackio, 1995). Loss of
investors' confidence triggered by rising external debt, political instability and
extreme instability in macro economic fundamentals could make foreign investors
shun investing in a country (Hackio, 1995; Fitch Soveriegn Rating, 2005; and Dodd,
2004). The size of the sovereign external debt captures these risks and therefore
could be used as a proxy for sovereign risk. When the sovereign risk premium of
nation is high, it becomes difficult to attract FPI and even where it i s attracted; it
would be on unfavouarble terms (Hakkio, 2005).
+ In the view of Mundell (2000), deregulation, privatization and advances in technology
can be the reason for foreign direct investment and equity investment in emerging
markets by firms and household from developed countries. Another factor that cannot
be igtored in attracting FPI i s institutional quality. Foreign investors demand and
extract a high level of discipline on firms, and this i s essential in forming their
decision to invest (Levine, 1999; Schmukler, 2003).
To foster the level of economic growth required to create jobs, raise living standards,
and hasten development, sub Saharan African (SSA) nations need to attract more
foreign capital (McDonald, e t al., 2006). Along this line, many nations have taken
steps to lure foreign investors. They have changed fiscal and momentary policies to
create a more stable economic climate. They have reformed their national markets
and increased legal protection for investment (MacDonald e t a/. , 2006). . . . ~ .. - ..- ... -. . ..... . - . . . . ... . - - . .. -. -. .
l)epcrrtnier~t oj'l:'cononiics, University qf'Nigericr Nsukkn 16 of 108

M Sc Dmermtron Globalrsed F~nancral~7ows, Capital market deepenrng, and Economrc Growth Nrgerran Experrence - - - . - - - - -- --
Besides the twin factors of higher rate of return and policy incentives, other drivers
of FPI inflow exist. Soludo (2006) has identified other factors which attract capital
inflows as macroeconomic stability (especially price and exchange rate stability),
openness and competitiveness of the economy as well as stable political environment
and good infrastructure. UNCTAD (2003) also points to favourable rates of return of
nations as another factor that attracts FPI.
2.4 THE NIGERIAN CAPITAL MARKET: DEVELOPMENT AND REFORMS
2.4.1THE CAPITAL MARKET AND ITS INSTITUTIONS
The capital market is the long term end of the financial market. I t specializes in the
mobilization of medium to long-term funds for investment and development pur-
poses. Transactionary activities in the capital market revolve around issuance and
marketing of shares, bounds and debenture (CBN, 2000). The markets that make up
the capital market are the primary market; and the secondary market.
The Primary Market
In this market are traded new issues of securities. The mode of offer of securities
traded here consists of: offer for subscription: right issues; offer for sale; and private
placements. Most of the dominant mode of issues is equity offer which accounted for
59% of the market i n 1999. Others are: rights issue, which constitute 36.7%; deben-
tures, which make up 3.1%; private placements constitute about 0% of the transac-
tions in the primary market (CBN, 2000).
The Secondary Market
This is the market where existing securities are re-traded. This is made up of stock
exchanges and over the counter markets where securities are bought and sold. CBN
(2000) has noted that secondary market activities have increased over the years. This
'was attributed to the opening of trading floor in more parts of the
Nigerian Stock Exchange (NSE), and the elimination of institutional
impediments to operational efficiency, including foreign investment
also dominates i n this market
The Nigerian Stock Exchange
country by the
and regulatory
flows. Equities
The Nigerian stock exchange evolved from the Lagos Stock Exchange which was
=incorporated in 1960. I t became the Nigerian Stock Exchange (NSE) in 1977 (CBN, .- .. . - - -. - .. - - - .. . .. .
Deyartntent o f Ecortoniics, U~tiversify of' Nigeria Nsukkn 17 of 108

M Sc D~sserlallon Glolx~l~sed Frnuncml flows, Capital mar/cet doepenlng, and Econo~nrc: Growth N~ge twn Experwnce - -- - . - - . - . - - -. -- - - - .- - . - - - - - . - - -
2000, and NSE, 1998). Since its inception, the NSE has grown to have many trading
floors across the country. These trading floors are i n Lagos; Kaduna; Port Harcourt;
). Kano; Onitsha; Ibadan; Abuja; and Yola. The head office of the exchange is in Lagos
(NSE, 2006). NSE commenced trading with only 19 securities on its floor, however, at
present there over 300 securities being traded on the floor of the exchange (Monye,
2007).
In 1995, the NSE was internationalized with the result that quoted companies can
now access funds from international markets through Global Depository Receipt (GDR)
or American Depository Receipt (ADRs) etc using their shares as the covering securi-
ties (Nigeriabusinessinfo.com, 2001 ).
At present, the NSE has over one 1.5 million individual investors and hundreds of institutional
investors (including foreigners who own 40% - 60% of the quoted companies (NSE, 2006). The
.... NSE is the fastest growing exchange in the world today, with a market capitalization of $61.3 16
billion as at the end of June 2007. Analysts' project that is has the capaeity to hit $100 billion
mark by the end of 2007 (Monye, 2007). Furthermore, the NSE is the most profitable in the
whole world (Abodunde, 2007, and Monye, 2007).
2.4.2 Developments i n the Nigerian Capital Market
Uzor (2007) has noted that some significant developments in the business and
economic environment have led to greater attention and reliance on the capital
market.
Reforms induced by Privatization Policies
Ever since government policy started shifting in the direction of limiting the role of
the state in business activities the reform of the capital market has been a crucial
requirement for creating a viable private sector (Uzor, 2007) some of these require-
ment are in the form of more accounting information disclosure, improved capital
. market infrastructure and product offerings like e-bonus, e-dividend, e-IPOs, and e-
POS. These reforms led to and reinforced further reform in the market.
Universal Banking policy triggered reform in the capital market:
The CBN announced the Universal Banking policy of the Government i n 2000. This
policy initiative was the main starting point of sustaining rapid growth and discarding
institutional distinctions in the banking sector. The policy opened the doors of capital
market business to commercial banks. The result is that the rapid growth in the
Departmettt of Economics, University of Nigerin Nsukkn 18 of 108

MSc Dissertation: Clobnlised Fintmcitrljlows, Capital nzarket deepening, and Econonzic Growth: Nigerian Experience ~
financial se rv i ce~ indus t r~ found an expression i r i a market set for explosive growth
(Uzor, 2007).
Introduction of the Emerging Market
The Emerging Markets was introduced in April 1985~. NSE in i ts "presentation notes"
states that Emerging Market (formerly second Tier Securities) are the small compa-
nies (upstarts) that are yet to meet all the listing requirements of the NSE. The main
purpose of the Emerging Market is to encourage indigenous entrepreneurs to access
the stock market. In the Emerging market, a company may not be allowed to raise an
amount in excess of W100 million. Under the Emerging market rules; an individual can
own up to 90% of the shares. This adds flexibility to the restriction of an individual
not allowed to own shares in a company in excess of 5% of the company (NSE, 1999).
Thus the Emerging market architecture in the capital market makes it possible to
raise funds for business whose potentials are not immediately known to the public.
Establishment of the Indigenous Quoted group (IQG)
The IQG was formed and established in 1997 by indigenous quoted companies on the
Nigerian stock exchange as a platform for indigenous quoted companies to discuss
issues of common interest (NSE, 2006). Thus it forms a forum for the critique of issues
and developments in the capital market and juxtaposing them against the realities of
the times with the interest of the Nigerian quoted companies paramount. I t is hoped
that this development wi l l lead to synergy and subsequent fine tuning of capital
market policies i n a way that wi l l move our industries forward.
Automated Trading System (ATS) and Electronic processing of share issues.
The ATS is a security arrangement whereby transactions on the stock Exchange are
carrigd out through a network of computers. The ATS was launched in April 27 1999.
I t has facility for remote trading and surveillance (NSE, 2006). The ATM makes it
.possible for dealing members to trade on-line-real-time from their offices. The ATS is
tightly coupled with the CSCS (Central Securities Clearing System). In view of this,
when brokers enter their orders for buy, for instance, the system goes into the CSCS
system to verify i f the account numbers entered by the broker exist and i f the stocks
4 NSE in its 'Presentation Notes' states that Emerging markets (formally Second Tier Securities) are for the small
companies (Upstarts) that are yet to meet all the listing requirements of the NSE. The main purpose of the Emerging
Market is to . encourage - .. indioenous . ._a entrepreneur., . ... .. to . access . . - the stock market. .- ~
~ . .. . . -. - .. . -- .. . .. -. -. . .. ..
Deprrrlnzent of Econonrics, Universily qf Nigerin Nsirkkn 19 of 108
M S c I~isser~tatiot~: Glol~ulised Fiwuncinl,flows. Cnpitcrl~~~rrrliet deepenirzg, and Lconomic Growth: Nigeriur~ hperierzce ~ - ~ " ~ .- ~ ~
are available in the client's accounts. The introduction of the ATS made it possible to
transit from the old system of transacting business in the capital market which i s
t manual (the call over system), to a new system of transacting business which i s
electronic (Nigeriabusinessinformation.com, 2001; NSE, 2006). The electronic system
of transaction made possible by the ATS made it possible for SEC to approve the e-
bonus system in 2004 to replace the issuance of physical certificates for scrip issues
(NSE, 2006, Uzor, 2007).
Introduction of t+3 transaction circle
The establishment of the CSCS made possible the introduction of T+5 on the lSt
March, 2000. T+5 means transaction day plus 5 working days. This was the initial
transaction cycle when the Nigerian Stock Exchange launched the CSCS Limited
(Central securities Clearing System). This has been reduced to 4 days with the
introduction of the T+3 (i.e. Transaction day plus 3 working days). With the estab- *
lishment and introduction of CSCS and T+3 respectively, NSE (2006) notes that the
following benefits stand to be reaped.
1. Reduced settlement cycle; increased liquidity and reduced risk
2. Efficiency i s increased by eliminating errors, and lowering costs
3. The automated system i s able to handle surges in demand
4. Reduction of risk through shortened transaction circle that eliminates
errorslfrauds which could occur as a result of long processing time.
5. Centralization of depository functions, reduces costs and increases effi-
ciency
6. Information can be retrieved and verified at a faster pace
lnvestprs can take advantage of capital appreciation because of the T+3 or same day
settlement cycle.
Introduction of the Trade-Alert Systems
The trade alert i s an automated stockholder alert system that notifies an investor of
transactions in his stocks-usually through a GSM mobiles phone. I t was introduced on
March 24, 2005 (NSE, 2006). The NSE noted that the introduction of the Trade Alert
Systems has brought about the following benefits. !
1) Empowers Investors with a tool for independent monitoring of their in- -
Depnrtnzent of Emnomics, University of Nigeria Nsukka 20 of 108

AlSc Drrset-tczt~on Glolmll~rd Flnancralflows, Capital nzarLet deepen~ng, and Econonzrc Growth A1~grt.run bxpcwence - --- - - -. - - - -- - - - - - . . - --- - - - -
vestment accounts at the CSCS
2) Eliminates chances of unauthorized transactions in investors' account
3) Reports of stock market activities- Notices of AGMs, quarterly financial
highlights of quoted companies, weekly price movement of stocks, etc.
4) Enhances trading in e-IPOs (electronic initial public offers), e-pos (elec-
tronic public offers) and e-bonus (electronic bonus shares).
5) Improved investors' confidence in the market.
The Big Banking Bang:
A very critical event in the growth process of the capital market happened in
2004/2005. This was as a result of the Banking sector Consolidation exercise. During
this exercise the banks pumped in billions of equities into the capital market. This
created investment opportunities in the capital market. The inflow of new money
from both foreign and domestic investors within the period of banking consolidation
improved the ranking of the Nigeria Capital market as the fastest growins equities
market (Uzor, 2006).
Re-entry of government bonds:
In the 1 9 8 0 ~ ~ issuance of long dated government instruments was suspended. These
long term instruments were re-introduced, and this made the capital market to be
deeper and broader in its range of products.
Support as a Result of Monetary Policy Spill Over
In recent times monetary Policy has achieved a great deal of stability. Monetary
authority's low interest rate policy and the accompanying stability in the liquidity of
the economy resulted in large flows of funds to the capital market as investors move
from money market to capital market.
The return of flight capital
The use of two major regulatory tools has brought about increased the retentive
ability of the capital market in terms of capital flow. For the first time, the economy
in about three decades i s retaining an increased proportion of Nigerian originated

M.Sc Disseriation: Globalised Financiuljlows, Capital nzcrrlcet deepening and Economic Growth: h'igerinn Experience ~ ~ .. ... . .-- ."
financial capital. The first of the policy tools has to do with government effort
against money laundering, which has recorded an appreciable success in stemming
capital flight (Okereke, 2005; and Uzor, 2007).
The second policy tool i s the high level of exchange rate stability achieved over the
past two years. That has closed the opportunity to profit from holding dollar denomi-
nated assets and reconverting to the naira later at depreciated exchange rate. The
developments have added to the stability of financial markets and made available
large sums of capital for investment in the stock market (Uzor, 2007).
This i s a big victory for the Nigerian economy, which i s happening at a time of
sustained rapid economic growth. Government revenue has been a t an exceptionally
high level in the past several years and reasonable stimulatory spending has happened
to raise the level of business activity generally.
A new strength from pension reform
The introduction of a new pension scheme has created a strong flow of investment
capital from retires to the capital market. Retirees leaving the public sector are for
the first time in Nigerian history able to get their retirement benefits within a
reasonable time. The number of such people has increases over the past two years, as
the government privatization machinery gained speed.
The pension reform itself created a new window in capital market operation for
pension funds managers. An estimated 10 million employees are expected to register
with the National Pension Commission [PENCOM] for retirement accounts. This has
- created a huge market for pension funds administrators [PFAs] key actor in a stock
market that have since been virtually absent in the Nigerian market.
Definitely, the presence the PFAs wi l l boost the availability of longer-term invest- *
ment capital in the market and positively impact on institutional investing and
trading in securities. According to Stock Market Guide (2007) an estimated 44300
billion contributed by the public and private sectors are estimated to be currently
under the management of PFAs.
Contributions are estimated at N8-10 billion monthly. Nigeria hasn't had such a long-
term stable fund for a long time. The inflow of huge funds for investment i s clearly
tasking the capital market i n terms of absorptive capacity. The market i s yet to
develop the depth and investment options needed in response to the demand for
D~pcrrtnrer~t of Lcononlio, Utliver~ity of Nigerici N\ukkrr 22 of 108

A1 Sc D I Y S ~ T I L I ~ I O N Globrrl~\ed F117nnc1rrl /lows, C'npltnl ~nurltet deepen~ng, and Economic Growth Vrgermn Expwrence . . - - - - - - - - - - - - - -".-- financial assets under the pension reform. How much of pension funds the capital
market can attract depends on how fast it can create the needed investment charac-
teristics (Stock Market Guide, 2007; and Uzor, 2007).
Investments and securities Act No. 45, of 1999fd
In 1999, the law with which the apex regulatory body in the capital market would
operate was enacted. The law - Act No. 45 of 1999 clearly stipulated the functions
and powers of the Securities and Exchange Commission (Aigbekaen, 2007). Laws are
listed below.
To regulate investment and securities business in Nigeria.
To register and regulate securities exchange, capital trade points futures, op-
tions and derivatives exchange, commodity exchanges and any other recog-
nized investment exchange.
To register securities to be offered for subscription or sale to the public.
To render assistance in all aspects including funding as may be deemed neces-
sary to promote an investor wishing to establish securities exchanse and capi-
tal trade points.
To prepare adequate guidelines and organize training programmes and dis-
seminate information necessary for the establishment of securities exchange
and capital trade points.
To register and regulate corporate and individual capital operators as defined
in section 30 of the Act.
To register and regulate the working of ventures capital funds and collective
investment scheme including mutual funds.
To facilitate the linking of al l markets in securities through modern communi-
cation and data processing facilities in order to foster efficiency, enhance
competition and increase the information available to brokers and investors.
To act in the public interest having regard to the protection of investors and
the maintenance of fair and orderly markets and to this end establish a na-
tionwide trust scheme to compensate investors whose losses are not covered
under the investors protection funds administered by securities exchanges and
. capital trade points.

A 1 Sc D~ssr i~i~tron Globulrsed Ftnirnocll flows, Cap~lal ~izrrrlwt cJ(v,uenrng, and Econonrrc Groii,tll Nrget'rrczn Expet rence . . - - -- - -- -- - - - - - - . - . ?. - .- - - - -
TO keep and maintain separate registers of foreign direct investment and for-
eign portfolio investments. ).
To register and regulate central depository companies and clearing and set-
tlement companies, custodians of securities, credit rating agencies and such
other agencies and intermediaries.
To protect the integrity of the securities market against abuses from the prac-
tices of insider trading.
To act as a regulatory apex organization for Nigeria capital market including
the promotion and registration of self regulatory organizations and capital
market trade associations in which it may delegate it's powers.
To review, approve and regulate mergers, acquisition and all forms of business
combination.
To promote investors education and the training of al l categories intermediar-
ies in the securities industry.
To call for information from an undertake inspection conduct inquiries and
audits of the security exchange unit trusts, mutual funds, capital trade points,
futures, options and derivatives exchanges as well as other intermediaries and
self-regulatory organization in the securities industry.
To call for and furnish to any agency such information discharge of i t s func-
tions.
To levy fees or other charges on any person for carrying out investment and
securities business in Nigeria.
To conduct research into al l or any aspect of the securities industry. b
To prevent fraudulent and unfair traded practices relating to securities indus-
try.
To advice the minister on all matters relating to securities industry.
To disqualify unfit individuals from being employed anywhere in the securities
industry.
To liaise effectively with the regulators and supervisors of other financial insti-
tutions locally and over seas and
- - . - . .
Department of l:'cononrics, lJniversi()~ of Nigeria N t r ~ k h ~ 24 of 108

h./Sc D1wr~tar1o17 Glohtrlr~ed F ~ t i o n c ~ ~ l jlniss Coprtrrl nzarltrt deepening, and Ecanonzrc Growth Nlgerlan Experrence - . - -- - - - - --- - - - - . - - - To perform such other functions and exercise such other powers not inconsis-
tent with the decree as are necessary or expedient for giving full effect to the
provisions of this decree.

M S c Dissertation: Glohnlised I;inancial,flows, Cupital market deepening, and Econon7ic Growth: Nigeritrn Experience --- --- -.. . ... .- . -- -. -. - ..~ - . -. . -. - . . . . - - .- .. .- - -- -. -. . - ... ~ ~ . .~
2.5 Empirical Literature
Empirical findings are as divergent as theoretical views on the growth -- finance
nexus. Many researches come out with different views. Essentially, the discussion
focuses on the link between different aspects of financial development and growth.
For instance, focus could be on different measures of financial intermediately
improvements and growth, or between any of: credit to private sector; different
measures of money supply; and, or the different forms of capital market develop-
ment (Schmuckler, 2003; De - Gregorio, 1998; Ndebbio, 2004). In the context that
capital flows, arising from financial globalisation and integration contribute to
financial development, views are currently being expressed regarding growth and the
various forms of ~lobalised financial flows.
De Gregorio (1998) contributing to the debate in his work on the relationship between
international financial integration and economic growth opines that most recent
literature on the theme emphasize the role of financial deepening on economic
growth, while neglecting the role of international financial integration in
promoting a deep domestic financial market and through that channel fostering
economic growth. Financial integration also permits portfolio diversification,
allowing higher profitability on investment and, hence higher rate of economic
growth. Other empirical findings exist and discussed below:
Schmuckler (2003) i n his work - Financial globalization: Gain and Pain for Develop-
ing Countries - discusses the benefits and risks that financial globalization entails for
developing countries. He opines that financial globalization can lead to large bene-
. fits, particularly to the development of the financial system. But financial globaliza-
tion can also come with crises and contagion. The net effect of financial globalization
is likely positive in the long run, with risks being more prevalent right after countries
liberalize.,So far, only some countries, sectors, and firms, have taken advantage of
globalization. As financial systems turn global, governments lose policy instruments,
so there i s an increasing scope for some form of international financial policy coop-
eration.
Issing, (2000), in his study on "the globalization of financial markets" posits that
globalization i s a process which is not yet finalized and wi l l lead to a world in which
countries and economic areas become more and more interdependent. In some
quarters, the unfolding of the process of globalization has given rise to the view that
central banks are becoming increasingly "powerless". ... the challenges posed to - --
Drprrrtnzent of Ecorlontic\, L'niverri[)l of Nigerin N w h k o 26 of 108
A1 Sc DL\ \rrtrr/ron Glohrrlrwd F~ntr i~rnl f lnw.~, ( '(1p1tal17icr~kef &epenlng, arid Econoimc Growth Nrgeimn Experience .- - - - .
monetary policy by the increasing globalization of financial markets are of two
orders. First, the reactions to monetary policy decisions can be rapid and widespread.
Second, monetary policy needs to take into account structural changes to the
economic environment, in the form of more interdependence amongst economies.
These challenges require clear and honest communication on the part of central bank
and a robust as well as encompassing monetary policy strategy which i s able to cope
with structural economic change. In the context of slobalised financial markets, it i s
of the utmost importance that monetary policy pursues as i t s primary objective the
maintenance of price stability. This i s the best contribution that monetary policy can
make to economic growth over the longer run and wil l contribute to efficient and
stable financial markets.
Ardg O.P., and Damar H.E. (2006), investigated Financial Sector Deepening and
Economic Growth: Evidence from Turkey. The study analyzes the effects of financial
sector deepening on economic growth using a province-level data set for 1996-2001
on Turkey. This period i s associated with a weakly regulated and relatively unsuper-
vised expansion of the banking sector which led to the 2001 financial crisis. Contrary
to findings in previous literature, results indicate a strong negative relationship
between financial deepening both public and private and economic growth. In light
of the developments in the period of analysis, this result i s not surprising, as the main
function of the banking sector at time was to provide financing for the Turkish
Treasury, which channeled these funds to the government-albeit mainly for rent
distribution purposes. However, the study contended that the growth of private
banking sector needs to be examined separately, as government ownership of banks
may distort the development of the banking sector as a whole. Conclusion reached
from the study shows that it i s possible to conclude that financial development may
not always contribute to economic growth, and the conditions under which such a
contribution takes place should be investigated further.
' De Gregorio Jose (1 998), in his work on Financial Integration, Financial Development
and Economic Growth, mainly analyzes the relationship between international
financial integration and economic growth by analyzing empirically the relationship
between financial integration and financial development, and between financial
development and economic growth. . The study notes that recent literature surveyed
in this paper emphasizes the role of financial deepening on economic growth, while
less attention has been paid, however, to the role of international financial integra-
1)eprrrtnrcwt of lkmornicr , Universi(y of Nigerirr Nsuhhr~ 27 of 108

M S c D i ~ ~ e r i t r t r o n Globnloed F mancia1 m low^ C'npitcrl ninrAet dcepenlng, nnd Econoriirc G r o ~ t h i l lgemrn bxperrence - - -- a -- -- - -- - - -- tion in promoting a deep domestic financial market and throush that channel foster-
ing economic growth. The study posits that financial integration also permits portfolio
diversification, allowing higher profitability of investment and, hence, higher rate of
economic growth. Those issues are examined in this paper. In particular, after
reviewing the theory and evidence,
Halac M., Zoido, P., and Schmukler, S.L., (2003) in their work - Financial Globaliza-
tion, Crises, and Contagion - opines that different forces and potential benefits are
pushing towards increasing financial globalization. However, globalization can carry
important risks. Essentially, they reviewed the literature on crises and contagion in
the context of financial globalization, and were able to find out that Countries with
weak fundamentals become more prone to crises when they liberalize their financial
sectors. Furthermore, globalization can also lead to crises in countries with sound
fundamentals, due to imperfections in financial markets or external factors. More-
over, open economies are exposed to contagion via different channels such as real
links, financial links, and herding behavior. S t i l l , in the long run, the net effects of
financial globalization are likely to be positive. The main challenges for policymakers
is thus to manage the process as to take advantage of the opportunities, while
minimizing the risks.
Oks A., 2001, in the study on efficiency of the financial intermediaries and economic
growth in CEEC" presents an analytical discussion and empirical evidence of the
relationship between financial sector development and economic growth among
Central and Eastern European countries. The study notes that theoretical views allow
for the complex relationship between the financial sectors development and eco-
nomic growth. Empirical evidence shows that depending on the time period and sub-
sample the correlation of the financial development with economic growth can be
negative or positive. Using monthly data the causality can run one way or the other,
depending on the particular country.
Abiad, A., Oomes, N., and Ueda, K., 2004, in the paper: "The Quality Effect: Does
Financial liberalization Improve the Allocation of Capital?" documents evidence of a
"quality effect" of financial liberalization on a locative efficiency, which is measured
by the dispersion in Tobin's Q across firms. Based on a simple model, the authors
predict that financial liberation, by equalizing access to credit, reduces the variation
in expected marginal returns. They test this prediction using a new financial liberali-
'zation index and firm-level data for five emerging markets: India, Jordan, Korea,
Depnrltnent of Econonzics, University of Nigericr Nsukkn 28 of 108

iL.1 S t Drs~c.~ l(llI017 (,lohcrlr\cd F~nanc~rc~l Jloivs, ('uprttrl tiitrrAei dcepc~nrng, ctrid Economlca G~~o i v / h Vrgerltrn F~lwiwrrc~r
Malaysia, and Thailand. They find strong evidence that financial liberation, rather
than financial deepening, improves allocative efficiency.
Rybinski, K., (2006), discussing on globalization versus financial markets, concludes
that globalization of financial markets, trade, manufacturing, services and knowledge
i s a great opportunity for the global economy. Owning to this process, the developing
countries may modernize and grow faster than they have ever done before. On the
other hand, both manufactures and consumers in the developed countries take
advantage of the access to the huge global labour market, which makes it possible to
lower the costs of manufacturing, enhance productivity and -- consequently - lower
the prices of many goods and services. Both consumers and producers are also
beneficiaries of globalization of the financial markets, which off a wide range of
products enable a better adjustment of the risk profile and t he expected return or
cost of the preferences of investors and borrowers. Globalization also has i t s draw- -L
backs. It generates new types of risk, which constitute challenges to central banks
and supervisors of financial markets. Globalization of financial markets and the
related rapid growth of turnover i n credit and derivatives, such as CDOs or default
swaps, force a focus on understand, what types of risk are generated in particular
market segments. Such risks should be continuously analyzed by central banks and
supervisory authorities. I t may happen in the future that the social groups which incur
losses in the process of globalization wi l l force the decision-makers to take up
protectionists actions, which may contribute to significant lowering of the future
economic growth through limiting the benefits from international trade. Therefore,
economic policy, especially in countries with a large share in the global product, A should be conducted in a manner that would enable policy makers to avoid the
scenario of protectionism growth. After all, one of the greater threats which are
difficult to evaluate i s the risk of adjustment of global imbalances, especially where
it results from market forces without support from adequate reforms.
Ayhan Kose, M., Prasad, E., Rogoff, K., and Wei, S. , 2003, studied the effects of
financial globalization on developing countries by way of appealing to some empirical
evidence, they concluded that Developing economies' financial linkages with the
global economy have risen significantly in recent decades. However, a relatively
small group of these countries has garnered a lion's share of private capital flows
from industrial to developing countries, which surged in the 1990s. Despite the recent
sharp reversals in such "North-South" capital flows, various structural forces are
l~qmrtr~wrrt of Bcononricr, 1 /niversity of' Nigerin NLsu h krr 29 of 108
M.Sc Dissertatiorz: Globuli.srd Fin~ncia/,flows, Gpi tal market deepening, and Economic Growth: Nigerian Experience -~ -. -. --. ..~. -- ~. ---
likely to lead to a revival of these flows, and to continued financial globalization,
over the medium and long term. They averred that theoretical models have identified F- a number of channels through which international financial integration can promote
economic growth in developing counties. A systematic examination of the evidence
suggests that it i s difficult to establish a strong causal relationship. In other words, i f
financial integration has a positive effect on growth, there i s as yet no clear and
robust empirical proof that the effect i s quantitatively significant. There i s some
evidence of a "threshold effect" in the relationship between financial globalization
and economic growth. The beneficial effects of financial globalization are more likely
to b e detected when the developing countries have a certain amount of absorptive
capital., preliminary evidence also support the view that, in addition to sound
macroeconomic policies, improved government and institutions have an important
impact on a country's ability attract less volatile capital inflows, and on i t s vulner- h
ability to crises. International financial integration should, in principle, also help
countries to reduce macroeconomic volatility. The available evidence suggests that
developing countries have not fully attained this potential benefit. Indeed, the
process of capital account liberalization appears to have been accompanied in some
cases by increased vulnerability to crises. Globalization has heightened these risks
since cross-country financial linkages amplify the effects of various shocks and
transmit them more quickly across national boarders. A type of threshold effect
appears here as well -reductions in volatility are observed only after countries have
attained a particular level of financial integration. The evidence suggests that
financial integration should be approached cautiously, with good institutions and
macroeconomic frameworks viewed as important. The review of the available
evidence does not, however, provide a clear road map for the optimal pace and
sequencing of integration. For instance, there is an unresolved tension between
having good institutions in place before undertaking capital market liberalization and
the notion that such liberalization can itself help import best practices and provide
an 'impetus to improve domestic institution. Such questions can best be addressed
only i n the context of country -specific circumstances and institutional features.
Chalapati Rao, K.S., Murthy, M.R., Ranganathan, K.V.K., 1999 in their study on
foreign institutional investments and the Indian stock market, agreed that to facili-
tate foreign private capital flows in the form of portfolio investments, developing
countries have been advised to develop their stock markets. I t was suggested that
these investments would help the stock markets dir ..... ~
Deprrrtnrerrt of Ecorrontics, Lfr~iveesity qf Nigeria Nsukkn 30 of 108

A//.,'%; Disseriurion: Glolx~lised Fina17cicrlflows, Capitol nmrliut deepening, irnd Econotnic Growth: lVigel.ia17 E.xperienc:e . ..-. - ...~ .. . . . -. . .... .- ~ - .. .. . . ~ ~ . . ~ ~
based on indirectly by compelling local authorities to improve the trading systems.
While the volatility associated with portfolio capital flows i s wel l known, there i s also
a concern that foreign institutional investors might introduce distortions in the host
country markets due to the pressure on them to secure capital gains.
Nissanke, M. and Stein H., 2002, writing on Financial Globalisation and Economic
Development: Toward an Institutional Foundation averred that on the promise of
enormous benefits from financial openness, many developing countries have em-
braced, with open arms, financial globalisation by adopting internal and external
financial liberalisation. Yet, despite the rhetoric of i t s proponents, there i s l i t t le
evidence of enhanced development finance or any concomitant improvement i n
economic development. We critically examine the mainstream theoretical rationale
for financial globalisation and liberalisation as well as their explanations of the
widespread financial instability and crises that have been associated with financial
openness. The paper also draws on broader theoretical traditions to explain the
ubiquity of recent financial crises. Pointing to an alternative more dynamic analysis
of the symbiotic relationships between finance and economic development, we
propose an institutional-centric approach that forms a basis for understanding the
transformation required for financial development. We argue that financial flows can
be seen as a series of domestic and international circuits that intersect among
themselves and with the real flows of commodity and productive resources. Institu-
tionally, each flow has a set of internally concatenating capacities, incentives,
norms, regulations and organizations. For development to occur, financial flows need
to feed into real sector circuits to enhance expansion and accumulation, whilst
national flows need to tap into international flows to complement the speed and
capacity of the domestic flows to feed into the real sector circuitry.
Butkiewicz, J.L., and Yanikkaya, H., (2003) in their study on capital account
openness, international trade, and economic growth: a cross-country empirical
' investigation, investigates the relationship between capital account openness and
growth. Their empirical investigation of the effects of capital restrictions on growth
provides evidence supporting capital account liberalization, especially for developed
countries. They also show that capital restrictions are more likely to reduce the
benefits of foreign direct investment on growth in developing countries. Estimation
results for long-term capital flows demonstrate that countries with higher flows tend
to grow faster, and these results challenge the belief that countries must have
Ikpurtnrent of I:'connntics, Univecti!~ of Nigeric~ N\rrhk(~ 31 of 108
,bl SL U~sse~~fu t~orr Glohal~sed F~rrc~ricrc~lJlo~~s, (-0plt~11 rnnrkef deeperirng, and E L O I I ~ I I I I L G'rowtl~ Nlgerrnn Experirncc - - - - -. - - attained a threshold level of development orhurnan capital to benefit from capital
inflows. Moreover, their results imply a substitute relationship between trade with
developed countries and foreign direct investment inflows.
Agarwal, R.N., (2006), in the study to investigate for India the impact of financial
integration on i t s capital market in terms of growth, volatility, and market efficiency
shows that the primary Indian capital market has grown significantly since the
beginning of capital market reforms in 1992 - 93. The secondary capital market i s also
found to have grown in terms of i t s size and liquidity. Volatility in stock prices i s
found to have declined annually. Industry wise volatility measured by the beta i s
found to be greater than unity in the latter period after reforms mainly in metals and
metal products, cement and, finance and investment industries indicating better
performance of these industries compared to the market. The regression results do
not support the random walk model of market efficiency. >
Levine, R. (2001) in his work on International Financial Liberalization and Economic
Growth, pulls together existing theory and evidence to assess whether international
financial liberalization, by improving the functioning of domestic financial markets
and banks, accelerates economic growth. He suggests that the answer is "yes." First,
liberalizing restrictions on international portfolio flows tends to enhance stock
market liquidity which in turn; enhanced stock market liquidity, and accelerates
economic growth primarily by boosting productivity growth. Second, allowing greater
foreign bank presence tends to enhance the efficiency of the domestic banking
system. In turn, better-developed banks spur economic growth primarily by
accelerating productivity growth. Thus, international financial integration can C
promote economic development by encouraging improvements in the domestic
financial system.
Generally, Levine (2007) had noted that empirical literature on growth finance nexus
show that: stock market liquidity predicts growth and productivity growth; liquidity
does not predict savings; market size does not predict growth; market volatility does
not predict growth; banks and stock markets affect growth- primarily through
productivity- not through private, domestic saving. Other evidences confirm this:
country studies, industry-level studies, firm-level studies, dynamic-panel studies, and
time-series studies. Moreover, impact i s causal, robust, and big.
On the basis of the empirical literature, Levine proffered answers to some questions *
that have been at the center stage of the growth finance nexus debate. Some of the
Depnrfntenl of Economics. 1Jrriversi~~ of Nigerin N ~ u l i h 32 of 108

\/I .% Diuerttrtlon Clohrrlisrd F~n r i no~ i l /low.\. C~lpltoI i~~urXrt d m / ~ ~ l ~ l t I g , and Econonzlc Growth Nigel-larl Experrenr,e
questions are: wi l l a country with a better functioning financial system today grow
faster over the next decades? - ... answer - "yes"; should policy makers place financial
sector reforms high on their agenda? -.... answer- "yes". Levine (2007) also pointed
out some policies affecting finance as: entry of foreign capital; entry of foreign
banks; inflation; regulations; and legal system. Equally, it was pointed out that
capital control liberalization affects stock market due to the fact that it: temporarily
raises volatility - but, this doesn't hurt LR-growth; raises liquidity - which accelerates
Initial financial development affects the impact of subsequent policy reform. Finally,
it was pointed out that better finance boosts growth, while better legal systems
boost finance. Legal systems affect capital markets through: supervision and regula-
tion; information disclosure; and macroeconomic stability. This suggests a strategy
for promoting economic growth. A

M.Sc Dissertation: Globrllisrd Financialflows, Capital nzarket deepening, and Econonzic Growth: Nigerian Experience . .. . . .. - . - . " " ~.., ~ .-
CHAPTER 3
METHODOLOGY
3.1 Theoretical Model Specification
Here, we develop the model of this study from the formal neoclassical model by
incorporating the indexes of capital market (both the external and domestic seg-
ments) deepening into it. Since the simple neoclassical model i s restrictive and hence
exhibits constant returns to scale (CRTS), i t s use would imply that the problem of
convergence would manifest in the study. But our study is predicated on the premise
that there wil l be no convergence otherwise, the motivations for continued inflow of
FPI wi l l no longer hold. This would jeopardize the theoretical consistency of the
model. Therefore, neoclassical model must be used in i t s unrestricted form.
Recall that in the neoclassical growth model, there are four variables: output = Y;
capital = K; labour = L; and knowledge = A. The relationship between these variables
i s specified by the production function:
Y, - / ( K , , A,, I,, ), here time t does not enter directly, but only through K, L, and A.
Output varies over time as the inputs into the production function changes. "A" can
enter multiplicatively to generate any of the following production function:
a. I: = ,/'(K,, A, L, , ) , Here technological progress (TP) i s Labour augmented
(Harrod - Neutral).
b. = , / ' (A, K,, L,), PT i s capital augmenting (Slow Neutral).
c. Y, - A,~(K,, I , , ) , Hicks Neutral, which i s unrestricted.
The models al l assume that the productions function have constant returns to scale
(CRTS), and that the only input variables that are critical are: capital, labour and
knowledge. However, for CRTS to hold, the economy needs to be very large, other-
.wise there might be increasing returns to scale (IRTS)'. Since we are interested in
Nigeria as against the whole world, it becomes plausible to assume IRTS, which means
that compared to rest of the world, Nigeria is a small economy. This implies that the
issue of convergence of research variables to world averages has been ruled out.
Y =z A ~ ( K . 1,): Hicks Neutral. I'hc modcl's cr~tical assumptrons arc: constant rcturns to scale; implying
relatively largc economy because in slnall economy there may thc tendency fbr increasing returns to scale; only K,
. . . . . . .-
Dcpnrtrrzerrt o f Ecorronzics, Utriversity o f Nigerin Nsrrkko 34 of 108

il/l Sc U~~swtutron Glohalrsed Frnanc~nlflows, Caprtal market deepetrrng, and Economrc Growth N~ge~*rntl Expcrlence - . . .- - - - . - . . - - - - - -- . - - - -- - - - - .- -
~ r o m theory, the only critical input variables for the model adopted (i.e. the Hicks
Neutral unrestricted growth model i s adopted) for this study are A, K, and L,
therefore the explanatory variables can only enter the production function through A
which i s the efficiency variable.
Advances in technology ensure that today's productive plant exhibit increasing
returns to scale (IRTS). Therefore it becomes more appropriate to model contempo-
rary economies with the unrestrictedlaugrnented neoclassical model. This study wil l
therefore use the unrestricted 1 augmented neoclassical model adapted in such a way
that the main variables of the study wil l 20 into the model as factors of production
through the efficiency parameter. This conforms to the convention of economists
involved in related growth studies, who have generally acquiesced that some vari-
ables be treated as factors of production by entering the growth equation through
"A" (Wallich, 1969; Kin2 and Levine, 1993; Easterly and Rebelo, 1993; Elbadawi and
Ndulu, 1994; Ndebbio, 2004).
3.2 Derivation o f The Theoretical Model
We therefore develop an unrestrictedlaugmented growth from the aggregate produc-
tion function shown below:
Where,
Y = Output
A = Efficiency parameter
K = Capital and
L = Labour 6
From ( I ) we develop the growth rate expression
ButdK 2: 1 I:: Investment. Note also that:
dl, a. a, i s the share of labour to output growth.
I,
Dtpllciritrrerrt of Econoniics, University o f Nigeriti N.sukkn

M Sc Dlssevtat~on G l o b a l ~ ~ e d F1nar7c1nljlows. Ctiprtrrl ~~znrltet deepening, and Econom~r Growth N~gennn Expe~ m c e - - - - - -- - . - - - . . -
b. a, dK i s the share of capital to output growth. K
C. dA - ['i'; -
- (aK F) 1.e. share of factor productivity (efficiency). A
Adjusting (3) for the economy size, we have:
But A = A(Il+D,FlI,E;'V)e"' .................................................... (5)
I. Where:
IFD = Financial deepening of the international capital market segment of Nigeria
FD = Financial deepenin9 of the capital market as a whole
FV = Other explanatory variables
Adjusting IFD, FD, and FV for economy size and assuming they influence the effi-
ciency parameter, and then we wi l l have:
Equation (8) uses the product rule, i.e.
d(x, y) = y.dx -t xdy
Dividing equation (8) through by A, we can have i t s equivalent in equation (9):

Ad Sc Dlsserratron Globdi.\ed F~nntzc~alJlolvs, Cnp~ttrl /~tnvltet de~penlng and Econonzrc C ' ~ ~ i v t / z N~gerran Experrencc. - - . - - - - - - -
hen putting (4) and (9) together, we have an equation-that i s close to the one
below:
3.3 Choice of Proxies for GFF and Financial Deepening of the Capital market.
Several indicators of financial deepening (FD) of the capital market have been
proposed in literature, and of course, they (the indicators) have been used to proxy . different aspects of the relationship between the FD of the capital market and
economic performance. Initially, the indicators were based on monetary aggregates,
such as M I or M2. However, as argued in De Gregorio and Guidotti (1995)) they may
provide a poor proxy of financial development, since they are more related to the
ability of financial systems to provide transaction services, and not necessarily the
ability of financial intermediaries to channel funds from savers to borrowers. How-
ever, since we are interested in investigating the relationship between GFF and
growth, such aggregates wil l be of l i t t le or no value in this study.
De Gregorio and Guidotti (1994), and King and Levine (1993) use, alternatively, the
ratio of domestic credit to the private sector to GDP as a proxy for the degree of
financial intermediation. I t corresponds to credit granted to the private sector by the
central bank and commercial banks. The main advantage of this indicator over other
monetary aggregates lies in the fact that it excludes credit to the public sector, and
hence represents more accurately the role of financial intermediaries in channeling
funds to the private sector. This measure is, however, only a partial indicator of
financial development. I t i s a good indicator of financial development that occurs
through the banking system, but may be a weak indicator of financial development
that occurs outside the banking system, e.g., stock markets. This weakness may be
more relevant in industrialized countries, which have experienced significant non-
blank financial innovation.
In developing countries, most financial developments have occurred within the
A4 Sc Ursrerttrtlon Globtrlr.\ed t. rnrrn~~trl /low.\, C'tlpttrl nzarltci deepening, and Econoii~rr. Growth N~gerltrn Expermce - -- - - -.
banking system. Nevertheless, the use of CREDIT as indicator of financial develop-
ment does not f i t our purposes of analyzing the role of GFF on growth. t
For the choice of a proxy for GFF~, we settle for the magnitude of gross capital flows
ratio to the GDP (GFR) as developed by Montiel (1994) but wi l l retain the values in
(hpitul it1/10~./ I /('upitul 0utflowl the continuous form. SinceGFIZ = , it measures FI
GI1 P
I ~xpil i i r t I 11n port1 (GFF) in a way similar to how 7 ' 0 0 =- - 1 measures trade degree of
(mJ L
openness.
3.3.1 Other Proxies:
C
Real Rate of Return on Investment i n the Nigerian Capital Market (RRR).
FPI is highly attracted to countries with high rate of return on investment. I t is
assumed that a high rate of return on capital market instruments is indicative of high
profitability level of the real sector economy, and ultimately mirrors a high level of
potential to grow the economy. This is in consonance with Passinetti's profit growth
model7. Chalapati e t al (2004) postulates a positive relationship between FPI and
increasing levels of return on portfolio investment.
3.3.2 Capital Market Deepening (FD), and Deepening of the External Sector of the
Nigerian Capital Market (IFD).
Total value traded of shares (TVT) i n a given nations stock exchange measures the
monetary value of the volume of shares bought and sold i n the capital market. If
this value (TVT) is divided by GDP or market capitalization80f the capital market,
6 We also rcfcr GFl. as financial openness. I Passinatti's model stipulates that there is only one equilibrium rate of profit which is determined by the
natural rate of' growth divided by the capital owner's propensity to save. For instance:
P -. X GIlPg,, . Whcre: is thc ratc of' profit that keeps the system on the dynamic path of
K s c K
fill1 employment, RGDPg,, is natural rate of growth; Sc is the capitalist's propensity to save.
In a given stock marltet, ~narkct capitalization refers to thc summation of thc product of all shares listed on the
1)epnrtnlent of Econonlics, lJniversi[y of Nigeria Nsukkn 38 of 108
kl Sc Dw wrtntron Glohtrlr.sed E'rr~trncrciljloi~~s, C'nprtni nzadtet deepenrng. ~ ~ n d E~ono~rz~c Growth 'Vrgerran Experrence
it indicates the level of liquidity of the capital market. Increasing level of liquidity
in a capital market has been referred to as capital market deepening. Other
measures of liquidity exist, like the ratio of market capitalization to the GDP
called size of the market. This study adopted the liquidity measure for capital
market deepening. This is because literature shows that FPI inflow is highly asso-
ciated with liquidity. The quantum of FPI inflow could be viewed as the portion of
TVT attributable to the activities of foreigners i n the capital market. FPI divided
by the GDP indicates the portion of liquidity of the capital market attributable to
the foreign portfolio inflow.
A new measure is proposed here, and that i s the ratio of FPI to the GDP. Since FPI
is the flow from foreign investors to the capital market and equal to the value of
shares purchased by foreigners, then FPI over the GDP measures the liquidity of
ESNCM related to the size of the economy. This measure is adopted here since it
fits into the purpose of our analysis. Hence IFD - - --- lf '1'1 7V'lV , while FD = - - -
Re a1 non GDP GDY
since we suspect that the capital market must increase in size to absorb the in-
flowing FPI. These are good indicators of financial development (financial deepen-
ing) that occurs through the capital market. Non oi l GDP is used here to specifi-
cally remove the influence of the oi l sector and particularly capture investment
activities in the non oi l s e ~ t o r . ~
3.4 Functional Model Specifications
Four equations wi l l be estimated using the Distributed Lag Models with Error
Correction. The first of the equations models the impact of g lobal i~at ion '~ on the
inflow of FPI into the Nigerian economy. This model wi l l have such explanatory
vatiiables as GFR, TDO, Real Interest Rate - RIR, and the Real Exchange Rate -
REXC, Institutional quality - IQ, Real rate of return on capital market investment -
RRR", and Investment -INV. Although Nigeria Sovereign Risk Premium is impli-
') A major t l ir~~st of government policy in Nigeria is to diversify its economic base and reduce over reliance on oil
revenue. 10 We use globalization to refer to all the forces emanating as a result of financial globalization and financial
integration in Nigeria. I I Kate of return on capital market invest~iients has been noted in literature as one of the main factors responsible for
FPI flows global .~ . .
Urpcrrinierii of l~corrorrtics. Uriiversiiy of Nigeria Nsukko 39 of 108

WSc D~~sertutron G'lnDcrli~ed Frnun~~nljlowr, C'ciprml nzurltet deepening, and Econonuc Growth N ~ g e r ~ n n Experrence - - - - - - --- - - - - - -
cated in literature as one of the factors contributing FPI flows across nations, it is
proxied here by the size of the foreign sovereign debtq2. The regressand is FPI.
The second equation models the financial deepening (IFD) of the external segment
of the Nigerian Capital Market (ESNCM) under the impact of globalised financial
flows (or financial liberalization). The model would have IFD as the regressand,
with regressors such as TDO, GFR, MCAP, Real GDP growth - RGDPg, RIR, REXC,
and IQ.
The third equation models the deepening of Nigerian Capital Market (NCM) under
the impact of globalised financial flows. The model would have FD as the regres-
sand, with regressors such as RGDPg, IFD, TDO, GFR, MCAP, IQ, and INV. The ra-
tionale for this equation is that it measures the whole range of the capital market
deepening in Nigeria even as the external segment deepens.
In the fourth equation, the impact on growth as a result of deepening i n ESNCM is
modeled. The regressand is the growth rate of the real Gross Domestic Product
(RGDP,). I t would have IFD, FD, GFR, FPI, IQ, Mcap, INV, and TDO, as regressors.
3.4.1 Modeling Impact of Globalization on FPI
The model is specified thus:
To eliminate chances of the value of the second moments being too high as to
endang'er numerical accuracy, we adjust (12) to get (1 3):

K K K K K (13)
Equation (13) holds i f and only i f : X , - I(O) and y = 1(0), otherwise
X I = ~ ( d ) and Y, = ~(d) , wherexiis a vector of the explanatory variables i n the
model, and d i s their order of integration. Let us assume that
X I - ~ ( d ) and I: = ~ ( d ) holds, then equation (10) would transform as shown
below:
order of stationarity of each variable.
3.4.1.1 Co Integration Equation
, , - z p % , , i s the linear combination of the co - integrated vectors, X I i s a vector of the co - integrated variables.
3.4.1.2 The Error Correction Model Equation
- Aecmis the error correction mechanism, - - - A i s the magnitude of error cor-
rected each period specified in i t ' s a priori form so as to restore 11,,,y to equi-
librium.

M Sc D i w r t u t ~ o n Globul~sed l. ~ n u n c ~ n l f l o ~ u , C u p ~ t d nzarkel deepening, and Econonlic Growrh Niger~an Exper~ence - - -- -. . . - 3.4.2 Modelinithe ~inancial-Deepening of ESNCM (IFD)
The specification of this model is:
To eliminate chances of the value of the second moments being too high as to
endanger numerical accuracy, we adjust (17) to get (19):
lin I1;D =
a,, + 2 i i n ( a l ~ ~ ~ ~ g , ~ l ) + ~ l i n ( a l , + l ~ ~ ~ , l ~ l ) + tlin(a7.11+ l~Dol ) 1 - 0 = ( I I - 0
K K K K K (19)
Equation (19) holds i f and only if: XI = I(O) and Y, = I(o), otherwise
X I = ~ ( d ) and Y, = ~ ( d ) , where X i i s a vector of the explanatory variables in the
model, while Y, i s the dependent variable, and d i s the order of integration. Let
us assume that X I = ~ ( d ) and Y, = ~ ( d ) holds, then equation (19) would trans-
form as shown below:
order of stationarity of each variable.
3.4.2.1 Co Integration Equation
I Where 77,i: x /i /, 1 i s the linear combination of the co - integrated vectors, X i s
. . .
Departntent c! f Econonzics, University of Nigeria Nsrrkkn 42 of 108

h%Sc Dissertation: Glob~ilised Financialjlows, Capital marker deepening, and Economic Growlhi Nigerian Experience . . ..... .- ........... ........-.. ......................... .
a vector of the co -- integrated variables.
3.4.2.2 The Error Correction Model Equation t
I'
.................................................................. 7 , = &, + 1 577,,1Z1 - i. ecm, , -1- V , I = I
(22)
A ccm i s the error correction mechanism, -- A i s the magnitude of error corrected
each period specified in i t ' s a priori form so as to restore ~jl,,,)l( to equilibrium.
3.4.3 Modeling Financial Deepening of NCM
The specification of this model is:
To avoid chances of the value of the second moments being too high as to endanger
numerical accuracy, we adjust (23) to get (24):
4
lin F'L) =
' I
FZ) - a,, + 2 l i n ( u , l ~ l ~ , ~ , ) + 2 lin(a,,+,GFR, ,- , ) + ~ l i n ( a , , , + , IICDPg, , ) / = I I - I) 1 - 0
Equation (24) holds if and only i f : X , - I ( O ) and 1; = I ( ( ) ) , otherwise
XI = l ( d ) and q = ~ ( d ) , where X I i s a vector of the explanatory variables in the
model, while Y, is the dependent variable(i.e. ti, = I;'ll,), and d i s the order of
integration. Let us assume that X , - I@) and = ~ ( d ) holds, then equation

M Sc Drsxrtatron CloOtrlrsed F ~nanoal f lows, ('aprtal marXet deepenrng, and Econonirc Growth Nrgrrcan Experience - - -. - - -A - - - . - - . -
(24) would transform as shown below:
--
I I Ill I
i s the order of stationarity of each variable. U,, i s the error term.
3.4.3.1 Co Integration Equation
The co integration equation i s given by:
II,,,~, - E c %, , i s the linear combination of the co - integrated vectors, 1 X i s a vector of the co - integrated variables.
3.4.3.2 The Error Correction Model Equation
1'
.. ................................................... qll1 Y, = , - 1 < Z - y ecm, , + U,, (27) /.-I
- yecrn i s the error correction mechanism, - y i s the magnitude of error cor-
rected each period specified in i t ' s a priori form so as to restore q,J to equi-
librium.
3.4.4 Modeling Impact of GFF on Growth rate
Using distributed lag model, with error correction, we model the impact on growth
rate of the deepening i n ESNCM and NCM. This wi l l be done in two steps. The first
step entails using IFD and other explanatory variables, while FD i s excluded. The
second step wi l l include al l the explanatory variables including both IFD and FD. This
wi l l enable the model capture the impact of IFD on growth as the stepwise approach
allows comparing changes i n the coefficient of IFD between when it features alone in
the growth regression equation and when it features with FD. This way, the impact of
globalised financial flows on economic growth wi l l be captured.
Depnrinzerzi of Ecmonzics, fJniversi<y of Nigeria Nsukkn

Rescaling for numerical accuracy, equation transforms to:
A0 -t ~ ~ ~ ~ ( A ~ G F R ( / ) + ~ l i n ( ~ / ~ + / T D 0 ~ ~ ~ ~ ~ ( A ~ ~ ~ + ~ I F D ~ ~ ~ ) 1 = 0 I 0 i 0
+ l i n ( ~ ~ ~ ~ P I ) + 2 i n + I ) - 2 i n ( , REXC, , ) + 1 = 0 1 - 0 I = 0
l i n ( ~ ~ ~ + ~ M ~ p ~ 1-1 l i n ( ~ ~ ~ + I Q ~ , ) t T l in (A , , , , ,INV1 V, i 0 1 - 0 1 - 0
On introducing FD, we get 30 below:
R G D P ~ - F( IKD, IT'D, GFR, DO. IQ,
We re'scale (30) get (31) below

The equation (29) and (30) equally hold i f and only i f : XI = I(0) and Y, - I(o),
otherwise X , = ~ ( d ) and Y, = lid), where XI i s a vector of the explanatory vari-
ables in the model, while i s the dependent variable(i.e. Y, - I;%, ), and d i s the
order of integration. Let us assume that = ~ ( d ) and Y, = lid) holds, then equa-
tions (29) would both transform to equation (30) respectively as shown below:
I,,~Y~ -= A,, + ~ ( A ~ I ~ ~ , ~ X , ) + c,, . X I . I ~ , = I ) A A A (32), where q,,, i s the I I Ill I
order of stationarity of each variable. And E,, is the error term.
3.4.4.1 Co Integration Equation
Following from (30), the co integration equation i s given by:
Where 1),11~ Zr % 1 i s the linear combination of the co integrated I vectors, X i s a vector of the co - integrated variables.
3.4.4.2 The Error Correction Model Equation
" 7
lI l = A,, t ~ ~ q , ~ ~ % ~ - y ecm, , t E;, ......................................................
1-1
(34)
-- qecm is the error correction mechanism, -- cpis the magnitude of error cor-
Depnrtment of t.:conon~ics, University of Nigerin Nsukka 46 of 108

M Sc Dl~scrtatwn Globalrvcd Fwzancral low^^, Ccy~rtal marliet deepen~ng, and E - - - " Nlgct-~nn Expertenue
rected-each period specified in it's a priori form so as to restore rliiiY; to equ-f-
librium.
3.5. Justification o f t he Model
Certain other econometric models are rivals to the Distributed Lag Model with error
correction chosen for this work. The major contending ones are the autoregressive
distributed lag model and the Vector Autoregressive (VAR) model.
The distributed lag model is one of the major work horses in dynamic single - equa-
tion regressions. In the path breaking work of Uwe Hassler and Jurgen Wolters (2005)
on distributed Lag Models (DL), it was shown that the estimation of a co integrating
vector from a DL specification i s equivalent to that from an Error Correction (EC)
model. The DL is a versatile and general model with much to recommend it. From it
we can draw inferences about dynamic behavior in rich detail. These pluses coupled
with the fact that it also performs the function of an ECM, make it preferred to VAR
for this work.
The VAR model performs extremely well i f all the variables are lagged to the same
length. This i s not expected of the variables of this study based on theoretical
expectations. Also because VAR's emphasis i s on forecasting, VAR models are less
suited for policy analysis (Gujarati, 2003) -.- one major aim of this study i s policy
analysis, to analyze i f the policy of allowing FPI into the country i s a pro growth
policy. This implies that the VAR i s not the best tool to use in this circumstance and
shows why Distributed Lag Models w i th Error Correction was chosen for this study.
3.6. Data Required and Sources I Software for Estimation.
Secondary data i s mainly used for this study. They are principally sourced from
Statittical Bulletin of Central Bank of Nigeria (CBN), Statistical Publications of The
National Bureau for Statistics (NBS). The data are Time Series data.
Estimation shall be with the PC-Give Econometric software. This has the capacity to
estimate al l the tests specified in the functional model specification.

M Sc Drssertnt~on Globalrsed Frncincrni flolcs C'rrprtal mnrltet deepenrng, and Econo~n~c Growth N~lgerran Expet lence .-
CHAPTER 4
ANALYSIS AND ESTIMATION OF RESULTS
4.1 Results of Econometric Tests
I t i s common knowledge that macroeconomic variables are usually non stationary and
co integrated and as such can lead to spurious regression. To avoid the so called
"Spurious" regression result, we therefore conduct a unit root test using the Aug-
mented Dickey-Filler (ADF) test.
The results are presented below:
4.1. I a Model 1 : Econometric Tests for Model 1
Table 4.1 : Model1 ADF Unit Root Test on the Quarterly Series
Variable / t-adf
DFPl
DLG FR 1 -11.9680""
DLSvRP
1% critical val
2.5920
2.59
2.5920
2.5920
The result shows that al l the variables achieved stationarity after first differencing;
therefore they are al l integrated of order 1. Consequently, we suspect that the
variables are co integrated and as such proceed to co integration test.
4. I. I b Co-Integration Test
To implement the Engle-Granger co-integration procedure, the linear combination of
all the explanatory variables i s estimated against the dependent variable (FPI) at
their levels form excluding the intercept term. Their residual i s obtained which i s
then subjected to co integration test as shown in Table 2.
-
Dqnrtnzent of Economics, l /niver~i!y of Nigerirr Ntukkrr

M Sc D I S S L ' I . ~ L I ~ I O ~ Globnl~sed Flnancral flows, Cap~tul nznrket deepenrng, and Ecorlomlc Growth Nigerlan Expermce - "- - -- - . -. - -- .-- - - - . .- -. . .. - - -
able 4.2: Results from Co-Integration Test on Model 1 . - . .. -- I t-adf 1 Lag / 5%Critical val l % ~ r i t i c a l val I I
/ Residual / -5.3013'" 1 0 / -1 .%I40
From the table, it i s seen that the residual t-adf exceeds the critical value at both 5%
and 1% taking lag lengths 1; this means that it is stationary and hence co integration
i s established, justifying the use of an Error Correction Model (ECM).
4.1.1 c Econometric Result for Model 1 (Results from Modeling FPI by ECM)
Table 4.3: Estimation Result Summary for Model 2

M.Sc Dissertution: Globnlised Finonciul,Jlows, Copital ntarket deepening, and Economic Growth: Nigerian Expi
47.535 41.212 1.153
/ DLSvRP
R' = 0.709293 F (30, 40) = 3.9852 [0.0000] 6 - 41.2375 DW = 2.01
RSS = 83326.23 27 variables, 80 observations
4.1.2a Model 2: Econometric Tests for Model 2 (Modeling Financial Deepening of
the ESNCM -1FD).
We first take the log of the variables and then execute the unite root test. The result
i s displayed in table 4. The essence of taking the log of the variables i s to remove any
problem of scale effects.
Table 4.4: Model 2 ADF Unit Root Test on the Quarterly Series - -. - - .-
Variable
DIFD
DRGDPg
DRl R
- - -
t-adf 1 I% critical val
. .. - . -. - .- . - .- . - .. . - . - -. -- . .
DLREXC
DLlQ
DLTDO
The variables al l achieved stationarity after first differencing; thus they are al l
integrated of order 1. Co integration test i s then carried out using the Engle-Granger
co-integration procedure. The result i s shown in table 5.

hlSc U i s ~ o r t n l ~ o ~ l C;lobal~red brnnnc~r//low.c, (hpltu/ nztwk~t dccpnrng trn - - - - th Nrgerrnn Expermce .. - -- - - -
Table 4.5: Results from CO-lntegration Test on Mo
Residual
t-adf Lag ( 5%Critical val I 1% crit ical val
The result i n table 5 shows that the residual t-adf exceeds the critical value at
both 5% and 1% on lag length 1. It is therefore stationary and hence co integrated.
This justifies the use of the Error Correction Model (ECM).
4.1.2b Results from Modeling DlFD by ECM
Table 4.6: Estimation Result Summary for Model 2
Variable
Constant
DLMcap
DLTDO 1
Coefficient I Std Error T-VAL
0.4620
3.1960
-1.3760
6 - 1.06366 RSS = 79.197 for 9 variables and 80 observations
.4.1.3a Model 3: Econometric Tests for Model 3 (Modeling Capital Market Deepen
ing (FD) i n Nigeria under Global Inflows).
We adjust for scale effects by taking the log of all the variables. The result is shown
in table 7.
- -
Deprrrtntent of Economics, Utzivcrsity o j Nigrricr Nsirkklr

A / / & D~.sscrtatron Globol~sed F ~ n a n ~ 1 u l j 7 o u ~ ~ , Cnprtnl nmrliet deepening, and Econunzlc Growth Nlgerran Experience - - ---- --- ..-- -- - - -- - -- -- - - - - - - able 4.7: Model 3 ADF Unit Root Test on the Quarterly Series
. -
t -adf 1% critical val -
I
1 DLREXC I I DLGFR - - 1 - - . ..- -- - 1 DLMcap
- --I 1 DLTDO
The variables are all stationary after the first difference; hence they are all inte-
grated of order 1, suggesting they might be co integrated. Co integration test i s
then carried out using the Engle-Granger co-integration procedure. The co inte-
gration result i s shown in table 8.
Table 4.8: Results from Co-Integration Test on Model 3
t-adf ~ a g j-5W ritical val 1 1% Critical val .-
desidual
Residual
Residual
The result in table 8 shows that the residual t-adf exceeds the critical value at both
5% and 1% on lag length 1. This implies stationarity which means that co integration i s
established, justifying the use of Error Correction Model (ECM).
... - ..
Drprrrtnrent of Ecanonrics, [iniversilj~ of Nigerin Nsirkkn

MSc /)i.sserta/ion: Globalisetl Fintrncialflows, (bp i~a l mnrke/ deepening, and Economic Growth: Nigerian Experience . ~ ~- -~ - - - .~ - ". " . ~ - ~ . . ~ ~. .
4.1.3b Results from Modeling FD by ECM
Table 4.9: Estimation Result Summary for Model 3.
Variable
Constant
DRlR
DLREXC 1
DLMcap
RSS = 2.59594 for 17 variables and 80 observations
T-VAL
0.746
3.112
4.936 .- .
5.804
1.885
2.493
.-
2.840
2.679
1.672
-1.681
-3.412
4.1.4a Model 4: Modeling Economic Growth within the context of GFF
I
We adjust for scale effects and subsequently conduct a unit root test. The re-
sult i s shown in table 10.
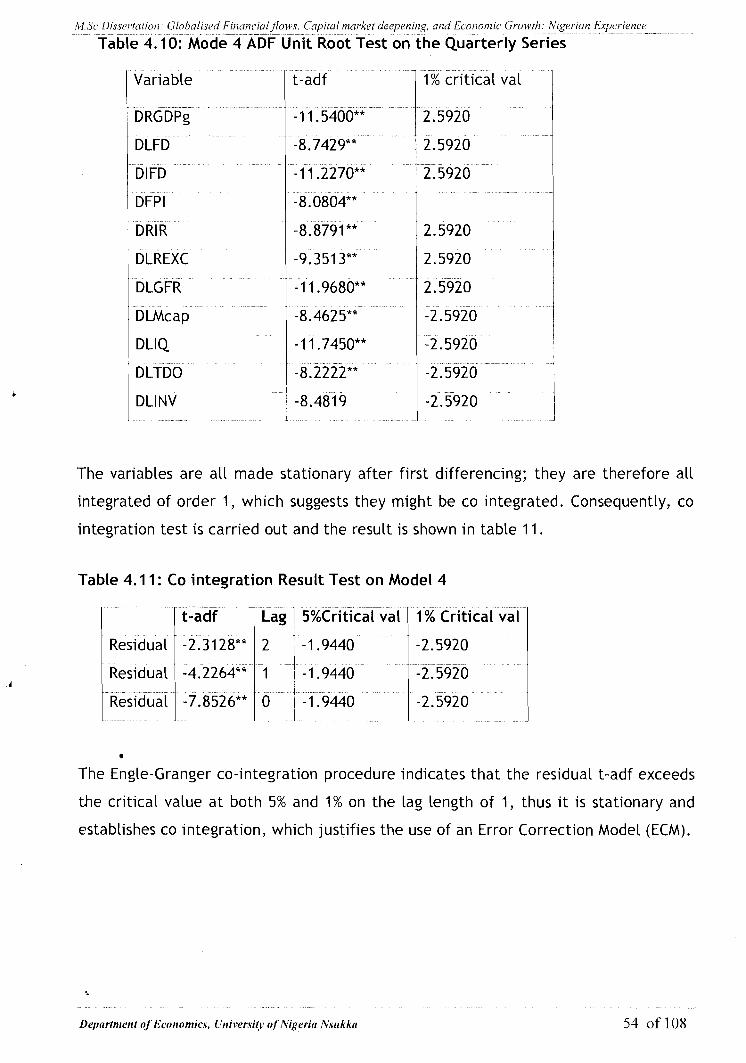
M S c L)~.c.rertcilron Gloht i l~~ed F~nancrtiljlows, Ccrprt~ll market deepenrilg, and Ctonomrc Growth Niger~an Exporrenw - .-. -. - - - - - -- - - .-
Table 4.10: Mode 4 ADF Unit Root Test on the Quarterly Series
t-adf 1% critical val
The variables are al l made stationary after first differencing; they are therefore al l
integrated of order 1, which suggests they might be co integrated. Consequently, co
integration test i s carried out and the result i s shown in table 11.
Table 4.11 : Co integration Result Test on Model 4
( t-adi - --- - ( Lag I S%Critical val ( 1% Critical val
1 Residual 1 -2.3128** 1 2 1 -1.9440 1 -2.5920
The Engle-Granger co-integration procedure indicates that the residual t-adf exceeds
the critical value at both 5% and 1% on the lag length of 1, thus it i s stationary and
establishes co integration, which justifies the use of an Error Correction Model (ECM).
Deprrrtnlerrt qf Econonzicv, University vf Nigerin Nsnkhn

4.1.4b Results from Modeling DRGDPg by ECM
Table 4.12 Estimation Result Summary for Model 4
Variable
Constant
DlFD 3
DFPl 1
DLREXC 3
DLGFR
DLGFR 3
DLTDO
DLTDO 3
ECM q
R~ = 0.547026 F (22, 57) = 3.1 289 [0.0003] DW - -
6 = 1.85767 RSS = 196.704246 for 23 variables and 80 observations
4.2 Interpretation of Results
From the result presented in model 1, the overall goodness of f i t of the model i s
plausible. This i s evident in the value of R~ which i s 0.709293 indicating that about
71% of the total variation of the behavior of the dependent variable (Foreign portfolio
investment) has been adequately explained by the explanatory variables. The
- -
Depnrtment of 1:cononzics. University of Nigerin Nwhkn 5 5 of 108

M Sc Di~ser~ation: G/oho/iSed Finoncialflo WS, C,'apita/~uzrket deepening ond Ecrn0nuc_Grow~~.; iZi~;rerian Experience -- observed value o f F-statistic shows that i t is significant, i.e. [0.0000] < 0.0500. The
significant nature of the F = statistic reaffirms the validity of the R'. The Durbin-
Watson value (DW) of 2.01 meets the strict requirement:
1.7 .<,OW< 2.2. As such it is significant. The P-values of the variables: Non oil RRR;
RIR; REXC; GFR; Mcap; TDO; IQ; IN; and SvRP al l fa l l outside the region -- 2.0 ( X ( 2.0
and thus are individually statistically significant in a l l or some of their lag lengths.
in n ~ ~ J e l 2, the R2 value of 0.593758 is quite good implying a significant
goodness of fit of the model. The implication is that about 59% of the total variation in the dependent variable (deepening of the ESNCM, IFD) is caused by the
set of the explanatory variables included in the model. The value of F-statistic is such
that [0.0000] <0.0500. This implies that it i s significant. The Durbin Watson value of
1-73 satisfies the criteria 1.7 snw s 2.2 for significance. The individual explanatory
variables of t h e model: RGDPg; RJR; REXC; GFR; TDO; and INV all do not satisfy the
maximum probability of accepting the null hypothesis, i.e. they fall outside the
region-2.0 ( X (2.0. This implies they are significant i n al l or some of their lag
lengths. However, Mcap is not statistically significant although it its coefficient
suggests it is of positive relationship with the inflow of FPI.
In model 3, the value of R~ is 0.680065 which is quite impressive implies a significant
overall goodness of fit of the model. The implication i s that about 68 % of the total
variation i n the dependent variable (capital market deepening-FD) is caused by the
set of the explanatory variables included in the model. The value of F-statistic i s such
that [0.0000] <0.0500. This implies that it i s significant. The Durbin Watson value of
2.20 satisfies the criteria 1.7 _ < L ) K T 1 2.2 for significance. The individual explanatory
variables of the model: IFD; RGDPg; RIR; REXC; GFR; Mcap; TDO; and INV all do not
satisfy the maximum probability of acceptin2 the null hypothesis, i.e. they fall
outside the region- 2.0 ( X (2.0 which implies they are significant in all or some of
their lag lengths.
R~ value in model 4 is 0.547026 which implies a statistically significant overall
goodness of f i t of the model. The implication i s that about 55 % of the total variation
in the dependent variable (economic growth-RGDPg) i s caused by the set of the
explanatory variables included in the model. The value of F-statistic i s such that
Depurtnzenf yf Econontics, liniversity of Nigerin Nsukho 56 of 108

M Sc lji.s.scrtutioi7. Glohcrlisecl Fit7cmc~inl,flow.s, ( 'npitnl mcrrkc.t deepening, crnd Econon~ic Growth: Nigerian Experience .. - . .- ... . --- . .. . ~ ., .. ~~ . ~. .. .... . . ... .. . . ... . . - -. - ~ - -- ... [0.0003]~~0.0500. The implication is that i t is significant. The Durbin Watson value of
2.20 satisfies the criteria 1.7 <I)W < 2.2 for significance. The individual explanatory
3 variables of the model: FD; IFD; FPI; RIR; REXC; GFR; Mcap; TDO; and INV all fall
outside the region of maximum probability of accepting the null hypothesis, i.e. they
fall outside the region -- 2.0 ( X ( 2.0 which implies they are significant in al l or some
of their lag lengths.
From the first regression on the relationship between foreign portfolio investment5,
and GFR, Non oil RGDP, Mcap, RIR, REXC, SvRP, TDO, and INV the result shows that
foreign portfolio investment is positively related to real rate of return on investments
in the capital market - RRR, Real interest rate, market capitalization, and Invest-
ment. On the other hand it is negatively related to real exchange rate, trade degree
of openness and institutional quality in Nigeria. According to the result, a unit
't increase in real rate of return wi l l cause FPI to increase by 2.8973 units, while a unit
increase in investment wi l l cause an increase of 2.447. Though foreign portfolio
investment displays a negative relation with TDO, as shown in model 1 result, it i s not
surprising since it conforms to similar work by Adenikinju, and Alaba (2005) on the
impact of trade liberalizationlglobalization on growth rate of the economy which
indicates that Nigeria is not yet ready for such policy. In a similar study, Prasad et
al., (2007) recently documented the phenomenon of "uphill" flows, under the
influence of globalization, of capital from non-industrial to industrial countries and
this might be the reason why trade openness is negative to FPI flow in Nigeria. The
volatile nature of our exchange rate does not facilitate inflow of FPI. GFR i s positive
implying it aids inflow of FPI. The positive sign of interest rate show that interest 4
rate is beginning to reflect the market rate and there i s no more financial repression
by the government. The negative relationship with the sovereign risk premium of the
countFy is expected since Nigeria belonged to highly indebted poor country (HIPC)
within the period under study. With the debt forgiveness granted to Nigeria, it is
expected that this negative relationship wi l l change in the future. The coefficient of
the ECM shows the long run relationship between the explanatory variables and the
dependent variable. It implies that at every interval, the inherent error owing to the
co integration nature is been corrected to the tune of about 59%.
' 1'0 get its proper impact we took the ratio of net foreign portfolio invest~nent to total value of shares t~aded in the

M S L Dmerlntion Gloh~~lircd Fznanc~aI/lows, ('~rpltal niarXe/ deepcw~ng, and E C O ~ O I ~ I C G~wwtIz N g e r i m Experwncc) - - ~ " " ---.- - -- - - - -
One remarkable feature in the second model, where the emphasis i s on defining the
relationship between IFD and financial globalization and financial integration, i s that A the degree of financial openness (GFR) i s positively related to financial deepening of
the ESNCM. This shows that the policy of financial globalization has impacted posi-
tively in the external segment of the Nigerian capital market. I t i s important to also
note that the growth rate of the real GDP is also positively related to IFD. This i s
somehow expected since the relationship between finance and growth i s bi-
directional. Also market capitalization i s positively related to IFD to such an extent
that a unit increase in market capitalization causes IFD to improve by 3.0050 units.
Institutional quality i s rightly signed by i s not statistically significant. The coefficient
of the ECM shows the long run relationship between the explanatory variables and the
dependent variable. I t implies that at every interval, the inherent error owing to the
co integration nature i s been corrected to the tune of about 75 %. \
In model 3, the emphasis i s on finding out the relationship between capital market
deepening, and financial deepening of the external segment of the Nigerian capital
market (IFD). It i s interesting to note that IFD i s positively related to FD. This shows
that a unit increase in IFD causes FD to increase by 3.112 units. Also a unit change in
the exchange rate causes a positive increase of 0.21457 units i n capital market
deepening. Real interest rate i s positively related to capital market deepening but it
i s not statistically significant. The positive sign of interest rate show that interest
rate i s beginning to reflect the market rate and there i s no more financial repression
by the government. An increase in market capitalization by a unit brings about a
positive change in capital market deepening by 82%. The negative sign of the invest-
A ment variable is not a surprise since capital market deepening i s proxied by i t s
liquidity index. The fact that investment draws liquidity off the capital market means
that increases i n investment funded by funds from the capital market depresses
capita( market liquidity. The coefficient of the ECM shows the long run relationship
between the explanatory variables and the dependent variable. I t implies that at
every interval, the inherent error owing to the co integration nature i s been cor-
rected to the tune of about 55%.
The fourth model focuses on the relationship between economic growth, capital
market deepening, foreign portfolio investment, and globalization. Interestingly,
economic growth proxied by the growth rate of real GDP has a positive and statisti-
cally significant relationship with capital market deepening, financial deepening of
L)q(~rtnwtit of Icononi io , Urriversity of' Nigeria Nsukkrt 5 8 of 108

M S c Dissertntion: C'loh~rlised Finnncitrl,flows, (iipitol n~arliet deepening, and Economic Growth: Nigerian Experience . -. ... ... -... .~. .- ... ..~ . .- - ~~ - .- .~ ~- ~~- -.
the ESNCM, gross capital flow (GFR) - used to proxy financial integration and global-
ization. The result shows that a unit increase in foreign private investment (FPI) wi l l 3 lead to 0.00713 units increase in the real GDP growth of the economy. Also a unit
increase in capital market deepening wi l l bring about 2.92 units increase in real GDP
growth rate, while a unit increase in financial deepening of the (IFD) of the external
segment of the Nigerian capital market brings about an increase of 0.13 units in the
growth rate of real GDP. This finding agrees with the earlier finding in the first
model which shows that foreign portfolio investment has a positive relationship with
capital market development i n Nigeria which i n turn affects growth. Though it i s
theoretically known that FPI has a direct relationship with growth, the expected
transmission mechanism of foreign portfolio investment to the economy (IFD and
capital market deepening - FD) met a priori expectation. For instance IFD has positive
relationship with growth although it i s not statistically significant. The relationship P
between growth and FD i s robust positive and significant. One fact that has emerged
from this study i s that GFF i s positively related to economic growth in Nigeria; and
this relationship i s transmitted through capital market deepening. I t now remains
to verify the direction of causality flow, and this i s done by Granger causality tests in
the next section.
4.3 Granger Causality Tests
The results of the granger causality tests are presented below:
TABLE 4.3.1 Direction of Causality between FPI and Financial Globalization
(proxied by GFR) -- - --- - - -. . .. - - - -- . -- - - -- - - - --. . - - -. - -- -
P - Significance Null Hypothesis 1 I ' - " ~ ~ - I
value 1 Pmb. value
/ I T 1 docs not granger causc G F R 1 3.7329 / 0.5321 1 0.0500 1- *ccspt -
The result above shows that the P-value of 0.3871in the first null hypothesis i s
greater than the significance probability value of 0.0500. Our decision rule would be
to accept the null hypothesis since the P-value falls within the acceptance region. We
therefore say that financial globalization and integration does not granger cause
inflow of FPI. In the second hypothesis, we also accept the null hypothesis and say k that capital FPI does not granger cause financial globalization and integration. This
= finding implies that increases in financial globalization and integration are not the -
Depnrtntenl of Econonticr, Univertitj~ of Nigericr Ntcikhn 59 of 108
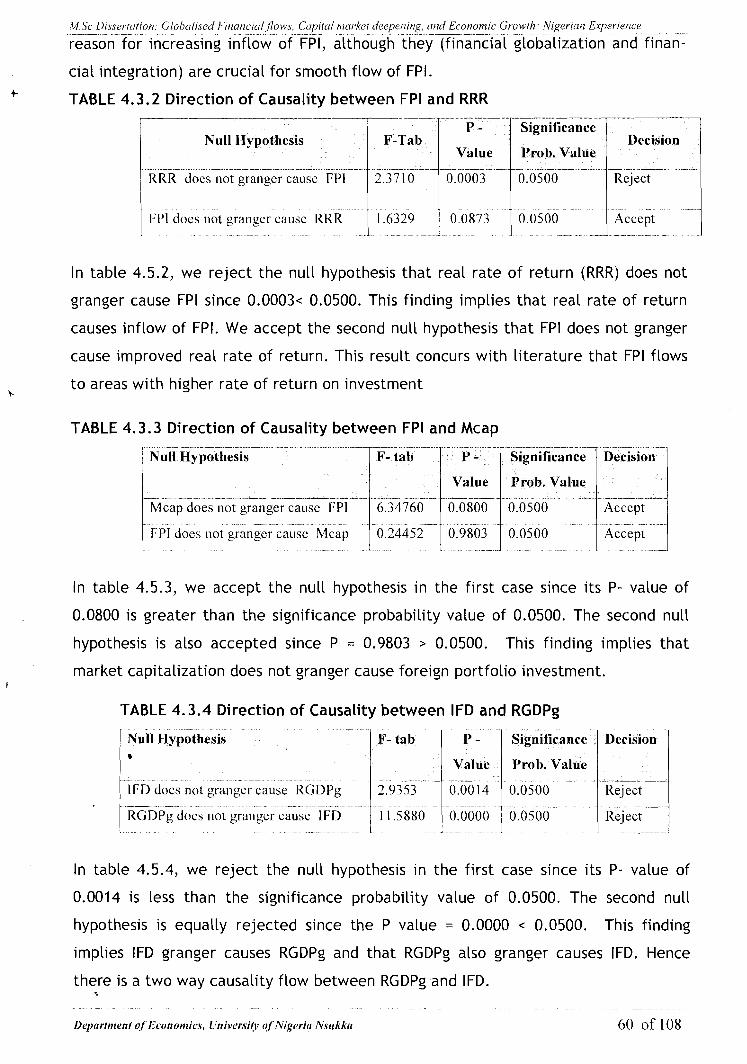
M Sc I~rssert~rtrow Globalised Frnancr~rl flows, Ccrprtul wznrket deepewrwp, and Economrc Growrh Nigerlnn Experrewce - . - ---- "- --.- - reason for increasing inflow of FPI, although they (financial globalization and finan-
cial integration) are crucial for smooth flow of FPI. + TABLE 4.3.2 Direction of Causality between FPI and RRR
In table 4.5.2, we reject the null hypothesis that real rate of return (RRR) does not
Null Hypothesis
- - . -- - -- - - -- - - . . . I<RR does not granger cause FPl
granger cause FPI since 0.0003< 0.0500. This finding implies that real rate of return
causes inflow of FPI. We accept the second null hypothesis that FPI does not granger
F-Tab
- - -- -. -. -. 2.371 0
cause improved real rate of return. This result concurs with literature that FPI flows
\ to areas with higher rate of return on investment
Significance
V:Iie 1 Prob. Value - - - -. - - --- - .- . - .. - 0.0003 0.0500
TABLE 4.3.3 Direction of Causality between FPI and Mcap
Decision
- .- - - -. -- Reject
-- --.. - --- - - - - -- - -- / Null Hypothesis Significance ~&&on
Value Prob. Value - - -- --- -
Accept
In table 4.5.3, we accept the null hypothesis in the first case since i t s P- value of
0.0800 i s greater than the significance probability value of 0.0500. The second null
hypothesis is also accepted since P = 0.9803 > 0.0500. This finding implies that
market capitalization does not granger cause foreign portfolio investment. I
TABLE 4.3.4 Direction of Causality between IFD and RGDPg
Null Ilypothesis * - . -- -. - . . . . - - - IFD does not granger cause RGDPg -- - RGDPg IFD
In table 4.5.4, we reject the null hypothesis in the first case since i t s P - value of
0.0014 is less than the significance probability value of 0.0500. The second null
hypothesis is equally rejected since the P value = 0.0000 < 0.0500. This finding
implies IFD granger causes RGDPg and that RGDPg also granger causes IFD. Hence
there is a two way causality flow between RGDPg and IFD.

1 IlGDPg dbcs not granL1- 'LI calls 1
. - -- . -. Null 11~~othes i s
HI does not granger cause RGDP~
In table 4.5.5, we reject the null hypothesis in both cases since their P- values of
0.0008 and 0.0039 respectively are both less than the significance probability value of
0.0500. This finding implies FD granger causes RGDPg and that RGDPg also granger
causes FD. Hence there i s a two way causality flow between RGDPg and FD.
TABLE 4.3.6 Direction of Causality between IFD and Mcap
I?- tab
3.1223
I I 1 1
In table 4.5.6, we accept the null hypothesis in the first case since i t s P- value of
0.8102 i s greater than the significance probability value of 0.0500. The second null
hypothesis i s rejected since the P value = 0.0319 < 0.0500. This finding implies Mcap
granger causes IFD. Hence changes i n the market capitalization of the capital market
bring about changes in the deepening of the external segment of the capital market.
TABLE 4.3.7 Direction of Causality between FD and IFD
P - -
Value .- - - - "
- - -
P - Significance ~ e c i s i o n
Value Yrob. Value
78 0.0033 0.b500 - Reject
In table 4.5.7, we reject the null hypothesis in the first case since i t s P- value of
0.0033 i s less than the significance probability value of 0.0500. The second null
hypothesis i s accepted since the P value = 0.40134 < 0.0500. This finding implies IFD
signiiiEiice
Prob. Value
granger causes FD. Hence changes in the financial deepening of the external segment
Decision
--
of the capital market bring about changes in capital market deepening of the capital
market.
Reject 0.0008
. . . . - - . -
1)epirrtmertt of'Eco/~ornics, llrtiversity of Nigeria Nsrrkkir 61 01'108
0.0500

n/l Sc Drwertntlon GloDd~sed finuncrd jlows, Chp~tal/nnr/tet deepenrng, uund Econo~nlc Gro~t th Nlgc~rlun Experrencc - - -- " - - -. . . . -. - - - -- - -
4.4 Other ~conomet ric Tests
Multicollinearity Tests: Tests for multicollinearity were conducted for the
models. The results showed that the correlation coefficients were low, con-
firming the absence of a significant level of multicollinearity. In fact the Barry
and Feldman (1985) criteria of X , _< 0.80on multicollinearity was met.
Normality Test for Residuals: The results of this test for the models revealed
that the Chi - Square normality Test for models' data showed that the error
term distribution is significant at 5 and 1 % levels
Heteroscedasticity Tests: Results from tests showed that Heteroscedasticity
error tests and the functional form tests are significant at 5 % and 1 % levels
(see appendix B)
Error autocorrelation Tests: Results show that over lag 1 to 3, Chi - Square
and F - Form measures are significant at 5 % level only.
1)epnrftrlent of Bcononlic.s, University vf Nigerin Nsukktr
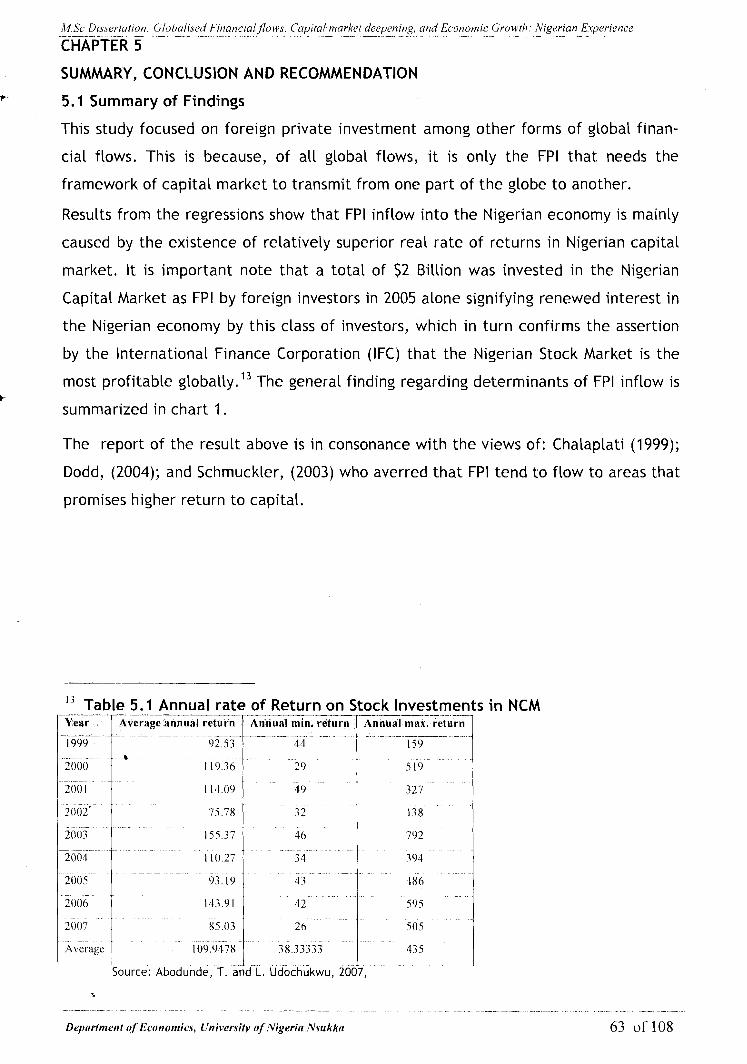
A4,Sc Dissertcition. Globulised Financia1,flows. Ccipitalmurltet deepening, and Economic Growth: Nigerian E.~perience ................. ....................... ... .......... ..... . . . . . . . . . . . . . . . . .......
CHAPTER 5 SUMMARY, CONCLUSION AND RECOMMENDATION
$- 5. I Summary of Findings
This study focused on foreign private investment among other forms of global finan-
cial flows. This i s because, of all global flows, it i s only the FPI that needs the
framework of capital market to transmit from one part of the globe to another.
Results from the regressions show that FPI inflow into the Nigerian economy is mainly
caused by the existence of relatively superior real rate of returns in Nigerian capital
market. I t i s important note that a total of $2 Billion was invested in the Nigerian
Capital Market as FPI by foreign investors in 2005 alone signifying renewed interest in
the Nigerian economy by this class of investors, which in turn confirms the assertion
by the International Finance Corporation (IFC) that the Nigerian Stock Market i s the
most profitable globally.I3 The general finding regarding determinants of FPI inflow i s b
summarized in chart 1.
The report of the result above i s in consonance with the views of: Chalaplati (1999);
Dodd, (2004); and Schmuckler, (2003) who averred that FPI tend to flow to areas that
promises higher return to capital.
l 3 Table 5.1 Annual rate of Return on Stock Investments in NCM -- . - Average annual return 1
Source: Abodunde, T. and
- . --- - Annual min. return
I L. Udochukwu, 20
- - . Annual max. returr
Deprtnzent of l:'conon~ics, University of Nigerin Nsrrkiio 63 of 108

ALSc Il i .r.se~~lc~tion: G1ohtrlisc:d l- ' i~ia~icial/ low,s, ( 'n [~ i ln l ~rirrrkel dwpctl ing, and Ec,onomic Growth: Niyerinn Ekpericnce . . . . . " ..... . .... ""." ...... ~
Chart 5.1 : Determinants of FPI inflow in Nigeria
Financial openness (GFR)
Institutional Quality (IQ)
Market capitalization, sovereign risk premium (proxied by size of sovereign foreign
debt), real exchange rate, and level of institutional quality have rather impeded
inflow of FPI than facilitated it. On the other hand: investment (INV); real interest
rate (RIR); and level of financial openness (GFR) have facilitated inflow of FPI, while
trade openness does not matter. We therefore conclude that globalization has aided
(facilitated) the inflow of FPI into Nigeria. Financial globalization i s not the root b
cause of FPI inflow, but it facilitates it.
With the inflow of FPI, there i s financial deepening of the external segment of the
Nigerian capital market (IFD). This deepening of the external segment of i s facilitated
by the forces of financial globalization and integration. Also, institutional quality and
market capitalization aid deepening of the ESNCM, while effects of trade degree of
openness and interest rates are not significant. Exchange rate effects have been
negative on the deepening of the external segment of the capital market. See chart

A/[,& Disserfntiun: Globnlised Firmncialjlows. Copilnl mnrltet decpcning, aizd Econonlic Growth: Nigerian Experience .- ~. ... - - - -...--..------.-p-.-....
Chart 5.2: Effects of factor changes on financial deepening of ESNCM
The deepening of the international segment of the Nigerian capital market (IFD) and
growth rate of real GDP cause deepening of the capital market. Financial openness,
market capitalization, and real interest rate facilitate financial sector development.
On the other hand, the level of institutional quality impedes the deepening of the
capital market for the period studied. Other variables like: trade degree of open-
ness; investment and; real exchange rate are statistically not significant and hence
could be ignored.

M S c Disserfafion: Globalised Financic~I,flows, Capital nmrlcet deepening, and Econonzic Growth: hligcrian Experience - . .. - . ... - --
Chart 5.3: Effects of factor changes on capital market deepening.
Trade openness 0:) I I Size (Mcap)
Real Exchange rate P C )
Institutional Quality OQ) I Financial openness (GFl2)
The findings of this study support finance growth nexus. Increases in financial
deepening of the international segment of the capital market, and capital market
deepening cause the growth rate of the real GDP to increase. However foreign
portfolio investment, market size, investment, financial openness, institutional
quality, and trade degree of openness facilitate increases in the growth rate of the
real GDP. The level of institutional quality i s not facilitating real GDP growth; in fact
it has a negligible impact. Real exchange rate equally has negligible influence on the
GDP growth rate. See chart 4.

M.Sc L)isserrrrrion: Glohalised Finnncitrl~flows, ('crpital t l ~ r l i e f deepening, and Econolnic Growth: Nigerian Experience .. . .. . .. - .. .. -. . " . . . . .. .... . ~ ..-. -. ... - . . . . .- --. .- .
Chart 5.4: Effects of factor changes on the growth rate of real GDP.
s u e (map)
Real Exchange rate (REXC)
Financial openness (GFR) I
Trade openness 0 0 )
5.2 Conclusion I
There i s remarkable flow of foreign portfolio investment in Nigeria, in the past few
years, and that has stimulated an intense debate about i t s impact on financial sector
development (capital market development and economic growth. While proponents
emphasize the positive impacts of such flows on growth and financial sector devel-
opment (capital market development), critics express concern about i t s volatile
nature which can result in crisis and contagion. This study observes that there has
been remarkable improvement in our financial sector as well as increase in the rate
of economic growth and wondered i f foreign portfolio investment inflow within the
context of globalization have been responsible for these positive developments.
Results reveal of this study that FPI i s specifically attracted by superior rates of
return. However, the existence of superior rate of return alone i s not sufficient to
. .
Depcrrtnwwl of' Econoniics, U~riversit.y of Nigerin Nsukkn 67 of 108

M Sc Dl.\serlrrtlon Glolml~red F ~ n a n ~ ~ a l jlows, Cnp~tal m u i d ~ t deepenmg, nisd E~ono~nrc Growth ,Ylgerrnn I<xperrence - - . - - . - .. - -
trigger sustained inflow. other factors--like degree of financial openness (financial
globalization and integration); size of the capital market; low level of sovereign risk + premium; and sound macroeconomic fundamentals (stable interest, and exchange
rates) are critical i n facilitating the inflow. The inflow of FPI causes the financial
deepening of both the foreign and domestic segments of the capital through quantity
and quality effects. The deepening of the capital market14 then causes economic
growth.
To sustain economic growth, efforts should be made to ensure continuing profitability
of the economy, as this would encourage more investment by business units. To raise
more funds for investment, more equity stocks are issued by the business units which
ultimately raise market capitalization and market size of the capital market which all
leads to capital market deepening.
\ Increases in investment opportunities like that obtained during init ial public offers
(lp0s)15 in a profitable and growth sustained economies facilitate surges i n FPI inflow.
FPI inflows when it flows through the secondary market raises capital market liquidity
and market capitalization through increases i n asset prices, on the other hand i f it
flows through the primary market raises market capitalization and hence market size.
Both size and liquidity increases improve capital market development positively.
Thus, there i s a two way causality link between economic growth and capital market
deepening and generally finance. See chart 5. So the results of this study i s in line
with the finance growth - nexus earlier pointed out by Hamilton, Bagehot, and
Schumpeter Levine (1 997), Oks (2001 ), and Ndebbio, (2004).
' I Capital market deepening is an aspect of financial sector development. +
15 In growing economies these opportunities rnostly are at the behest government privatization programs and
E r i ~ r y market a
Dep(rr1nteril of' Econoniics, llriivrrsity of' Nigrrin Nsctkkn 68 of 108

IISc l)~c.\ertatrovr C;loh~rlr.\ed F I M N I I C I L I / / ~ O W I CCII)I~CI/ n~nrltet deepenmg, uvrd Ecovronlrc Growth Ngerlun Experretrce - - -. - -- - - -
chart 5: Global Financial Flows - channels and Their Consequences
On the whole the current wave of globalization has facilitated an increase in inflow
of FPI into Nigeria. The increased inflow of FPI has contributed to financial deepening
of the external segment of the Nigerian capital market which in turn has contributed
in granger causing capital market deepening of the Nigeria capital market. Capital
market deepening granger causes economic growth i n Nigeria which also granger
causes further capital market deepening. Thus the ensuing circular flow between
capital market deepening and economic growth reinforces each other. This means
that capital market deepening in Nigeria and economic growth lead each other. This
finding conforms to the two way direction causality flows between finance and 4
growth as canvassed by King and Levine (1993), and De Gregorio (1998).
We therefore conclude that GFF (of the FPI type) inflow has increased within the
period under review; this has facilitated the deepening of the capital market which
brought about economic growth.
5.3 Recommendations
A tal l challenge for Nigeria's policy makers in managing capital inflows i s to take
advantage of FPI inflows while minimizing the risks that go it. To meet this challenge,
it i s recommended that policy makers should concern themselves with the following:
1. Strengthening micro economic polices. Policies should be crafted to con-
Drpnrtnzent of Economics, IJtiiverti[y of Nigericr Nsakk(r 69 of 108

M Sc D~ssertrrt~on Gloha/r.sed Flnnnclnl flows, C'uprtol117urXet deepening, und Econonzl~ Growth Nrgermn Erperlence - - - ---- - --- -- - - --- - . . . - . - - .-- - - - - . - - - - - - - - - . - -
solidate gains in microeconomic stability and, i n particular, achieve a ~ u s -
tainable fiscal and monetary policies which are critical to limiting potential
crisis and contagion associated with inflows.
2. Enhancing mechanisms to monitor capital inflows and keep track of out-
flows. Presently, Nigeria does not have ful l information on capital inflows
and outflows. In fact Nigeria should, as a matter of urgency, deploy re-
sources towards gathering reliable and accurate information which would
facilitate development of comprehensive strategies to manage investment
inflows.
3. Financial institutions should hold less market risk so as to be more stable
and less apt to trigger capital flight and contagion to other countries. Col-
lateral requirements, such as those for buying securities on the margin, wi l l
dampen speculative pressures on asset prices. Essentially, this wi l l assist in
preventing systemic failures in markets for derivatives, repurchase agree-
ments and securities lending.
4. Strengthening the supervision of the financial sector. This wi l l help in mit i-
gating the swings i n interest and exchange rates. The regulatory authorities
should monitor the balance sheets of financial institutions
5. Reporting and registration requirements should be improved and strength-
ened not only to help prevent financial fraud but also make markets more
transparent and thereby improve market efficiency in determining prices.
Furthermore, it allows investors and policy makers to detect imbalances in
the economy before they degenerate to crisis proportion.
6. Orderly market Rules should be made and enforced, this is because orderly
b market rules help maintain liquidity and prevent destabilizing market
events. Orderly market rules are inclusive of: requirements on dealers to
maintain bid and ask quotes at all times on a trading day; price limits for
derivatives exchanges; fair credit reporting rules; prohi bitions against
predatory lending and deposit insurance.
7. Strengthening of, and sustaining the current bank consolidation policy,
since it i s known that banking crises can trigger and transmit crisis.
8. The latitude to use capital control measures should be availed to policy
makers. This is in case it so happens that prudential regulations prove inef-
Depnrtnwrrt of Lconomics, University of Nigerin Nwkkn 70 of 108

h.1 Sc Drssertailon G/o/~allsed F~nnntr~rI jlmi s. Cuprtd nz~rrltet deepenrng, and Econolnrc Growth h'igerlan Exper~encc
fective in containing capital surges and excessive risk taking, or where they
fai l to protect the stability of financial system against external shocks, then
strict capital control measures could be used.
9. Since markets work best under competition policy makers must be prepared
to use anti trust laws to prevent forces such as mergers and acquisition
from resulting in industry concentration.
10.There i s also the need for policy makers to shape foreign investment so that
it wil l be best suited for domestic development.

Abiad, A,, Qomes, N., and Ueda, K., 2004, The Quality Effect: Does Financial r
liberalization Improve the Allocation of Capital? lnternational Monetary Fund,
IMF Working Paper, WPl041112. PP. 1 - 7.
Abodunde, T. and L. Udochukwu, 2007, Your Best Way to Riches: How to make Big
Money, From Nigerian stocks, Leadstones lnvestment & Trust Ltd, 24 to 30
Adenikinju, A.F. and Q.B. Alaba (2005), "EU-ACP Economic Partnership
Agreements: Implications for Trade and Development in West Africa" Being
Draft Paper Presented at the Silver Jubilee Meeting of WIDER-UNU, Helsinki
Finland, June 2005.
Agarwal, R.N. Financial Integration and Capital Markets in Developing Countries: A
study of growth, volatility and efficiency in the Indian capital market. F
http: /lideas.repec.org/p/ind/iegddpl21. html. pp. 1
Aigbekaen, E.K, 2007, "An overview of Laws and Ethics in the Primary Segment of
the Nigeria Capital Market" in Law & lnvestment Journal, Vol. I No. 1. PP158-9.
Ardic, Qya Pinar and Damar, H. Evren, 2006, Financial Sector Deepening and
Economic Growth: Evidence from Turkey, Bogazici University, Department of
Economics, Babek 34342, Istanbul, Turkey. Pp. 2.
Ayhan Kose, M., Prasad, E., Rogoff, K., and Wei, S., 2003, Effects of Financial
Globalization on Developing Countries: Some Empirical Evidence. lnternational
Monetary Fund, March 17 2003, pp. I - 15.
1 Aysit, T and Nil - Demet, G, 1997, Economic growth and convergence: An applica-
tion to the provinces of Turkey, 1975 - 1995. First Annual ERCIMETU conference
on Economics in Ankara, Working Paper 9908. pp. 1 - 6.
Bandiera, Q., Caprio, G., Hanohan, P., and Schiantarelli, F., 2001, Does Financial
Reform Raise or Reduce Saving?, Review of Economics and Statistics, Vol. 82. No.
2 (May), PP. 239 - 63.; Sage Publications)
Barry, W. and S. Feldman, 1985, Multiple Regression in Practice (Beverly Hills
Baye, M.R. and Jansen, W. Dennis: Money, Banking, and Financial Markets; An
Economics Approach, A. I.T. B.S. Publishers & Distributors (Regd) Krishan Nagar,
7, Delhi. PP. 586 - 622.

A// Sc Dlswrttrt~on Glohrrlired b-rnnncrd JIOMJJ, C'aplt~11 nl~~rltet deepening ~ l n d Economr~ Growh ,'1'1gerlan Experience - - -
Beck, T., Levine, R., and Loayza, N., 2000, Finance and the sources-of Growth,
Journal of Financial Economics, 58 (October), PP. 261 - 300.
+ Bencivenga, V and B, Smith, 1991, "Financial Intermediation and Endogenous
Growth," Review of Economic Studies. Vol. 58. PP. 195 - 209.
Butkiewicz, J.L., and Yanikkaya, H., (2003) Capital account openness, international
trade, and economic growth: a cross-country empirical investigation. University
of Delaware, Department of Economics in its series Working Papers with number
03-06. pp. 1.
Calvo, G. and Reinhart, C., 1999, The consequences and Management of Capital
Inflows: Lessons from Sub Saharan Africa. Expert Group in Development Issues
(EGDI), 1998. pp. 7.
CBN,2000, CBN Briefs, Special Edition, Series Nos. 2000101 - 10, Research Depart- lr
ment. PP. 1 7.
Chalapati Rao K.S., 1999, Foreign Institutional Investments and the Indian Stock
Markets, Reprinted from Journal of Indian School of Political Economy, Vol. XI,
No. 4, October - December, Institute for Studies in Industrial Development. PP.
623 - 27.
Crockett, A., 2000, "How Should Financial Market Regulators Respond to the New
Challenges of Global Economic Integration?, Paper Presented at the Federal Re-
serve Bank of Kansas City conference - Global Economic Integration: Opportuni-
ties and Challenges - Jackson Hole Wyoming, August.
4 De Gregorio, J. and P.E. Guidotti, 1995, Financial Development and Economic
Growth, World Development, Vol.23, No.3, PP.432 - 449
De Gregorio, J., 1998, Financial Integration, Financial Development and Economic
Growth, Centre for Applied Economics, Department of lndustrial Engineering
Universidad de Chile. PP. 1 -32.
Devereux, M.B., and Smith, G.W., lnternational Risk Sharing and Economic Growth.
lnternational Economic Review. Vol. 53, No. 2, PP. 363 - 84.
Diwivedi, D., 2006, Macroeconomics, Tata McGrraw - Hill Publishing Company Ltd.
Pp. 432 - 453.
I Dodd, R., 2004, Managing the Economic Impact from Foreign Capital Flows, Informal -, Hearings of Civil Society on Financing for Development (UN Headquarters, Con-
- -
Depnrfntent of Econonlics. University of' Nigericr R'sukkn 73 of 108

MSc Drssertut~on Global~sed F~nnn~lu l j lous , C'a,ui~al nzuthet derpmmng, and Econonztc Growth Nlgerrun Experience -- - - - - - -- -- -- -- - - .- - - -- - --- - --- -
ference Room 3, 22 March 2004) Discussion Paper prepared on the inirti%tive of
the Friedrich Ebert Foundation and the Washington-based New Rules for Global
Finance Coalition, PP. 1 6
Easterly, W.R. and 5. Rebelo, 1993, Fiscal policy and economic growth: An empirical
investigation, Journal of monetary economics.
Elbadawi, LA., and B. Ndulu, 1994, Long - Term Development and Sustainable
Growth in Sub Saharan Africa, Mimeo, African Economic Research Consortium
(AERC)
Feldstein, M., and C. Horioka, 1980 (June), "Domestic savings and international
capital flows", Economic Journal, no. 90, PP. 314-329.
Fitch Ratings, 2002, "Fitch Sovereign Ratings" Rating Methodology, Fitch inc. and
Fitch Rating Ltd, One State Street Plaza, NY, NY 1004. PP. 1 - 15.
French, K., and J. Poterba, 1991, "Investor diversification and international equity
markets", American Economic Review, no. 81, p.222-226,
Goldsmith, R., 1969, Financial Structure and Development, New Haven, Yale
University Press
Goyal, S.K., 1982; 'The New lnternational Economic Order and Transnational
Corporations', paper presented in the seminar, The New International Economic
Order: Problems and Perspectives, New Delhi, 16-20, December. Pp. 843 - 50.
Gudjarati, D.N., 2003, Basic Econometrics 4th Edition. Tata McGrraw - Hill Publishing
Company Ltd. Pp. 852 853.
Hakkio, Craig S., 1995: The U.S. Current Account The Other Deficit. Federal
Reserve Bank of Kansas City, Economic Review, Third Quarter 1995 , pp. 4.
Halac, M., .Schmuckler, S.L., and Zoido, P., Financial globalization, crisis, and
contagion, World Bank Policy Research Report - World Bank Managing Volatility
Group Global~zation, Growth, and Poverty," available at
http: /worldbank.org/ research/ bios/schmuckler. PP. 1 - 24.
Hasan, I. , and Y. Simaan, 2000, "A rational explanation for home country bias",
Journal of lnternational Money and Fmance, no. 19, p.331-361.
Hassler, U. and J. Wolters, Autoregressive Distributed Lag Models and Coi ntegration,
Allgemeines Statistisches Archiv 0, 0 - 15, http: 1 /www.wiwiunil
Dejmrtntenf o f I:corronric\, I/niver\ify c!f Nrgerirr VsrrkA(r 74 of 108

AlSc D~ssei.tntlotr Globtrl~red k inat~crcrl flows ('cllnttrl 17x~ltct deepet~zng, ond Econnrnrc Growth brger~on Expel-~cnce - - -.- - - - - -- - - - .--- -
frankfurt.de/uhassler/ha-wo-revision lni'ormation," American Economic Review,
71, pp. 393-410.
Issing, O., 2000, The Globalization of the Financial Markets, European Central Bank,
Directorate Communications, Press and Information Division Kaiserstrasse 29, D -
60311 Frankfurt, http://www.ecb.int
Jayaratne, J., Strahan, P.E., 1996, The Finance - Growth Nexus: Evidence from
Bank Branch Deregulation, Quarterly Journal of Economics, Vol. 111, No. 3, PP.
639 - 70.
King, R.G. and R. Levine, 1994, Finance and Growth: Schumpeter might be right,
Quarterly Journal of Economics. Vol. 108(3) Pp. 717 .. 38
Levine R., 2000, lnternational Financial Liberalization and Economic Growth Review
of lnternational Economics 9 (4), 688-702. doi: 10.1 1 1 1 / 1467-9396.00307. PP.
688 - 702.
Levine, R. and S. Zervous, 1996, Stock Market Development and long - run growth.
The World Economic Review.
Levine, R., 1997, Financial Development and Economic Growth: Views and agenda,
Journal of Economic Literature, Vol.XXXV (June 1997), PP. 688 - 697
Love, I . , 2001, Financial Developments and Financing Constraints: lnternational
Evidence from the Structural Investment Model, World Bank (Washington: World
Bank) .
Mailafia, O., 2005, Highlight of Proceedings. Central Bank of Nigeria 5TH Annual
Monetary Policy Conference with the Theme "Capital Flows and Economic Trans-
formation in Nigeria" Held at the CBN Conference Hall, Abuja from November,
loth to 1lth, 2005. PP. 2. b
McDonald e t al, 2006, Enticing Investors - Finance and Development Quarterly of the
IMF Dec. 2006, Volume 43, Number 4
McKinnon, R. I., 1973, Money and Capital in Economic Development. Washington
D.C.: The Brooklyns Institute. PP. 16.
Montiel, P.J. 1995, Financial Polices and Economic Growth: Theory, Evidence and
Country Specific Experience from Sub - Saharan Africa, AERC Special paper (April
1995), PP. 1 - 13.

M S c Dissertation: Globnlised Financial,flows, C'Ltpitctl marlid deepening, und Econontic Growth: ?i'igerian Experience .- -- -.. -.-- .. - - .. -. . . . . . . .- - . .- ... -.. - ..-. . . . . . . .. . . . ... . .- -
Monye, Tony, 2007, "Nigeria - UK: fostering relations on Trade lmbaiance" in "The
Stock Market Boom: Challenges and Opportunities, Zenith Economic Quarterly. -+-
PP. 59 - 71
National Population Commission (NPC), 2004,National Economic Empowerment and
Development Strategy (NEEDS). National Planning Commission, Nigeria. PP.8- 9
Ndebbio, J.E.0.,2004, Financial Deepening, Economic Growth and Development:
Evidence from Selected Sub - Saharan African Countries. AERC Research Paper
142, African Economic Research Consortium, Nairobi (August), PP. 1 - 19
Nigeriabusinessinfo.com, 2001: Broadbase(UK) Ltd & Broad End(Nig) Ltd,
http: / /www.nigeriabusinessinfo.com/capitalmarket. htm
Nissanke, M. and Stein H., 2002, Financial Globalisation and Economic Development:
t Toward an Institutional Foundation. Paper presented for the 2002 Meeting of the
EEA Boston, MA, March, pp. 1
NSE, 2006, The Nigerian Stock Exchange Fact Book, Academy Press Plc, Lagos, PP. 1 -
25.
NSE, 2006, The Nigerian Stock exchange, Questions and Answers, Academy Press
Lagos. PP. 1 -- 14.
NSE,2006, The Nigerian Stock Exchange, The Nigerian Stock Exchange And You,
Presentation Notes. Academy Press Plc, Lagos, PP.l - 16
Obadan, M.I., 2004, Foreign Capital Flows and External Debt: Perspectives on Nigeria
and the LDCs Group. Broadway Press Limited, Lagos.
Obstfeld, M., 1994, "Risk - Taking, Global Diversification, and Growth," American
Economic Review, Vol. 84, No. 5, PP. 1310 -- 29.
Obstfeld, M., and K. Rogoff, 2000, "The six major puzzles in international
macroeconomics: i s there a common cause?" NBER working paper no. 7777.
2000. PP. 743 - 50.
Oduh, M.0, 2006, Objectives and Instruments of Macroeconomic Policy Framework,
Unpublished mimeograph, Department of Economics, University of Nigeria, & Af-
rican Institute of Applied Economics (AIAE), PP. 1 - 15.
Okojie, C.E.E., 2005, Capital Flows and Current Account Sustainability: The Case of
Nigeria, United Nations Economic Commission for Africa. Workshop on Capital

11 Sc D ~ t s ~ ~ r ~ u r ~ o ~ ~ Globa11sc.d I ~ ~ ~ ~ n ~ ~ c r u l j l o i i ~ . ~ , Cup~icrl ~~lcirXet decpo~lng and Econonrrc Growih Ngevrnn Experrence
Flows and Current ~ c c o u n t Sustainability in African Economies, 21 - 22 ~ e p t e m -
ber 2005, Accra Ghana, PP. 1 - 25. 4'
Oks, Andrus, 2001, Efficiency of the Financial Intermediaries and Economic Growth
in CEEC, Tartu University press, Tiigi 78.50410 Tartu,Order No, 562.F
Olisadebe, E.U., 1995,"Trends i n Nigeria's Balance of Payments'. In Nigerian
Economic society" External Trade and Economic Development in Nigeria, lbadan
NES
Onyuike Okereke Ndi, 2005, "The role of Nigerian Stock Exchange in combating
money laundering i n Nigeria" A paper presented at the 4th National Seminar on
economic crimes, August 8.
Opportunities and Challenges," Jackson Hole Wyoming, August, PP. 1 - 21
t Prasad, E.S., R.G. Rajan, and A. Subramanian (2007), "Foreign Capital and Eco-
nomic Growth Working Paper 13619 National Bureau of Economic Research.
Rajan, R., and Zingales, L., 1998, Financial Dependence and Growth, American
Economic Review, Vol.88, No. 3, PP. 488 - 506.
Roubini, N., and Watchel, P., 1997, Current account sustainability in Transition
Economies, Paper presented at the Third Dubrovnik conference on Transition
Economies, Dubrovnik, Croatia, June 1997. pp. 11 - 14.
Rybinski, K., 2006, Globalization versus Financial Markets. A Series of Seminars by
the Index Students Association for Capital markets and the Department of Capi-
ta l markets, Cracow University of Economics, pp. 1 - 24.
Sancak, C., 2002, Financial Liberalization and Real Investment: Evidence from
Turkish Firms, IMF Working Paper 021100, June (Washington: International Mone-
tary Fund).
Schmidt - Hebbel, K., 1994, Fiscal Adjustment and Growth: In and Out of Africa,
Paper presented at the African Economic Research Consortium (AERC) Workshop
in Nairobi, Kenya (May, 1994). PP. 1 - 16
Schumckler, S.I., 2003, Financial Globalization: Gain and Pain for Developing
Countries, World Bank Policy Research Report on "Globalization, Growth, and
Poverty," available at http: lworldbank.orglresearch1 bioslschmuckler.
Sharpe, W. F., 1 985, Investments, 3rd Edition, Prentice - Hall l nternational Editions,
L)epnrtnienf of Econonzics, University of Nigericr Nsukkn 77 of 108
MSc Disserf~zfion: Globalised Financialflows, Clapifal market deepening, and Econonzic Growth: Nigerian Experience -. . . -.-.-.----..-..L...-- ..~ . ~ ~ ~ ~ .. . -. -.. .. -.
Prentice - Hall International, inc. PP. 706 - 721
Shaw, E., 1973, Financial Deepening in Economic Development, New York: Oxford 4
University Press.
Smith e t al, 2003, Economic Development, Eight Edition, Pearson Education Inc. PP.
634 - 66
Stiglitz, J., 1999, "Bleak Growth for the Developing World," lnternational Herald
Tribune, April 10-1 1, PP. 6.
Stiglitz, J., 2000, "Capital Market Liberalization, Economic Growth, and Instability,"
World Development, 28:6, PP. 1075-1086.
Stiglitz, J., and Weiss, A., 1981, "Credit Rationing in Markets with Imperfect
Information. American Economic Review. Vol. 71. PP.392 - 41 1
F Stulz, R., 1999, "Globalization, Corporate Finance and the Cost of Capital," Journal
of Applied Corporate Finance, 12:3, PP. 8-25.
Tesar, L., and I. Werner 1995, "Home bias and high turnover", Journal of
lnternational Money and Finance, no. 14, p.467-492.
Turnovsky, S.J., 2000, Growth in an Open Economy: Some recent Developments.
Presented at a conference on "How to promote Economic Growth in the Euro
Area?" Held at National Bank of Belgium, Brussels. Pp. 1 - 2.
Uzor, 2007, "Capital Market Reform: Challenges and Opportunities, in "The Stock
Market Boom: Challenges and Opportunities, Zenith Economic Quarterly. PP. 25 -
34. A
Wallich, H.C., 1969, Money and Growth: A country cross - section analysis, Journal of
Money, Credit and Banking, PP. 1 - 11
Woeking, J., lnternational Capital Markets and Their Importance, The University of
. Iowa, Centre for lnternational Finance and Development, E - Book, powered by
Google, PP. 1 - 6.
Wurgler, J., 2000, Financial Markets and Allocation of Capital, Journal of Financial
Economics, Vol. 58, PP. 187 214.

CHARTS
Chart 1 World Export of Goods & Services
1960 1970 1980 1990 2000 2002
Year
F o o d s ~ennces -. - - - 1
Source: World Bank's Global Development Finance (same for chart 3).
Chart 2 Foreign Direct Investment
1970 1980 1990 2000 2001 2002
Year
L _ _- I - - _. .. - -- --- - - - _ . Source: World Bank's Global Development Finance.

Chart 3: Annual Rate of Return on Investment from Nigerian Capital 1 Stock
Market
Year
-1 --e-AvAR I
AMaxR - - - ljMinn -
- Gee: I:rom data from Nigerian Stock Ilxchange Fact Book & Abodunde, etal, 2007

APPENDIX A
7 Econometric Result Print Out MODEL, 1
---- PcGive 8.00, copy fhr meuller ----
---- session started at 18:30:14 on 8th January 2008 ----
IJnit root tcsls 1987 ( I ) lo 2006 (4)
Critical values: 5%=-1.944 I0/o=-2.592
t-adf B lag t-lag t-prob
Ft'l 2.4130 53.896 2 -2.0038 0.0486
FPI 1.5732 54.927 1 -4.2333 0.0001
FPI -0.28059 60.525 0
Non-oil-GDP - 1.8528 8.4091 2 -4.5264 0.0000
N o n oil--GDP -3.3414"" 9.401 1 1 -3.8524 0.0002
+ Non-oil--GDP -6.3560** 10.191 0
RIR -1.4218 10.227 2 -1.18650.2391
RIR -1.6653 10.254 1 -3.8902 0.0002
K1 R -2.6810** 11.133 0
REXC -2.7633** 27.022 2 -2.26 19 0.0265
IIEXC -2.7074** 27.726 1 -5.9654 0,0000
REXC -2.9803** 33.246 0
GFR -2.7405** 1.0830 2 -5.1545 0.0000
GFR -2.2218* 1.2480 1 -6.2932 0.0000
GFR -2.5524* 1.5227 0
Mcap 3.7143 1.5723 2 -2.125 1 0.0368
Mcap 3.0193 1.6074 1 -4.5108 0.0000
Mcap 1.432 1 1.7934 0
DO -0.0 19371 0.2638 2 -0.99376 0.3235
TDO , -0.084079 9.2631 1 -3.101 1 0.0027
TDO -0.28429 9.7552 0
I Q . 1.4420 7.5005 2 -3.4140 0.0010
1 c? 0.80465 7.9964 I -5.8 171 0.0000
I Q -0.044948 9.5 143 0
INV 3.5444 2062.2 2 -2.6757 0.0091
INV 2.6006 2142.1 1 -5.03860.0000
INV 1.0447 2450.6 0
SVRI' -0.74342 7.5649 2 -1.4036 0.1645
Deprrrtnzerrt of Economics, U n i ~ w s i t y qf'Nigerin Nsukkrr

SvlIP
DFPI
DFPI
DFPI
DNon oil
DNon_oiI
DNon oil
DlIlR
DlIlR
DIIIR
LREXC
LKEXC
LREXC
DLREXC
Dl ,RI:,XC
DLRkXC
LG FII
LG F I<
1,GFR
DLGFR
D1,GFII
DLGFR
1,Mcap
LMcap
LMcap
DLMcap
Dl ,Mcap
DLMcgp
LTDO
LTDO
I ,TDO
Dl .TOO
DL'TDO
DL'I'DO
L1Q
LIQ
LIQ
Deprrrtnzent o f Ecntronzics, University of Nigericr Nsrikka 82 of 108

hl Sc L>rsser.t~rtiorr Cloh~rltsecl I.'rnancrtr/ floivs, T~~pr ta l morltet deepenrng, cind Ecot7ornrc Growth Wrger~an Experience . - . . -.. - - - - - -...-
DLIQ -6.3791** 0.13716 2 -0.92916 0.3557
DLIQ -I l.745** 0.13704 1 3.3322 0 0013
DLIQ -17.556** 0.14554 0
LINV 3 8610 0.18532 2 -2.5151 0.0140
LlNV 3.0883 0.191 54 1 -4 7968 0.0000
LINV 1.8333 0.21658 0
DLINV -7.2046** 0.19958 2 1.4980 0.1382
DI,INV -8.4819** 0.201 16 1 1 1678 0.2464
DLINV -13.793** 0.20162 0
LSvliP -0.73123 0.25398 2 -1.1733 0.2443
L,SvRP -0 68191 0 25459 1 -4.2132 0.0001
LSvfiP -0.59636 0.28029 0
IILSVRP -6.7787** 0.2535 1 2 0.90622 0.3676
D1,SvRP -8.5704** 0.25322 1 1.1476 0.2546
DLSVRP -14.208** 0.25373 0
EQ( 1) Modelling FPI by OLS
The present sample is: 1986 ( I ) to 2006 (4)
Variable Coefficient Std.Error t-value t-prob Partliy
RIR 0.77306 0.607 19 1.273 0.2068 0.0209
LREXC -1 13.16 23.057 -4.908 0.0000 0.2407
LGFR 65.540 19.206 3.413 0.0010 0.1329
LMcap 288.91 32.731 8.827 0.0000 0.5062
LI'DO -52.933 45.120 -1.173 0.2444 0.0178
I ,lQ 63.882 59.533 1.073 0.2866 0.0149
LlNV 9.0923 23.126 0.393 0.6953 0.0020
LSVRP -61.083 18.583 -3.287 0.0015 0.1245
liy = 0,78 1 137 a := 76.5228 UW - 1.06
* liy does NOT allow for the mean *
.RSS = 445035.773 for 8 variables and 84 observations
Residual addcd to database
Residual = Residual values of equation I
Unit root tests 1986 (4) to 2006 (4)
Critical valucs: 5'' - I ,944 19'0 -2.592
t-adf a lag t-lag t-prob

Residual -2.9134** 62.276 1 -3.3553 0.0012
Solved Static I,ong liun cquation FP1 10.773 1 l i l l i - 1 13.2 L,IiEXC t65.54 I,GFK
(SI:) ( 0.6072) ( 23.06) ( 19.2 I) t288.9 LMcap -52.93 L T D 0 4 63.88 L1Q
( 32.73) ( 45.12) ( 59.53) +9.092 LlNV -6 1.08 1,SvRP
( 23.13) ( 18.58)
ECM added to database
WAI,D test Ch1y(8) = 271.25 10.0000] * * Analysis o r lag structure
L a g 0 1 2 3 4 S a FPI - 1 0 0 0 0 0 - I
Std.Err 0 0 0 0 0 0 0 RI R 0.773 0 0 0 0 0 0.773
Std.Err 0.607 0 0 0 0 0 0.607 LREXC -113 0 0 0 0 0 -113
S t d . l l r r 2 3 . 1 0 0 0 0 0 2 3 . 1 LGFR 65.5 0 0 0 0 0 6 5 . 5
Std.Err 19.2 0 0 0 0 0 19.2 1 ,Mcap 289 0 0 0 0 0 289
Std.l?rr 3 2 7 0 0 0 0 O 32.7 1, TDO -529 0 0 0 0 0 -52.9
Std.tlrr 45.1 0 0 0 0 0 45.1 LIQ 63.9 0 0 0 0 0 6 3 . 9
Std.Err 59.5 0 0 0 0 0 59.5 LINV 9.09 0 0 0 0 0 9.09
Std.Err 23.1 0 0 0 0 0 23.1 LSVRP -61.1 0 0 0 0 0 -61.1
Std.Err 18.6 0 0 0 0 0 18.6
'Tests on thc significancc of each variable
variable l:(num,denom) Value Probability Unit Root t-test
RIR F( 1, 76) = 1.6209 [0.2068] 1.2732
EQ(l0) Modelling DFPI by 01 , s
The prcscnt sample is: 1987 ( I ) to 2006 (4)
Variable Coefficient Std.Error t-value t-prob PartRy
Constant -1 7.996 9.5766 - 1.879 0.0662 0.0672
Department of Ecorromics, University qfNigeria Nsukkn

A1 Sc Dlssert~rtron Globnlz~ed Frnnnctul f lm A , Cnpcttrl nztrrAet dcepenrng, n ~ d Econo~i~rc Growth Nrgerlnn Experience
RRR 2 8973 0.7051 1 1.109 0 0002 0 2563
KRRI 3 0.75522 0.60696 1.244 0.2193 0.0306
f DRIR 1.1703 0.4794 1 2.41 1 0.0 183 0.1084
DLREXC -345.79 60 331 -5.732 0.0000 0 4013
DLREXC-I -1 16 73 65.058 -1.794 0.0789 0.061 7
DLREXC 2 -1 1 1 16 67.443 -1.648 0.1057 0.0525
DI,REXC 3 -173.12 74.350 -2.328 0.0241 0 0996
DLGFR 3 41.715 13.135 3 178 00026 0.1709
DLMcap 3 171.33 57.509 2.979 0.0045 0 1534
DL1 DO -195.96 32.91 1 -5.954 0.0000 0.4198
D L T D O I -1 18.26 39.136 -3 022 0 0040 0.1571
D LT DO-2 -125.89 41.169 -3.058 0.00360.1602
DL DO-3 -1 82.84 47.021 -3.889 0.0003 0.2358
Dl ,IQ -21602 62447 -34590.0011 0.1963
DLIQ 1 -1 52 98 75 887 -2 016 0.0493 0 0766 * DLlQ 2 -120.86 77 877 -1.552 0.1271 0.0469
DLIQ-3 -93.868 7 1.704 - 1.309 0.1966 0.0338
DLINV 96.023 39.244 2.447 0.0180 0.1089
DLINV 1 45.956 41.341 1112 027170.0246
DLlNV 2 47.535 41.212 1 153 0 2543 0.0261
DLlNV 3 65.669 38.821 1.692 0 0971 0 0552
DI,SVRI' -209.20 33.000 -6 339 0 0000 0.4506
DLSVRP-1 -58.634 34 236 -1 713 0.093 1 0.0565
DLSVRP 2 -59.986 34.400 - 1 744 0.0875 0.0584
DLSVRP 3 -96.414 35.765 -2.696 0.0096 0.1292
ECM 1 -0.58530 0.099016 -5.91 1 0.0000 0.4163
RSS - 83326.23 for 27 variables and 80 observations
b
Autoregressive-distr~buled lag model of' DlPI on LGFR
Autorcgress~on part has lags 1 to 8
Distributed I,ag part has lags 1 to 8
The present sample is: 1988 (2) to 2006 (4)
Autoregression
I,ag I I ,ag 2 I,ag 3 Lag 4 I,ag 5 Lag 6
Coel'f. -0.6952 -0.235 1 0.2068 0.8082 0.545 1 0.05435
Std.Err 0.1295 0.1666 0.1886 0.1835 0.1563 0.1818
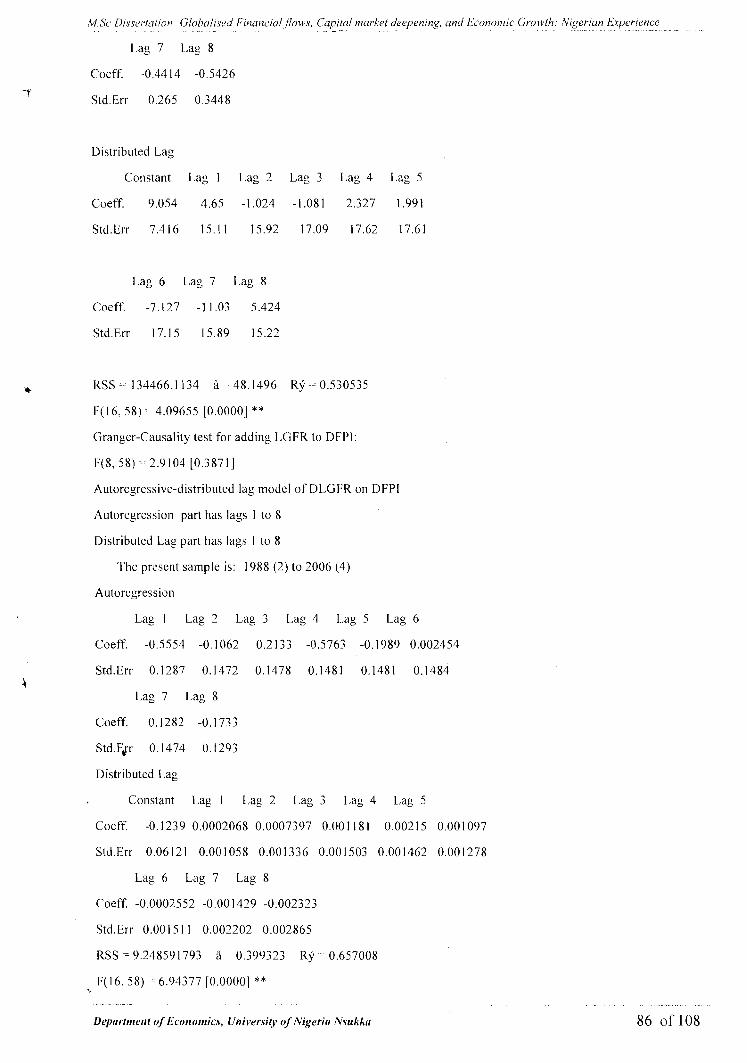
A d .% Dosertcr/~or~ Glohnlised Frnnncral flows, C~ryrtol - .- m n d d deepenrng, nnd Econo~irrc C;r.owth N~gerrun Exper~cnce
Lag 7 I,ag 8
Coeff. -0 44 14 -0 5426
Std Err 0.265 0 3448
Distributed Lag
Constant Lag 1 Lag 2 Lag 3 Lag 4 Lag 5
Coeff. 9.054 4.65 -1 .024 -1.081 2.327 1.991
Std.Brr 7.416 15.1 1 15.92 17.09 17.62 17.61
I,ag 6 Lag 7 Lag 8
Coeff. -7.127 -1 1.03 5.424
Std.Err 17.15 15.89 15.22
RSS -- 134466.1 134 i - 48.1496 Ry 0.530535
F(l6, 58) 4.09655 [0.0000j * *
Granger-Causality test for adding LGFR to DPPI:
l:(S, 58) 2.9104 [0.387l]
Autoregressive-distributed lag model of DLGFR on DFPI
Autoregression part has lags 1 to 8
Distributed Lag part has lags I to 8
'The prcsent sample is: 1988 (2) to 2006 (4)
Autorcgression
Lag 1 Lag 2 Lag 3 L,ag 4 I,ag 5 Lag 6
Coeff. -0 5554 -0 1062 0.2133 -0.5763 -0.1989 0.002454
Std.Err 0.1287 0.1472 0.1478 0.1481 0.1481 0.1484
L a g 7 L a g 8
Coeff. 0. I282 -0.1733
Std.Qr 0.1474 0.l2O3
Distributed Lag
Constant Lag I Lag 2 Lag 3 1,ag 4 L,ag 5
Coeff -0.1239 0.0002068 0.0007397 0 001 18 1 0 0021 5 0.001 097
Std.lirr 0 06121 0.001 058 0.001336 0.001503 0.001462 0 001278
Lag 6 Lag 7 Lag 8
Coeff. -0 0002552 -0 00 1429 -0.002323
Std.Err 0.00 15 1 1 0.002202 0.002865
RSS - 9 24859 1793 i 0.399323 Ry 0.657008
F(16, 58) 6.94377 [0.0000] * *
Drycrrtnwrrl of Ecorwnrics, linivertity of Nigerin N w k h o
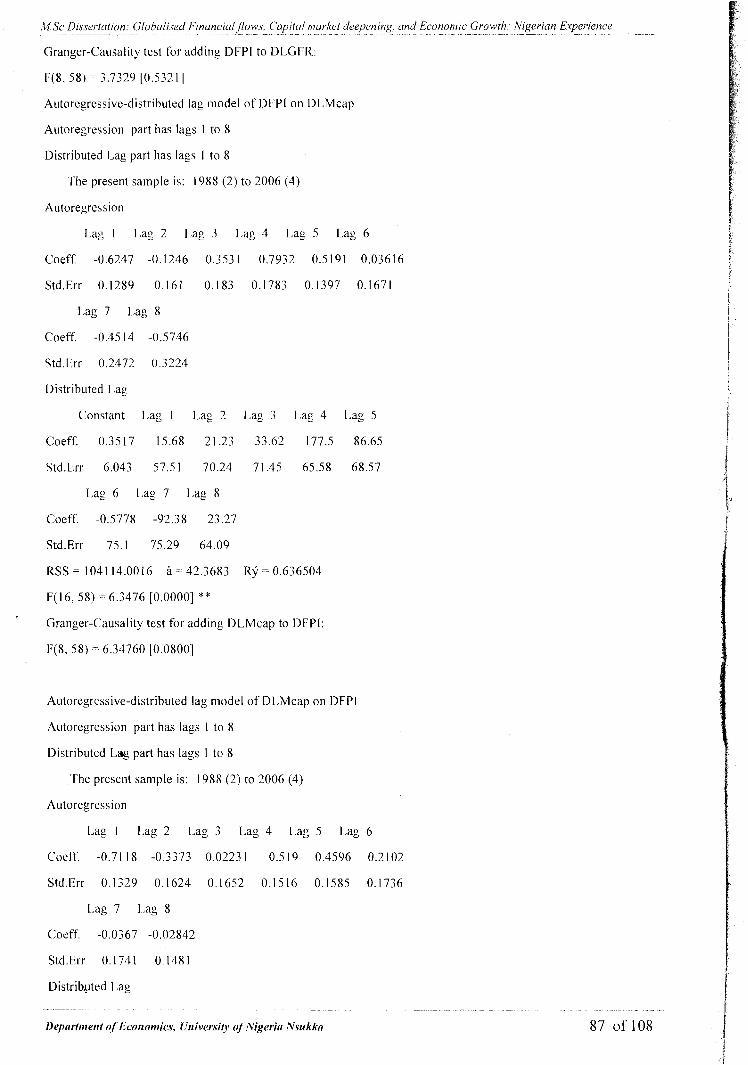
M.Sc Disserration: C;lolxllisetf Financinl,jlows, C'~rpiti11 niarltet deepening, and Econon~ic Growth: Nigerian E.~perience . . . . . . . . . . . . . . . . . . . -. . . . . . . . . . . . . . . . . . . . . . . . . . . - ................ -
Granger-Causality test fhr adding DFPI to DLGFR:
F(8. 58) - 3.7329 10.532 1 1
Autoregressive-distributed lag model of DFPI on D1,Mcap
Autoregression part has lags I to 8
Distributed Lag part has lags I to 8
- - 1 he present sample is: 1988 (2) to 2006 (4)
Autoregression
Lag I I,ag 2 I,ag 3 l,ag 4 1,ag 5 Lag 6
Coeff. -0.6247 -0.1246 0.353 1 0.7932 0.5191 0.03616
Std.Err 0.1289 0.161 0.183 0.1783 0.1397 0.1671
Lag 7 l,ag 8
Coeff', -0.45 I4 -0.5746
Std.l'rr 0.2472 0.3224
Distributed Lag
Constant Lag 1 L,ag 2 Lag 3 Lag 4 Lag 5
Coeff. 0.3517 15.68 21.23 33.62 177.5 86.65
Std.Err 6.043 57.51 70.24 71.45 65.58 68.57
1,ag 6 Lag 7 1,ag 8
Coeff. -0.5778 -92.38 23.27
Std.Err 75.1 75.29 64.09
RSS = 1041 14.0016 a :: 42.3683 K y - 0.636504
F(16, 58) ; 6.3476 [0.0000] * *
Granger-Causality test for adding DLMcap to DFPI:
F(8, 58) 6.34760 10.080011
Autoregressive-distributed lag model of D1,Mcap on DFPI
Autoregression part has lags I to 8
Distributed Lag part has lags I to 8
'fhe present sample is: 1988 (2) to 2006 (4)
Autoregression
Lag 1 Lag 2 l a g 3 Lag 4 Lag 5 Lag 6
Coeff. -0.7 1 18 -0.3373 0.0223 1 0.5 I9 0.4596 0.2 102
Std.Err 0.1329 0. I624 0.1652 0.1 5 I6 0.1585 0.1736
Lag 7 Lag 8
Coeff. -0.0367 -0.02842
Std.Err 0.174 1 0.148 1
Distribgted Lag
. . . . .
l)ep(~rlnrent of'Ecor~onzics, ~/niversiljv rvNigerirr Nsukkn

M S c Dissertation: Globalised Financialjows, Capital market deepening, and Econonzic Growth: Nigerian Experience ..
Granger-Causality test for adding DFPl to DLGFR:
F(8, 58) - 3.7329 [0.5321]
Autoregressive-distributed lag model of DFPl on DLMcap
Autoregression part has lags 1 to 8
Distributed Lag part has lags 1 to 8
The present sample is: 1988 (2) to 2006 (4)
Autoregression
Lag 1 Lag 2 Lag 3 Lag 4 Lag 5 Lag 6
Coeff. -0.6247 -0.1246 0.353 1 0.7932 0.5191 0.03616
Std.Err 0.1289 0.161 0.183 0.1783 0.1397 0.1671
Lag 7 Lag 8
Coeff. -0.45 14 -0.5746
Std.Err 0.2472 0.3224
Distributed Lag
Constant Lag 1 L,ag 2 Lag 3 Lag 4 Lag 5
Coeff. 0.3517 15.68 21.23 33.62 177.5 86.65
Std.Err 6.043 57.51 70.24 71.45 65.58 68.57
Lag 6 Lag 7 Lag 8
Coeff. -0.5778 -92.38 23.27
Std.Err 75.1 75.29 64.09
RSS = 1041 14.0016 i = 42.3683 Ry - 0.636504
F(16, 58) = 6.3476 [0.0000] ** Granger-Causality test for adding DLMcap to DFPI:
F(8, 58) - 6.34760 [0.0800]
Autoregressive-distributed lag model of DLMcap on DFPl
Autoregression part has lags 1 to 8
Distributed Lag part has lags 1 to 8
The present sample is: 1988 (2) to 2006 (4)
Autoregression
Lag 1 Lag 2 Lag 3 Lag 4 Lag 5 Lag 6
Coeff. -0.71 18 -0.3373 0.0223 1 0.519 0.4596 0.2102
Std.Err 0.1329 0.1624 0.1652 0.1516 0.1585 0.1736
Lag 7 Lag 8
Coeff. -0.0367 -0.02842
Std.Err 0.1741 0.1481
Distribgted Lag
- -. - - ... . - - --- ... . . -. .. .. .- .- .... . .. -. .- . . - -- - .- . -- - . . . .. - - . . .. .. ~ .. ..
Deprcrlmmr of' Economics, University of Nigeria Nsukka 87 of 108

M.Sc Dissertation: Globalised FinancialJlows, Capital market deepening, and Economic Growth: Nigerian Experience ~ -- -. - --
Constant Lag 1 Lag 2 Lag 3 Lag 4 Lag 5
Coeff. 0.02375-9.092e-005-8.82 1 e-005 -0.0001028 0.0003016 0.0001 14 Y
Std.Err 0.01397 0.000298 0.0003722 0.0004231 0.0004122 0.0003229
Lag 6 Lag 7 Lag 8
Coeff. -1.052e-005-8.815e-005 -0.0002 135
Std.Err 0.0003863 0.0005713 0.0007453
RSS = 0.5563812022 ti = 0.0979427 Ry - 0.494242
F(16,58) = 3.54246 [0.0002] **
Granger-Causality test for adding DFPI to D1,Mcap:
Autoregressive-distributed lag model of DFPI on RRR
Autoregression part has lags 1 to 8
k Distributed Lag part has lags 1 to 8
The present sample is: 1988 (2) to 2006 (4)
Autoregression
Lag 1 Lag 2 Lag 3 Lag 4 Lag 5 Lag 6
Coeff. -0.7056 -0.2419 0.2059 0.8207 0.571 1 0.07745
Std.Err 0.13 15 0.1673 0. I882 0.1 824 0.1592 0.1 845
Lag 7 Lag 8
Coeff. -0.4248 -0.5379
Std.Err 0.2684 0.3483
Distributed Lag
Constant Lag 1 Lag 2 L,ag 3 Lag 4 Lag 5
4 Coeff. -26.1 8.987 -9.67 -8.835 -22.64 -10.48
Std.Err 48.8 38.37 37.63 38.6 40.56 40.87
Lag 6 Lag 7 Lag 8
Coeff. * 7.513 7.396 32.33
RSS - 134512.8429 5 = 48.1579 Ry = 0.530372
Granger-Causality test for adding RRR to DFPI:
F(8, 58) = 2.3710 [0.0003]
Autoregressive-distributed lag model of DFPI on RRR
Autoregression part has lags 1 to 8
Distributed Lag part has lags 1 to 8
.. -- .. . .. . . -. . . . - ..-. .- . - - . ... . .. ..
Department of Bconontics, University of Nigeria Nsukkrr 88 of 108
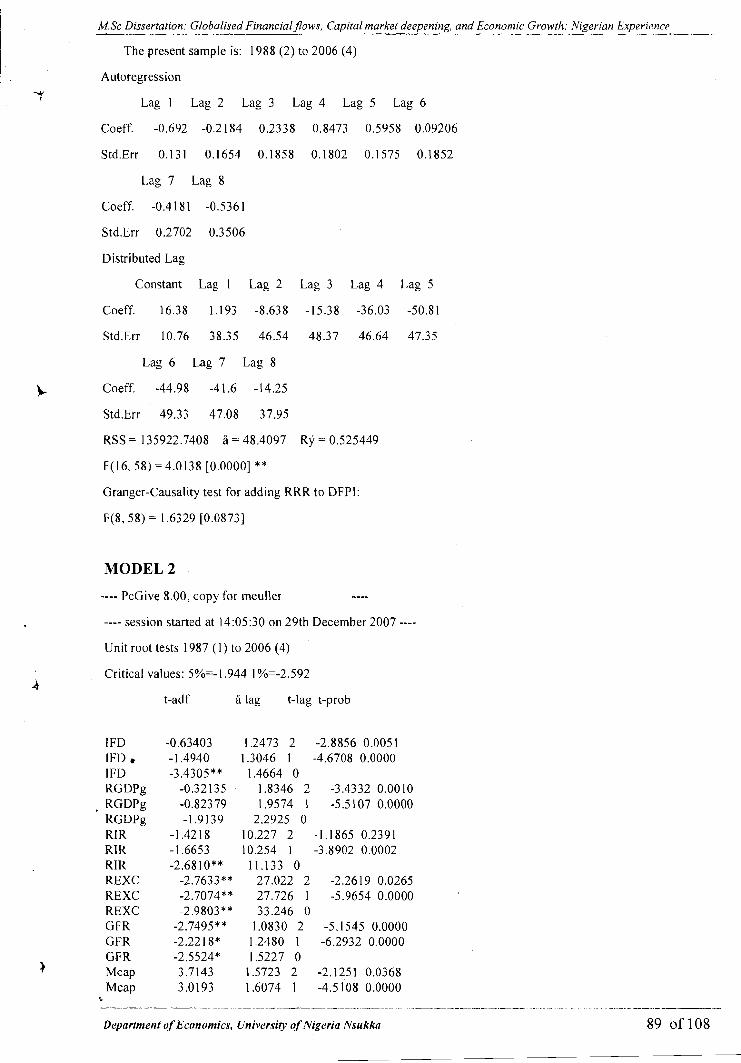
I M.Sc Dissertation: Globalised Financialflows, Capital market deepening, and Economic Growth: Nigerian Experience -- -- - - . - -- - - -. .
The present sample is: 1988 (2) to 2006 (4)
Autoregression
I Lag I Lag 2 Lag 3 Lag 4 Lag 5 Lag 6
I Coeff. -0.692 -0.2 184 0.2338 0.8473 0.5958 0.09206
Std.Err 0.131 0.1654 0.1858 0.1802 0.1575 0.1852
Lag 7 Lag 8
Coeff. -0.41 81 -0.5361
Std.Err 0.2702 0.3506
Distributed Lag
Constant Lag 1 Lag 2 Lag 3 Lag 4 Lag 5
Coeff. 16.38 1.193 -8.638 -15.38 -36.03 -50.81
Std.Err 10.76 38.35 46.54 48.37 46.64 47.35
Lag 6 Lag 7 Lag 8
k Coeff. -44.98 -41.6 -14.25
Std.Err 49.33 47.08 37.95
RSS = 135922.7408 A - 48.4097 Ry - 0.525449
F(16, 58) ==4.0138 [0 00001 ** Granger-Causality test for adding RKR to DFP1:
F(8, 58) = 1.6329 [0.0873]
MODEL 2
---- PcGive 8.00, copy for rneuller ----
---- session started at 14:05:30 on 29th December 2007 ----
Unit root tests 1987 ( I ) to 2006 (4)
Critical values: %=-I .944 I%=-2.592
t-adf ti lag t-lag t-prob
IFD IFD . IFD RGDPg
, RGDPg RGDPg RIR RIR RIR REXC REXC REXC GFR GFR GFR
? Mcap
Mcap
Depnrfnwnt of Economics, Universiw qf Nigerin Nsukkn 89 of 108

M Sc Drssertation Globolised Financraljlows, Capttal market deepenrng, and Economzc Growth Nigerran Experience - ---- - - --- -
Mcap 1.432 1 1.7934 0
I
TDO TDO TDO DlFD DlFD DlFD DRGDPg DRGDPg DRGDPg DRlR DRlR DRlR LREXC LREXC LREXC DLREXC DLREXC DLREXC
b LGFR LGFR LGFR DLGFR DLGFR DLGFR LMcap LMcap LMcap DLMcap DLMcap DLMcap LIQ LIQ LIQ DLlQ DLlQ DLlQ LTDO LTDO
A . LTDO
DLTDO DLTDO DLTDO
EQ( 1) Modelling IFD by OLS
The present sample is: 1986 ( I ) to 2006 (4)
Variable Coefficient Std.Error t-value t-prob PartRy
RGDPg -0.28329 0.062589 -4.526 0.0000 0.21 01
RIR 0.0054016 0.0098088 0.551 0.5834 0.0039
REXC -0.01 0853 0.0026555 -4.087 0.0001 0.1 783
GFR 0.37129 0.059420 6.249 0.0000 0.3365
.? Mcap 0.19347 0.029682 6.5 18 0.0000 0.3556
I Q -0.001 1677 0.01 5034 -0.078 0.9383 0.0001 - --
Department of Econonlics, University of Nigeria Nsukka 90 of 108

MSc Dissertation: Globalised Financialjlows, Capital nzarltet deepening, and Economic Growth: Nigerian Experience .---.-..------.------.--p--..-..--. ~- ~ -. . -. -... -..
TDO 0.0066838 0.012683 0.527 0.5997 0.0036
* Ry does NOT allow for the mean *
RSS = 124.4309608 for 7 variables and 84 observations
Residual added to database
Residual - Residual values of equation 1
Unit root tests 1986 (4) to 2006 (4)
Critical values: 5%=-1.944 1 %=-2.592
t-adf 5 lag t-lag t-prob
Residual -2.7752** 1 .I235 2 -3.9745 0.0002
Kesidual -5.0266** 1.2242 1 -1.9840 0.0507
b- Residual -8.9814** 1.2465 0
Solved Static Long Run equation
IFD - -0.2833 RGDPg +0.005402 RlR -0.01 085 REXC
(SE) ( 0.06259) ( 0.009809) ( 0.002656)
t0.3713 GFR +0.1935 Mcap -0.001 168 1Q
( 0.05942) ( 0.02968) ( 0.01503)
+0.006684 TDO -0.0 I268
ECM added to database
WALD lest Chiy(7) = 134.09 [0.0000] **
Analysis of lag structure
L a g O 1 2 3 4 5 a
IFD -1 0 0 0 0 0 - 1
Std.Err 0 0 0 0 0 0 0
RGDPg -0.283 0 0 0 0 0 -0.283
S tbEr r0 .0626 0 0 0 0 0 0 . 0 6 2 6
RIR 0.0054 0 0 0 0 0 0 . 0 0 5 4
Std.Err 0.00981 0 0 0 0 0 0.00981
REXC -0.0109 0 0 0 0 0 -0.0109
Std.Err0.00266 0 0 0 0 00.00266
GFR 0.371 0 0 0 0 0 0 . 3 7 1
Std.Err 0.0594 0 0 0 0 0 0.0594
Mcap 0.193 0 0 0 0 0 0.193
Std.Err 0.0297 0 0 0 0 0 0.0297
_IQ -0.00117 0 0 0 0 0-0.00117
-- .. -- . .- . - .. ... .
Deprrrtn~ent of Economics, University of Nigeria Nsukka 91 of 108

M.Sc Dissertation: G1oDrrlisc.d Financialjlows, Capital nlarket deepening, and Economic Growth: Nigerian Experience . .~ ...... . ... . -- ~~ ... . - ~ . -
Std .Er r0 .015 0 0 0 0 0 0 . 0 1 5
TDO 0.00668 0 0 0 0 00 .00668
Tests on the significance of each variable
variable F(num,denom) Value Probability Unit Root t-test
RGDPg F( 1, 77) = 20.486 [0.0000] * * -4.5261
RIR F( 1, 77) = 0.30326 [0.5834] 0.55069
REXC F( 1, 77) - 16.703 [0.0001] ** -4.0869
GFR F( 1,77) = 39.046 [0.0000] ** 6.2486
Mcap F( 1, 77) = 42.487 [0.0000] ** 6.5 182
1Q F( 1, 77) = 0.0060335 [0.9383] -0.077676
TDO F( 1, 77) = 0.27771 [0.5997] 0.52698
EQ(30) Modelling DIFD by OLS
The present sample is: 1987 ( I ) to 2006 (4)
Variable Coefficient Std.Error t-value t-prob PartRy
Constant 0.055891 0.12085 0.462 0.6452 0.0030
DRGDPg-3 0.16552 0.05 1795 3.196 0.0021 0.1257
DRIR--3 -0.014253 0.010355 -1.376 0.1730 0.0260
DLREXC -2.0914 0.73998 -2.826 0.0061 0.101 1
DLGFR 0.1 1665 0.046198 0.525 0.6014 0.0039
DLMcap-3 2.9668 0.98736 3.005 0.0037 0.1 128
DLTDO-1 -0.3741 7 0.62512 -0.599 0.5514 0.0050
DLlQ 0.44346 0.85692 0.518 0.6064 0.0038 A
ECM-l -0.74659 0.098572 -7.574 0.0000 0.4469
RSS = W.20318487 for 9 variables and 80 observations
Autoregressive-distributed lag model of DIFD on DRGDPg
Autoregression part has lags 1 to 8
Distributed Lag part has lags 1 to 8
The present sample is: 1988 (2) to 2006 (4)
Autoregression
Lag 1 Lag 2 Lag 3 Lag 4 Lag 5 Lag 6
Coeff. -0.3202 -0.07428 0.0702 0.1 682 -0.02902 -0.01 506
Sid.Err 0.1 133 0.1244 0.1253 0.1233 0.1063 0.1063
Depnrimenf of fEcononzics. University ?ofNigeria Nsukk~f 92 of 108

MSc Dissertation: Glohalised Financialjlows, Capital market deepening;and Econonzic Growlh: Nigerian Experience . . .. .~. ... - .~ . ., .,
Lag 7 Lag 8
Coeff. -0.02345 -0.01966
Std.Err 0.1064 0.09102
Distributed Lag
Constant Lag 1 Lag 2 Lag 3 Lag 4 Lag 5
Coeff. 0.05289 0.0248 0.01754-0.0008313 -0.3323 -0.1567
Std.Err 0.09892 0.06352 0.07707 0.07852 0.07688 0.08494
Lag 6 Lag 7 Lag 8
Coeff. -0.04405 0.01 3 12 0.3577
Std.Err 0.0873 0.08679 0.07733
KSS = 39.72040532 A = 0.827547 Ry - 0.7708
F(16,58) - 12.1909 [0.0000] **
Granger-Causality test for adding DRGDPg to DIFD:
F(8, 58) = 11.588 [0.0000] **
Autoregressive-distributed lag model of DRGDPg on DIFD
Autoregression part has lags 1 to 8
Distributed I,ag part has lags 1 to 8
The present sample is: 1988 (2) to 2006 (4)
Autoregression
Lag 1 Lag 2 Lag 3 Lag 4 Lag 5 Lag 6
Coeff. -0.6944 -0.2926 0.1635 0.145 0.241 2 0.1449
Std.Err 0.1341 0.1627 0.1658 0.1623 0.1793 0.1843
Lag 7 Lag 8
Coeff. -0.0363 1 -0.2004
Std.Err 0.1832 0.1632
Distributed Lag
Constant Lag I Lag 2 Lag 3 Lag 4 Lag 5
Coeff. 0.006623 -0.26 19 -0.1 772 -0.03258 -0.07814 0.2291
'Std.Err 0.2088 0.2391 0.2626 0.2645 0.2602 0.2244
Lag 6 Lag 7 Lag 8
Coeff. 0.1835 0.0859 -0.007722
Std.Err 0.2244 0.2246 0.1922
KSS = 177.0205 1 17 -= 1.74702 Ry = 0.447433
F(16, 58) - 1.45935 [0.0000]**
-. Granger-Causality test for adding DIFD to DKGIlPg:
. -.-- . . ... . --. -- .~ .-..
Depnrtnlent of Economics, University of Nigeria Nsrrkkn

M.Sc Dissertation: Globalised Finuncialjlows, Chpital marltet deepening, and Economic Growth: Nigerian Experience .- - .- .- - - - - - -. - . . . .- - . - - - . - .- ..
F(8, 58) = 2.93529 [0.0014] **
Autoregressive-distributed lag model of DlFD on DLMcap
Autoregression part has lags 1 to 8
Distributed Lag part has lags 1 to 8
The present sample is: 1988 (2) to 2006 (4)
Autoregression
Lag 1 Lag 2 Lag 3 Lag 4 Lag 5 Lag 6
Coeff. -0.5973 -0.1908 0.21 19 -0.0005732 0.151 8 0.1009
Std.Err 0.139 0.1612 0.1625 0.1548 0.1326 0.1333
Lag 7 Lag 8
k Coeff. 0.02076 -0.1823
Std.Err 0.1344 0.1 196
Distributed Lag
Constant Lag 1 Lag 2 Lag 3 Lag 4 Lag 5
Coeff. -0.1502 1.516 1.628 1.7 4.619 2.14
Std.Err 0.163 1.707 2.032 2.073 1.899 2.067
Lag 6 Lag 7 Lag 8
Coeff. -0.0633 -2.294 0.6678
Std.Err 2.237 2.21 1.844
RSS = 78.27771226 A - 1.16173 Ry - 0.54831 1
F(16, 58) = 4.40044 [0.0000] **
-i Granger-ausality test for adding DLMcap to DIFD:
F(8, 58) = 2.309 [0.03 191 *
Autoregessive-distributed lag model of DLMcap on DlFD
Autoregression part has lags 1 to 8
D'istributed Lag part has lags 1 to 8
The present sample is: 1988 (2) to 2006 (4)
Autoregression
Lag 1 Lag 2 Lag 3 Lag 4 Lag 5 Lag 6
Coeff. -0.6824 -0.352 -0.0421 9 0.5074 0.41 39 0.205
Std.Err 0.141 0.1679 0.1712 0.1569 0.1707 0.1848
Lag 7 Lag 8
G e f f . 0.02295 0.0 173 3
-- - .. - .. . . .- . . . -- - - . . . . . . . -- . ... . .. .. . . . .- . - -. .. - - .. ..
Lkpnrtnzen! of Economics, Universi@ o f Nigerin Nsukkn 94 of 108

M Sc Dlssertatlon Globahed Fmancral flows, Caprtal market deepening, and Econornlc Growth Nlgerlan Experience . . . - - . - - - - - -- .- -- - - -- - - - - - - - - --
Std.Err 0. I826 0.1524
Distributed Lag
Constant Lag 1 Lag 2 Lag 3 Lag 4 1,ag 5
Coeff. 0.02438 0.002399 -0.0013 12 -0.0081 15 -0.006352 -0.01026
Std.Err 0.01347 0.01 148 0.01331 0.01343 0.01279 0.01096
Lag 6 Lag 7 Lag 8
Coeff. -0.006633 0.002416 -0.008583
Std.Err 0.01 101 0.01 11 0.00988
Granger-Causality test for adding DIFD to DLMcap:
b- Model 3
---- PcGive 8.00, copy for meuller ----
---- session started at 3: 1 1 :32 on 4th January 2008 ----
Unit root tests 1987 ( I ) to 2006 (4)
Critical values: 5%=-1.944 1 %=-2.592
t-adf i lag t-lag t-prob FD 2.9493 0.19362 2 -2.3667 0.0205 F D 2.1406 0.19924 1 -4.8991 0.0000 FD 0.63017 0.22640 0 I FD -0.63403 1.2473 2 -2.8856 0.0051 IFD -1.4940 1.3046 1 -4.6708 0.0000 IFD -3.4305** 1.4664 0 RGDPg -0.32135 1.8346 2 -3.4332 0.0010
A RGDPg -0.82379 1.9574 1 -5.5107 0.0000 RGDPg -1.9139 2.2925 0 RIR -1.4218 10.227 2 -1.1865 0.2391 RIR -1.6653 10.254 1 -3.8902 0.0002 RIR -2.6810** 11.133 0 REXC -2.7633** 27.022 2 -2.2619 0.0265 REXC -2.7074** 27.726 1 -5.9654 0.0000 REXC -2.9803** 33.246 0 GFR -2.7495** 1.0830 2 -5.1545 0.0000 GFR -2.2218* 1.2480 1 -6.2932 0.0000 GFR -2.5524* 1.5227 0 Mcap 3.7143 1.5723 2 -2.1251 0.0368 Mcap 3.0193 1.6074 1 -4.5108 0.0000 Mcap 1.432 1 1.7934 0 1 Q 1.4420 7.5005 2 -3.4140 0.0010 I Q 0.80465 7.9964 1 -5.8171 0.0000 I Q -0.044948 9.5143 0 TDO -0.019371 9.2638 2 -0.99376 0.3235 TDO -0.084979 9.2631 1 -3.101 1 0.0027 TDO -0.28429 9.7552 0 IN-V 3.5444 2062.2 2 -2.6757 0.0091
Deprtnzent qf Economics, University qf'Nigericr Nsukkn 95 of 108

M Sc Dzssertatzon Globalcsed F~nancralj7ows, Capital market deepencng, and Econom~c Growth N~gerran Experience - - - -. - .- -- - . - - - - .. - INV 2.6006 2142.1 1 -5.0386 0 0000 IN V 1.0447 2450.6 0 LFD -0.35277 0.28829 2 -1.2341 0.2209
Y LFD -0.44751 0.28926 1 -4.2914 0.0001 LF D -0.83892 0.31956 0 DLFD -6.6213** 0.28782 2 0.613 1 1 0.5416 DLFD -8.7429** 0.28667 1 1.2721 0.2071 DLFD -14.51 I** 0.28779 0 DIFD -5.8501** 1.2335 2 -1.46240.1477 DIFD -1 1.227** 1.2425 1 3.2321 0.0018 DlFD -16.669** 1.3147 0 DRGDPg -5.7786** 1.8041 2 -1.6549 0.1020 DRGDPg -1 1.540** 1.824 1 1 3.5498 0.0007 DRG D Pg -16.620** 1 9534 0 DRlR -6.4785** 10.352 2 0.35538 0.7233 DRlR -8.8791** 10.294 1 1.4649 0.1470 DRlR -14.484** 10.368 0 LREXC -1.1048 0.17221 2 -1.5301 0.1301 LREXC -1.0222 0.17369 1 -5.1 177 0.0000 LREXC -0 89229 0.19946 0 DLREXC -5.6788** 0.17237 2 -1 0378 0.3026 DLREXC -9.3513"" 017246 1 1.47550.1441
b DLKEXC -16 166** 0.17374 0 LGFR -1.1932 0.44398 2 -3.7939 0.0003 LGFR -1.3444 0.48059 1 -5.8039 0.0000 LGFR -2.0695* 0.57143 0 DLGFR -4.5 169** 0.40680 2 -4.051 8 0.0001 DLGFR -1 1.968** 0.44519 1 3.8738 0.0002 DLGFR -16.925** 0.48304 0 LMcap 2.5629 0.10839 2 -1.8194 0.0727 LMcap 2.1038 0.10998 I -4.5852 0.0000 LMcap 1.0907 0.12314 0 DLMcap -6.8721 ** 0.1 1206 2 1.0898 0.2792 DLMcap -8.4625** 0.11219 1 1.1010 0.2743 DLMcap -14.032** 0.11234 0 LIQ 1.8128 0.13507 2 -3.5902 0.0006 LIQ 1.2587 0.14500 1 -6.1335 0.0000 LIQ 0.62709 0.17542 0 DLIQ -6.3791** 0.13716 2 -0.92916 0.3557 DLlQ -1 1.745** 0.13704 1 3.3322 0.0013
A DLlQ -1 7.556** 0.14554 0 L,TDO 0.59932 0.21202 2 -1.3046 0.1959 LTDO 0.53379 0.21298 1 -4.0052 0.0001 LT DO 0.42215 0.23237 0 DLTDO -7.1955** 0.20893 2 1.6330 0.1066 DLTDO ' -8.2222** 0.21 115 1 1.2821 0.2036 DLTDO -12.448** 0.21201 0 LINV 3.8610 0.18532 2 -2.5151 0.0140 IJNV 3 0883 0.19154 1 -4.7968 0.0000 LINV 1.8333 0.21658 0 DLlNV -7.2046** 0.19958 2 1.4980 0.1382 DLINV -8.4819** 0.201 16 1 1.1678 0.2464 DLINV -1 3.793** 0.20162 0
EQ( 1) Modelling FD by OLS
The present sample is: 1986 ( I ) to 2006 (4)
1)epartnzent of' Economics, University of Nigeria Nsukkn 96 of 108

MSc Dissertation; Glohalised Financialjlows, Cc~pital nzarlcct deepening, and Econotnic Growth: Nigerian Experience ... .. - - ~
Variable Coefficient Std.Error t-value t-prob PartRy
IFD -0.0094472 0.01 123 1 -0.841 0.4029 0.0093
RGDPg 0.012356 0.0069753 1.771 0.0806 0.0402
RIR 0.0014243 0.00097765 1.457 0.1493 0.0275
REXC -0.000898 10 0.00028966 -3.101 0.0027 0.11 36
GFR -0.01 5971 0.0088648 -1.802 0.0756 0.0415
Mcap 0.1275 1 0.0055370 23.029 0.0000 0.876 1
1 Q -0.01 3641 0.0014829 -9.199 0.0000 0.5301
TDO 0.0043194 0.0012761 3.385 0.001 1 0.1325
INV -4.3359e-006 4.1749e-006 -1.039 0.3023 0.0142
Ry = 0.990681 2 = 0.125254 DW - 1.59
* Ry does NOT allow for the mean *
RSS = 1.176633672 for 9 variables and 84 observations
Residual added to database
Residual = Residual values of equation 1
Unit root tests 1986 (4) to 2006 (4)
Critical values: 5%:- 1.944 1 %--2.592
t-adf i lag t-lag t-prob
Residual -2.9333** 0.1 1 1 1 1 2 -2.4594 0.0161
Residual -4.3203** 0.11461 1 -2.3551 0.0210
Residual -7.3854** 0.1 1782 0
Solved Static Long Run equation
FD = -0.009447 IFD +0.0 I236 RGDPg +0.001424 RIR
(SE) ( 0.01 123) ( 0.006975) (0.0009776)
-0.0008981 REXC -0.0 1597 GFR +O. 1275 Mcap
(0.0002897) ( 0.008865) ( 0.005537)
-0.01 364 IQ +O.OO43 19 TDO -4.336e-006 INV
( 0.001483) ( 0.001 276) (4.175e-006)
ECM added to database
Analysis of lag structure
L a g O 1 2 3 4 5 a
FD -1 0 0 0 0 0 - I
Std.Err 0 0 0 0 0 0 0
IFD -0.00945 0 0 0 0 0-0.00945
Std.Err 0.0112 0 0 0 0 0 0.01 12
RGDPg 0.0124 0 0 0 0 0 0 . 0 1 2 4
Std.Err 0.00698 0 0 0 0 0 0.00698
RI R 0.00142 0 0 0 0 00.00142
~ t d . ~ ? r 0.000978 0 0 0 0 0 0.000978
Deprrrtment @'Ecnnonrics, University of Nigeria Nsukkrr 97 of 108
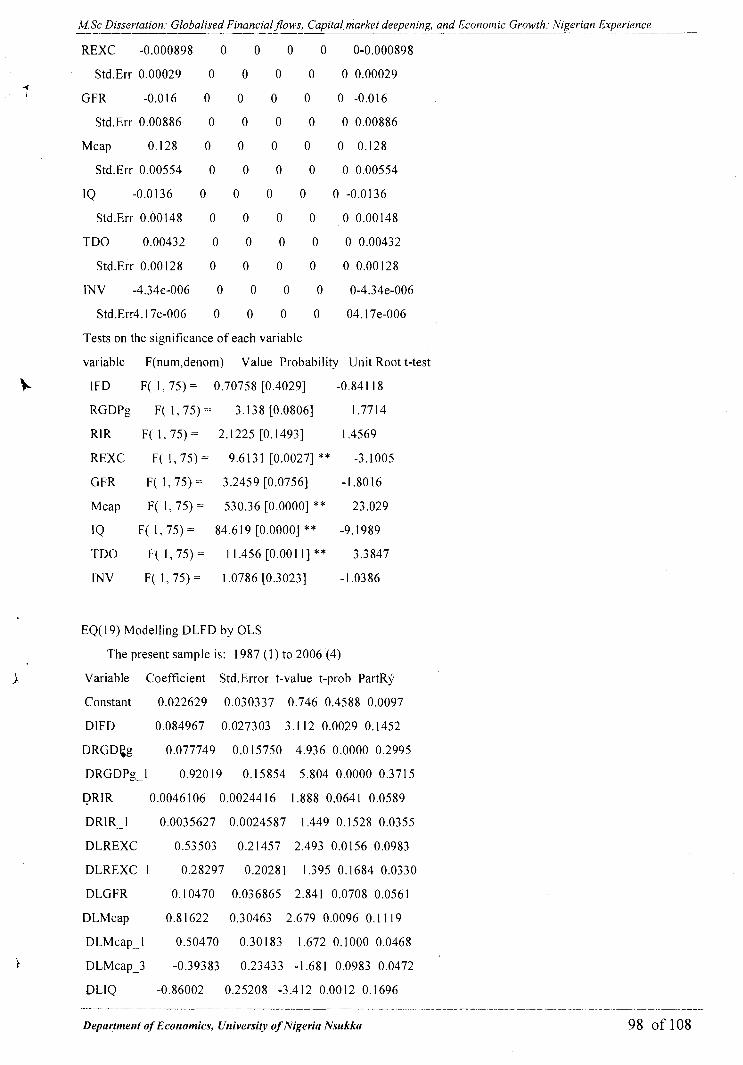
hLSc Dissertation: Globalised Financialflows, Capital, rnarlcet deepening, and Economic Growth: Nigerian Experience -. ~ ~ . - . . . . .~
REXC -0.000898 0 0 0 0 0-0.000898
Std.Err 0.00029 0 0 0 0 0 0.00029
GFR -0.016 0 0 0 0 0 - 0 . 0 1 6
Std.Err 0.00886 0 0 0 0 0 0.00886
Mcap 0.128 0 0 0 0 0 0 . 1 2 8
Std.Err 0.00554 0 0 0 0 0 0.00554
I Q -0.0136 0 0 0 0 0-0 .0136
Std.Err0.00148 0 0 0 0 00 .00148
TDO 0.00432 0 0 0 0 00 .00432
Std.Err0.00128 0 0 0 0 00 .00128
INV -4.34e-006 0 0 0 0 0-4.34e-006
Std.Err4.17e-006 0 0 0 0 04.17e-006
Tests on the significance of each variable
variable F(num,denom) Value Probability lJnit Root t-test
IFD F( 1, 75) = 0.70758 [0.4029] -0.841 18
RGDPg F( 1, 75) :: 3.138 [0.0806] 1.7714
RIR F( 1, 75) - 2.1225 [0.1493] 1.4569
REXC F( 1, 75) == 9.6131 [0.0027] * * -3.1005
GFR F( 1, 75) - 3.2459 [0.0756] -1.8016
Mcap F( 1, 75) - 530.36 [0.0000] * * 23.029
IQ F( 1 , 75) = 84.61 9 [0.0000] ** -9.1 989
TDO F ( 1 , 7 5 ) = 11.456[0.0011]** 3.3847
INV F( 1, 75) = 1 .O786 [0.3023] -1 .O386
EQ(19) Modelling DLFD by OLS
The present sample is: 1987 ( I ) to 2006 (4)
J Variable Coefficient Std.Error t-value t-prob PartRy
Constant 0.022629 0.030337 0.746 0.4588 0.0097
DlFD 0.084967 0.027303 3.1 12 0.0029 0.1452
DRGDgg 0.077749 0.015750 4.936 0.0000 0.2995
DRGDPg 1 0.92019 0.15854 5.804 0.0000 0.371 5
DRIR 0.00461 06 0.00244 16 1.888 0.0641 0.0589
DRIR--1 0.0035627 0.0024587 1.449 0.1 528 0.0355
DLREXC 0.53503 0.21457 2.493 0.01 56 0.0983
DLREXC-1 0.28297 0.2028 1 1.395 0. 1684 0.0330
DLGFR 0.1 0470 0.036865 2.841 0.0708 0.0561
DLMcap 0.8 1622 0.30463 2.679 0.0096 0.1 1 19
D1,Mcap -1 0.50470 0.30183 1.672 0.1000 0.0468
DLMcap-3 -0.39383 0.23433 -1.681 0.0983 0.0472
DLIQ -0.86002 0.25208 -3.412 0.0012 0.1 696
Depnrtnlent of Economics, University of Nigerk N.mkkn 98 of 108

MSc Dissertation: Globalised Financialflows, Capital market deepening, and Economic Growth: Nigerian Experience ~ -. -. ~ - --
DLQl -0.63624 0.24904 -2.555 0.0133 0.1027
DLIQ-3 0.52607 0.1 91 52 2.747 0.0080 0.1 169
DLTDO-3 -0.089983 0. I6 I98 -0.556 0.5807 0.0054
DLINV,-2 -0.2 1948 0.14467 -1.5 17 0.1348 0.0388
DLINV-3 -0.3 I863 0.16550 -1.925 0.0592 0.061 1
ECM-I -0.54647 0.097416 -5.610 0.0000 0.3557
Ry = 0.680065 F(22, 57) = 5.5073 [0.0000] 2 = 0.2 13408 DW = 2.20
RSS = 2.595940059 for 19 variables and 80 observations
Autoregressive-distributed lag model of DLFD on DIFD
Autoregression part has lags 1 to 8
Distributed Lag part has lags 1 to 8
'The present sample is: 1988 (2) to 2006 (4)
Autoregression
Lag 1 Lag 2 Lag 3 Lag 4 Lag 5 Lag 6
Coeff. -0.6552 -0.3005 0.02434 0.3812 0.3305 0.1766
Std.Err 0.1306 0.156 0.1 581 0.1442 0.1298 0.1359
Lag 7 Lag 8
Coeff. 0.02277 0.0 1255
Std.Err 0.1 349 0.1 136
Distributed Lag
Constant Lag I Lag 2 Lag 3 Lag 4 Lag 5
Coeff. 0.041 81 -0.01 125 -0.004679 0.007853 0.04725 0.03759
Std.Err 0.03274 0.0249 0.02951 0.02993 0.02988 0.03044
Lag 6 Lag 7 Lag 8
Coeff. 0.01 51 -0.01922 0.021 73
Std.Err 0.03083 0.03087 0.02674
RSS = 3.91 4497743 6 = 0.259791 Ry - - 0.423946 b
F(16, 58) = 2.66781 [0.0033] ** Granger-Causality test for adding DIFD to DLFD:
F(8, 58) = 2.6678 [0.0033]*
Autoregressive-distributed lag model of DlFD on DLFD
Autoregression part has lags I to 8
Distributed Lag part has lags 1 to 8
The present sample is: 1988 (2) to 2006 (4)
Autoregression 1
g 3 Lag 4 Lag 5 Lag 6 .. .- . .. " . .. . .. ~
ersity of Nigcrin Nsukkn 99 of 108

M.Sc Dissertation: Globalised Financialflows, ~ Capital market deepening, and Economic Growth: Nigerian Experience - - - .--. . .. - -- - .- .- -.
Coeff. -0.6058 -0.2214 0.1456 0.01895 0.1757 0.1133
Std.Err 0.1244 0.1475 0.1496 0.1493 0.1521 0.1541
Lag 7 Lag 8
Coeff. 0.01391 -0.2032
Std.Err 0.1 543 0. I336
Distributed Lag
Constant Lag I Lag 2 Lag 3 Lag 4 Lag 5
Coeff. 0.07274 -0.527 -0.53 19 -0.3066 -0.701 7 0.222 1
Std.Err 0.1636 0.6527 0.7799 0.7901 0.7209 0.6488
Lag 6 Lag 7 Lag 8
Coeff. 0.28 15 0.2444 0.6582
Std.Err 0.6793 0.6744 0.5678
RSS == 97,79458747 P = 1.2985 Ry - 0.435692 F(16, 58) - 2.7988 [0.0022] **
Granger-Causality test for adding DLFD to DIFD:
F(8, 58) == 0.40134 [0.9153]
Autoregressive-distributed lag model of DLFD on DRGDPg
Autoregressio~i part has lags 1 to 8
Distributed Lag part has lags I to 8
The present sample is: 1988 (2) to 2006 (4)
Autoregression
Lag 1 Lag 2 Lag 3 Lag 4 Lag 5 Lag 6
Coeff. -0.6645 -0.33 18 -0.01 678 0.3776 0.301 7 0. I865
Std.Err 0.142 0.1745 0.1776 0.1603 0.1347 0.1427
Lag 7 Lag 8
Coeff. , 0.06032 0.04 l l
Std.Err 0.1424 0.1 19
Distributed Lag
Constant Lag 1 Lag 2 Lag 3 Lag 4 Lag 5
Coeff. 0.04778 0.01203 0.01253 0.005428 0.003379 0.00192
Std.Err 0.03323 0.02097 0.02537 0.02554 0.02391 0.02195
Lag 6 Lag 7 Lag 8
Coeff. -0.00997 1 -0.01 256 -0.03444
Std.Err 0.02241 0.02204 0.01786
RSS = 3.94865378 8 - 0.260922 Ry - 0.41 892 .- -. - .- . -. -. - - -. .- - , , . . . - - .. - - . -. . . .. . . , . . . . . . . -
Depnrtment of Economics, University of Nigeria Nsukku 100 of 108

M.Sc Dissertation: Cilohalised Financial flows, Capital erience - . .- ....... - . . . . . . . . .... ....
F(16, 58) - 2.61338 [0.0039] * *
' 2 Granger-Causality test for adding DRGDPg to DLFD:
F(8, 58) = 2.6153 [0.0039]
Autoregressive-distributed lag model of DKGDPg on DLFD
Autoregression part has lags I to 8
Distributed Lag par1 has lags 1 to 8
The present sample is: 1988 (2) to 2006 (4)
Autoregression
Lag I Lag 2 Lag 3 Lag 4 Lag 5 Lag 6
Coeff. -0.61 18 -0.2642 0.1 38 0.06301 0.2538 0.1388
Std.Err 0.1384 0.1675 0.1686 0.1578 0.1449 0.1479
Lag 7 Lag 8
b Coeff. -0.02 192 -0.08694
Std.Err 0.1455 0.1 179
Distributed Lag
Constant Lag I Lag 2 Lag 3 Lag 4 Lag 5
Coeff. -0.03838 0.4914 0.667 0.038 1.141 -0.477
Std.Err 0.2194 0.9377 1.152 1.172 1.058 0.8893
Lag 6 Lag 7 Lag 8
Coeff. -0.3925 0.1 15 -0.7407
Std.Err 0.9422 0.94 0.7855
RSS = 172.1 134249 i = 1.72264 Ry = 0.46275
Granger-Causality test for adding DLFD to DRGDPg:
C
MODEL 4
---- PcGive 8.00, copy for rneuller ----
---- session started at 6:23:04 on 5th January 2008 ----
Unit root tests 1987 ( I ) to 2006 (4)
Critical values: 5%--1.944 1%=z-2.592
t-adf i lag t-lag t-prob RGDPg -0.32135 1.8346 2 -3.4332 0.0010 RGDPg -0.82379 1.9574 1 -5.5107 0.0000 RGDPg -1.9139 2.2925 0 FD 2.9493 0.19362 2 -2.3667 0.0205 FD.. 2.1406 0.19924 1 -4.8991 0.0000
1)epnrtmeni of Economics, Universiiy of Nigcrin Nsukkn

M.Sc Dissertation: Globalised Financial flows, Cauital nzurlcef deeuening, and Economic Growth: Nigerian Exuerience
F D IFD IFD
'1 IFD FPI FPI FPl RlR RlR Rl R REXC REXC REXC GFR GFR GFR Mcap Mcap Mcap IQ 1Q 1Q
-mmilf' TDO TDO TDO IN V IN V IN V DRGDPg DRGDPg DRGDPg LFD LFD LFD DLFD DLFD DLFD DlFD DlFD DlFD DFPl DFPl DFPl DRlR DRlR DRIR LRRXC LREXC LKEXC DLREXC DLREXC DLREXC LGFR LGFR LGFR DLGFR DLGFR DLGFR 1,Mcap LMcap
Department of Econonlics, University of Nigeria Nsukkn 102 of 108
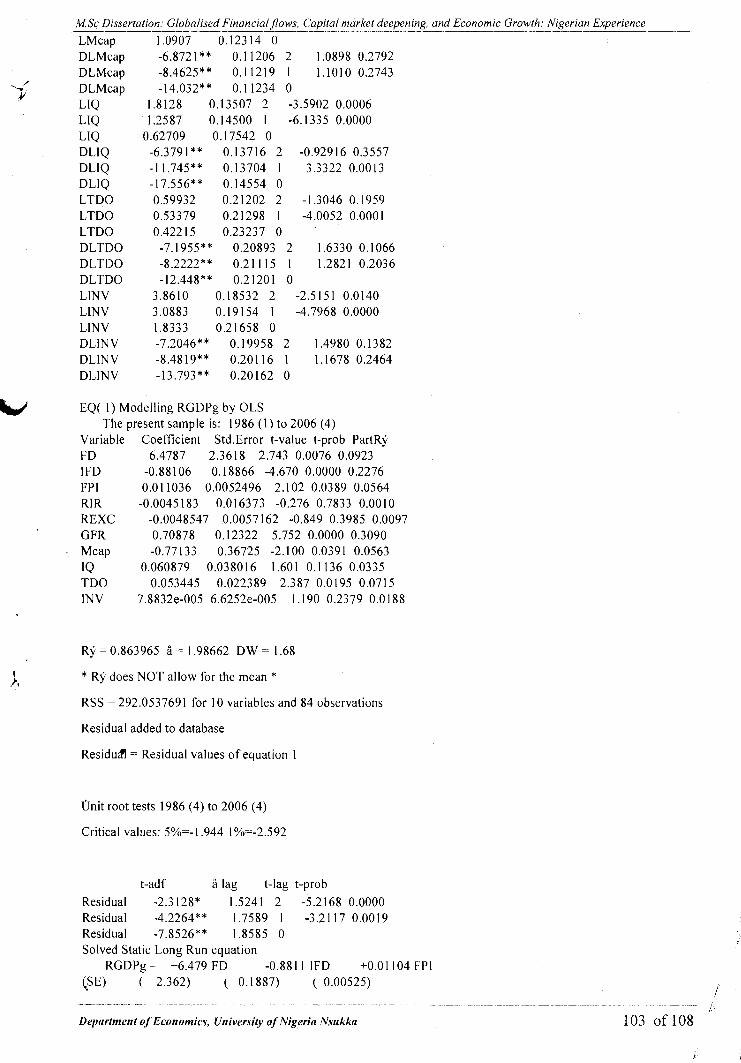
MSc Dissertution: Globulised FinnnciulJows, Capital nzurliet deepening, and Economic Growth: Nigerian Experience - -- - - . .. -.-." . .- LMcap 1.0907 0.12314 0 D L M ~ ~ ~ DLMcap DLMcap LIQ LIQ LIQ DLIQ DLIQ DLlQ LTDO LTDO LTDO DLTDO DLTIIO DLTDO LlNV LlNV LlNV DLINV DLINV DLINV
EQ( I) Modelling RGDPg by 0L.S The present sample is: 1986 ( I ) to 2006 (4)
Variable Coefficient Std.Error t-value t-prob PartRy F D 6.4787 2.3618 2.743 0.0076 0.0923 I FD -0.88106 0. 18866 -4.670 0.0000 0.2276 FP I 0.01 1036 0.0052496 2.102 0.0389 0.0564 RIR -0.0045 183 0.01 6373 -0.276 0.7833 0.00 10 REXC -0.0048547 0.0057162 -0.849 0.3985 0.0097 G FR 0.70878 0.12322 5.752 0.0000 0.3090 Mcap -0.77133 0.36725 -2.100 0.0391 0.0563 1 Q 0.060879 0.038016 1.601 0.1 136 0.0335 TDO 0.053445 0.022389 2.387 0.0195 0.0715 IN V 7.8832e-005 6.6252e-005 1.190 0.2379 0.01 88
Ry = 0.863965 - 1.98662 DW = 1.68
* Ry does NOT allow for the mean * RSS = 292.0537691 for 10 variables and 84 observations
Residual added to database
Residua == Residual values of equation 1
onit root tests 1986 (4) to 2006 (4)
Critical values: 5%=-1.944 1%--2.592
t-adf i lag t-lag t-prob Residual -2.3 l28* 1.5241 2 -5.2168 0.0000 Residual -4.2264** 1.7589 1 -3.21 17 0.001 9 Residual -7.8526** 1.8585 0 Solved Static Long Run equation
RGDPg = +6.479 FD -0.881 1 IFD +0.01104 FPI (:E) ( 2.362) ( 0.1887) ( 0.00525)
- . .. . ... . .... . .. . . i
Depnrtment qf' Economics, University of' Nigeria Nsukka 103 of 108

M Sc Dissertation: Glohallsed Financral flows, Capital nzarlcet deepenzng, and Economic Growth. Nigerian Experience
-0.00451 8 RIR -0.004855 REXC +0.7088 GFR ( 0.01637) ( 0.005716) ( 0.1232)
-0.7713 Mcap +0.06088 IQ +0.05345 TDO
'1 ( 0.3673) ( 0.03802) ( 0.02239) +7.883e-005 INV
-6.63E-05 WALD test ChiM10) = 469.98 [0.0000] **
Analysis of lag structure L a g 0 1 2 3 4 5 1
RGDPg - 1 0 0 0 0 0 - 1 Std.Err 0 0 0 0 0 0 0
F D 6.48 0 0 0 0 0 6.48 Std.Err 2.36 0 0 0 0 0 2.36
IFD -0.881 0 0 0 0 0 - 0 . 8 8 1 Std.Err 0.189 0 0 0 0 0 0.189
FPI 0.01 1 0 0 0 0 0 0.01 1 Std.Err 0.00525 0 0 0 0 0 0.00525
RIR -0.00452 0 0 0 0 0 -0.00452 Std.Err 0.0164 0 0 0 0 0 0.0164
REXC -0.00485 0 0 0 0 0 -0.00485 Std.Err 0.00572 0 0 0 0 0 0.00572
GFR 0.709 0 0 0 0 0 0 . 7 0 9 Std.Err 0.123 0 0 0 0 0 0.123
d Mcap -0.771 0 0 0 0 0 -0.771 Std.Err 0.367 0 0 0 0 0 0.367
IQ 0.0609 0 0 0 0 0 0 . 0 6 0 9 Std.Err 0.038 0 0 0 0 0 0.038
TDO 0.0534 0 0 0 0 0 0 . 0 5 3 4 Std.Err 0.0224 0 0 0 0 0 0.0224
INV 7.88e-005 0 0 0 0 07.88e-005 Std.Err6.63e-005 0 0 0 0 06.63e-005
Tests on the significance of each variable variable F(num,denom) Value Probability Unit Root t-test
FD F( 1, 74) = 7.5248 [0.0076] ** 2.743 1 IFD F( 1, 74) = 2 1.8 1 [0.0000] ** -4.6702 FPI F( 1,74) = 4.4196 [0.0389] * 2.1023 RIR F( 1, 74) = 0.0761 59 [0.7833] -0.27597 FEXC F( 1, 74) = 0.72 13 1 [0.3985] -0.8493 GFR F( I, 74) = 33.088 [0.0000] ** 5.7522 Mcap F( 1, 74) - 4.41 12 [0.0391] * -2.1003
k IQ F( I, 74) = 2.5644 [0.1 1361 1.6014 TDO F( I, 74) = 5.6983 [0.0195] * 2.3871 INV F( 1,74) = I ,4158 [0.2379] 1.1899
Solved Static Long Run equation DRQDPg = +3.444 +0.005867 FPI -0.002402 RIR
(SE) ( 1.234) ( 0.002539) ( 0.008685) -0.00258 1 REXC +0.3768 GFR -0.41 Mcap ( 0.00306) ( 0.06423) ( 0.1909)
+0.03236 IQ +0.02841 TDO t4.191e-005 1NV ( 0.02005) ( 0.01 179) (3.555e-005)
ECM added to database WALD test ChiM8) - 142.34 [0.0000] **
Analysis of lag structure L a g 0 1 2 3 4 5 1
DRGDPg - 1 - 0 . 8 8 1 0 0 0 0 -1.88 Std.Err 0 0 . 1 8 9 0 0 0 0 0 . 1 8 9
Constant 6.48 0 0 0 0 0 6.48 .Std.Err 2.36 0 0 0 0 0 2.36
Drpnrtmrnt of Econonzics. Universi[y of Nigeria Nsukka 104 of 108

M Sc D~ssertatlon Globalrsed Frnancrul flows (hprtal nzarltet deepenrng, and Econonrlc Growth Nlger~an Experrerice - - -- - - - - - - - - --- - - - - -- - - - - - - - - - - --
FPI 0011 0 0 0 0 0 0011 Std.Err 0.00525 0 0 0 0 0 0.00525
RIR -0.00452 0 0 0 0 0-0.00452 Std.Err 0.0164 0 0 0 0 0 0.0164
REXC -0.00485 0 0 0 0 0 -0.00485 Std.Err 0.00572 0 0 0 0 0 0.00572
GFR 0.709 0 0 0 0 0 0.709 Std.Err 0.123 0 0 0 0 0 0.123
Mcap -0.771 0 0 0 0 0 - 0 . 7 7 1 Std.Err 0.367 0 0 0 0 0 0.367
IQ 0.0609 0 0 0 0 0 0 . 0 6 0 9 Std.Err 0.038 0 0 0 0 0 0.038
TDO 0.0534 0 0 0 0 0 0 . 0 5 3 4 Std.Err 0.0224 0 0 0 0 0 0.0224
INV 7.88e-005 0 0 0 0 07.88e-005 Std.Err6.63e-005 0 0 0 0 06.63e-005
Tests on the significance of each variable variable F(num,denom) Value Probability Unit Root t-test
DRGDPg F( 1, 74) 21.81 [0.0000] * * -9.9708** Constant F( 1, 74) = 7.5248 [0.0076] * * 2.743 1 FPI F( 1, 74) - 4.4196 [0.0389] * 2.1023 RIR F( 1, 74) 0.0761 59 [0.7833] -0.27597 REXC F( 1 , 74) - 0.7213 1 [0.3985] -0.8493 GFR F( 1,74) = 33.088 [0.0000] * * 5.7522 Mcap F( 1, 74) - 4.41 12 [0.0391] * -2.1003 1Q F( 1, 74) - 2.5644 [O. 1 1361 1.6014 TDO F( 1, 74) - 5.6983 [0.0195] * 2.3871 INV F( 1 , 74) =- 1.4158 [0.2379] 1.1899
Tests on the significance of each lag Lag F(num,denom) Value Probability
1 F( 1,74) = 2 1.81 [0.0000] * * Tests on the significance of all lags up to 1 Lag F(num,denom) Value Probability
1 -1 F ( 1 , 7 4 ) = 21.81[0.0000]**
EQ(24) Modelling DRGDPg by OLS
The present sample is: 1987 ( I ) to 2006 (4)
Variable Coefficient Std.Error t-value t-prob PartRy
Constant -1.0622 0.40420 -2.628 0.0 1 10 0.1081
DLFIf 2.9180 0.85536 3.411 0.0012 0.1696
DLFD-1 1.7156 0.87824 1.953 0.0557 0.0627
' D I F D ~ 0.12928 0.96426 2.0127 0.3683 0.0142
DFP I 0.00713 14 0.00327 2.180 0.1007 0.0466
DFPI-I 0.0039279 0.004 I266 0.952 0.3452 0.01 56
DRlR -0.0388 18 0.020839 -1.863 0.0677 0.0574
DRIR-3 -0.01 21 69 0.022643 -0.537 0.593 1 0.0050
DLREXC-1 -0.79930 1.5 155 -0.527 0.6000 0.0049
DLREXC-3 3.9984 1.4443 2.768 0.0076 0.1 185
= DLGFR 1.0861 0.44786 2.425 0.01 85 0.0935 ..
Uepnrtnient of Economics, University of Nigerin Nsukkn

M.Sc Dissertation: Globalised Financid flows, Capital market deepening, and Econonzic Growth: Nigerian Experience ................. .................. ....................
D1,GFR-3
DLMcap-2
DLMcap-3
DLlQ
DLIQ.. 1
DLTDO
DLTDO -3
DLINV
DLINV-1
ECM- I
Icy = 0.547026 F(22, 57) - 3.1 289 [0.0003] A = 1.85767 DW =: 2.00
KSS = 196.704246 for 23 variables and 80 observations
. . - -. .- .-....-.............-........ .................
1)epartment of Economics, University of Nigerici Nsukka 106 of 108

M Sc Drssertatron Globalrsed FrnancralJlows, C'aprtal nzarlcet deepenrng, and Econnnzrc Growth Ngerran Experzence - - - - - - - - - . - -- -.- - -
APPENDIX B Residual correlogram
80*(Sum of 3 squared autocorrelations) - 4.285
- 1 0 1
1%
Autoregression for Residual: 3 lags from 1 to 3
The present sample is: 1987 (4) to 2006 (4)
Constant Lag 1 Lag 2 Lag 3
Coeff. 0.002 144 -0.02965 0.08777 0.2244
Std.Err 0.02039 0.1 155 0.1 159 0.1 157
RSS - 2.32641 8308 i - 0.1785 18 Rf : 0.055 1854
F(3, 73) 1.42128 [0.2435]
Testing for Error Autocorrelation from lags 1 to 3
Chif(3) = 4.999 [O. 171 91 and F-Form(3, 54) - 1.1997 [O.3 1871
Error Autocorrelation Coefficients:
1,ag 1 I , a g 2 I , a g 3
Coeff. 0.101 1 0.1303 0.2494
Normality test for Residual
The present sample is: 1987 (1) to 2006 (4)
Samplesize 80
Meah -0.000000
Std.Devn. 0.176952
.Skewness 0.01 1542
Excess Kurtosis -0.304750
Minimum -0.43646 1
Maximum 0.42086 1
Normality Chif(2). 0.01 0574 [0.9947]
Testing for Heteroscedastic errors
Chiy(44) = 48.984 [0.2799] and F-Form(44, 12) - 0.43073 [0.9789]
Department of Economics, University of Nigeria Nsukkn 107 of 108
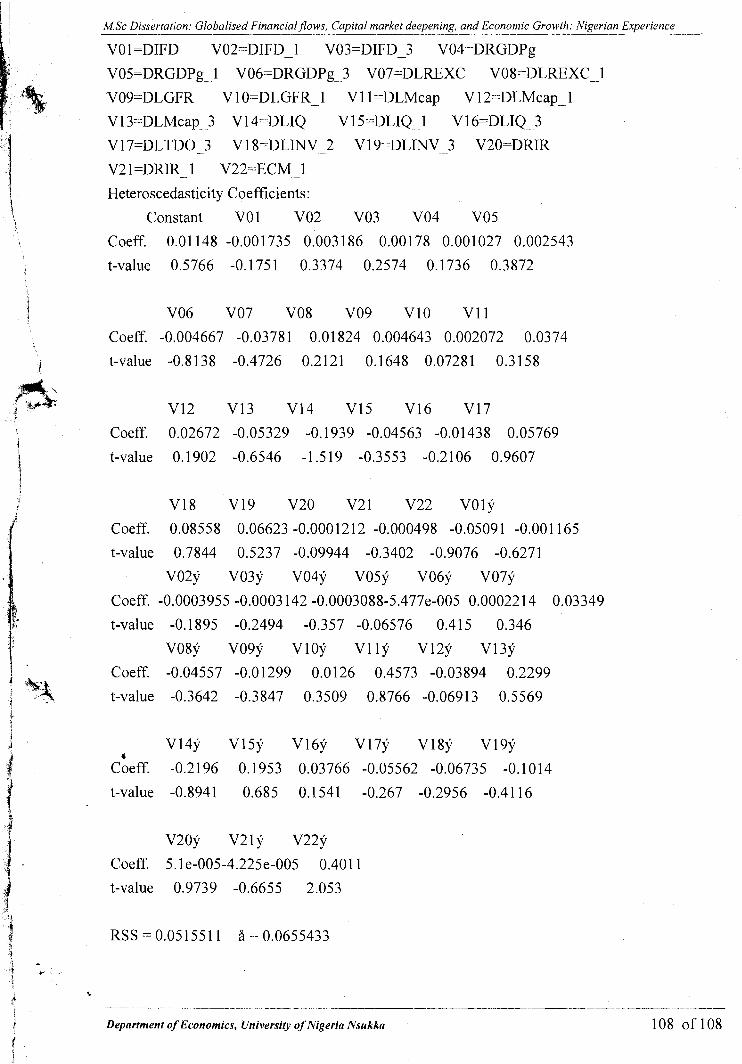
MSc Dissertation: Globalised Financial flows, Capital market deepening, and Economic Growth: Nigerian Experience --p.p-p----...--..---------.-
VO 1 =DIFD V02=DIFD -- 1 V03=DIFD-3 V04-DKGDPg
VO5-DRGDPg - 1 V06=DKGDPg..3 V07-DLREXC VO8=DLREXC.__l
V09=DLGFR V 10-DLGFK 1 V 1 1 ==DLMcap V 12-DLMcap - 1
V 13-DLMcap 3 V 14::DLIQ V 15-DLIQ.. 1 V 16==DLIQ. 3
V 17=DLTDO . .. 3 V 1 8-DLINV-2 V 19:-DLINV - 3 V20=DRIR
V2 1 =DRIR 1 V22-ECM -1
Heteroscedasticity Coefficients:
Constant V01 V02 V03 V04 V05
Coeff. 0.01 148 -0.001735 0.003 186 0.00178 0.001027 0.002543
t-valuc 0.5766 -0.175 1 0.3374 0.2574 0.1736 0.3872
1 V06 V07 V08 V09 V10 V11
Coeff. -0.004667 -0.03781 0.01824 0.004643 0.002072 0.0374
1 t-value -0.8138 -0.4726 0.2121 0.1648 0.07281 0.3158
Coeff. 0.02672 -0.05329 -0.1939 -0.04563 -0.01438 0.05769
t-value 0.1902 -0.6546 -1.5 19 -0.3553 -0.2106 0.9607
V18 V19 V20 V21 V22 VO1f
Coeff. 0.08558 0.06623 -0.000121 2 -0.000498 -0.05091 -0.001 165
t-value 0.7844 0.5237 -0.09944 -0.3402 -0.9076 -0.6271
V029 V03f V049 V05y V06y V07y
Coeff. -0.0003955 -0.0003 142 -0.0003088-5.477e-005 0.000221 4 0.03349
t-value -0.1 895 -0.2494 -0.357 -0.06576 0.41 5 0.346
VO8y V09y VlOy V l l y V12y V13y
Coeff. -0.04557 -0.01299 0.0126 0.4573 -0.03894 0.2299
t-value -0.3642 -0.3847 0.3509 0.8766 -0.0691 3 0.5569
V14y V15y V16y V17y V18y V19y 0
Coeff. -0.21 96 0.1953 0.03766 -0.05562 -0.06735 -0.1014
t-value -0.8941 0.685 0.1541 -0.267 -0.2956 -0.4116
v20y v21y v22y
Coeff. 5.1e-005-4.225e-005 0.401 1
t-value 0.9739 -0.6655 2.053
k
1 :'
KSS = 0.05 155 1 1 5 - 0.0655433 t

M.Sc Dissertation: Globalised FinancialJows, Capital rnarlcet deepening, and Economic Growth: Nigerian Experience --- - -- -- -- VO 1 =DIFD V02=DIFD - 1 V03=DIFD-3 VO4=DRGDPg
V09=DLGFR V 10-DLGFR 1 V 1 1 =DLMcap V 12=DLMcap- 1
V13-DLMcap 3 V14---DLIQ Vl5-DLIQ 1 V16=DLIQ 3
V 17=DLTDO 3 V 18--DLINV.-2 V 19. DLINV 3 V20=DRIR
V2 1 =DRIR -- 1 V22-ECM _ 1
Heteroscedasticity Coefficients:
Constant V0 1 V02 V03 V04 V05
Coeff. 0.01 148 -0.001 735 0.003 186 0.00178 0.001027 0.002543
t-value 0.5766 -0.1751 0.3374 0.2574 0.1736 0.3872
V06 V07 VO8 V09 V10 V11
Coeff. -0.004667 -0.0378 1 0.01 824 0.004643 0.002072 0.0374
t-value -0.81 38 -0.4726 0.2121 0.1648 0.07281 0.3 158
V12 V13 V14 V15 V16 V17
Coeff. 0.02672 -0.05329 -0.1939 -0.04563 -0.01438 0.05769
t-value 0.1902 -0.6546 -1 S l 9 -0.3553 -0.2106 0.9607
V18 V19 V20 V21 V22 VO1y
Coeff. 0.08558 0.06623 -0.0001212 -0.000498 -0.05091 -0.001 165
t-value 0.7844 0.5237 -0.09944 -0.3402 -0.9076 -0.6271
V02y V03y V04y V05y V06y V07y
Coeff. -0.0003955 -0.0003 142 -0.0003088-5.477e-005 0.00022 14 0.03349
t-value -0.1895 -0.2494 -0.357 -0.06576 0.41 5 0.346
VOSy V09y VlOy V l l y V12y V13y
Coeff. -0.04557 -0.01299 0.0126 0.4573 -0.03894 0.2299
t-value -0.3642 -0.3847 0.3509 0.8766 -0.06913 0.5569
V14y V15y V169 V17y V18y V19y
Coeff. -0.2196 0.1 953 0.03766 -0.05562 -0.06735 -0.1014
t-value -0.8941 0.685 0.1541 -0.267 -0.2956 -0.41 16
v20y v21y v22y
Coeff. 5.1e-005-4.225e-005 0.401 1
t-value 0.9739 -0.6655 2.053
RSS = 0.051551 1 ii == 0.0655433
Department of Economics, Universi[v of Nigeria Nsukka 108 of 108