irish trade unions in a globalised world
DESCRIPTION
Irish Trade Unions in a Globalised World. Jack O’ Connor General President SIPTU. ICTU Economic Conference April 2008. Leading by Example?. Irish Trade Unions in a Globalised World. Jack O’ Connor General President SIPTU. ICTU Economic Conference April 2008. - PowerPoint PPT PresentationTRANSCRIPT

Irish Trade Unions in a Globalised World
Jack O’ ConnorGeneral President
SIPTU
ICTU Economic Conference April 2008

Leading by Example?
CRH 2.79m (W I O’Mahony)
Smurfit Kappa 2.6m (Gary McGann)
IL&P 1.36m (Denis Casey)
B of I 4.0m (Brian Goggin)
Diageo 3.75m (Paul Walsh)
AIB 2.40m (Eugene Sheehy)
Tullow Oil 1.6m (Aidan Heavey)
Kerry Foods 1.2m (Hugh Friel)1.0m (Denis Creegan, CFO)
Ryan Air 1.0m (992 (Michael O’Leary)
Glanbia 927,000 (John Malony)
Irish Trade Unions in a Globalised World
Jack O’ ConnorGeneral President
SIPTU
ICTU Economic Conference April 2008
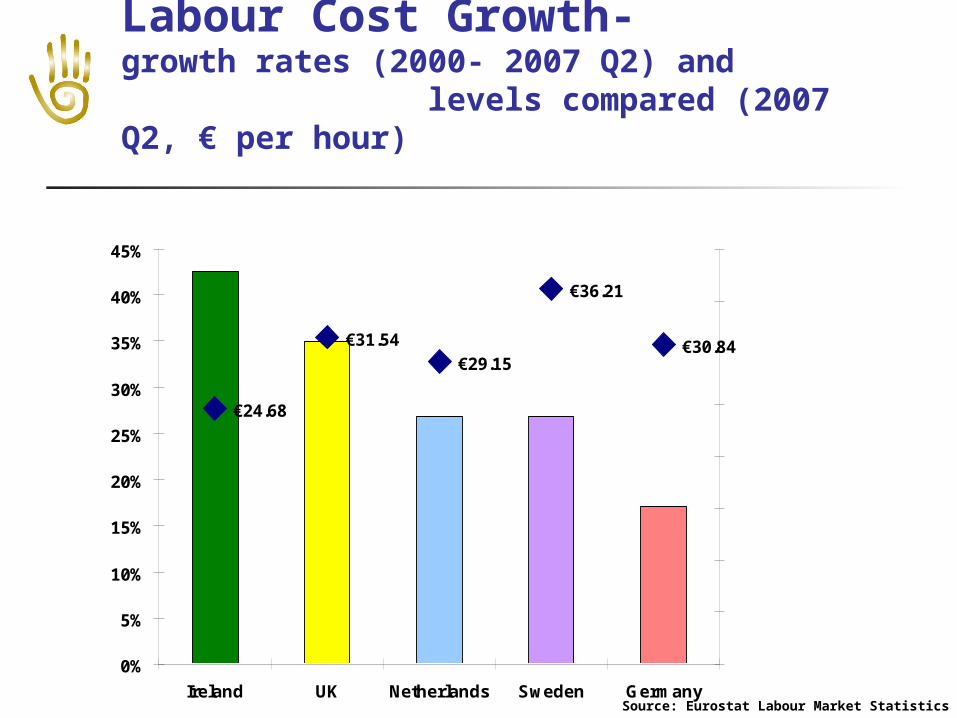
Labour Cost Growth- growth rates (2000- 2007 Q2) and levels compared (2007 Q2, € per hour)
€24.68
€31.54
€29.15
€36.21
€30.84
0%
5%
10%
15%
20%
25%
30%
35%
40%
45%
Ireland UK Netherlands Sweden Germany
€0.00
€5.00
€10.00
€15.00
€20.00
€25.00
€30.00
€35.00
€40.00
Source: Eurostat Labour Market Statistics

The Competition: labour cost rates and labour cost levels compared
(2000-2007 Q2)
€24.68
€7.13
€4.87€6.27
0%
20%
40%
60%
80%
100%
120%
140%
160%
180%
Ireland Poland Lithuania Latvia
€0.00
€5.00
€10.00
€15.00
€20.00
€25.00
€30.00
Source: Eurostat Labour Market Statistics
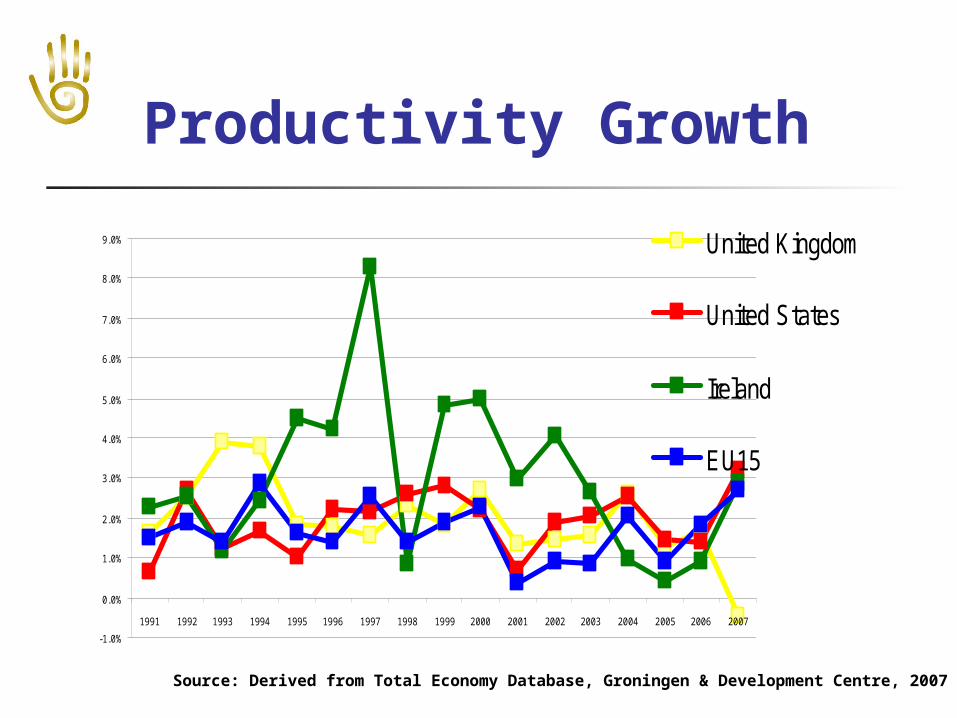
Productivity Growth
-1.0%
0.0%
1.0%
2.0%
3.0%
4.0%
5.0%
6.0%
7.0%
8.0%
9.0%
1991 1992 1993 1994 1995 1996 1997 1998 1999 2000 2001 2002 2003 2004 2005 2006 2007
United Kingdom
United States
Ireland
EU15
Source: Derived from Total Economy Database, Groningen & Development Centre, 2007

Productivity Levels
Source: Derived from Total Economy Database, Groningen & Development Centre, 2007
45,000
55,000
65,000
75,000
85,000
95,000
$
United Kingdom
United States
Ireland
EU15

Irish Trade Unions in a Globalised World
Jack O’ ConnorGeneral President
SIPTU

Government spending as % GDP
0
10
20
30
40
50
60
Health Education Total GovernmentExpenditure
% of GDP
%
Ireland US
UK Germany
Denmark Swedan
Source: OECD

Still well within the SGP guidelines for General Government Balance as
% of GDP
-3.5
-3
-2.5
-2
-1.5
-1
-0.5
0
0.5
1
2007 2008(f) 2009(f) 2010(f)
%
General Government Balance
Limit to General GovernmentDeficit under SGP
Source: Dept. of Finance

And much scope within the SGP guidelines for Government Debt to GDP ratio to increase in order to fund capital spending…
0
10
20
30
40
50
60
70
2007 2008(f) 2009(f) 2010(f)
%
Government Debt to GDP Ratio
Limit to Government Debt to GDPRatio under SGP
Source: Dept. of Finance
Irish Trade Unions in a Globalised World
Jack O’ ConnorGeneral President
SIPTU