global warming and sea level rising: impact on...
TRANSCRIPT

Global Warming and Sea Level Rising: Impact on Bangladesh Agriculture and Food Security
Final Report CF # 10/07
By
M. A. Halim Khan, Principal InvestigatorM. A. Awal, Co-Investigator
Department of Crop BotanyBangladesh Agricultural University
April 2009
This study was carried out with the support of the
National Food Policy Capacity Strengthening Programme

2
This study was financed under the Research Grants Scheme (RGS) of the National Food Policy Capacity Strengthening Programme (NFPCSP). The purpose of the RGS was to assist in improving research and dialogue within civil society so as to inform and enrich the implementation of the National Food Policy. The NFPCSP is being implemented by the Food and Agriculture Organization of the United Nations (FAO) and the Food Planning and Monitoring Unit (FPMU), Ministry of Food and Disaster Management with the financial support of EU and USAID.
The designation and presentation of material in this publication do not imply the expression of any opinion whatsoever on the part of FAO nor of the NFPCSP, Government of Bangladesh, EU or USAID and reflects the sole opinions and views of the authors who are fully responsible for the contents, findings and recommendations of this report.

3
Global Warming and Sea Level Rising: Impact on Bangladesh
Agriculture and Food Security
I. Executive summary
Total coastal area of Bangladesh is about 47,203 km2 covering 19 districts dominantly
under Barisal, Khulna and Chittagong Divisions where 35 millions people, about 28% of
total country’s population live. Climatologically, the entire coastal belt of Bangladesh is
most vulnerable than the other parts of the country due to its special geo-morphological
characteristics. The Bangladesh coast is located in between the Indian coast and Myanmar’s
peninsula that formed on top of a cone/funnel shaped sea-land structure which invites most
of the tropical sea-cyclones. An analysis of all of the cyclones that originated from Bay of
Bengal since 1961 indicated that most devastating cyclones formation occurred from last
quarter of April through May and from middle of October to November just prior to the
harvest of Boro and Aman crops, respectively. Therefore, Boro and Aman harvests are
mostly unpredictable every year posing great threat to the standing crops and security to the
coastal livelihoods. Most of the coastal parts and associated islands of Khulna, Barisal and
Chittagong Divisions lie within 1m from sea level where incursion of saline water is
common. It is predicated that these areas will be inundated and unsuitable for crop
production due to sea-level rising in the next 50 years. By the middle and end of the current
century, global annual mean temperature is predicted to be at the tune of 1.5 and 2.5oC,
respectively. These projected warming will lead to about 14, 32 and 88 cm sea-level rise by
2030, 2050 and 2100, respectively which would cause inundation of about 8, 10 and 16% of
total land masses in Bangladesh. Therefore, agriculture in low-lying areas is likely to
become increasingly difficult to sustain. The land mass of Bangladesh being already quite
limited and its population density one of the highest in the world, continuous land engulfing
by rising sea water will only bring grave consequences forcing the coastal people to become
climatic refugees. Cyclones and tidal surges would strengthen this process. These climatic
refugees will exert immense pressure on the already existing vulnerable food securities of
the country.
The predominant crop in entire coastal belt is Aman rice, especially transplanted Aman with
sporadic occurrences of Aus. The land in Boro season either loosely occupied by

4
mungbean, khesari, cowpea, groundnut, soybean, potato, sweet potato, chilli etc. or
remained fallow until the following monsoon. These areas are criss-crossed by innumerable
water canals/channels especially in Barisal and Khulna Divisions which can be utilized for
Boro cultivation in dry season despite some levels of salinity. Cultivation of salt-tolerant
varieties could mitigate such hindrances. Introduction of Boro rice in coastal cropping
patterns and/or advancing the harvesting times by a fortnight in both Aman and Boro
seasons to avert cyclonic havoc not only ensure food security but also turn the entire coastal
belt into a food surplus region.
5
II. Table of contents
SL. NO. CONTENTS PAGE
No.I. Executive summary i
II. Table of contents iii
III. List of tables iv
IV. List of figures iv
V. List of abbreviations and acronyms v
VI. List of annexes v
VII. List of plates vi
1. Introduction: relevance to the National Food Policy and objectives 1
2. Methodology: approach and analytical tools 2
A) Data collection 2
(a) Collection of secondary data 2
(b) Collection of primary data 2
B) Salinity level study 4
3. Results and Discussion 4
A) Global warming scenarios and its projections 4
B) Climatic scenarios of Bangladesh 4
C) Sea-level rise scenarios and Bangladesh perspective 9
D) Current status of low-lying coastal areas of Bangladesh 11
E) Livelihood and land-use patterns of coastal people 16
F) Sea level rising effects on Sundarban mangrove vegetation–a
world heritage
19
G) Model for food security 19
4. Key findings 20
5. Policy implications and recommendations 21
6. Areas for further research 22
7. Conclusions 22
8. Acknowledgments 23
9. References 24
10. Annexes 25
11. Plates 38

6
III. List of Tables
TABLE NO.
TITLE PAGE NO.
1 Features of vulnerable districts in the coastal zones of Bangladesh 122 Operated, homestead, cultivated and cropped area, 2005 143 Land utilization statistics, 2002-03 144 Distribution of major cropped areas in costal districts 155 Irrigated area in coastal regions under different means (2002-03) 156 Cropping patterns used by the coastal growers 177 Present land-use patterns in the coastal zones of Bangladesh 17
IV. List of Figures
FIGURE NO.
TITLE PAGE NO.
Fig. 1 Map of Bangladesh and study sites 3
Fig. 2 Time series of global temperature anomaly 5
Fig. 3 Time series of atmospheric CO2 concentration 5
Fig. 4 Global temperature projections to the year 2100 5
Fig. 5 Annual glacier thickness change with time 5
Fig. 6 Country average annual mean maximum and minimum temperatures of Bangladesh from 1961 to 2007
7
Fig. 7 Country mean maximum temperatures during (a) pre-monsoon, (b) south west monsoon and (c) post-monsoon seasons, and (d) mean minimum temperature during winter in Bangladesh from 1961 to 2007
7
Fig. 8 Projected warming scenarios in Bangladesh 8
Fig. 9 Country average total annual rainfall in Bangladesh from 1961 to 2007
8
Fig. 10 Country average total rainfall at (a) pre-monsoon, (b) south-west monsoon, (c) post-monsoon and (d) winter seasons in Bangladesh from 1961 to 2007
8
Fig. 11 Map of the Indian sub-continent and cone/funnel shaped Bay of Bengal in front of Bangladesh
10
Fig. 12 Sea-level rise since 1880 10
Fig. 13 Modeled sea level rise from 1765 to 2100. The uncertainty range is for uncertainty in the climate sensitivity only
10
Fig. 14 Land area inundation due to projected sea-level rise in Bangladesh 10
Fig. 15 Topographic map of Bangladesh 13
Fig. 16 Inundation pruned area of Bangladesh due to upcoming sea- level rise
13
Fig. 17 Coastal zone climate and land-use patterns scenarios and model for food security
20
7
V. List of abbreviations and acronyms
CF: Challenge Fund
EU: European Union
Ec: Electrical conductivity
FAO: Food and Agriculture organization
GHE: Green house effect
GHG: Green house gas
GOB: Government of Bangladesh
LoA: Letter of Agreement
NFPCSP: National Food Policy Capacity Strengthening Programme
VI. List of Annexes
ANNEXES NO.
TITLE PAGE NO.
1 Questionnaire for collecting socio-economic and livelihood data from
the individual householder
25
2 Temperature and rainfall data used in the Figs. 6, 7, 9 & 10 273 Level of observed highest salinity at selected stations of Bangladesh 27
4 Land-use and related agricultural data of some selected Thanas of
three coastal districts
28
5 Level of salinity of soil and water samples collected from site visits 29
6 Types of food intake of the respondents in coastal area 30
7 Frequency of daily meal intake (time/days) of the respondents in
coastal area
31
8 Local cropping patterns of some selected Thanas of three coastal districts
31
9 Nature of crops cultivated in some selected coastal Thanas 32
10 Nature of crop cultivars used in the coastal areas 33
11 Average amount of annual production, shortage and surplus of rice of the respondents in coastal area
33
12 Status of livestock and poultry in coastal area 34
13 Distribution of holding reporting livestock and poultry birds and their numbers (including commercial)
35
14 Crop preservation systems in coastal area 36
15 Loss of agricultural enterprises due to disasters and their management
in coastal area
37
16 Precautionary measures during disaster in coastal area 37

8
VII. List of Plates
PLATE
NO.
TITLE PAGE
NO.
Plate 1 In spite of nearness to water sources vast cultivable land remains
fallow during the Boro season in places of Barisal Division
(photographs taken on 16 April 2008)
38
Plate 2 In spite of nearness to water sources vast cultivable land remains
fallow during the Boro season in places of Bagerhat of Khulna
Division (photographs taken on 21 May 2008)
38
Plate 3 Boro rice (hybrid var. Alo) has been successfully cultivated in
Bhashanzal, Morolganj of Bagherhat by using the locally available
surface water (photographs taken on 21 May 2008)
39
Plate 4 Shrimp cultivation is more popular than paddy in Mongla, Khulna
region (pictures taken on 22 May 2008)
39
Plate 5 Vast land of growing Aman in Char Jabbar, Noakhali (photographs
taken on 24 September 2008)
40
Plate 6 Fishing is one of the major enterprises in Hatiya people (photographs
taken on 24 September 2008)
40

9
1. Introduction: relevance to the National Food Policy and objectives
There is unequivocal evidence that the global climate is warming because of an increased
concentration of greenhouse gases (GHG) in the earth atmosphere. According to the IPCC
4th estimate (2007), continued GHG emission at or above current rates would cause further
warming and induce changes in global climate system during the 21st century that would
very likely be larger than those observed during the 20th century. The effects of climate
changes are geographically inequitable, variable and unpredictable with potentially
devastating consequences on water resources, agriculture, infrastructure, livelihoods,
biodiversity and cultures. Global warming will lead to thermal expansion of sea water,
together with melting of glaciers and sea-ice, the resultant effect of which is the rise in sea-
level. A 0.1 to 0.5m rise in sea-level by the middle of this century (as predicted by most of
the estimate) will pose a great threat to the livelihoods and agriculture in low-lying coastal
areas of the world including about 1/5th of the total land area of Bangladesh.
The coastal zone of Bangladesh is worldwide recognized as an extremely vulnerable area.
Impacts of climate change and sea-level rise should have real consequences on the
livelihoods of the coastal people as it would be affected by salinity intrusion, flooding,
drainage congestion, cyclones, heavy storms and erosion of the land masses (WB, 2000;
Agarwala et al., 2003). Therefore, agriculture in low-lying areas is likely to become
increasingly difficult to sustain. The land mass of Bangladesh being already quite limited
and its population density one of the highest in the world, continuous land engulfing by
rising sea water will only bring grave consequences forcing the coastal people to become
climatic refugees. These climatic refugees will exert immense pressure on the already
existing vulnerable food securities. Therefore, collection of relevant information relating to
the degree of global warming on sea-level rising and its consequences on the coastal land
masses and population are essential in formulating policies for food security in the coastal
regions of Bangladesh.
The global warming and sea-level rising are geographically inequitable with real
consequences on agriculture and food security for the coastal people of Bangladesh. The
present cropping patterns and livelihoods will make the people more vulnerable to cope
with the negative impacts of global warming and sea-level rising consequences. But proper

10
policy making and its execution may avert food insecurity in that area. Therefore, the
present project, under a financial grant from FAO/USAID/EU, was undertaken in October
2007 with the following objectives:
i) to evaluate the current status of low-lying coastal areas and off-shore islands,
ii) to asses the vulnerability of coastal population due to predicted sea level rising,
iii) to find out the agricultural enterprises which under the immediate threat of up-
coming sea level rising, and
iv) to explore the tactic regarding food security against predicted sea level rising.
2. Methodology: approach and analytical tools
A) Data collection
(a) Collection of secondary data
Relevant information on global warming and sea-level rising have been accumulated by
consulting books, journals, periodicals, browsing internets, personal communications,
attending seminars and symposia, and visiting various institutes/organizations. Climatic
parameters like temperature, humidity, rainfall, cyclones, tidal surges etc. and geo-
morphological information covering elevation, estuaries, embankments, floods, tides and
projected areas of inundation etc. of the coastal regions have also been collected by visiting
pertinent organizations.
(b) Collection of primary data
The land-use patterns, managements and socio-economic aspects of the coastal people of
Barisal and Khulna and Chittagong Divisions have been collected from local administrative
unit like Thana Agriculture Office and directly from the local people through questionnaire
(Annex Table 1). In doing so data were collected from Patharghata of Barguna, Sharankhola
and Mangla of Bagerhat, and Sudharam and Char Jabbar of Noakhali districts (Fig. 1). The
local people in some selected areas of the coastal zones were also interviewed about their
socio-economic aspects and livelihoods. In each location, some 10-20 farmers were
randomly selected for the purposes. On-spot observation was also made on locations of
interest in Khulna, Bagerhat, Satkhira, Barisal, Jhalokathi, Barguna, Patuakhali and
Noakhali districts of coastal regions.
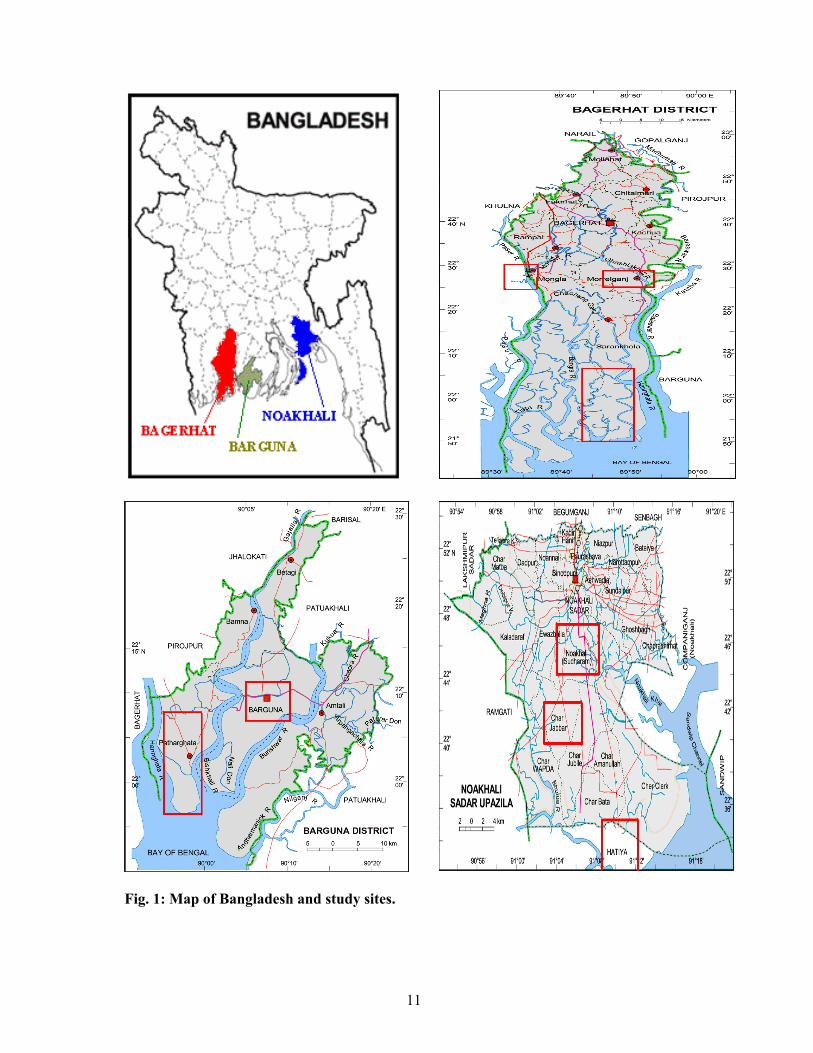
11
Fig. 1: Map of Bangladesh and study sites.

12
B) Salinity level study
While performing site visits, water samples were collected from the rivers, and
channels/canals of nearby the crop fields. Soil samples from the crop fields have also been
collected. The degree of salinity level of water and soil samples was chemically analyzed
following standard techniques.
3. Results and Discussion
A) Global warming scenarios and its projections
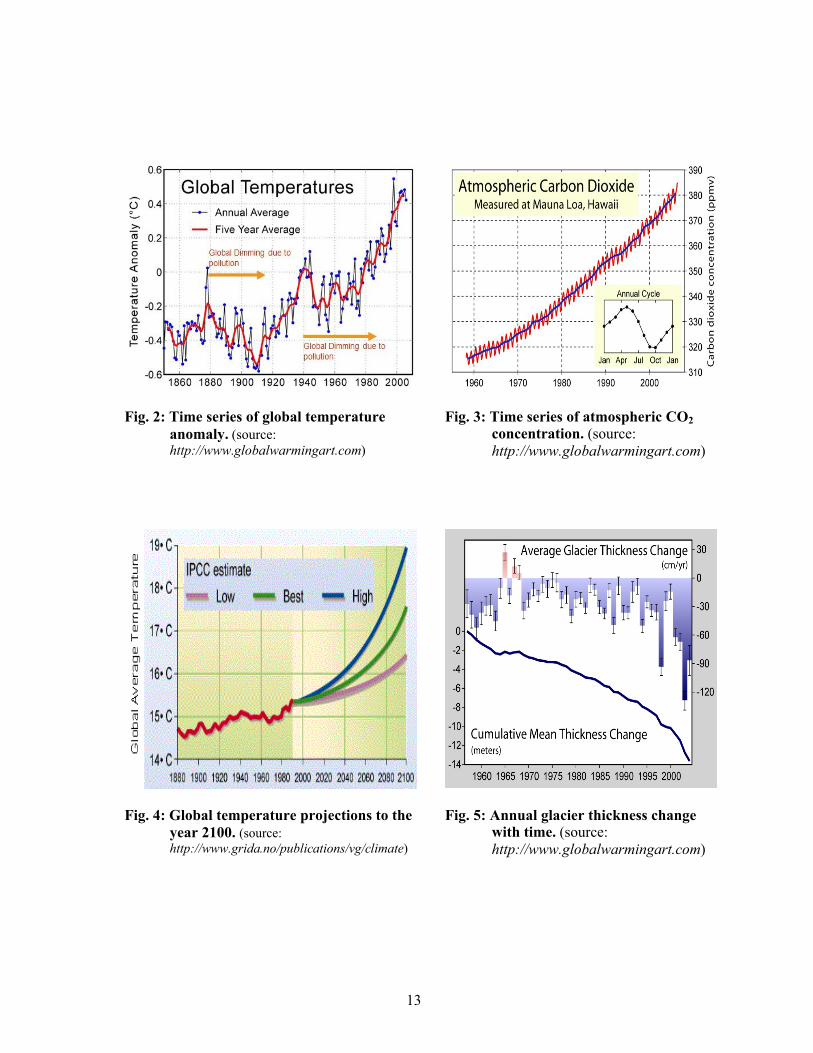
The historical time series of global temperature anomaly (1880-1935) was consistently
negative (Fig. 2). In contrast, from 1980 it was constantly positive having highest anomalies
of +0.4 to +0.6oC. Such increase in global temperature especially during recent past might
have been associated with the increased concentration of CO2 in the atmosphere (Fig. 3)
which is regarded as the main culprit in causing greenhouse effect (GHE). In fact
atmospheric concentration of CO2 is alarmingly increasing from the middle of the last
century that commensurate with the increased burning of the fossil fuels and beginning of
rapid industrialization.
The IPCC (2007) has predicted that the global temperature at the end of 21st century may
exceed the limit of about 2oC with a fluctuation of about 1 to 3.5oC from the mean (Fig. 4).
Such warming of global atmosphere would melt the glaciers and ices at higher rates as
compared to recent past (Fig. 5) which will further contribute to the rise of sea level.
B) Climatic scenarios of Bangladesh
Although the country average maximum and minimum temperatures were in increasing
trends, the slope of the 5-year moving mean was steepest for maximum temperature (Fig.
6). Country means maximum temperatures at pre-monsoon (March-May), south-west
monsoon (June-October) and post-monsoon (October-November) seasons and mean
minimum temperature at winter season are presented in Fig. 7. Despite the great
fluctuations between year to year, the mean maximum temperature in pre-monsoon
appeared to be static while south-west monsoon and post-monsoon temperatures are
continually increasing since 1961 (Fig. 7a-c).
13
Fig. 2: Time series of global temperature anomaly. (source: http://www.globalwarmingart.com)
Fig. 3: Time series of atmospheric CO2
concentration. (source: http://www.globalwarmingart.com)
Fig. 4: Global temperature projections to the year 2100. (source: http://www.grida.no/publications/vg/climate)
Fig. 5: Annual glacier thickness change with time. (source: http://www.globalwarmingart.com)
14
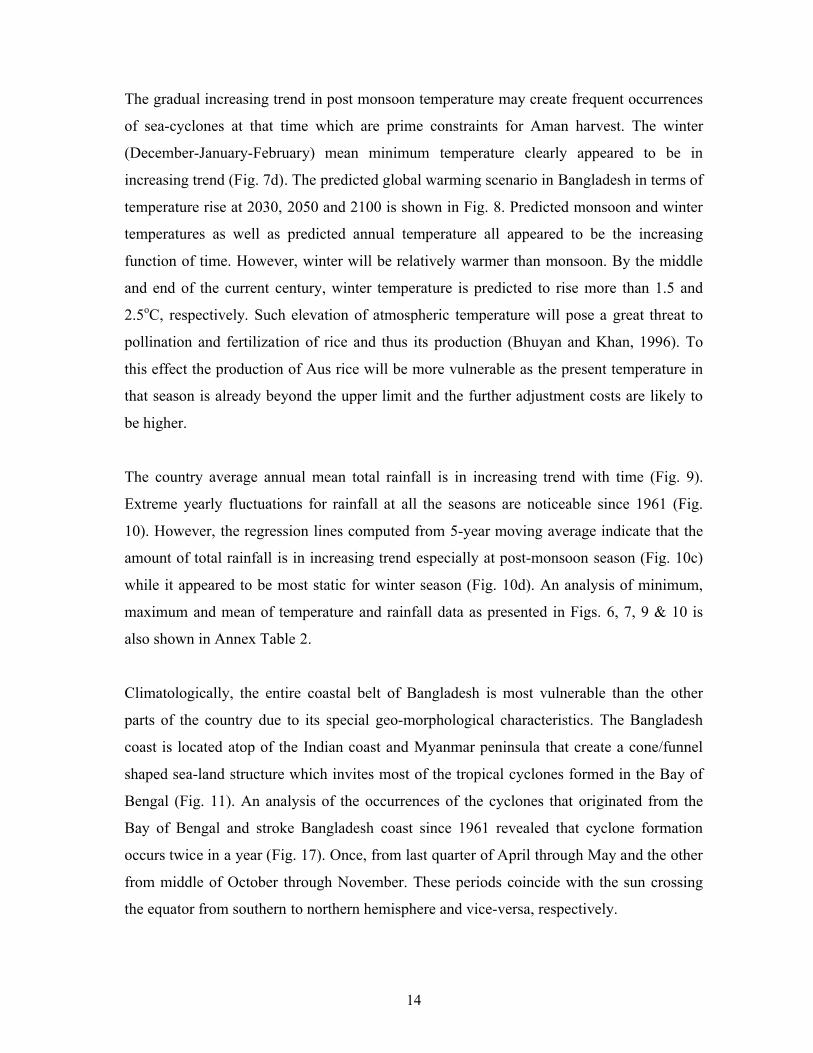
The gradual increasing trend in post monsoon temperature may create frequent occurrences
of sea-cyclones at that time which are prime constraints for Aman harvest. The winter
(December-January-February) mean minimum temperature clearly appeared to be in
increasing trend (Fig. 7d). The predicted global warming scenario in Bangladesh in terms of
temperature rise at 2030, 2050 and 2100 is shown in Fig. 8. Predicted monsoon and winter
temperatures as well as predicted annual temperature all appeared to be the increasing
function of time. However, winter will be relatively warmer than monsoon. By the middle
and end of the current century, winter temperature is predicted to rise more than 1.5 and
2.5oC, respectively. Such elevation of atmospheric temperature will pose a great threat to
pollination and fertilization of rice and thus its production (Bhuyan and Khan, 1996). To
this effect the production of Aus rice will be more vulnerable as the present temperature in
that season is already beyond the upper limit and the further adjustment costs are likely to
be higher.
The country average annual mean total rainfall is in increasing trend with time (Fig. 9).
Extreme yearly fluctuations for rainfall at all the seasons are noticeable since 1961 (Fig.
10). However, the regression lines computed from 5-year moving average indicate that the
amount of total rainfall is in increasing trend especially at post-monsoon season (Fig. 10c)
while it appeared to be most static for winter season (Fig. 10d). An analysis of minimum,
maximum and mean of temperature and rainfall data as presented in Figs. 6, 7, 9 & 10 is
also shown in Annex Table 2.
Climatologically, the entire coastal belt of Bangladesh is most vulnerable than the other
parts of the country due to its special geo-morphological characteristics. The Bangladesh
coast is located atop of the Indian coast and Myanmar peninsula that create a cone/funnel
shaped sea-land structure which invites most of the tropical cyclones formed in the Bay of
Bengal (Fig. 11). An analysis of the occurrences of the cyclones that originated from the
Bay of Bengal and stroke Bangladesh coast since 1961 revealed that cyclone formation
occurs twice in a year (Fig. 17). Once, from last quarter of April through May and the other
from middle of October through November. These periods coincide with the sun crossing
the equator from southern to northern hemisphere and vice-versa, respectively.

15
y = 0.013x +5.06
R 2 = 0.68
29.6
30
30.4
30.8
31.2
1960 1970 1980 1990 2000 2010
Years
Ann
ual m
ean
max
tem
p ( o C
)Actual mean 5-yr moving mean
y = 0.007x+7.56
R 2 = 0.45
20
20.5
21
21.5
22
1960 1970 1980 1990 2000 2010
Years
An
nual
mea
n m
in t
emp
( o C)
Actual mean 5-yr moving mean
Fig. 6: Country average (mean from 24-34 stations throughout the country) annual mean maximum and minimum temperatures of Bangladesh from 1961 to 2007.
y = 0.0022x +28.30
R 2 = 0.0230
31
32
33
34
1960 1970 1980 1990 2000 2010
Pre
-mon
soon
max
tem
p (
o C)
Actual mean 5-yr moving mean
(a) Mar-May
y = 0.0234x- 15.04
R 2 = 0.90
30.5
31
31.5
32
32.5
1960 1970 1980 1990 2000 2010
S-W
mon
sson
max
tem
p (o C
)
Actual mean 5-yr moving mean
(b) Jun-Oct
S-W: south-west
y = 0.0203x- 9.85
R 2 = 0.69
29
30
31
32
1960 1970 1980 1990 2000 2010
Years
Pos
t-m
onso
on m
ax t
emp
( o C)
(c) Oct-Nov
y = 0.0101x- 6.08
R2 = 0.25
12.5
13
13.5
14
14.5
15
15.5
1960 1970 1980 1990 2000 2010
Years
Win
ter
mea
n m
in te
mp
( o C)
(d) Dec-Jan-Feb
Fig. 7: Country mean maximum temperatures during (a) pre-monsoon, (b) south-west monsoon and (c) post-monsoon seasons, and (d) mean minimum temperature during winter in Bangladesh from 1961 to 2007 (mean from 24-34 stations throughout the country).

16
0
0.5
1
1.5
2
2.5
3
2030 2050 2100
Projected time (years)
Pred
icte
d te
mpe
ratu
re in
crea
se (
o C)
Monsoon Winter Annual
y = 4.14x- 5776.2
R 2 = 0.22
1500
1800
2100
2400
2700
3000
1960 1970 1980 1990 2000 2010
Years
Annu
al ra
infa
ll (m
m) M
Total rainfall 5-yr moving mean
Jan-Dec
Fig. 8: Projected warming scenarios in Bangladesh.
Fig. 9: Country average (mean from 24-34 stations throughout the country) total annual rainfall in Bangladesh from 1961 to 2007.
y = 0.73x-1005.0
R 2 = 0.040
200
400
600
800
1960 1970 1980 1990 2000 2010
Pre
-mon
soon
rai
nfa
ll (
mm
) N
Total rainfall 5-yr moving mean
(a) Mar-May
y = 2.05- 3837.8
R 2 = 0.27
0
100
200
300
400
500
1960 1970 1980 1990 2000 2010
Years
Pos
t-m
onso
on r
ainf
all (
mm
) c
(c) Oct-Nov
y = 0.06x- 79.3
R 2 = 0.004
0
20
40
60
80
100
120
140
1960 1970 1980 1990 2000 2010
Years
Win
ter
rain
fall
(m
m)
M (d) Dec-Jan-Feb
Fig. 10: Country average (mean from 24-34 stations throughout the country) total rainfall at (a) pre-monsoon, (b) south-west monsoon, (c) post-monsoon and (d) winter seasons in Bangladesh from 1961 to 2007.

17
However, most devastating cyclones that stroke Bangladesh coast in the past occurred
during the last week of April to 10th of May, and from last week of October to the middle of
November. In terms of severity, the former one is characterized by asymmetric distribution
while the latter one with normal distribution/symmetric temporal pattern.
C) Sea-level rise scenarios and Bangladesh perspective
With a continuous global warming scenario (Fig. 2) there was a concomitant rising of sea-
level by about 20 cm during the 20th century (Fig. 12). It is so predicted by IPCC (2007)
that at the end of 21st century, the sea level may rise up to about 0.60 (±0.40) cm (Fig. 13).
From an estimation (WARPO, 2006), it is predicted that about 14, 32 and 88 cm sea-level
rise will occur at 2030, 2050 and 2100, respectively which may inundate about 8, 10 and
16% of total land mass of Bangladesh (Fig. 14). At base line situation i.e. 0 (zero) rise in the
sea level a total of 1572085 ha land is inundated in 16 coastal districts due to monsoon
flood. Further rise in sea-level will expand inundation areas where Patuakhali, Khulna and
Barisal regions would be the most affected.
On an average, the sea (mean tide level) would rise by 40 cm in Shahabazpur channel at
Daulatkhan due to 88 cm rise in sea level. High tide is found to increase by 30 and 80 cm
for 32 and 88 cm sea level rise, respectively (WARPO, 2006).
Coastal regions of Bangladesh is at great risk from projected sea-level rising. Coastal zone
resources are especially endangered by the projected climate change and consequent sea-
level rising. Potential impacts (WB, 2000; Agarwala et al., 2003) would include: (i) changes
in water levels and induced inundations and water logging, (ii) increased salinity in ground
and surface water, and corresponding impacts on soil salinity, (iii) increased coastal
morphological dynamics (erosion and accretion), and (iv) increased incidence of natural
hazards. These impacts will lead to the reduction of the economic and employment
opportunities in the coastal areas, already under stress by occurrence of cyclones and storm
surges. Increased salinity levels will reduce fresh water availability for irrigation, while
growing drainage congestion problems will result in longer periods of flood inundation.
This will reduce the areas suitable for rice production. In addition, increased coastal
morphological dynamics will contribute to the existing problem of loss of valuable
agricultural land due to erosion.

18
Fig. 11: Map of the Indian sub-continent and cone/funnel shaped Bay of Bengal in front of Bangladesh.
Fig. 12: Sea-level rise since 1880. (source:http://www.globalwarmingart.com)
0
20
40
60
80
100
2030 2050 2100
Projected time (years)
Pred
icte
d se
a le
vel r
ise
(cm
) bn
0
3
6
9
12
15
18
Tot
al la
nd in
unda
tion
(%)
N
Sea level rise
% of total land inundation
Fig. 13: Modeled sea level rise from 1765 to 2100. The uncertainty range is for uncertainty in the climate sensitivity only.
Fig. 14: Land area inundation due to projected sea-level rise in Bangladesh. (WARPO, 2006)
Cone shapedBay of Bengal

19
D) Current status of low-lying coastal areas of Bangladesh
Total area of Bangladesh coastal zone is about 47,203 km2 that includes 19 districts viz.
Barguna, Barisal, Bhola, Jhalokati, Patuakhlai and Pirojpur under Barisal Division,
Bagerhat, Jessore, Khulna, Narail and Satkhira under Khulna Division, Chandpur,
Chittagong, Cox’s Bazar, Feni, Laksmipur and Noakhali under Chittagong Division, and
Gopalganj and Shariatpur under Dhaka Division (Table 1). Most of the coastal parts and
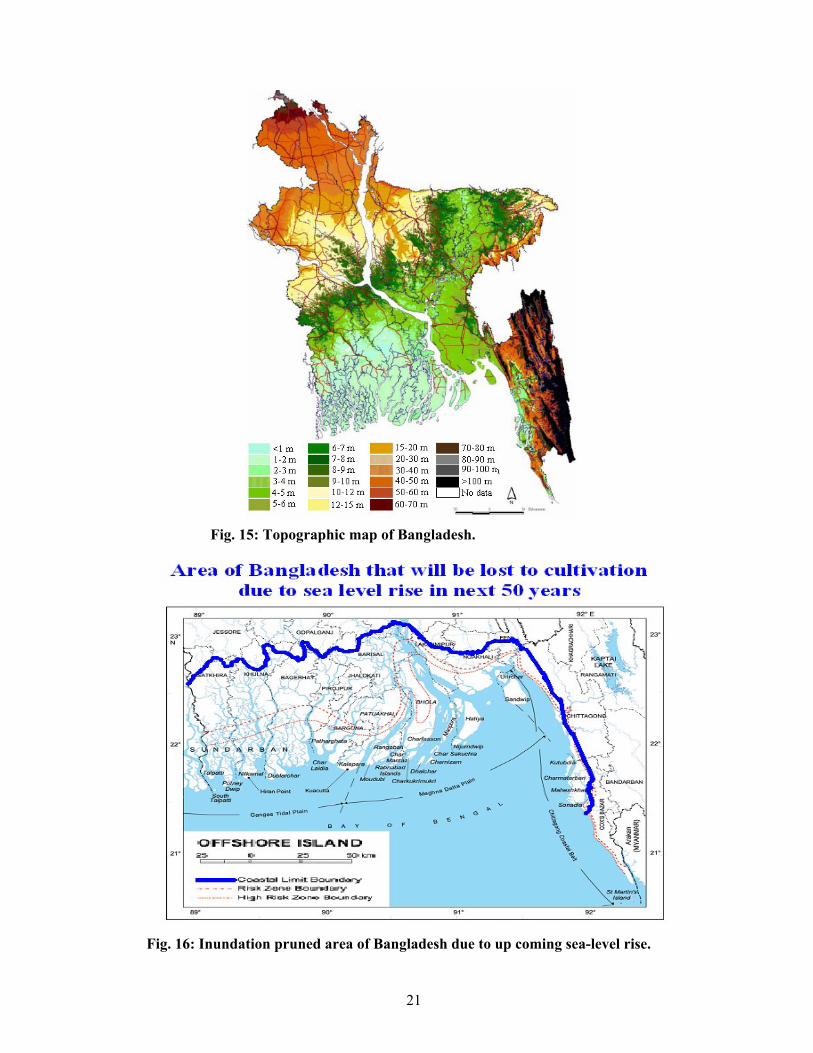
associated islands of Khulna, Barisal and Chittagong Divisions lie within 1m from sea level
where incursion of saline water is common (Fig. 15; Annex Table 3). It is predicated that
these areas will be inundated and unsuitable for crop production due to sea-level rise in the
next 50 years (Fig. 16). More than 35 million people, equivalent to about 28% of total
country’s population live in the coastal region of Bangladesh.
The total owner, operated, homestead, net cultivated and temporary cropped areas in the
coastal districts are shown in Table 2. The land utilization statistics as forest, not cultivable,
cultivable waste, current fallow land, and single, double, triple, net and total cropped land
for the 6 greater coastal districts is shown in Table 3. The people of that zone cultivate
grossly about 2.9 million hectares of land out of which 0.34 million ha for local Aus, 0.12
million ha for HYV Aus, 0.88 million ha for local Aman, 0.33 million ha for HYV Aman,
0.59 million ha for Boro and 0.032 ha for wheat crops (Table 4). The greater Khulna district
is characterized by poor cropping intensity of 136% where the country average figure is
177%. Such lower cropping intensity in Khulna regions as compared to other coastal
districts is attributed mainly to shrimp cultivation. Cropping intensity in Barsisal and
Barguna is also lower than the country average whereas Jessore, Chittagong and Noakhali
are ranked above the national figure of cropping intensity.
The data regarding irrigated area in coastal regions are presented in Table 5. Farmers of
Barisal and Patuakhali use traditional methods of irrigation from local channels and canals.
Beside the traditional methods, irrigation by tube wells is not common in the remaining
coastal zones. Only 2% of total cropped area remains under irrigation in Patuakhali whereas
that figures are about 13, 14, 18 and 28% for Barisal, Noakhali, Khulna and Chittagong,
respectively. Percentage of irrigated land in Jessore (42%) is higher than the country
average figure (33%).

20
Table 1: Features of vulnerable districts in the coastal zones of Bangladesh
SL. No.
Name of district
Area (km2)
Total population*
% of total country population*
Nature of vulnerability
Salinity Tidal surge Cyclones
1 Barguna 1,832 845,060 0.682 √ √ √2 Barisal 2,791 2,348,440 1.896 √ √ √3 Bhola 3,403 1,703,200 1.375 √ √ √4 Jhalokati 758 692,680 0.559 √ √ √5 Patuakhlai 3,205 1,464,800 1.183 √ √ √6 Pirojpur 1,308 1,099,780 0.888 √ √ √7 Bagerhat 3,959 1,516,820 1.225 √ √ √8 Jessore 2,567 2,469,680 1.994 √9 Khulna 4,395 2,357,940 1.904 √ √ √10 Narail 990 694,900 0.561 √ √11 Satkhira 3,858 1,845,120 1.490 √ √ √12 Chandpur 1,704 2,241,020 1.810 √ √ √13 Chittagong 5,283 6,543,860 5.284 √ √ √14 Cox’s Bazar 2,492 1,759,560 1.421 √ √ √15 Feni 928 1,205,980 0.974 √ √ √16 Laksmipur 1,458 1,486,540 1.200 √ √ √17 Noakhali 3,601 2,570,640 2.076 √ √ √18 Gopalganj 1,490 1,151,800 0.930 √19 Shariatpur 1,181 1,080,680 0.873 √ √
Total 47,203 35,078,500 28.323
*Source: BBS, 2004
21
Fig. 15: Topographic map of Bangladesh.
Fig. 16: Inundation pruned area of Bangladesh due to up coming sea-level rise.

22
Table 2: Operated, homestead, cultivated and cropped area, 2005(area in hectares)
SL No.
Name of district
Owner area
Operated area
Homestead area
Net cultivated area
Temporary cropped area
1 Barguna 110546 108168 5236 91370 805872 Barisal 194757 190727 38716 151953 1280473 Bhola 130854 138280 8196 116433 939354 Jhalokati 68283 58481 2575 49024 385165 Patuakhali 183767 175776 8294 149674 1390736 Pirojpur 109558 105437 4890 88896 660747 Bagerhat 163333 166260 7787 137003 1113788 Jessore 196056 198783 12357 152744 1280499 Khulna 178399 143396 11285 108159 9707510 Narail 81005 79768 4143 65784 5863611 Satkhira 175687 180676 9502 99540 8489912 Chandpur 97165 106677 12768 71938 6515113 Chittagong 255540 236994 36699 150786 13606414 Cox’s Bazar 84804 98153 12665 62395 5537715 Feni 66875 69000 8024 48065 4470616 Laksmipur 88790 94794 7443 70743 5646617 Noakhali 179315 187151 15164 141301 12743918 Gopalganj 122957 113036 7402 90762 8852719 Shariatpur 87117 85895 7864 65819 61142
Coastal total 2574808 2537452 221010 1912389 1661141
Bangladesh 9539800 9499448 748523 7321267 6730708
Source: Agriculture Sample Survey-2005, BBS [cited from Pocket Book BBS, 2005]
Table 3: Land utilization statistics, 2002-03 ('area in 000' hectares')
Source: BBS, 2004, and site visits. NA: not available.
SL No.
Name of district
Total area
Forest Not cultivable
Cultivable waste
Current fallow
Single cropped
Double cropped
Triple cropped
Net cropped
Total cropped
Cropping intensity
1Barisal 826 149 185 24.3 19.4 194 193 62 449 766 170.51
2 Patuakhali 504 113 127 35.2 6.88 184 129 23 214 509 151.93Barguna 194 NA 1 NA 33.4 37 38 29 104 200 NA
3 Jessore657 213 9.72 21.1 71 355 51 413 826 199.90
4 Khulna2369 577 209 15.4 32.4 277 113 19 405 755 136.36
5 Chittagong824 264 247 21.9 12.6 96 144 38 279 499 179.21
6 Noakhali 617 184 109 11.7 0.4 99 152 62 312 587 188.06
Bangladesh 11696 2598 3516 309 387 2878 4127 1030 8034 14221 177.00

23
Table 4: Distribution of major cropped areas in costal districts
SL No. Name of district
Gross cropped area (ha)
Cropped area (ha) under
Aus (local)
Aus (HYV)
Aman (local)
Aman (HYV)
Boro Wheat
1 Barguna 142324 20934 14235 69777 9445 2716 902 Barisal 230038 34323 6215 84964 7967 49487 22003 Bhola 198375 36668 3172 81560 7212 19285 43714 Jhalokati 67484 15218 2707 32511 1694 4549 155 Patuakhali 244015 44484 5685 127243 8166 4857 1126 Pirojpur 97626 13187 3152 45291 4213 14242 797 Bagerhat 143155 4989 1493 75981 11882 33446 1228 Jessore 246472 6851 15449 25919 54991 88801 65849 Khulna 131051 7536 1623 56254 20772 27267 34610 Narail 93949 10532 1390 24459 7386 29402 292011 Satkhira 139567 838 5573 15029 44623 43005 186712 Chandpur 127417 6437 6562 19113 35395 42323 271313 Chittagong 273062 26486 32412 38708 32513 58232 49914 Cox’s Bazar 94182 4842 3813 10572 29663 32481 3115 Feni 82600 11353 4298 18565 25266 20001 13616 Laksmipur 123006 26508 4223 40904 6504 14880 84417 Noakhali 227077 45436 6246 79148 11876 31744 49118 Gopalganj 130013 6564 194 23057 6992 51639 310919 Shariatpur 109981 12771 569 13440 3603 21533 4940
Total 2901394 335957 119011 882495 330163 589890 31469
Source: BBS, Pocket Book, 2005
Table 5: Irrigated area in coastal regions under different means (2002-03)(area in '000' hectares)
Source: Agriculture Wing, BBS [cited from BBS, 2004]
SL No.
Name of district
Power pump
Deep tube-well
Shallow tube-well
Hand tube-well
Total tube well Canals
Tradi-tional
Total irrigated area
Total cropped area
%of irrigated area
1 2 3 4 5=2+3+4 6 7 8=1+5+6+7 9 101 Barisal 77.73 0 0 0 0 7.69 10.5 91.9 765.6 12.532 Patuakhali 4.858 0 0 0 0 4.05 1.62 10.53 509.3 2.073 Jessore 11.34 44.5 284 0.4 329 8.5 0.81 349.8 826.3 42.33
4 Khulna 12.55 18.2 54.7 0.81 73.7 4.86 8.1 99.19 633.6 17.955 Chittagong 81.78 6.07 12.1 0.81 19 17 20.6 138.5 499.2 27.746 Noakhali 63.56 4.05 6.48 0.4 10.9 0 5.67 80.16 587 13.66
Bangladesh 781.8 698 2768 26.3 3492 146 307 4727 14221 33.24

24
Similar type of data i.e., land-use statistics, cropping intensity, crop production etc. from the
farmers of Patharghata of Barguna, Sarankhola of Bagerhat, and Sudharam and Char Jobbar
thanas of Noakhali districts have been collected directly through site visits which are
presented in Annex Table 4. Yearly salinity peaks from 1992 observed in the some selected
coastal regions have been presented in Annex Table 3 and samples analyzed from our own
collection are presented in Annex Table 5.
E) Livelihood and land-use patterns of coastal people
The coastal people of Bangladesh are mostly agrarian. The staple food is rice and most
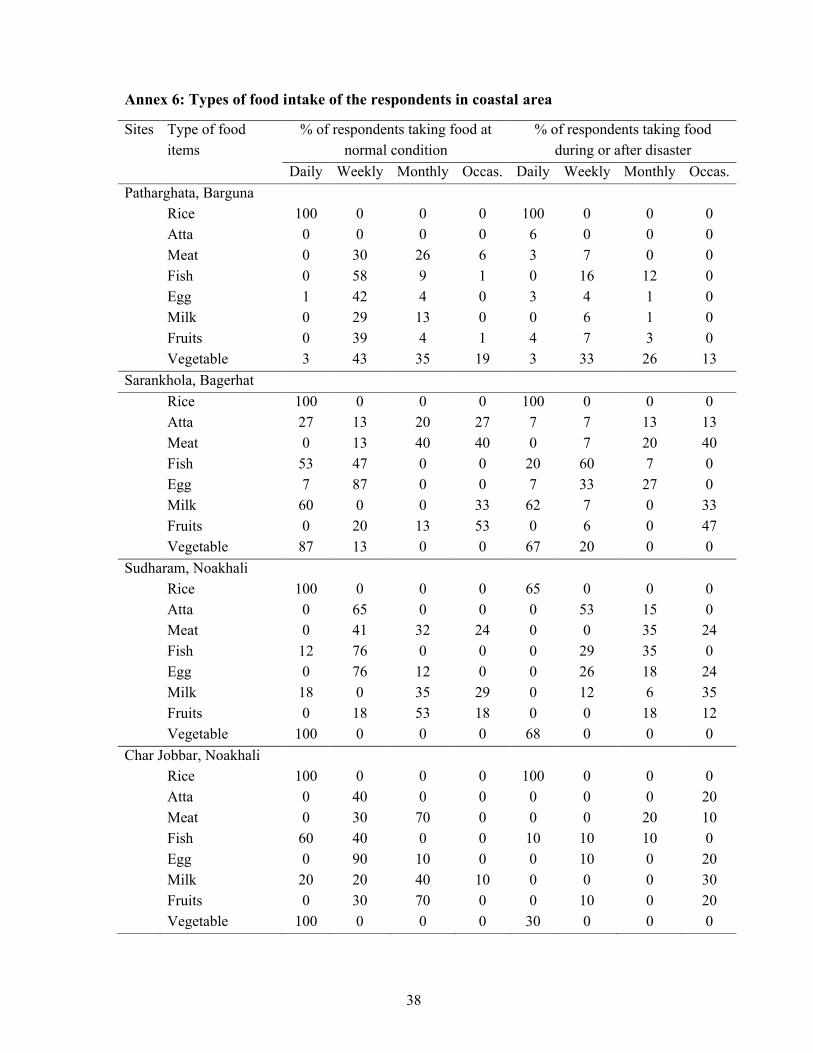
people are accustomed to intake vegetables in their daily meals (Annex Table 6). Intake of
fish, meat, egg and fruits are not common for all the respondents. That’s why they eat such
high calories of foods at weekly, monthly or occasionally as per their individual capacity.
Disasters like cyclones and tidal surges seriously affect the frequency of daily food intake.
More than 80% of coastal people who are accustomed to intake at least 3 meals a day at
normal condition are bound to drastically reduce their meals following disaster (Annex
Table 7).
The cropping patterns as collected from Thana Agricultural Officers of some selected
coastal regions are shown in Annex Table 8 and the same collected by case studies from
individual farmers are presented in Table 6. Both types of data sets are closely associated.
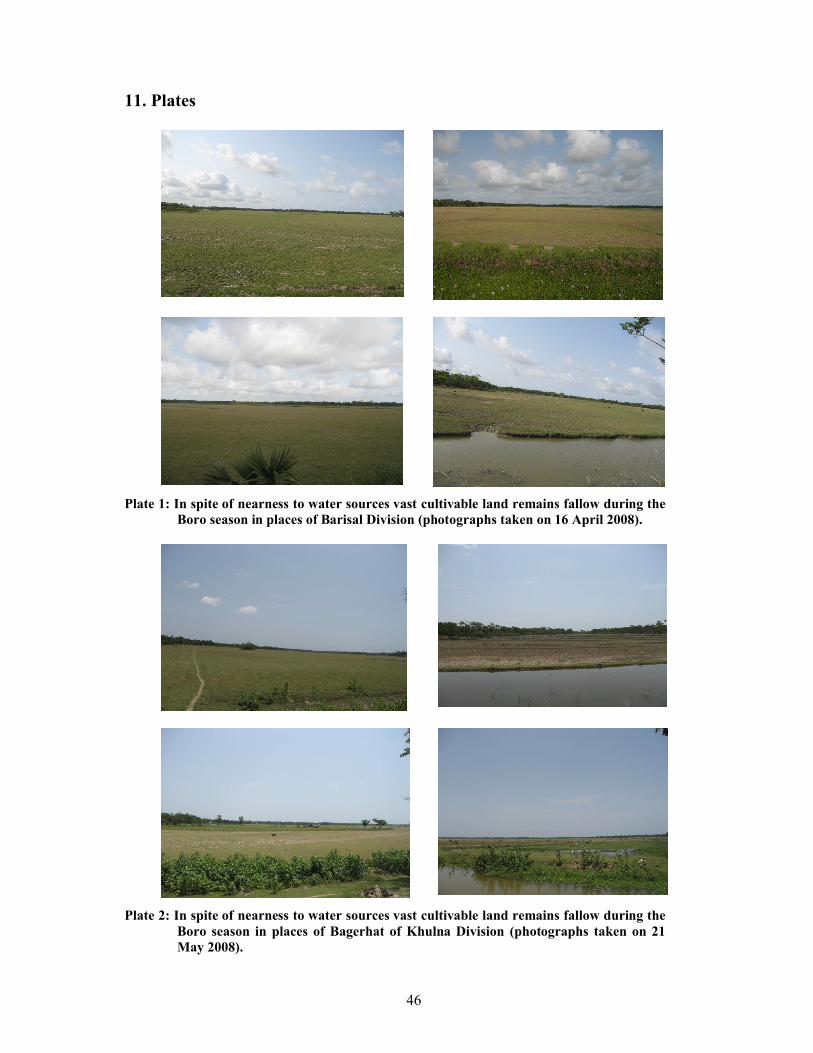
The unique feature is that the cropping patterns are totally Aman dependant especially
transplanted (T) Aman (Plate 5), whereas the Boro and Aus rice are of sporadic in
occurrence (Plate 3). Some farmers cultivate only T Aman extended from August to
November using upstream water flow due to monsoon flush when the salinity effects are
moderate to mild, whereas the land remains fallow for rest of the year (Plates 1 & 2). Some
farmers grow vegetables, potato, sweet potato, soybean, water melon, groundnut and pulses
as khesari, mungbean or cowpea after harvest of T Aman (i.e., in Boro season). A
summarized version of the present land-use patterns in most of the costal belt under Barisal,
Khulna and Chittagong Divisions are shown in Table 7. In Boro season (December-May),
the land-use pattern in Barisal Division is characterized by bare/fallow condition, Khulna
with shrimp cultivation (Plate 4) and Chittagong with pulses and vegetable cultivation.
Fishing is traditional and most popular source of income of people of Hatiya and other on-
shore and off-shore islands (Plate 6).

25
Table 6: Cropping patterns used by the coastal growers
SL No.
Name of cropping pattern Patharghata, Barguna
Sarankhola, Bagerhat
Sudharam, Noakhali
Char Jobbar, Noakhali
% of user resp.
Av area (deci)
% of user resp.
Av area (deci)
% of user resp.
Av area (deci)
% of user resp.
Av area (deci)
1 Aman-Fallow-Fallow 5 10 67 95 √ √ 40 642 Aman-Pulses-Fallow 14 14 67 80 √ √ 10 123 Aman-Fallow-Aus 5 5 27 17 NA NA 10 44 Aman-Pulses-Aus 15 134 NA NA √ √ 10 75 Aman-Boro-Fallow NA NA 7 24 NA NA NA NA6 Aman-Boro-Chilli 26 32 NA NA √ √ NA NA7 Aman-Chilli-Aus 7 2 NA NA √ √ 10 108 Aman-Sweet potato-Aus 33 22 NA NA √ √ 30 99 Aman-Groundnut-Aus 2 7 NA NA √ √ 40 4510 Aman-Soybean-Aus NA NA NA NA √ √ 30 6011 Aman-Water melon-Aus NA NA NA NA √ √ 10 2412 Aman-Sweet potato-Chilli 24 28 NA NA √ √ NA NA13 Aman-Sweet potato-Fallow NA NA NA NA NA NA 10 1014 Aman-Groundnut-Fallow NA NA NA NA √ √ 10 815 Aman-Soybean-Fallow NA NA NA NA √ √ 20 1016 Aman-Potato-Fallow NA NA 27 29 NA NA NA NA17 Aman-Chilli-Fallow 17 63 20 9 √ √ 40 818 Aman-Vegetable-Vegetable 5 4 13 9 √ √ 10 119 Aman-Fallow-Vegetable NA NA 13 18 NA NA NA NA20 Vegetable-Fallow-Vegetable 5 1 7 1 √ √ 10 1021 Vegetable-Veget-Vegetable NA NA 7 5 NA NA NA NAAman= mostly transplanted (T), Pulses=khesari/cowpea/mungbean etc. NA: not available
Table 7: Present land-use patterns in the coastal zones of Bangladesh
Division Major cropping patterns
Aman (Jul-Nov) Boro/Rabi (Dec-May) Aus/Kharif (May-Aug)
Barisal T Aman, broadcast Aman Mostly fallow, scattered winter vegetables & pulses
Mostly fallow, scattered Aus
Khulna Shrimp, scattered T Aman, mixed shrimp + T Aman
Shrimp/fallow/mixed Shrimp + Boro
Shrimp/Aus
Chittagong T Aman, broadcast Aman Pulses, groundnut, soybean, watermelon, vegetables, chilli, scattered Boro
Aus, fallow
26
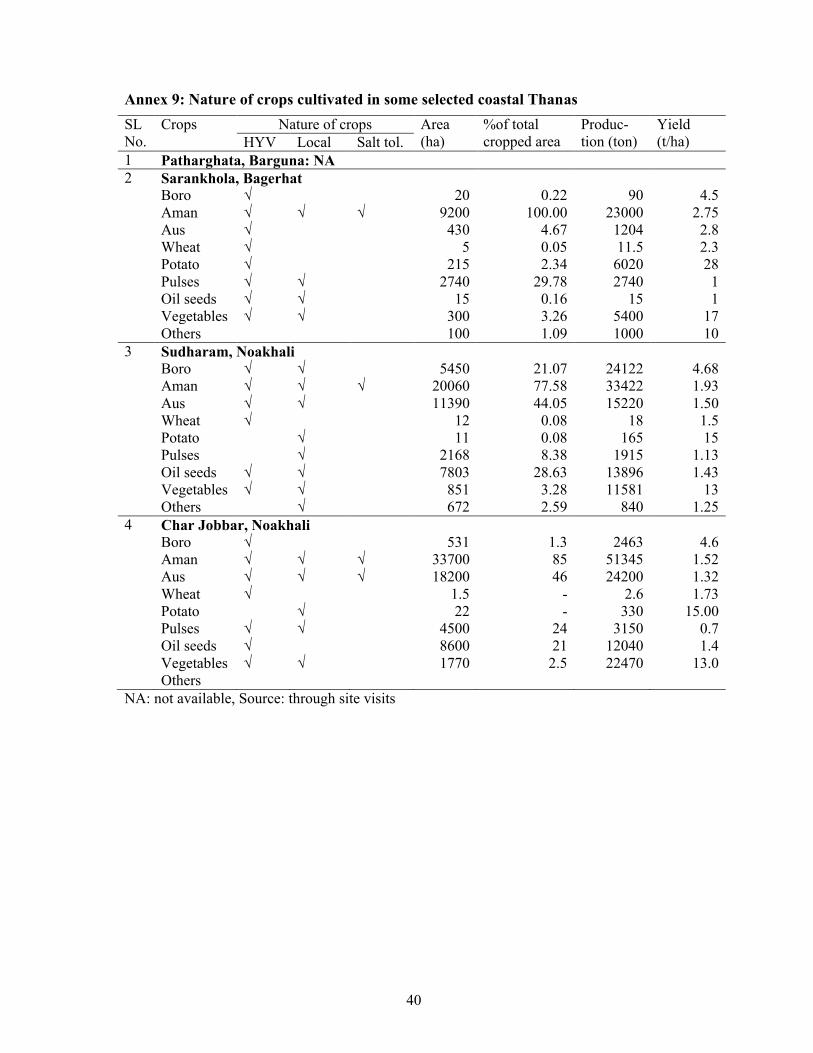
Most of the coastal people grow crops especially rice with local cultivars (Annex Table 9).
However, some progressive farmers use HYV but the use of salt-tolerant cultivars is
scantly. People also use local varieties to produce other crops like wheat, potato, pulses,
chilli, oil seeds, vegetables etc. The type of data collected from local Thanas commensurate
with data collected from individual growers (Annex Table 10).
Average amount of annual production, shortage and surplus of rice of the respondents in
coastal area is shown in Annex Table 11. Based on locality, about 23-60% respondents are
in shortage category whereas 10-50% respondents belong to rice surplus groups. Therefore,
the food security of coastal people is heterogeneous in nature.
The numbers of livestock and poultry and their associated prices have also been listed from
the respondents during the site visits (Annex Table 12). Most of the respondent rears cattle,
goats, poultry and ducks for their own interest. Similarly, the distribution of holdings
reporting livestock and poultry birds and their numbers in the entire coastal belt is shown in
Annex Table 11. These are the important assets of the coastal people and are often pruned
to immediate threat when cyclones and associated tidal surges or sea level rise lashes the
region.
The preservation systems for rice, wheat, pulses, vegetables and pulses in coastal areas are
shown in Annex Table 14. People store their rice and pulses in locally made doles, machas
and earthen pots. Gunny or synthetic bags are in sporadic uses for the purpose while
underground preservation system is almost nil which could be the most efficient food
storing tactic especially for grain crops during disasters like cyclones and tidal surges.
Cyclones, floods, tornados, tidal surges are common disasters to coastal people (Annex
Table 15). It is unfortunate that people have no control mechanism to prevent such disasters
to save their lives, foods and other properties. Most of the coastal people in Khulna and
Noakhali stay their own houses during cyclone whereas some other people move to safer
places like cyclone centers or school/colleges (Annex Table 16). Some people in Barguna
use public or private pucca buildings or tongs/machas made of bamboos/wooden pillars.

27
F) Sea level rising effects on Sundarban mangrove vegetation–a world heritage
The Sundarban mangrove vegetation is one of most important world heritages. It acts as a
natural shield against cyclones and tidal surges for the inhabitants and properties at the lees.
It also experiences increased inundation with sea level rise. It has been postulated that 84%
of the Sundarban area will be inundated with 32 cm sea level rise in 2050 and almost whole
area of the Sundarban will be subjected to inundation with 88 cm sea level rise (WARPO,
2006). Moreover, increased salinity may pose a threat to some mangrove species i.e.
biodiversity. Therefore, the mangrove vegetation of Bangladesh coastal regions especially
in Khulna and Bagerhat is most vulnerable to global warming and predicted sea-level rising.
It is a crying need for the policy makers to save this mangrove region from any unwanted
situations like timber collection, hunting, crop production or other human interventions.
G) Model for food security
In order to address the effect of climatic changes and upcoming sea level rising and
ensuring food security of the coastal people a model has been proposed for the region (Fig.
17). During the Rabi season immediately after the harvest of the T Aman, the researchers
and extension workers should devote their endeavour to cultivate HYV Boro even by
utilizing the brackish water. And the harvest of this Boro crop must be completed before the
last week of April since the subsequent days are very likely pruned to tropical cyclones.
Likewise the Aman season should be rearranged in such a way so that harvesting is ensured
at the later part of October since the days thereafter with the beginning of November are
often subjected to tropical cyclones.

28
Fig. 17: Coastal zone climate and land-use patterns scenarios and model for food security.
4. Key findings
1) The food production in the coastal districts of Bangladesh is already vulnerable due
to the cyclonic storm, tidal surges, salinity intrusion and impeded drainage. The
global warming and associated sea level rising will further aggravate this situation;
2) In all projections it is apparent that a 1-2oC global warming will lead to about 14, 32
and 88 cm sea-level rise in 2030, 2050 and 2100 respectively which may inundate
about 8, 10 and 16% of total and masses in Bangladesh. Therefore, agriculture in
low-lying areas is likely to become increasingly difficult to sustain;

29
3) Most of the coastal parts and associated islands of Khulna, Barisal and Chittagong
Divisions lie within 1m from sea level where incursion of saline water is common. It
is predicated that these areas will be inundated and unsuitable for crop production
due to sea-level rise in the next 50 years;
4) The predominant crop in coastal belt is Aman rice especially transplanted Aman with
sporadic occurrences of Aus, and some pulses, vegetables, groundnut etc. in Boro
season and there remains vast scope for expansion and boosting production of new
crops;
5) Crop cultivation is seriously hampered in dry season due to either lack of water or
presence of salinity either in surface water or in soil. Therefore, vast areas of land
remain fallow in Boro season. But the research and extension approaches to bring
this vast land area under alternate cropping patterns/crops are inadequate.
5. Policy implications and recommendations
1) Advancing the present cropping patterns in both Boro and Aman seasons by a
fortnight should go a long way in avoiding the coastal cyclones and will mean a
good harvest of rice, the main cereal of the country;
2) Introduction of salt-tolerant crops of Boro, wheat and maize will contribute to
additional production of food grains and boost food security;
3) Development of submergence tolerant rice varieties capable of thriving tidal
surges/floods should be an alternative option for food security;
4) Construction of embankment with extended mild slopes along the coastal land
masses will slowed down the fury of tidal waves and surges; thus saving the crops,
lives and properties of coastal inhabitants; and
5) The slope faces of embankments need to be vegetated mostly by rows of open
canopied monocotyledonous trees like palmyra palm, date palm, coconut, betel nut
etc. which have the ability to withstand severe cyclone at the same time reduce the
wind velocity.

30
6. Areas for further research
1) Vast areas of coastal zones remain fallow during the Boro season due to lack of
proper initiatives by the farmers, researchers and extension workers to bring them
under Boro cultivation. And this happens mainly because of the prejudice conceived
by the local people about non productivity of crops due to salinity or brackish water.
But with identical landscapes in Indonesia, Philippines, Cambodia and other places
of Tropical Asia it has been possible to produce enough crops for the inhabitants.
Therefore, it is essential for the researchers and extension workers to explore the
possibilities of cultivating Boro and/or other crops in the regions by irrigating fields
with available water from the innumerable channels/canals.
2) Advancing the harvesting time of present Aman and Boro crops by a fortnight is a
crying need of the hours to avert the devastating effects of cyclones and tidal surges
which are just occurring and will continue to occur twice in a year that
commensurate with the harvesting time of these crops.
7. Conclusions
Evidences are indicative that the global warming has already set in as a result of increased
concentration of greenhouses gases in the atmosphere. In addition to formation of cyclones
and other potential changes global warming will lead to about 32 cm rise in sea-level by the
middle of the current century. The inequitable, varied and unpredictable effects of global
warming and sea-level rising should have devastating consequences on coastal agriculture
and livelihoods in Bangladesh. The negative impacts will engulf the whole nation but more
severe for coastal inhabitants where 35 million people could become at risk of climatic
refugees, hunger and food insecurity.
The coastal zone at present is a monocropped area predominately occupied by Aman in the
wet season, mostly fallow or sporadic Boro, pulses, vegetables and other crops in rest of the
year. The area is mostly characterized by net-work of rivers and criss-crossed of
innumerable canals and channels with easy vicinity of water which is considered to be
brackish during the dry season.

31
Tropical cyclones that form in the Bay of Bengal lashes Bangladesh coast twice in a year,
the most severe ones occurring in late October to mid November and late April to May.
Both periods coincide with the harvesting (maturity) time of major cereals i.e. Aman and
Boro, respectively. Therefore, to mitigate ill effects of global warming and ensuring
additional crop production for food security the policy makers, researchers, extension
workers, GOs and NGOs should set urgent priority to advance the harvesting of the Aman
and Boro crops by a fortnight, introduce Boro and other cereals and vegetables in the dry
season. If succeeded, the above practices not only ensure the food security but will turn the
entire area into a food surplus zone.
8. Acknowledgments
The financial support of FAO is gratefully acknowledged for the study under National Food
Policy Capacity Strengthening Programme (NFPCSP, CF-10).
This study was carried out with the support of the
National Food Policy Capacity Strengthening Programme

32
9. References
Agarwala, S., Ota, T., Ahmed, A.U., Smith, J. and van Aalst, M., 2003. Development and
Climate Change in Bangladesh: Focus on the Coastal Flooding and the Sundarbans.
Organization for Economic Cooperation and Development (OECD), Paris.
BBS, 2004. Bangladesh Bureau of Statistics (BBS). Statistics Division, Ministry of
Planning. Government of the People’s Republic of Bangladesh, Dhaka.
BBS, 2005. Statistical Pocket Book of Bangladesh. Statistics Division, Ministry of
Planning. Government of the People’s Republic of Bangladesh, Dhaka.
Bhuyan, M.S. and Khan, M.A.H., 1996. Introductory Agriculture and Environment (Krishi
Parichiti O Poribesh, in Bangali). Bangladesh Open University, Gazipur.
IPCC, 2007: Summary for Policymakers. In: Climate Change 2007: The Physical Science
Basis. Contribution of Working Group I to the Fourth Assessment Report of the
Intergovernmental Panel on Climate Change [Solomon, S., D. Qin, M. Manning, Z.
Chen, M. Marquis, K.B. Averyt, M.Tignor and H.L. Miller (eds.)]. Cambridge
University Press, Cambridge, United Kingdom and New York, NY, USA.
Karmakar, S. and Shrestha, M.L., 2000. Recent Climatic Changes in Bangladesh. SMRC
No. 4. SAARC Meteorological Research Centre (SMRC), Dhaka, Bangladesh.
Khan, M.S., Rahman, M.M., Begum, R.A., Alam, M.K., Mondol, A.T.M.A.I., Islam, M.S.
and Salahin, N., 2008. Research Experiences with Problem Soils of Bangladesh. Soil
Science Division, Bangladesh Agricultural Research Institute (BARI), Joydebpur,
Gazipur-1701.
WARPO, 2006. Coastal Developmental Strategy. Water Resources Planning Organization.
Ministry of Water Resources, Government of the People’s Republic of Bangladesh.
World Bank, 2000. Bangladesh, Climate Change and Sustainable Development. Report No
21104-BD.

33
10. Annexes (including details on model, data, sampling and detailed survey results, etc.)
Annex 1: Questionnaire for collecting socio-economic and livelihood data from the individual householder
1. Respondent Profile:a) Name of the respondents……………………………………b) Address………………………………………………………d) Head of the household……………Annual family income………….e) Age……..years, Education……… Occupation………….………….. f) Family size………………… Farm size…………………..decimal (dci)
2. Cropping patterns:Name of cropping patterns Area (decimal)(i)(ii)(iii)(iv)(v)
3. Crops cultivated:Crops Nature of crop cultivars
(put a tick mark (√)Land area Produc
tion (monds)
Yield(t/ha)
HYV Local Salt tolerant
Area (dci)
% of total cropped area
Boro rice
Aman riceAus riceWheatPotatoPulsesOil seedsVegetables (i)
(ii)(iii)(iv)
Others
4. Annual own production & shortage or surplus of staple food (i.e., rice) in mondsUnits Own production Requirements Shortage (-) Surplus (+)In monds (–) (+)In tons (–) (+)
5. Frequency of daily meal intake (times/day): Put a tick (√) mark whenever necessaryNormal conditions During/after disaster0 1 2 3 0 1 2 3
34
6. Types of food intake & their level: Put a tick (√) mark whenever necessaryTypes of food
Normal condition During/after disasterDaily Once a
weekOnce a month
Occasionally Daily Once a week
Once a month
Occasionally
RiceWheat flourVegetablesMeatFishEggMilkFruitsOthers
7. Status of livestock and poultry:Name of animals
Number Local Hybrid Others Approximate price (TK)
CattleDairy cowBuffaloGoatSheeppoultryDuckOthers
8. Loss due to disasters and managements: Crop sector/live-stock/fish/shrimp hatchery/forestryTypes of disaster (per time) Amount of loss (%) ManagementsFlood CycloneTornadoTidal surgeErosion HailOthers
9. Precautionary measures during disaster: Put a tick (√) mark whenever necessary
(a) Moving to saver places: ((i) Cyclone shelters (b) Macha’s/tongs(ii) Schools/Colleges (c) Own houses(iii) Public buildings/houses (d) Others (specify):(iv) Embankments(v) High roads(vi) Private pucca buildings
10. Food preservation system: Put tick (√) mark whenever necessaryMeans Rice Wheat Pulses Potato vegetables othersDolesEarthen potsMacha’sSika’sGunny bagsSynthetic bagsUnderground reservoirs others

35
Annex 2: Temperature and rainfall data used in the Figs. 6, 7, 9 & 10
Parameters Minimum Maximum Mean
Temperatures (oC)
Annual minimum 20.97±0.22 21.39±0.18 21.17±0.29
Annual maximum 30.12±0.14 30.58±0.21 30.33±0.29
Pre-monsoon maximum 32.08±0.50 33.04±0.32 32.63±0.63
South-west monsoon maximum 31.12±0.19 31.77±0.25 31.43±0.39
Post monsoon maximum 29.92±0.22 30.75±0.27 30.34±0.49
Winter minimum 13.58±0.26 14.30±0.31 13.94±0.46
Total rainfall (mm)
Annual 2225±191 2585±143 2417± 246
Pre-monsoon maximum 355±62 554±83 435±121
South-west monsoon maximum 1570±132 1870±100 1736±189
Post monsoon maximum 144±50 296±53 215±92
Winter minimum 24±10 61±21 38±23
± indicates standard deviation.
Annex 3: Level of observed highest salinity at selected stations of Bangladesh
SL
No.
Stations Electric conductivity in micro-mhos
1992 1993 1994 1995 1996 1997 1998 1999
1 Khulna 29.500 21.500 21.800 29.500 21.800 22.600 20.000 22.86
2 Chalna 36.000 26.500 26.700 38.500 25.100 24.100 29.280 28.35
3 Mongla 31.500 22.800 25.500 26.600 23.500 23.400 25.681 24.56
4 Nalianala 43.200 30.100 32.400 34.500 31.500 32.500 35.280 32.70
5 Patharghata 6.200 7.150 11.600 17.340 9.250 9.200 9.340 10.60
6 Barisal 0.330 0.745 0.680 0.319 0.308 0.300 0.408 34.39
Source: Bangladesh Water Development Board [cited from BBS, 2004]

36
Annex 4: Land-use and related agricultural data of some selected Thanas of three coastal districts
SL No.
Socio-economic and other traits Patharghata, Barguna
Sarankhola, Bagerhat
Sudharam, Noakhali
Char Jobbar, Noakhali
1 Total population of Thana 1,67,460 1,12,100 4,51,891 NAi) Male 85,608 55,790 2,26,333 94,690ii) Female 81,852 56,310 2,25,558 94,000
2 Population density (per km2) 432 NA NA NA3 No. of households 25,610 NA NA NA4 Total area of Thana (sq. km) 387 151 337 573
i) Total land area (ha) 30,626 NA NA NAii) Total agril. land (ha) 20,068 NA NA NAiii) Total cultivable land (ha) 19,968 9305 2,5856 66,433iv) Total fallow land (ha) 1,235 25 144 3530v) Current fallow land (ha) 100 NA NA NAvi) Fallow land in dry season NA 6515 8795 18,500vii) Total forest area (ha) 3,729 4135 1200 320viii) Single cropped area (ha) 5,899 NA NA NAix) Double cropped area (ha) 11,166 NA NA NAx) Triple cropped area (ha) 2,895 NA NA NAxi) Net cropped area (ha) 19,960 39,439xii) Total cropped area (ha) 37,416 NA NA NAxiii) Cropping intensity (%) 187 NA NA NAxiv) Salt pruned area (ha)
-extreme (40%) 8,624 NA NA NA-slight to medium (60%) 12,934 NA NA NA
xv) Irrigated area (ha) 500 5000 550xvi) Total household area 1686 2064 3,000
5 Crops grown areas (ha)i) Boro rice area NA 20 5450 531ii) Aman rice area 15,460 9200 20,060 33,700iii) Aus rice area 5,500 430 11,390 18,200iv) Wheat grown area NA 5 12 2v) Potato grown area NA 215 11 22vi) Pulses grown area NA 2740 2168 4500vii) Oil seeds grown area NA 15 7803 8600viii) Vegetable grown area NA 400 1,523 1770
6 Total rice production (M. ton) 36,244 24,294 72,764 78,000i) Rice requirement 30,935 NA NA NAii) Annual surplus (+) 5,309 NA NA NAiii) Annual deficit (-) NA NA -5986 NA
Source: Thana Agriculture Officer; NA: not available

37
Annex 5: Level of salinity of soil and water as observed in some selected coastal areas
SL. No.
Locations and descriptions of collected samples
Electric conductivity (ds M-1) RemarksSoil sample Water sample
1. Patharghata, Barguna 4.21 - Moderatelysaline
2. Rayenda Khal, Sarankhola, Bagerhat (21 May 2008)
- 2.66 Slightly saline
3. Pankuchi river (11:30 AM, 21 May 2008)
- 4.17 Moderatelysaline
4. Pashur river, Mongla, Bagerhat (12:30 PM, tide time, 22 May 2008)
- 28.70 Strongly saline
5. Janer Par, Sarankhola, Bagerhat (sample collected on 20 April 2008)
1.52 - None-saline
6. East Bridge, #2 Khonta Kata, Sarankhola, Bagerhat (sample collected from bil at 14 cm depth on 22 April 2008)
0.77 - None-saline
7. Bhashanzal, Morolganj, Bagherhat, samples collected on 21 May 2008 (same in the Plate 3).
0.75 8.54 None-saline/saline
8. Totar Bazar, Subarnachar, Noakhali (samples collected from on growing T Aman field on 24 September 2008)
2.35 0.30 Slightly saline/ none-saline
9. Char Jabbar, Subarnachar, Noakhali 6.66 - Moderatelysaline
10. Jubili Char, Noakhali (sample collected on 24 September 2008)
- 0.36 None-saline
11. Chairmangat, Boyarchar, Hatiya channel (sample collected at 12:00 PM on 24 September 2008
- 0.18 None-saline
Note: Electrical conductivity (Ec) 0-2, 2.1-4, 4.1-8, 8.1-15 and >15 ds M-1 respectively indicate non-saline, slightly saline, moderately saline, saline and strongly saline conditions for crop production (source: USDA, Agriculture Hand Book # 60, cited from Khan et al., 2008).
38
Annex 6: Types of food intake of the respondents in coastal area
Sites Type of food items
% of respondents taking food at normal condition
% of respondents taking food during or after disaster
Daily Weekly Monthly Occas. Daily Weekly Monthly Occas.
Patharghata, BargunaRice 100 0 0 0 100 0 0 0Atta 0 0 0 0 6 0 0 0Meat 0 30 26 6 3 7 0 0Fish 0 58 9 1 0 16 12 0Egg 1 42 4 0 3 4 1 0Milk 0 29 13 0 0 6 1 0Fruits 0 39 4 1 4 7 3 0Vegetable 3 43 35 19 3 33 26 13
Sarankhola, Bagerhat
Rice 100 0 0 0 100 0 0 0Atta 27 13 20 27 7 7 13 13Meat 0 13 40 40 0 7 20 40Fish 53 47 0 0 20 60 7 0Egg 7 87 0 0 7 33 27 0Milk 60 0 0 33 62 7 0 33Fruits 0 20 13 53 0 6 0 47Vegetable 87 13 0 0 67 20 0 0
Sudharam, NoakhaliRice 100 0 0 0 65 0 0 0Atta 0 65 0 0 0 53 15 0Meat 0 41 32 24 0 0 35 24Fish 12 76 0 0 0 29 35 0Egg 0 76 12 0 0 26 18 24Milk 18 0 35 29 0 12 6 35Fruits 0 18 53 18 0 0 18 12Vegetable 100 0 0 0 68 0 0 0
Char Jobbar, NoakhaliRice 100 0 0 0 100 0 0 0Atta 0 40 0 0 0 0 0 20Meat 0 30 70 0 0 0 20 10Fish 60 40 0 0 10 10 10 0Egg 0 90 10 0 0 10 0 20Milk 20 20 40 10 0 0 0 30Fruits 0 30 70 0 0 10 0 20Vegetable 100 0 0 0 30 0 0 0

39
Annex 7: Frequency of daily meal intake (time/days) of the respondents in coastal area
Name of Thana
Normal conditions During or after disaster% of respondents taking meal
(frequency/day)% of respondents taking meal
(frequency/day)0 1 2 3 0 1 2 3
Patharghata, Barguna
NA
Sarankhola, Bagerhat
0 0 20 80 0 0 47 53
Sudharam, Noakhali
0 0 0 100 0 0 77 24
Char Jobbar, Noakhali
0 10 0 90 0 0 30 70
NA: not available
Annex 8: Local cropping patterns of some selected Thanas of three coastal districts
SL No. Local cropping pattern Area (ha) %of contribution1 Patharghata, Barguna
NA2 Sarankhola, Bagerhat
T aman-Fallow-Fallow 5257 57.9T aman-Pulses-Fallow 2740 30.2T aman-Rabi crops-Fallow 600 6.6T aman-Fallow-Boro 20 0.2T aman-Rabi crops-Aus 430 4.7T aman-Potato-Vegetables 27 0.3
3 Sudharam, NoakhaliBoro-Fallow-fallow 4926 19.1T aman-Soybean-Aus 6490 25.1T aman-Ground nut-Aus 1290 5.0T aman-Chillii-Aus 600 2.3T aman-Mungbean-Aus 450 1.7T aman-Kheshari-Fallow 500 1.9T aman-Kheshari-Aus 780 3.0T aman-Fallow-Fallow 5740 22.2T aman-Rabi crops-Aus 5080 19.6
4 Char Jobbar, NoakhaliT aman-Soybean-Aus 4,300 15.3T aman-Groundnut-Aus 4,000 14.2T aman-Pulses-Fallow 4,500 16.0T aman-Water melon-Aus 1,600 5.7T aman-Fallow-Fallow 11,500 40.9T aman-Chillii-Aus 600 2.1T aman-Okra-Aus 500 1.8T aman-Others-Fallow 1,100 3.9
NA: not available, Source: through site visits
40
Annex 9: Nature of crops cultivated in some selected coastal Thanas
SL No.
Crops Nature of crops Area (ha)
%of total cropped area
Produc-tion (ton)
Yield (t/ha)HYV Local Salt tol.
1 Patharghata, Barguna: NA2 Sarankhola, Bagerhat
Boro √ 20 0.22 90 4.5Aman √ √ √ 9200 100.00 23000 2.75Aus √ 430 4.67 1204 2.8Wheat √ 5 0.05 11.5 2.3Potato √ 215 2.34 6020 28Pulses √ √ 2740 29.78 2740 1Oil seeds √ √ 15 0.16 15 1Vegetables √ √ 300 3.26 5400 17Others 100 1.09 1000 10
3 Sudharam, NoakhaliBoro √ √ 5450 21.07 24122 4.68Aman √ √ √ 20060 77.58 33422 1.93Aus √ √ 11390 44.05 15220 1.50Wheat √ 12 0.08 18 1.5Potato √ 11 0.08 165 15Pulses √ 2168 8.38 1915 1.13Oil seeds √ √ 7803 28.63 13896 1.43Vegetables √ √ 851 3.28 11581 13Others √ 672 2.59 840 1.25
4 Char Jobbar, NoakhaliBoro √ 531 1.3 2463 4.6Aman √ √ √ 33700 85 51345 1.52Aus √ √ √ 18200 46 24200 1.32Wheat √ 1.5 - 2.6 1.73Potato √ 22 - 330 15.00Pulses √ √ 4500 24 3150 0.7Oil seeds √ 8600 21 12040 1.4Vegetables √ √ 1770 2.5 22470 13.0Others
NA: not available, Source: through site visits

41
Annex 10: Nature of crop cultivars used in the coastal areas
Crops Patharghata, Barguna Sarankhola, Bagerhat
Sudharam, Noakhali
Char Jobbar, Noakhali
HYV Local Salt
tolerant
HYV Local Salt
tolerant
HYV Local Salt
tolerant
HYV Local Salt
tolerant
Boro Rice 11.92 88.06 1.49 NA NA NA 35.29 64.70 NA NA NA NA
Aman Rice 52.17 47.82 17.37 60 40 NA 52.94 47.05 NA 90 10 20
Aus Rice 26.08 73.39 2.90 100 NA NA 52.94 47.05 NA 50 50 10
Wheat 7.24 92.76 NA NA NA NA NA NA NA NA NA NA
Potato 23.18 76.81 NA 60 40 NA NA 100 NA NA NA NA
Pulses 2.90 97.10 NA 50 50 NA NA 100 NA NA 100 NA
Oil seeds NA 100 NA NA NA NA 11.76 88.23 NA 50 50 NA
Lalshak 2.90 97.10 NA NA NA NA NA NA NA NA NA NA
Tomato, Okra 1.44 98.55 NA NA NA NA NA NA NA NA NA NA
Brinjal 1.44 88.55 NA NA NA NA NA NA NA NA NA NA
Sweet potato NA 100 NA NA NA NA NA NA NA NA 100 NA
Chilli NA 100 NA NA 100 NA NA 100 NA NA 100 NA
Other vegetab - - - - - - 29.41 70.58 NA - - -
NA: not available
Annex 11: Average amount of annual production, shortage and surplus of rice of the respondents in coastal area
Name of Thana
Own production (mds)
Requirements(mds)
Shortage(mds)
% of respondents in shortage
Surplus (mds)
% of respondents in surplus
% of respondents in balance
Patharghata, Barguna
119.23 106.84 5.98 23.18 20.28 19.39 49.43
Sarankhola, Bagerhat
72.83 69.13 10.83 33.33 13.87 40 26.67
Sudharam, Noakhali
82.23 51.42 5.78 41.18 36.50 58.82 22.32
Char Jobbar, Noakhali
79.00 69.60 12.00 60 21 30 10

42
Annex 12: Status of livestock and poultry in coastal area
Sites Livestock and poultry items
Average Number/household
% of Local
% of Hybrid
% of others
Approximate average price (Tk)
Patharghata, BargunaCattle 1.86 98.43 1.57 0 24,446.87Dairy cow 0.48 100 0 0 9,484.85Buffalo 0 0 0 0 0Goat 0.23 100 0 0 318.85Sheep 0 0 0 0 0Poultry 10.12 94.40 5.60 0 118.62Duck 1.86 100 0 0 117.98
Sarankhola, BagerhatCattle 3.67 100 0 0 9000Dairy cow 0 0 0 0 0Buffalo 0 0 0 0 0Goat 2.06 100 0 0 2458Sheep 0 0 0 0 0Poultry 21.80 90 10 0 74.00Duck 3.25 100 0 0 134.69
Sudharam, NoakhaliCattle 1.29 88.23 11.76 0 8,614.7Dairy cow 0.23 0 100 0 80000Buffalo 0 0 0 0 0Goat 0.52 100 0 0 944.44Sheep 0 0 0 0 0Poultry 87.90 100 0 0 98.72Duck 12.76 100 0 0 143.96
Char Jobbar, NoakhaliCattle 2 100 0 0 12000Dairy cow 3 100 0 0 17333Buffalo 0 0 0 0 0Goat 0 0 0 0 0Sheep 0 0 0 0 0Poultry 18 100 0 0 100.13Duck 3.7 100 0 0 133.78

43
Annex 13: Distribution of holding reporting livestock and poultry birds and their
numbers (including commercial)
SL No.
Name of district
No. of cattle & buffalo
No. of goat & sheep
No. of fowls & ducks
No. of pigeons
Holding reporting
Number Holding reporting
Number Holding reporting
Number Holding reporting
Number
1 Barguna 83615 276276 33640 103131 154093 2290239 27617 263970
2 Barisal 181731 439385 62863 146895 371063 4008202 41316 308226
3 Bhola 101986 267234 69760 193205 297059 4326770 24592 211730
4 Jhalokati 56506 151464 20358 51230 120071 1390992 13384 112557
5 Patuakhali 141349 514172 53749 179890 242404 3675899 36972 294349
6 Pirojpur 71928 201489 29826 77982 182888 2481782 18599 141981
7 Bagerhat 100039 292351 47448 139218 244113 2356497 26408 195219
8 Jessore 276776 654579 216417 582110 418367 4443925 49764 417122
9 Khulna 108639 324421 68235 220669 277307 2900198 19027 144198
10 Narail 81787 188566 36943 95799 109445 986649 14721 119792
11 Satkhira 182663 439575 141179 418848 314690 2533009 24219 157930
12 Chandpur 141263 273135 55602 125624 340120 3186218 18362 111043
13 Chittagong 353825 830477 138121 357811 683833 7742288 58660 245323
14 Cox’s Bazar 102994 289794 51298 164700 233663 2501102 17780 95706
15 Feni 77735 154547 16704 44859 186336 2083298 16419 69130
16 Laksmipur 86661 178085 39487 97442 239272 2398205 20979 116598
17 Noakhali 150952 359526 79639 217492 400732 4571462 34985 176026
18 Gopalganj 96398 226487 32241 74535 152449 1383945 17828 153204
19 Shariatpur 84333 166395 56491 119014 181408 1771710 7756 84206
Source: Agriculture sample survey-2005, BBS [cited from pocket BBS, 2005]

44
Annex 14: Crop preservation systems in coastal area
Sites Preservation system % of respondents
Rice Wheat Pulses Potato Vegetable Others
Patharghata, BargunaDoles 61 0 22 0 0 0Earthen pots 62 0 22 0 0 0Macha’s 13 0 9 22 21 0Sika’s 0 0 0 0 0 0Gunny bags 32 1 1 0 1 0Synthetic bags 7 0 0 0 0 0underground reservoirs 0 0 0 0 0 0Others 0 0 0 0 1 0
Sarankhola, BagerhatDoles 60 0 27 0 0 0Earthen pots 33 0 7 0 0 0Macha’s 13 0 7 0 0 0Sika’s 0 0 0 0 0 0Gunny bags 7 0 0 27 0 0Synthetic bags 0 0 27 0 0 0underground reservoirs 0 0 0 0 0 0Others 0 0 0 0 0 0
Sudharam, NoakhaliDoles 6 0 0 0 0 0Earthen pots 0 0 0 0 0 0Macha’s 0 0 0 0 0 0Sika’s 0 0 0 0 0 0Gunny bags 71 0 35 0 0 0Synthetic bags 59 0 59 0 0 0underground reservoirs 0 0 0 0 0 0Others 0 0 0 0 0 0
Char Jobbar, NoakhaliDoles 50 0 0 0 0 30Earthen pots 20 0 0 0 0 0Macha’s 10 0 10 0 0 0Sika’s 0 0 0 0 0 0Gunny bags 10 0 10 0 0 0Synthetic bags 60 0 0 0 0 0underground reservoirs 0 0 0 0 0 0Others 20 0 20 0 0 0

45
Annex 15: Loss of agricultural enterprises due to disasters and their management in
coastal area
SL
No.
Types of
disaster
Amount of loss (%) Management
Patharghata,
Barguna
Sarankhola,
Bagerhat
Sudharam,
Noakhali
Char Jobbar,
Noakhali
1 Cyclone 43.33 52.33 26.64 12.5 None
2 Flood 35.57 9.13 26.76 9 None
3 Tornado 5.65 0 39.41 0 None
4 Tidal surge 6.37 0 1.76 0 None
5 Erosion 5.07 0 0 0 None
6 Hail 2.68 0 0 0 None
7 Others 1.52 0 0 1 None
Annex 16: Precautionary measures during disaster in coastal area
SL
No.
Types of Precautionary
measures
% of respondents who take shelter during disaster period
Patharghata,
Barguna
Sarankhola,
Bagerhat
Sudharam,
Noakhali
Char Jobbar,
Noakhali
1 Moving to saver places:
i) Cyclone shelter 35 20 41 30
ii) Schools/ Colleges 41 13 0 10
iii) Public buildings/ houses 17 0 0 0
iv) Embankments 9 0 0 0
v) High roads 28 0 0 0
vi) Private pucca building 7 7 0 0
2 Macha’s / tongs 6 0 0 0
3 Own house 16 53 59 30
4 Others 3 0 0 0
46
11. Plates
Plate 1: In spite of nearness to water sources vast cultivable land remains fallow during the Boro season in places of Barisal Division (photographs taken on 16 April 2008).
Plate 2: In spite of nearness to water sources vast cultivable land remains fallow during the Boro season in places of Bagerhat of Khulna Division (photographs taken on 21 May 2008).

47
Plate 3: Boro rice (hybrid var. Alo) has been successfully cultivated in Bhashanzal, Morolganj of Bagherhat by using the locally available surface water (photographs taken on 21 May 2008).
Plate 4: Shrimp cultivation is more popular than paddy in Mongla, Khulna region (pictures taken on 22 May 2008).

48
Plate 5: Vast land of growing Aman in Char Jabbar, Noakhali (photographs taken on 24 September 2008).
Plate 6: Fishing is one of the major enterprises in Hatiya people (photographs taken on 24 September 2008).