global value chains – a panacea for development?
TRANSCRIPT
Institute for International Political Economy Berlin
Global Value Chains – a Panacea for Development?
Author: Petra Dünhaupt & Hansjörg Herr
Working Paper, No. 165/2021
Editors: Sigrid Betzelt, Eckhard Hein (lead editor), Martina Metzger, Martina Sproll, Christina Teipen, Markus Wissen, Jennifer Pédussel Wu, Reingard Zimmer

Global Value Chains – a Panacea for Development?
Petra Dünhaupt & Hansjörg Herr•
Berlin School of Economics and Law, Institute for International Political Economy (IPE)
Abstract:
In the last decades in particular, national governments as well as development agencies and international organizations have increasingly turned to participation in global value chains (GVCs) as a development strategy. However, whether the positive development effects of integration are large enough to warrant trade liberalization cannot be answered in a straightforward manner. In this article, we show how development recommendations by international institutions and Western governments have changed since World War II and now ultimately recommend integration into GVCs.
Deregulation and liberalization of international trade and capital flows have fueled two opposing trends, which also affect GVCs: on the one hand, there is increasing concentration at the corporate level. On the other hand, globalization has resulted in more countries participating in international trade including via industrial production. Both developments have led to multinationals being able to expand their rent-seeking opportunities while also reducing production costs, especially for simple manufactured goods. Today, it is no longer sufficient for a country to industrialize in order to catch up with the rest of the world, as the prices for industrial goods and quality of productions have fallen tremendously in some cases, at least in comparison to developed countries. Integration into GVCs seems to provide only minimal macroeconomic benefits beyond the positive effects for individual companies and sectors. Industrial policy therefore seems indispensable for catch-up development.
JEL Classification Code: B27, F13, F63
Keywords: Global Value Chains, economic development, industrial policy, export market share concentration, import price development
Contact: [email protected]
• A revised version will be published in Teipen, C., Dünhaupt, P., Herr, H. and Mehl, F. (Eds.), Economic and Social Upgrading in Global Value Chains: Comparative Analyses, Macroeconomic Effects, the Role of Institutions and Strategies for the Global South, Palgrave. Forthcoming. For helpful comments and suggestions, we would like to thank Clare Hollins, Fabian Mehl and Christina Teipen.
1
1 Introduction
Development policy discourse has changed tremendously in recent decades, as have
economic policy recommendations in general. The spectrum ranges from a policy of import
substitution in the 1950s to radical market liberalization in the 1980s and 1990s. Whereas in
the post-World War II era developing countries relied heavily on industrial policy to achieve
post-colonial independence and also social development, the mere word and especially the
strategy of industrial policy was frowned upon by the 1980s (Andreoni and Chang 2019).
Ironically, developed countries have always practiced far-reaching industrial policy in areas
allowed by international treatises1. The financial and economic crisis of 2008-09 then opened
the way for a comeback of industrial policy (Chang and Andreoni 2016). The rapid
development of China, which has become a serious competitor to the U.S. and Europe in many
sectors and has made massive use of industrial policy for catching up, certainly also plays a
role for the renewed interest in industrial policy in the Global North.
During the last decades in particular, national governments as well as development agencies
and international organizations have increasingly turned to participation in global value chains
(GVCs) as a development strategy (Gereffi 2013; Werner et al. 2014).2 What makes this
concept so appealing is the oft-mentioned argument that, compared to the past, an entire
industry does not have to be built up; rather, countries can specialize in the production of
individual tasks or assembly activities in order to integrate themselves into international trade
(Baldwin 2011). These tasks can be simple from the perspective of the needed qualification of
the workforce and can be produced in big quantities for one or more companies in subsidiaries
of multinational enterprises (MNEs) or legally independent subcontractors. This allows the
MNEs at the top of the value chain, also known as ‘lead firms’, to exploit economies of scale
and cut costs in addition to benefiting from the low wages and in many cases low ecological
and social standards found in the Global South.
The World Bank enthuses about GVCs, including in its World Development Report 2020.
Among other things, GVCs are credited with enabling “an unprecedented convergence: poor
countries grew faster and began to catch up with richer countries. Poverty fell sharply” (World
1 For the case of Germany, refer to Dünhaupt and Herr (2020a and 2020b). 2 When we speak about integration of countries in the Global South in GVCs we speak of vertical value chains which are driven by cost advantages of countries in the Global South and not specific knowledge and capabilities of suppliers which can also be a motivation of lead firms which organize GVCs to outsource. Also, when we speak of Global South and Global North this is not a strictly geographical concept. Countries in the Global South can in certain industries have own lead firms which outsource to other countries. China is here the showcase.

2
Bank 2020, p. 1). The World Bank also attributes many other positive effects to GVCs, and
therefore recommends trade liberalization, not only for manufactured goods, but also for
services and agriculture.
Other authors, such as Rodrik (2018, p. 14), are less optimistic about the role of GVCs as a
development panacea, since:
“The affected sectors and activities remain a very small part of the domestic economy. New capabilities and productive employment remain limited to a tiny sliver of globally integrated firms.”
Hence, the question that arises is: are the development effects of integration into GVCs large
enough to warrant trade liberalization, as recommended by the World Bank? Or should
countries – as Rodrik (2018) recommends – rather focus on domestic integration and thus
concentrate on domestic-oriented industrialization?
In order to answer this question, this article is structured as follows: in the second part, we
show how development policy recommendations and strategies have changed since World
War II, and now favor integration into GVCs. In the third part, we move away from a firm focus
and examine whether countries have succeeded in industrializing and how increased global
competition affects terms of trade. In the fourth part, we examine whether there is a
relationship between participation in GVCs and macroeconomic indicators. The last part
concludes.
2 Shifting development strategies – from import substitution to export orientation to
global value chains
Import substitution development strategy
With the end of colonial rule after World War II and the striking disparities in income and
development between the Global North and Global South, many developing countries began
to practice one or another variant of import substitution policies. Latin American countries
were at the center of this development strategy. The main goal was to transform the structure
of the economy away from a backward (agrarian) economy and dependence on the export of
mineral resources towards an industry capable of producing industrial goods. The
development strategy popular after World War II assumed that unregulated markets will not
lead to catching up, as it was widely believed that “the market was an instrument that kept
poor countries poor and rich countries rich” (Bruton 1998, p. 905). Three strands of thinking
were decisive in this development strategy (see for details Bruton 1998).

3
First, based on Prebisch (1950) and Singer’s (1949) research, it was found that during the
decades before the 1940s the terms of trade for developing countries showed a secular
decline. The widely accepted explanation was that high productivity increases in the Global
North’s manufacturing sector did not lead to falling prices for manufactured goods, as the
monopoly power of firms and strong trade unions kept wages and profits, and thus prices,
high. In other words, the expected mechanism – that high productivity increases in countries’
export sector leads to falling prices and falling terms of trade – would not work. At the same
time, developing countries experienced low productivity increases in their export sectors,
mainly agriculture and minerals, while surplus labor from the big traditional subsistence sector
and weak trade unions also kept wages very low (Lewis 1954). Further, it was believed that
the income elasticity of demand for agricultural and mineral products was lower than for
manufactured goods. The expected consequence was that developing countries would run
current account deficits. As the efficiency of exchange rate adjustments were doubted from
this effect, low growth in developing countries was expected. The solution was seen in
building up an own manufacturing sector, by violating the market mechanism in order to
support the domestic manufacturing sector and its protection via tariffs and quotas, especially
in the field of durable consumption goods import.
Second, capital formation was understood to be particularly important as the source of
increasing productivity and thus as a trigger for growth. It was assumed that technology
embodied in capital goods could simply be imported and applied as it was in the country of
origin (Shapiro 2007). Export growth or even current account surpluses for the stimulation of
demand and output were not part of the import substitution strategy. Lack of domestic saving
and thus inadequate capital formation was seen as the problem. Foreign aid was therefore
welcomed as an instrument to stimulate domestic capital formation, and was very much
pushed by the World Bank in the 1960s (for a critique of the savings-gap approach, see
Easterly 1999). Of course, the huge private capital inflows and current account deficits that
would later emerge from the 1970s onwards in some of the countries in the Global South
could not be imagined at that time.
Third, there was the idea of replicating the Global North. Instead of continuing to import
manufactured goods and export primary commodities, countries should industrialize
themselves. Inspired by Lewis (1954), there was the belief that one day, by promoting a
modern capitalist sector with high growth, the latter would be able to absorb the surplus labor
4
from the subsistence sector, which would one day disappear and be replaced by the capitalist
sector3.
Although none of the countries practicing import substitution industrialization has ever
reached a stage of full convergence where a modern productive capitalist sector replaced the
traditional backward sector, some countries were able to achieve remarkable productivity and
growth rates until the 1970s. This together with social policies allowed countries to increase
life expectancy, decrease child mortality, and achieve other positive social effects (Bruton
1989). However, in 1979 the U.S. implemented very restrictive monetary policy to combat
inflation, triggering a severe worldwide recession. As a result, most countries in Latin America,
after deregulation of international capital flows and only one decade of high private capital
inflows, experienced deep balance of payments crises; the debt crisis of the 1980s was then
the final nail in the coffin of the strategy of import substitution industrialization (Shapiro
2007).
By contrast, East Asian countries pursued a dual strategy after World War II, since they not
only supported domestic industrialization via import substitution policies and comprehensive
industrial policy, but also massively promoted exports starting with simple manufactured
goods. Export promotion in these countries, and in many cases export surpluses, not only
stimulated domestic demand; rather, the export successes of sectors and companies also
became a criterium for successful industrial policy and government support. East Asian
countries supported the internationally competitive and, in many cases, newly created
industries whereas Latin America in many cases did the opposite (Stiglitz 1996). Based on their
low wages, East Asian countries also benefited from a new trend already starting in the late
1960s, when major retailers and brand-name manufacturers in the U.S. and Europe began
withdrawing from own production and sourcing from independent manufacturing suppliers
in overseas developing countries (Milberg et al. 2014).
The 1980s and the paradigm shift to export-oriented industrialization
Before we discuss the paradigm shift to export-oriented industrialization, let us look more
closely at how trade and foreign direct investment (FDI) developed from 1970 to 2019. From
the 1970s onwards, international trade in percent of GDP substantially increased worldwide.
3 According to Lewis (1954), workers from the subsistence sector come from diverse backgrounds, which include subsistence agriculture, casual labor, petty trade, domestic services, but also women in households. The capitalist sector is characterized among other things by profit-oriented firms with employees, an organized market for labor, capital and credit and the accumulation of reproducible capital goods.

5
Figure 1 shows the importance of goods exports as a share of GDP for various world regions
for these years. There was a first wave of increasing trade integration in the 1970s and a
second much stronger wave during the decade before the financial crisis of 2008-09 and the
subsequent Great Recession. Then there was a general break in the trend, with trade no longer
increasing faster than GDP. Exports-to-GDP ratios even dropped substantially in Africa and
Asia, indicating the poor economic development of the former and the intensifying trade war
between the U.S. and China in the latter. Latin American development during this period
reflects the “lost decade” of the 1980s, with massive opening up of trade following their
departure from import substitution strategies. From the mid-1990s until the Great Recession,
their export-to-GDP shares again increased sharply. North America had relatively low export
shares, mainly because of the U.S.’s size, whereas Europe had a high share because of the
many relatively small countries and the market result that, as a rule, small countries tend to
be deeper integrated into international trade than big countries. But also, for these regions
stagnating or falling export-to-GDP ratios can be observed. For the world as a whole between
1990 and 2008, real GDP expanded at an annual rate of 3.2 percent, while world trade volume
increased at an annual rate of 6 percent. After 2008 world trade did not grow faster that world
GDP (Davies 2013). Two reasons seem to be important to explain this break in international
trade dynamics. First, many countries gave up aggressive export-led growth strategies (see
below); second, since the financial crisis more and more protectionist tendencies and
especially a trade war between the U.S. and China developed.4
4 Global Trade Alert (2021) reports that after 2008, a sharp increase of worldwide government interventions which have negative economic consequences for other countries can be observed – a total of 21170 interventions between 2008 and 2021, from annually 1477 in 2009 to 2550 in 2020.

6
Figure 1: Goods exports in percent of GDP, various world regions, 1970-2019
Source: UNCTAD Statistics
To secure access to raw materials, companies from the Global North have already maintained
enterprises around the world since the 19th century. By the mid-20th century, it was the policy
of import substitution, accompanied by high import tariffs and import quotas, that led to
industrial manufacturing MNEs establishing production facilities in all parts of the world
through FDI, thereby controlling the entire production process (Milberg et al. 2014). However,
FDI flows in the 1950s and 1960s were small. Figure 2 displays FDI inflows in percent of GDP
for various world regions for the years 1970 until 2019. It shows that even until the early
1990s, FDI inflows as a share of GDP were relatively small in all world regions, at less than 1
percent of GDP. However, the liberalization and deregulation of international capital flows
gaining speed in the 1980s and step-for-step for most countries in the Global South by the
1990s led to a massive increase in the level of FDI inflows. It also becomes apparent that FDI
flows are very volatile and pro-cyclical, increasing in boom periods and shrinking during global
downturns. The enormous spikes shown in the figure can be explained by mergers and
acquisitions (M&As) rather than by greenfield investment5. Volatility and level of FDI flows
also remained high after the 2008-09 financial crisis.
5 The hostile takeover of Mannesmann by Vodafone in 2000, for example, is – at 180 billion euros – still considered the most expensive takeover of all times (Spinnler 2020).
0
5
10
15
20
25
30
35
40
1970 1975 1980 1985 1990 1995 2000 2005 2010 2015
Africa Asia Europe Latin America North Amercia

7
Figure 2: Foreign direct investment inflows in percent of GDP, various world regions, 1970-2019
Source: UNCTAD Statistics
The paradigm of export-oriented industrialization prevailed in the late 1970s and in the 1980s,
many developing countries shifted strategy away from import substitution policies. Successful
Asian countries (first Japan, and then especially the ‘Asian Tigers’ Hong Kong, Singapore, South
Korea and Taiwan) utilized export-oriented development policy from the beginning for their
very effective catching-up strategy. But these countries also combined export orientation with
import substitution and massive industrial policy, supporting own national champions,
establishing completely new industries and developing new comparative advantages with the
aim of increasing domestic value creation and international competitiveness (Wade 2003).
The new export orientation thus followed a different philosophy. It was understood that
existing comparative advantages should be used and supported by foreign capital. To develop
national champions and new comparative advantages in the framework, comprehensive, but
also industry-specific, industrial policy disappeared. Politically this rethinking took place
together with the victory of neoliberalism (Gereffi 2013), which started with the election of
Margaret Thatcher (1979) in Great Britain and Ronald Reagan (1980) in the U.S. International
organizations embraced the idea of the Washington Consensus, which stressed privatization,
deregulation and liberalization of markets as well as the important role of FDI for development
(Williamson 1989). Due to the debt crisis of the 1980s, many developing countries, especially
-1
0
1
2
3
4
5
6
7
8
1970 1975 1980 1985 1990 1995 2000 2005 2010 2015
Africa Asia Europe Latin Amercia and the Caribbean Northern America

8
in Latin America (and after the Asian crisis in 1997 also a number of Asian countries) had to
turn to the International Monetary Fund (IMF) and the World Bank. Both institutions began
linking the provision of help in form of loans to the implementation of structural adjustment
programs. These programs included the liberalization of trade, financial markets, the opening
for FDI, as well as cuts in public spending (Chang 2006; Summers and Pritchett 1993; Herr and
Priewe 2005).
The benefits of economic openness and the new export strategy were underpinned by three
strands of argument (Palley 2011). The first line of argument relates to the Heckscher-Ohlin
theory of comparative advantage, which states that countries with the same technological
knowledge, but different factor endowments can benefit from free trade, if they concentrate
on the production of the good which uses their abundant factor extensively. Compared to the
approach of David Ricardo, who stressed the importance of different technical and
educational development stages as the basis of comparative advantages, the reliance on this
theory is revealing. By using Heckscher-Ohlin the main problem of development, i.e., reaching
the technological and skill-level of advanced countries, is excluded by definition. The second
line of argument relates to the problem of rent-seeking by companies in the Global South,
which was closely associated with the strategy of import substitution and import licenses and
thus protection from foreign competition, and which could be wiped out by free trade
(Krueger 1974). Rent-seeking by companies in the Global North via technological leadership
and patent law was (again, revealingly) not a point in the debate. A third line of argument
pointed to a positive link between free trade and economic growth. In the neoclassical
paradigm any increase in efficiency as a result of better supply conditions leads to higher
growth. The demand side of economic growth and development becomes completely
neglected in this framework. In addition, in an influential paper in the early 1990s, Grossmann
and Helpman (1991) argued that integration in global trade would lead to productivity growth
through technology diffusion and knowledge spillovers. Empirically, advocates of export-
oriented industrialization seemed to be proven right by the success of the East Asian Tiger
countries. But these countries, as mentioned, not only relied on export-driven growth, but
also made massive use of industrial policy instruments, which has often been overlooked in
the debate (Amsden 1989; Stiglitz 1996; Chang 2003).
9
The 1990s and the acceleration of trade fragmentation in the form of GVCs
While companies and retailers initially outsourced entire production operations, by the early
1990s trade started to become increasingly fragmented. Instead of trading only finished
products, trade in components and intermediate products increased significantly. It was also
no longer just simple goods such as clothing and toys that were outsourced to countries in the
Global South, as it had been in the beginning. The range of industries involved increased and
simple tasks for high-tech goods, for example in the production of mobile phones, as well as
services were targeted by outsourcing activities (Gereffi 2013). The trend was spurred by two
further developments: innovation in transportation and information technology, leading to a
sharp drop in these costs, as well as international trade and capital flow liberalization,
including the creation of the World Trade Organization (WTO) in 1994. Today, the majority of
global trade - estimates vary between 50 and 65 percent - takes place through GVCs (Dollar
2019; World Bank 2020).
GVCs vary from industry to industry. The GVC literature has put the spotlight on firm
relationships - between the so-called lead companies, in most cases MNEs, that establish
governance relationships6 with foreign suppliers (Dallas 2014). A lead company usually has a
lot of power vis-à-vis suppliers. It decides which companies get access to a GVC in the first
place and it also massively influences suppliers’ chances for ‘economic upgrading’, which
refers to the ability to either realize more value added within one’s own chain - be it through
process, product or even functional upgrading - or even move to a new industry where more
added value can be achieved (Humphrey and Schmitz 2002).
Since the late 1990s, GVCs have also started to play a role in development policies via
international organizations and foreign donors’ national development agencies. GVC
participation was considered an important element of national development strategies, but
the main aspects of GVCs that were adopted are very market-friendly and focus on the export
sector. It was hoped that GVCs would not only create market access for firms in global markets
and support upgrading (Staritz 2012), but also that GVCs would, starting from the microlevel,
transform whole industries and countries (Dallas 2014). This idea is also stressed by Gereffi et
al. (2005, p. 79):
6 The governance in GVCs represents the “authority and power relationships that determine how financial, material, and human resources are allocated and flow within a chain” (Gereffi 1994, p. 97).
10
“The evolution of global-scale industrial organization affects not only the fortunes of firms and the structure of industries, but also how and why countries advance – or fail to advance – in the global economy.”
Macroeconomic effects have been studied only more recently (Carballa Smichowski et al.
2020), whereas if the focus is only on individual firms and sectors, conclusions for
macroeconomic developments are not possible. Baldwin (2011) argues that while
industrialization became easier in times of GVCs, because countries only have to join a supply
chain instead of building a whole industry, it also became less meaningful. Gereffi (2013, p.
10), not only stressing the positive effects of GVCs, argues in the same direction and points
out that export-oriented industrialization (EOI) is no guarantee for successful development:
“If countries are only engaged in the simplest forms of EOI, such as assembling imported parts for overseas markets in export-processing zones, then they would develop neither the institutions, nor the know-how, nor the consumer markets needed to create and sustain entire industries.”
It is, of course, possible that individual firms that manufacture for export will become more
productive. However, whether these firms or sectors will remain isolated and create "enclave
industrialization" without many positive spillovers to the rest the economy remains an open
question.
3 Economic development related to GVCs
In this section we will discuss macroeconomic effects of GVCs further. First, the question is
asked whether GVCs led to industrialization in the Global South. Second, development of
market concentration and connected with this the possibilities of rent-seeking are analyzed.
Third, it is shown how terms of trade for different product categories developed.
Global value chains and industrialization
At first glance, developing countries seem to have succeeded in industrializing, integrating
into the international distribution of labor in the manufacturing sector, and also in breaking
away from the sole dependence on primary goods exports. The aim of the import substitution
period, i.e. industrialization, seems to have been – at least to a large extent – realized after
the 1990s. In 1995, one quarter of all exported manufactured goods originated in developing
countries (Figure 3). In 2019, developing countries’ share of world exports of manufactured
goods even amounted to 45 percent. However, what also becomes apparent from the figure
is the fact that this tremendous increase is mainly attributable to China – “the world’s factory”.
Excluding China, the increase was far less impressive. Developing countries’ share still

11
accounted for approximately 27 percent of all manufacturing goods exports in 2019, and
hence was almost the same as in 1995.
Figure 3: Developing countries' share of world exports of manufactured goods, 1995-2019
Source: UNCTADSTAT (2021)
Note: Manufactured goods (Standard International Trade Classification (SITC) 5 to 8 less 667 and 68)
Table 1 gives a more detailed picture of the development and importance of the
manufacturing sector for economies in different world regions. At the world level,
manufacturing value added (MVA) as a share of domestic GDP almost did not change and
increased only slightly from 17 percent in 1970 to 18 percent in 2013. However, the
development differs in the various parts of the world. In the U.S., the share of MVA as a
percent of GDP was 13 percent in 1970, and remained almost the same in 2013. In the same
period, the share of MVA in GDP deceased in Western Europe from 22 percent in 1970 to 18
percent in 2013, in Latin America and the Caribbean from 20 percent to 16 percent and in Sub-
Saharan Africa from 14 percent to 11 percent. In Asia without China, the MVA shares increased
from 16 percent in 1970 to 20 percent in 2013. Only China experienced a tremendous increase
from 9 percent in 1970 to 36 percent in 2013 (Rodrik 2015). Rodrik also shows that in 2013,
the U.S. had a share of world MVA of 19 percent, Western Europe 13 percent, Latin America
and the Caribbean 6 percent, Sub-Saharan Africa 1 percent, China 18 percent and the rest of
Asia 26 percent. Hence, Africa never managed to industrialize to any relevant extent; indeed
0
5
10
15
20
25
30
35
40
45
50
1995 1997 1999 2001 2003 2005 2007 2009 2011 2013 2015 2017 2019
Developing countries Developing countries without China

12
in Latin America and the Caribbean, as well as in Africa, there was even deindustrialization.
Only Asian countries managed to industrialize to a relevant extent and the U.S., in contrast to
widespread perception, actually remained relatively industrialized. Also, the countries not
covered by the groups mentioned in Table 1, mainly countries of the former Soviet Union,
deindustrialized substantially and in 2013 only realized a share of world MVA of 17 percent.
This means the concerns of economists like Prebisch and Singer, that developing countries
would not be able to industrialize to levels comparable with developed countries for many
parts in the world, could not be removed.
Table 1: Manufacturing Value Added (MVA) in percent of domestic GDP; various world regions, 1970-2013
WORLD UNITED
STATES
WESTERN
EUROPE
LATIN
AMERICA
AND
CARIBBEAN
ASIA
(WITHOUT
CHINA)
CHINA SUB-
SAHARAN
AFRICA
1970 17 13 22 20 16 9 14 1980 16 12 20 20 16 16 15 1990 16 12 19 19 19 18 15 2000 17 13 18 19 19 29 13 2010 28 13 18 17 21 36 11 2013 18 13 18 16 20 36 11
Source: Rodrik (2015)
There appear to be major regional differences in how countries in different regions of the
world are integrated into GVCs: according to the World Bank (2020), countries in East Asia,
North America, and Western Europe produce sophisticated industrial goods and services, and
are integrated into complex GVCs with their innovative activities, while countries in Africa,
Latin America, and Central Asia specialize mainly in extracting commodities, and some in
limited manufacturing. This distribution is reminiscent of the “smile curve”, the image that is
frequently used when describing who takes on which tasks within a value chain, and which
shows that the tasks with high value-added take place in the Global North, while tasks with
low value-added are outsourced to the Global South.
Figure 2 shows that FDI inflows to the Global South, especially Africa and Latin America,
increased in the 1990s – pushed by the Washington Consensus which stressed opening up for
FDI inflows as a key development policy. Yet despite high FDI inflows, successful
industrialization did not take place. To understand this, it should be made clear that not all
FDI adds to industrialization in the host country. High FDI inflows should not be mixed up with
high gross capital formation. In case of M&As there may be only a change in ownership not

13
leading to new investment in machines or new technologies. Also, FDI can crowd out relatively
high value adding domestic investment. So while FDI inflow to Latin America was high in the
1990s, gross capital formation was low or stagnated (Akyüz 2017, p. 178ff.). Last but not least
the structure of FDI inflows plays a role. There is evidence that FDI inflows in the
manufacturing sector has higher effects on productivity development than FDI inflows in the
real estate sector, the financial sector, the retail sector or the service sector in general. In
addition, investment in the service sector is less export-oriented (Alfaro and Charlton 2007;
Mencinger 2003; Peărić et al. 2021). This is highly plausible. FDI in the real estate sector is
often speculative and increases asset bubbles with negative effects for long-term economic
development. FDI in the retail sector can lead to a stimulation of imports as big retail
companies source worldwide rather than locally. Moreover, the dominance of foreign
financial institutions in domestic markets does not stimulate domestic credit expansions as
foreign financial institutions lack the necessary knowledge of the domestic market or may shy
away from risk and tend to channel domestic monetary wealth to financial markets they know
in developed countries (Stiglitz and Greenwald 2003).
Between 2010 and 2019 the value of worldwide annually announced greenfield FDI fluctuated
around USD 800 billion. The net value of annually announced net cross-border M&As from
2010 to 2014 was around USD 400 billion, jumped to around USD 800 billion, and dropped in
2019 to USD 500 (UNCTAD 2020, p.16). As these data show, a substantial portion of FDI flows
are minimally beneficial M&As. From the greenfield investments, the average of the years
2018 and 2019 went first of all USD 445 billion to the service sector, followed by the
manufacturing sector with USD 435 billion and the primary sector with USD 33 billion. Among
the top 10 industries for greenfield investment in 2018 and 2019 were construction,
accommodation and food service activities, information and communication, or financial and
insurance activities, sectors which are not in the centre of manufacturing (UNCTAD 2020, p.
16).7
Concentration trends in selling markets of lead companies
Rent-seeking capacities of lead firms in GVCs depend, beside monopsony constellations on
their supply side, on the market constellation in the markets they sell their products. In case
7 The other sectors were electricity, gas, steam and air-conditioning supply, coke and refined petroleum products, motor vehicles and other transport equipment, computer, electronic, optical products and electrical equipment, chemicals and chemical products and transportation and storage.

14
of a monopoly position in a big market the power of a lead company for rent-seeking is the
highest. In case of pure and monopolistic competition the big number of firms and the easy
entry and exit of firms in the market prevents any rent-seeking. Between very competitive
markets and a monopoly there are various degrees of oligopolistic markets which can be
measured by concentration indicators.
Deregulation and liberalization of international trade and capital flows have fueled two
opposing trends, which also affect GVCs. On the one hand, there is increasing consolidation
at the corporate level. A giant takeover wave through M&As has contributed to a rise in global
market concentration. Nolan et al. (2008) demonstrate for the example of four sectors
(aerospace, automobiles, telecommunications, beverages) that not only has the degree of
concentration at the level of lead firms risen sharply, but that this effect extends throughout
the entire supplier network. The increasing monopolization trend is particularly pronounced
in the U.S. Stiglitz (2019, p. 55) reports that the number of competitors in U.S. markets has
been falling and the market share of the top two or three firms has been increasing. Between
1997 and 2012 in 75 percent of industries such concentration processes in the U.S. took place
with the effect of a concentration of profits in the most powerful companies.
Concentration processes in final consumer markets such as the U.S. does not mean that
concentration in general has increased. The liberalization of trade and capital flows and the
intensification of globalization gives grounds to expect more competition in many markets. To
determine how the global level of concentration has changed around the world, we follow
Mayer et al. (2002) and Milberg and Winkler (2013) and measure market share concentration
in world exports for several industries with a modified Herfindahl-Hirschmann Index (HHI).
While the HHI usually takes into account the number of firms in an industry, the number of
countries exporting a certain product is considered here.8 Evaluations by government
agencies are helpful for judging the index, even if they refer to the degree of concentration at
8 We calculate the modified HHI for each product by taking the sum of the squared values of the market shares of all countries that export a particular product, and by multiplying the sum by 10,000:
!!"! =$%&'"!&'#!($∗ 10,000
"
where EX represents the export of product i of country c as a share of world w exports EX of product i. The HHI ranges between 10,000/n – which would indicate that each country (n = number of countries) has the same export market share in product i’s total exports, and 10,000, meaning that only one country exports product i.
15
the firm level. In the U.S., the competition authorities consider an HHI of 2,500 already
presenting a highly concentrated market (Milberg and Winkler 2013).
Table 2 displays the development for export market share concentration for a selection of
industries, designated at the three-digit sector level using the Standard International Trade
Classification (SITC) for the years 1980, 1990, 2010 and 2018. As can be expected, the degree
of concentration of exporting countries of a good has declined over the observation period,
i.e., for 79 percent of products in all sectors, which means that a greater number of countries
are now exporting these goods. This development can be attributed to increasing trade
integration, triggered among other things by lower transport costs. The trend towards a
decline in export market share concentration runs through all sectors’ product categories,
from primary goods to low-technology manufacturing goods to high-technology
manufacturing goods. But a further development is striking: even if there was an overall
decline in the degree of concentration between 1980 and 2018, the degree of concentration
in some – mostly low-technology manufacturing sectors – intensified (again) after 1990.
Conventional wisdom suggests that when barriers to entry are low and competition
intensifies, prices tend to fall. However, prices can also fall in cases of increasing
concentration. If one country or producer can achieve high economies of scale and average
costs and prices continuously fall, other suppliers have little chance of entering the market or
are kicked out of the market, because they can no longer compete. This is what happened
after China's accession to the WTO in 2001 and China taking over the role as "world’s factory".
Let us take the case of the garment sector (compare SITC Code 842 and 844) as an example.
The global garment industry was for a long time highly regulated.9 The final liberalization of
the sector in 2005 led to significant shifts in production and a high concentration of production
in fewer countries, most notably China, where in 2018 almost 32 percent of all garments
exported worldwide were produced. Many countries could not withstand the low-cost
competition from China based on economies of scale and superior technology and were
forced out of the market. This was particularly the case in Latin America. However, the "China
effect" is not only seen in the apparel sector. In 2018, in 22 percent of all sectors, China is
responsible for more than 20 percent of all exports.
9 The famous Multi-Fiber Agreement (MFA), in force from 1974 until 1994, gave quotas for exports of garment and textiles producing countries in the Global South. It was replaced by the Agreement on Textiles and Clothing (ATC), in force until 2005, which phased out all quotas.

16
Table 2: Export-market share concentration by Standard International Trade Classification, 1980-2018*
SITC
CODE**
INDUSTRY 1980 1990 2010 2018
1 Beverages and Tobacco 111 Non-alcoholic beverages 1063 1083 644 592 112 Beverages 1756 1788 1201 1135 121 Tobacco, unmanufactured 3089 1415 887 712 2 Crude Materials, inedible, except fuels 261 Silk 3163 7131 6614 4532 262 Cotton 4843 1822 2100 2173 266 Synthetic fibers suitable for spinning 1328 910 791 793 4 Animal and Vegetable oils, fats and waxes 411 Animal oils and fats 2648 1511 786 685 5 Chemical and Related Products 541 Medicinal and pharmaceutical products 972 868 986 1057 582 Condensation, polycondensation and polyaddition products 1387 1092 654 601 6 Manufactured Goods Classified Chiefly by Material 611 Leather 813 839 827 676 625 Rubber tires 1094 836 612 625 651 Textile Yarn 796 600 718 900 652 Cotton fabrics, woven 700 597 1793 2346 633 Cork manufactures 4702 4602 3647 3436 672 Ingots and other primary forms, of iron or steel 1265 795 585 501 673 Iron and steel bars, rods, angles, shapes and sections 1035 605 519 512 7 Machinery and Transport Equipment 721 Agricultural machinery 1165 947 908 825 722 Tractors 1671 1358 873 907 736 Metal cutting machines tools 1431 1235 1098 1050 751 Office Machines 1951 1664 1651 978
752 Automatic data processing machines 1814 1117 2519 1938 761 Television receivers (Monitors and projectors) 1684 761 1156 1541 764 Telecommunication equipment 1110 1132 1358 1944 771 Electric power machinery 1028 773 991 983 773 Equipment for distributing electricity 995 698 556 583 775 Household type, electrical and non-electrical equipment 1059 972 1229 1401 781 Passenger motor cars 1702 1537 1074 870 785 Motorcycles 4179 1839 1121 1745 791 Railway vehicles & associated equipment 1065 838 966 861 792 Aircraft & associated equipment, and parts thereof 3206 2723 1850 1563 793 Ships, boats and floating structures 1375 1115 1438 912 8 Miscellaneous Manufactured Articles 831 Travel goods, handbags and similar containers 1305 1046 2470 1793 842 Outer garments, men’s and boy’ s of textile fabrics 729 497 1290 1141 844 Under garments of textile fabrics 1258 615 1218 1192 851 Footwear 1995 1110 1794 1333 873 Optical instruments and apparatus 1353 1341 746 955 894 Baby carriages, toys, games and sporting goods 958 749 1823 1876
*Value of 10,000 is the highest value in case only one country is exporting the good. ** SITC Classification Revision 2 was chosen to allow comparison of a time period as long as possible. The dataset contains 236 sectors. Source: Data: UN Comtrade via World Integrated Trade Solutions (WiTS).
The conclusion is that globalization increased competition in most of the markets, but there
are strong tendencies towards concentration of exporting countries of a good in some markets
mainly because of the China effect. Overall, intensified global competition goes along with
17
increasing concentration, for example in the U.S. This very much supports the theoretical
conclusion that in GVCs lead firms, usually MNEs, are in a double-rent-seeking position – an
oligopoly constellation on the selling side and intensive competition or even monopsony
constellation on the supply side.
Terms of trade effects of different groups of goods
For the U.S., Milberg (2008) showed that import price deflation over the period 1986-2006
was very pronounced in sectors that show both fast technological development and in which
GVCs play an important role. In fact, he found that over this period, real import prices in these
sectors declined for the U.S. by 40 percent. These calculations also correspond with recent
calculations by Mark Anner (forthcoming), who has shown that real import prices of apparel
items into the U.S. have fallen by 60 percent over the past 30 years.
Table 3 shows real import price changes between 2000 and 2018 for goods imports from the
rest of the world to the European Union for selected industries. Particularly in the case of
manufactured goods, there was a considerable decline in prices in some industries. The
decline in prices was especially pronounced for machinery of all kinds, where real import
prices fell by more than 40 percent during the period under observation. However, we can
also observe a sharp drop in prices for low-technology goods such as textiles (-32 percent),
apparel (-28 percent), footwear (-10 percent) and miscellaneous manufactured articles (-4
percent), which includes toys. Also noteworthy is the substantial decrease in the prices of
electronic goods (-57 percent) and computers (-47 percent).
On the other hand, real import prices of primary products increased during the period under
investigation, as for example in the case of coffee10, tea, cocoa (+16 percent), vegetables and
fruit (+34 percent), iron and steel (+38 percent), gas (+59 percent) and petroleum (+62).
This development between 2000 and 2018 is certainly in contrast to what Prebisch and Singer
predicted in the 1950s, namely that prices for primary products would relatively fall and prices
for manufacturing products would relatively rise.
10 In the case of coffee, however, it must be mentioned that coffee prices were already in crisis and extremely low in the early 2000s, the starting period of our study (for an overview about the development of coffee prices, compare Amrouk 2018).

18
Table 3: Real Import price changes between 2000-2018, European Union
SITC CODE
INDUSTRY PRICE CHANGE
IN % 73 Metalworking machinery -58.48 77 Electrical machinery, apparatus and appliances. n.e.s., and electrical parts thereof
(including non-electrical counterparts, n.e.s., of electrical household-type equipment)
-57.06
75 Office machines and automatic data-processing machines -47.95 72 Machinery specialized for particular industries -46.08 87 Professional, scientific and controlling instruments and apparatus, n.e.s. -43.84 65 Textile yarn, fabrics, made-up articles, n.e.s., and related products -31.96 93 Special transactions and commodities not classified according to kind -31.78 59 Chemical materials and products, n.e.s. -31.48 25 Pulp and waste paper -29.08 74 General industrial machinery and equipment, n.e.s., and machine parts, n.e.s. -28.75 84 Articles of apparel and clothing accessories -27.69 58 Plastics in non-primary forms -25.90 71 Power-generating machinery and equipment -25.60 24 Cork and wood -20.56 12 Tobacco and tobacco manufactures -20.55 78 Road vehicles (including air-cushion vehicles) -13.34 27 Crude fertilizers, other than those of division 56, and crude minerals (excluding coal,
petroleum and precious stones) -11.77
85 Footwear -10.18 63 Cork and wood manufactures (excluding furniture) -10.04 62 Rubber manufactures, n.e.s. -8.11 26 Textile fibers (other than wool tops and other combed wool) and their wastes (not
manufactured into yarn or fabric) -7.64
61 Leather, leather manufactures, n.e.s., and dressed fur skins -7.32 89 Miscellaneous manufactured articles, n.e.s. -4.15 57 Plastics in primary forms -2.68 64 Paper, paperboard and articles of paper pulp, of paper or of paperboard 0.56 66 Non-metallic mineral manufactures, n.e.s. 6.38 69 Manufactures of metals, n.e.s. 8.18 83 Travel goods, handbags and similar containers 8.58 07 Coffee, tea, cocoa, spices, and manufactures thereof 15.89 05 Vegetables and fruit 34.18 67 Iron and steel 37.93 76 Telecommunications and sound-recording and reproducing apparatus and
equipment 43.14
54 Medicinal and pharmaceutical products 48.06 34 Gas, natural and manufactured 58.80 33 Petroleum, petroleum products and related materials 62.16 11 Beverages 82.96 97 Gold, non-monetary (excluding gold. ores and concentrates) 88.89 28 Metalliferous ores and metal scrap 94.19 32 Coal, coke and briquettes 95.00 96 Coin (other than gold coin), not being legal tender 133.40 41 Animal oils and fats 193.57 79 Other transport equipment 391.85
Source: Import data derived from Eurostat; GDP deflator Federal Reserve Bank of St. Louis Note: GDP deflator for the European Union; index 2015=100; n.e.s. = not elsewhere specified; SITC classification revision 4, two-digit-level

19
The explanation for the relative price increase of primary products is manifold. In general,
prices for primary goods are relatively volatile because supply is inelastic in the short term and
demand as well. Thus, shocks like bad harvests lead to price hikes. In addition, some
commodities have become objects of speculation. Moreover, for some primary products, the
relative increase in prices can be found in the scarcity of some natural resources and the
establishment of supplier cartels, the most famous being the Organization of the Petroleum
Exporting Countries (OPEC). These countries were able to exploit the gifts of nature. However,
a different question is who gets the rents from natural resources. In many cases the companies
realizing rents are MNEs, as for example in the oil sector of Nigeria. Or as the United Nations
Economic Commission for Africa (UNECA 2016) reports, 90 percent of the income derived
from coffee goes to the countries where MNEs have their headquarters, rather than to the
countries where the coffee is produced and exported.
There are various theoretically possible explanations for the enormous drop in relative import
prices that can be observed in certain manufacturing sectors. First, better technology and
exploiting economies scale increased productivity; second, lower costs caused by factors
other than productivity increases, for example lower wage costs; third, higher competition.
The last two points are linked to GVCs. Shifting manufacturing tasks to the Global South
substantially reduces wage and other costs. And monopsony power of lead companies
increases competition and bring prices down to a minimum. For low technology manufactured
goods, we can assume that all three price-reducing factors mentioned above play a role, with
the result that countries in the Global South only reap relatively small benefits from
integrating in GVCs. UNECA (2016, p. 151) makes exactly this point:
“… developing countries are likely to suffer from a ‘fallacy’ of composition’ – many of them entering the production of low-technology manufacturing goods in the belief that it will significantly boost their export earnings, only to find out that the earnings are nowhere as high as expected, as the prices of those goods have fallen exactly because so many countries have started to producing them.”
What we find here is that in extreme cases, the productivity increases achieved in producing
export goods and respective tasks in GVCs can lead to very low welfare effects for the
exporting countries and even to immiserizing growth, which means growth which does not
lead to more domestically available goods and services (Bhagwati 1958).
In the following, to test the terms-of-trade hypothesis by Prebisch and Singer for the period
from 2000 to 2018, we look at terms of trade development for country groups in the Global
South mainly exporting primary goods or simple manufacturing goods. Figure 4 shows the

20
terms of trade index for various countries whose exports are heavily dependent on natural
resources.11 These countries have partly benefited from very favorable terms of trade.
However, the focus on raw materials has also favored another rather negative development,
in the form of poor industrial development or even tendencies of deindustrialization. Very
often, resource rich countries suffer from a persistent overvaluation of their exchange rates
for the industrial sector and a shrinking industrial base, even if they realize current account
surpluses. In addition, the relatively low-price elasticities of natural resources lead to high
price volatility, which is reinforced by speculation in futures markets. Finally, natural resource
wealth stimulates rent-seeking of domestic elites and foreign companies and can lead to the
so-called ‘resource curse’ (Humphreys et al. 2007). 12
Figure 4: Terms of trade index (2000=100); various commodity exporting countries; 2000-2019
Source: World Bank 2021; World Development Indicators. Note:
Note: Net barter terms of trade index is calculated as the percentage ratio of the export unit value indexes to
the import unit value indexes, measured relative to the base.
11 In 2018, 55.7 percent of all Argentine exports were agricultural products, and 4.6 percent were fuels and mining products. In Brazil, agricultural products accounted for 38.9 percent and fuels and mining products for 24.6 percent of all exports in 2018. In Chile, agricultural products accounted for 32 percent, and fuels and mining products for as much as 54 percent of all exports in 2018, while in Colombia they accounted for 17.5 and 59.2 percent, respectively (WTO 2021). 12 We do not look at the group of countries which in an extreme way depend on the export of natural resources, like for example the Arab countries, Russia or Nigeria. For this group of countries terms of trade effects and deindustrialization are even more extreme.
0
50
100
150
200
250
2000 2002 2004 2006 2008 2010 2012 2014 2016 2018
Argentina Brazil South Africa Colombia Chile

21
Figure 5 shows the terms of trade index for various countries whose exports are heavily
dependent on low-technology manufacturing goods, in some countries especially on apparel.
As can be seen in the figure, the terms of trade of these countries have deteriorated, in some
cases tremendously, especially Pakistan, Bangladesh, Cambodia, but also China. These
countries had to export increasing quantities to get the same quantity of imported goods.
Whether the negative terms of trade effects led to immiserizing growth in some of the
countries cannot be tested here, but as UNECA (2016) argues, expanding exports in these
countries did not stimulate the domestic welfare effects that were probably expected. To this
story also fits the fact that after the creation of the North American Free Trade Agreement
(NAFTA) in 1994, Mexico’s share of world manufactured exports increased significantly while
its share in world manufacturing value-added dropped. “This happened because as high-
export, low-value-added firms in maquiladoras expanded, the traditional industries with high
value-added but low exports withered” (Akyüz 2017, p. 191).
Figure 5: Terms of trade index (2000=100); various Asian countries; 2000-2019
Source: World Bank 2021; World Development Indicators.
Note: Net barter terms of trade index is calculated as the percentage ratio of the export unit value indexes to the import unit value indexes. measured relative to the base.
It is worthwhile mentioning that China managed significant upgrading in GVCs in comparison
to many other countries. The share of foreign value-added in China’s processing exports fell
even from 79 percent in 1997 to 62.7 percent in 2007 and in total manufactured exports from
0
20
40
60
80
100
120
2000 2002 2004 2006 2008 2010 2012 2014 2016 2018
Bangladesh Cambodia China India Pakistan

22
50 to 40 percent (Akyüz 2017, p. 195; Koopman et al. 2012). Obviously, China could in the
classification of Humphrey and Schmitz (2002) not only manage to achieve product and
process upgrading, but also substantial functional upgrading.
4 Productivity and employment effects of integration in GVCs
In order to examine whether participation in GVCs has positive macroeconomic effects that
go beyond a positive development for individual firms or sectors and could therefore
represent a development strategy, we will first explain how we measure participation in GVCs
and then show whether there is a correlation between participation in GVCs and
macroeconomic variables such as productivity and employment.
Ever since Hummel et al. (2001)'s seminal article, participation in GVCs has typically been
defined and measured in terms of vertical specialization. According to this definition, in a GVC
a good must be produced in different production steps, in which at least two countries are
involved, crossing at least two borders. A distinction is made between backward and forward
participation. Backward participation measures the foreign value-added content of exports.
Here, the exporting country takes the role of the buyer of inputs. For example, the backward
participation rate is very high if a country functions as an assembly platform where imported
components are only assembled for export. Forward participation, on the other hand,
represents the role of the seller. Here, the domestic value added contained in exports of third
countries is measured. Both values taken together as a share of exports express the level of
participation in GVCs. Based on this definition, it is frequently said that half of global trade
today takes place within GVCs (World Bank 2020).
However, in the present study we do not consider this indicator. We instead follow Carballa
Smichowski et al. (2020), and measure GVC participation as the sum of the non-primary
product portion of domestic value-added in exports plus intermediate imports both together
as a share of GDP13. This indicator is characterized by three features14, which we consider
beneficial for our work: first, it excludes primary products, which often exhibit very volatile
prices and do not add substantially to industrialization. Second, imports of finished products
13 The formal definition is (&'())∗(,-..&)/!.0∗(,-..0)1'2 , where XDVA is domestic value added in gross exports, ppX is the share of primary products in total exports, ipM is gross imports of intermediate products and ppM the share of primary products in total imports. 14 For a detailed introduction and discussion of the indicator, its measurement and differentiation from the common indicator, compare Carballa Smichowski et al. (2018).
23
for domestic use are also excluded. Third, the denominator is GDP instead of gross exports.
Thus, the value generated in the context of GVCs is put in relation to the value generated in
the domestic economy, and not just in relation to a country’s exports. Another plus point, in
our opinion, is the fact that not only trade which has crossed at least two borders counts as
GVC-related. The two border rule overlooks, for example, the fact that imported inputs can
also be processed into final products that are sold in the country and are not intended for
export. For example, Brazil is a country where electronic goods are assembled with imported
components primarily for sale in the domestic market. In the usual definition of the GVC
participation rate, this important sector would not be counted because the assembled final
products are predominantly not destined for export. However, not declaring this important
production as GVC participation is misleading.
Figure 6 shows the GVC participation rate according to our definition for 63 OECD and non-
OECD countries for 2005 and 2015. In the ranking of countries, it is striking that at the bottom
end, with little GVC participation, there are mainly countries that are rich in natural resources
and focus on the export of raw materials which is not part GVCs in our measure. In the
comparison period, the participation of these resource-rich countries in GVCs has decreased
remarkably. In fact, participation in GVCs has declined for almost all countries (in more than
85 percent of all countries in Figure 6, including a strong decline in China) over the observation
period. These figures support the trend shown in Figure 1, i.e., stagnation or decline of the
importance of goods exports as a share of GDP since 2008. Especially in small countries like
Luxembourg, Ireland, Singapore, Malta, and even Hong Kong, GVC trading plays a major role.
However, this is not surprising as smaller countries are usually deeper integrated into
international trade than big countries like the U.S.

24
Figure 6: Global Value Chain Participation excluding primary products, 2005 and 2015
Source: OECD TiVA Database. Version 2018; Data on primary products and total imports and exports: UNCTAD Statistics; GDP: World Development Indicators Sorted ascending by 2015
In the rest of this section, we turn to analyzing several relations between GVC participation
and key macroeconomic variables.
Global value chains and productivity
One major factor on the road to economic development is an increase in labor productivity,
shifting workers from less to more productive activities. The eminent importance of labor
productivity is aptly expressed by Paul Krugman (1992, p. 9):
“Productivity isn’t everything, but in the long run it is almost everything. A country’s ability to improve its standard of living over time depends almost entirely on its ability
0 0.2 0.4 0.6 0.8 1 1.2 1.4 1.6
LuxembourgIreland
Viet NamSingapore
MaltaHungary
Slovak RepublicCzech Republic
ThailandMalaysia
Hong Kong, ChinaSlovenia
CambodiaEstonia
BelgiumKorea
BulgariaAustr ia
SwitzerlandCyprusPoland
LithuaniaDenmarkGermany
NetherlandsRomania
TunisiaSwedenMexico
Phil ippinesLatvia
PortugalFinlandCroatia
MoroccoCosta Rica
SpainIsraelItaly
FranceChina (People's…
United KingdomCanadaTurkey
South AfricaIceland
JapanIndia
IndonesiaNorway
Saudi ArabiaUnited States
GreeceChile
New ZealandPeru
Russian FederationAustralia
ArgentinaKazakhstan
ColombiaBrazil
Brunei Darussalam
2005 2015

25
to raise its output per worker. [In the U.S.] World War II veterans came home to an economy that doubled its productivity over the next 25 years; as a result, they found themselves achieving living standards their parents had never imagined. Vietnam veterans came home to an economy that raised its productivity less than 10 percent in 15 years; as a result, they found themselves living no better – and in many cases worse – than their parents.”
Current research on the relationship between participation in GVCs and productivity points
out various channels via which GVC participation can stimulate productivity growth. It is
assumed that the benefits arise at the firm level through specialization in core business and
offshoring other tasks, importing foreign inputs that may be cheaper or of better quality, pro-
competitive effects in domestic input markets, and knowledge spillover effects from MNEs
(Criscuolo and Timmis 2017). Recently, empirical studies have been conducted that examine
the impact of participation in GVCs on productivity. For example, Constantinescu et al. (2017),
for a panel of 13 industries in 40 countries covering the years 1995-2009, show that GVC
participation – measured as the share of foreign value added in gross exports of goods and
services – is a significant driver of labor productivity. Pahl and Timmer (2020) find a statistically
significant effect of GVC participation for a panel of 58 countries for the years 1970-2008 –
measured as the imported input content in exports as a share of exports – on labor
productivity growth in the export sector. Urata and Baek (2020) also present empirical findings
for a panel of 47 countries and 13 manufacturing sectors covering the years 1995 until 2011
that show that both backward and forward GVC participation contribute to an increase in the
productivity of countries involved in GVCs15. Moreover, they find that the productivity-
enhancing effect is largest for developing countries that import intermediate goods from
developed countries.
However, the finding that participation in GVCs increases the productivity of firms operating
in the export sector is not particularly surprising. Lead firms work with suppliers that have to
meet their quality standards and new technology is transferred to subsidiaries or even
subcontractors. A different question is whether functional upgrading and inter-sectoral
upgrading takes place which is of key importance for higher value adding and catching up with
productivity levels and the innovative power of developed countries. Case studies have also
consistently shown that product and process upgrading takes place in GVCs, but functional
upgrading usually not (Dünhaupt et al. 2020; Dünhaupt et al. forthcoming). Especially in cases
of captive and vertical governance in the form of FDI, functional and even less inter-sectoral
15 The authors measure productivity by total factor productivity growth, computed as the Solow residual.
26
upgrading is unlikely. Humphrey and Schmitz (2000, p. 23) write about “quasi-hierarchical
chain[s] ….: in such chains, functional upgrading is limited. Local firms move into new non-
strategic functions, but refrain from or are prevented from occupying the strategic functions
of the chain which tend to lie in product definition (design, branding, marketing) and chain co-
ordination.”
The other side of the coin of Humphrey and Schmitz’s convincing argument is that a
domination of key sectors of the economy by foreign firms prevents functional and inter-
sectoral upgrading and keeps a country always second class. Preventing the dominance of
foreign firms is an important element in a catching-up process and can help to explain the
relatively poor development in Latin America compared with Asia. In a nutshell, as Amsden
(2009, p. 413) puts it:
“If all industry were foreign-owned, a developing country would never develop top skills and highest-paying jobs (CEO, CFO, Regional Manager, Lead Scientist) that rocket the modern corporation. The developing country would never become advanced enough to earn the entrepreneurial rents that tacit technology and associated brand names earn.”
A further crucial question is whether companies integrated in GVCs are industrial enclaves, or
whether there are spillover effects and intensive links to the rest of the economy. For
example, if all inputs for a production are imported and the output exported, in substance
only labor is delivered by the host country. In such cases the positive effects for a country are
relatively small. Already Hirschman (1958) stressed that internal forward and backward
linkages are of key importance to increase domestic value added and to create high
technology and qualification spillovers. Hence, in order to make a real contribution to
development, other sectors and industries in the country would also have to benefit from
integration in GVCs through linkages and spillover effects, so that overall labor productivity in
the country increases. Singer (1950) noted that underdeveloped countries often have a dual
economic structure: on the one hand, there is a relatively productive sector producing for
export; on the other hand, a sector producing for the domestic economy, with low
productivity. In such a dual structure it can be argued that the relatively productive sectors
integrated in GVCs are not a real part of the domestic economy, and the technological spillover
effects are only small.
27
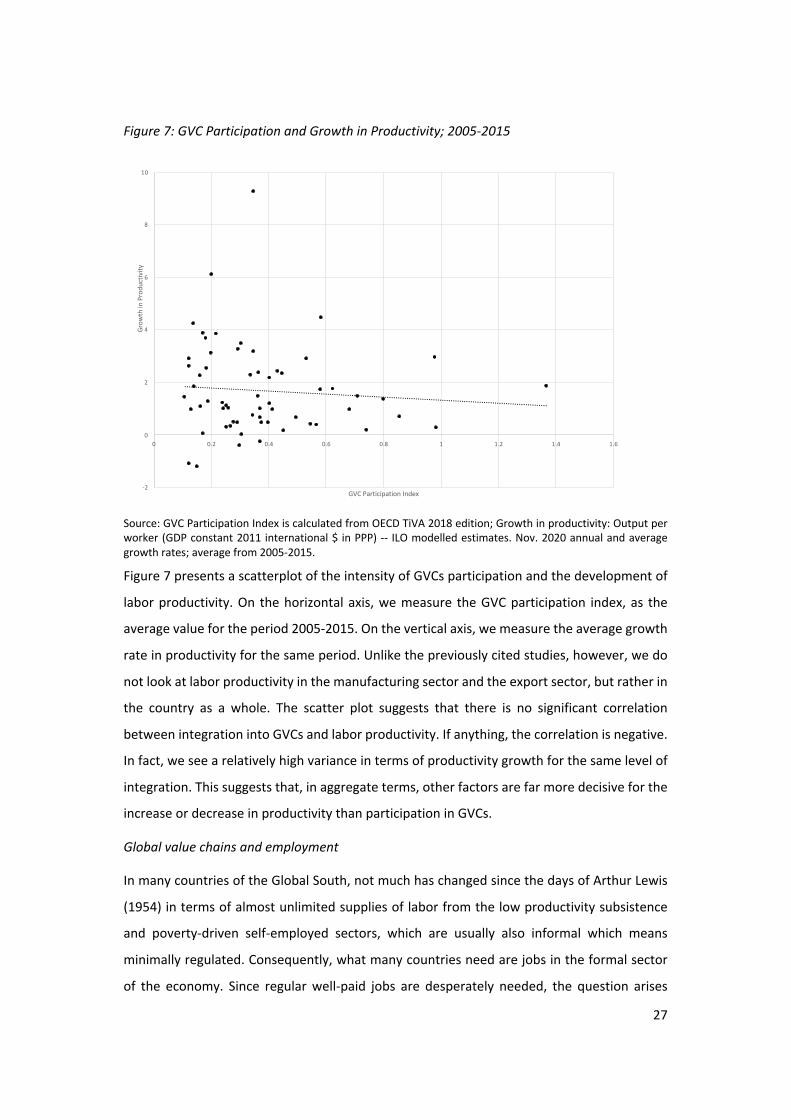
Figure 7: GVC Participation and Growth in Productivity; 2005-2015
Source: GVC Participation Index is calculated from OECD TiVA 2018 edition; Growth in productivity: Output per worker (GDP constant 2011 international $ in PPP) -- ILO modelled estimates. Nov. 2020 annual and average growth rates; average from 2005-2015.
Figure 7 presents a scatterplot of the intensity of GVCs participation and the development of
labor productivity. On the horizontal axis, we measure the GVC participation index, as the
average value for the period 2005-2015. On the vertical axis, we measure the average growth
rate in productivity for the same period. Unlike the previously cited studies, however, we do
not look at labor productivity in the manufacturing sector and the export sector, but rather in
the country as a whole. The scatter plot suggests that there is no significant correlation
between integration into GVCs and labor productivity. If anything, the correlation is negative.
In fact, we see a relatively high variance in terms of productivity growth for the same level of
integration. This suggests that, in aggregate terms, other factors are far more decisive for the
increase or decrease in productivity than participation in GVCs.
Global value chains and employment
In many countries of the Global South, not much has changed since the days of Arthur Lewis
(1954) in terms of almost unlimited supplies of labor from the low productivity subsistence
and poverty-driven self-employed sectors, which are usually also informal which means
minimally regulated. Consequently, what many countries need are jobs in the formal sector
of the economy. Since regular well-paid jobs are desperately needed, the question arises
-2
0
2
4
6
8
10
0 0.2 0.4 0.6 0.8 1 1.2 1.4 1.6
Grow
th in
Pro
duct
ivity
GVC Participation Index
28
whether participation in GVCs contributes to employment growth. However, empirical studies
that analyze the relationship between GVC participation and employment indicate a negative
relationship. A study by Cali et al. (2016), which covers the years 1995-2011, shows that since
2001 the job intensity of exports has declined in both high- and low-income countries. The
novelty of this study is that it took into account not only direct export jobs, but also indirect
jobs., i.e., jobs in industries that serve the export sector. The result of this study is not
surprising; the explanation is that productivity increased. The result for developing countries
is a double-edged sword. Productivity increases are, as mentioned, of key importance for
development and catching up. But, as mentioned as well, the welfare effects for developing
countries are probably small and productivity increases reduce the employment effects of
increasing output (see also Rodrik 2018). Pahl and Timmer (2020) find no positive correlation
between GVC participation and employment growth in their panel estimation which covers
the period 1970-2008. The authors conclude that GVC participation is “a mixed blessing at
best” (Pahl and Timmer 2020, p. 1699). They also identify a bias in technological development
against unskilled workers as a possible explanation. Since MNEs often demand and employ
relatively high-skilled workers in a country, unskilled workers fall behind – apparently in all
parts of the world. Farole (2016) shows that almost no positive relationship exists between
the GVC participation index and the employment share of adult population, using average
values between 2008 and 2013. In fact, in his investigation a higher level of GVC participation
is actually related to a slightly lower employment share.
Figure 8 plots the GVC participation index and the employment share for averaged values from
2005-2015. As can be seen in the figure, there exists almost no relationship between both
variables. This is in line with the findings reported above.

29
Figure 8: Global Value Chain Participation and Employment Share of Adult Population*; 2005-2015
Source: GVC Participation Index is calculated from OECD TiVA 2018 edition; Employment Share from World Bank World Development Indicators; average from 2005-2015.
Note: Employment to population ratio. 15+ total (%) (national estimate)
This result should not be a surprise. Even if exports related to GVCs and employment in the
affected sectors increase, other sectors may – due to higher imports – shrink. Deeper
integration into world markets is not an engine of growth and employment per se. A country
can be very successful in offshoring certain tasks in GVCs and at the same time realize big
trade deficits which destroy domestic jobs. Or efficiency gains can lead to unemployment
when aggregate demand is not increasing sufficiently. It is the combination of increasing
foreign trade and simultaneously increasing foreign trade surpluses that usually stimulates
macroeconomic growth and employment. However, such mercantilist strategies are not
possible for all countries.
Rodrik (2018, p. 5) writes:
“It appears that exports are creating fewer and fewer jobs, and GVCs are certainly not helping. This is disappointing from a number of perspectives. It puts a damper on the idea of trade as an engine of growth. It suggests that the technological and organizational benefits associated with exports are not being disseminated throughout the economy. And since exports tend to be associated with better-paying jobs, it raises concerns about wage levels and inclusion.”
0
10
20
30
40
50
60
70
80
90
0 0.2 0.4 0.6 0.8 1 1.2 1.4 1.6
Empl
oym
ent t
o po
pula
tion
ratio
(%)
GVC Participation Index

30
Overall, integration in global trade and GVCs does not, in the typical developing country,
create sufficient jobs to lead to inclusive growth and the absorption of traditional sectors.
5 Conclusion
The increasing importance of GVCs including the high levels of FDI from the 1990s onwards is
often considered to be one of the key pillars to support development in the Global South.
There is no doubt that GVCs can trigger positive developments in the form of growth and
economic upgrading of firms and sectors, but there is neither a guarantee that this will happen
nor a guarantee that, even in the positive case, only industrial enclaves will emerge that have
no positive spillover effects on the rest of the country, and “remain a tiny sliver of globally
integrated firms” (Rodrik 2018, p. 14). Moreover, there are also cases in which integration in
the world economy under a regime of free trade led to economic downgrading of sectors. And
in general, the effects of GVCs may be too weak to have positive macroeconomic impacts.
In this article we have argued that, on the one hand, there has been consolidation on the part
of the MNEs towards more oligopolistic markets and, on the other hand, globalization since
the 1980s has led to more and more countries entering into the production of simple
manufacturing goods; this has led, among other things, to more intensive competition and a
massive drop in the real import prices for manufactured goods over the same period.
Integration into GVCs facilitates industrialization, but because tasks in GVCs became so simple
and thus in spite of increasing productivity in export sectors, industrialization as such is now
less useful as a development strategy than it was 40 years ago. And there is an enormous
power imbalance between MNEs and their suppliers, which pushes the prices and profits of
many suppliers of MNEs to a minimum.
There are strong signs that integration into GVCs by countries in the Global South triggers
product and process upgrading for supplying firms. But it is very unlikely that lead firms
support their suppliers in functional or inter-sectoral upgrading, because it is not in their
interest to nurture potential competitors. Suppliers are instead positioned in GVCs by lead
firms to fulfil relatively simple tasks in a good and stable way. Thus, the conclusion is that while
integration into GVCs can bring productivity increases, catching-up of firms or sectors in the
Global South with top firms in the global economy cannot be expected. Firms are needed in
the Global South which are able to act independently of foreign-owned MNEs and which have
the aim and support for functional and intersectoral upgrading. Part of this is the development
of national champions which are able to compete with foreign-owned MNEs.
31
Even if GVCs develop in a positive way in single industries, this may not be sufficient for a
general positive development of countries. Especially if GVCs are not well-linked with
domestic production, economic enclaves develop which are more integrated with foreign
countries than the domestic economy. We have demonstrated that there are virtually no
positive macroeconomic spillovers – be it employment effects or productivity growth – from
integration into GVCs. Moreover, it was shown that besides countries in the Global North only
Asian countries managed to industrialize or defend a high level of industrialization. Latin
America and Africa failed to do so. And for many countries in the Global South the export of
unprocessed natural resources still plays an important role – without contributing to a positive
overall economic development. Rodrik (2015) speaks about premature deindustrialization in
many developing countries. This implies that many of these countries are characterized by a
dual economy with a small part that is relatively developed and a big informal sector with
many small and poverty-driven enterprises. In such countries the development of a strong
working class with joint interests which could fight for a welfare state and participatory
political structures is unlikely.
One conclusion seems to be clear: comprehensive horizontal and vertical industrial policy is
needed. This can not only be concluded theoretically, but is also demonstrated by the relative
positive development of Asian countries. Horizontal industrial policy means investment in
general education, infrastructure, the health system, etc. There is broad consensus about this,
and even the Washington Consensus stresses horizontal industrial policy (Williamson 1989).
But in addition, vertical industrial policy is needed which supports specific sectors or even
specific companies as ‘national champions’. New comparative advantages have to be created
which violate the logic of free trade (compare for example Cimoli et al. 2009; Chang 2003;
Chang and Andreoni 2016). Of chief importance is the creation of clusters based on close
networks between firms, employers’ associations, research institutes, universities and
government. GVCs as well as regulated FDI can therefore play an important element in
industrial policy. In the ideal case formulation, industrial policy on national level but also
cluster level should take place in a network of all stakeholders including trade unions (see for
details Dünhaupt and Herr 2020a, 2020b, 2021; Herr 2019).
Last but not least it seems that two groups in the Global North benefit especially from GVCs.
First, lead firms following their rent-seeking strategy can increase profits and distribute them
to their owners which usually reside in the Global North. There is an observable tendency in
many markets where MNEs sell their products that competition reduced and rent-seeking

32
increased. Terms of trade for simple manufacturing tasks taken over in the Global South
dropped, implying that consumers in the Global North benefitted from better terms of trade.
We can interpret this as a new version of the Prebisch-Singer hypothesis, but now instead of
primary goods it is for simple manufacturing activities taken over in the Global South.
33
References
Akyüz, Y. (2017). Playing with Fire. Deepened Financial Integration and Changing Vulnerabilities of the Global South. Oxford: Oxford University Press.
Alfaro, L., & Charlton, A. (2007). Growth and the Quality of Foreign Direct Investment: Is All FDI Equal? CEP Discussion Paper dp0830. London: Centre for Economic Performance, London School of Economics.
Amrouk, E. (2018). Depressed International Coffee Prices: Insights into the Nature of the Price Decline. Food Outlook July 2018. Food and Agricultural Organization (FAO). http://www.fao.org/fileadmin/templates/est/COMM_MARKETS_MONITORING/Coffee_Cocoa/Documents/coffee_prices_2018.pdf. Accessed 13 July 2021.
Amsden, A. (1989). Asia’s Next Giant – South Korea and Late Industrialization. New York: Oxford University Press.
Amsden, A. H. (2009). Nationality of Firm Ownership in Developing countries: Who Should “Crowd Out” Whom in Imperfect Markets? In M. Cimoli, G. Dosi, & J.E. Stiglitz (Eds.), Industrial Policy: The Political Economy of Capabilities Accumulation (pp. 409-423). Oxford: Oxford University Press.
Andreoni, A., & Chang, H.-J. (2019). The political economy of industrial policy: Structural interdependencies, policy alignment and conflict management. Structural Change and Economic Dynamics, 48, 136-150.
Anner, M. (forthcoming). The Governance Challenges of Social Upgrading in Apparel Global Value Chains in the Context of a Sourcing Squeeze and the Covid-19 Pandemic. In C. Teipen, P. Dünhaupt, H. Herr, & F. Mehl (Eds.), Economic and Social Upgrading in Global Value Chains: Comparative Analyses, Macroeconomic Effects, the Role of Institutions and Strategies for the Global South. London: Palgrave.
Bhagwati, J. (1958). Immiserizing Growth: A Geometrical Note. Review of Economic Studies, 25, 201-205.
Baldwin, R. (2011). Trade and Industrialisation after Globalisation’s 2nd Unbundling: How Building and Joining a Supply Chain are Different and Why It Matters. NBER Working Paper 17716. https://www.nber.org/papers/w17716. Accessed 21 April 2020.
Bruton, H. (1998). A Reconsideration of Import Substitution. Journal of Economic Literature, XXXVI, 903-936.
Cali, M., Francois, J., Hollweg, C., Oberdaberni, D., Rojas-Romagosa. H., Rubinova, S., & Tomberger, P. (2016). The Labor Content of Exports Database. World Bank Policy Research Working Paper 7615. The World Bank Group.
Carballa Smichowski, B., Durand, C., & Knauss, S. (2020). Participation in global value chains and varieties of development patterns. Cambridge Journal of Economics, 1-24. doi:10.1093/cje/beaa046.
Chang, H.-J. (2003). Kicking Away the Ladder – Development Strategy in Historical Perspective. London: Anthem Press.
Chang, H.-J. (2006). Policy space in historical perspective with special reference to trade and industrial policies. Economic and Political Weekly, 41(7), 627–633.

34
Chang, H.-J., & Andreoni, A. (2016). Industrial Policy in a Changing World: Basic Principles. Neglected Issues and New Challenges. Cambridge Journal of Economics 40 Years Conference. Cambridge.
Cimoli, M., Disi, G., & Stigitz, J.E. (2009). The Future of Industrial Policy in the New Millennium: Towards a Knowledge-Centred Development Agenda. In M. Cimoli, G. Dosi, & J.E. Stiglitz (Eds.), Industrial Policy. The Political Economy of Capabilities Accumulation (pp. 541-560). Oxford: Oxford University Press.
Criscuolo, C., & Timmis, J. (2017). The Relationship between Global Value Chains and Productivity. International Productivity Monitor, 32, 61-83.
Constantinescu, C., Mattoo, A., & Ruta, M. (2017). Does Vertical Specialization Increase Productivity? World Bank Policy Research Working Paper 7978. The World Bank Group.
Dallas, M. (2014). Cloth without a Weaver: Power, Emergence and Institutions across Global Value Chains. Economy and Society, 43(3), 315-345.
Davies, G. (2013, September 29). Why world trade growth has lost its mojo. Financial Times. https://www.ft.com/content/9ad0678e-8c39-3eb8-8f5f-787e9a93f0f6. Accessed 7 June 2021.
Dollar, D. (2019). Executive Summary. In World Trade Organization (Ed.), Global Value Chain Development Report 2019: Technological Innovation, Supply Chain Trade and Workers in a Globalized World (pp. 1-7). Geneva: World Bank Publications.
Dünhaupt, P., & Herr, H. (2020a). Catching Up in a Time of Constraints – Industrial Policy under World Trade Organization Rules, Free Trade Agreements and Bilateral Investment Agreements. Singapore: Friedrich Ebert Foundation. http://library.fes.de/pdf-files/bueros/singapur/16373.pdf.
Dünhaupt, P., & Herr, H. (2020b). Trade, Global Value Chains and Development: What Role for National Development Banks? Vierteljahreshefte zur Wirtschaftsforschung, 89, 9-33.
Dünhaupt, P., & Herr, H. (2021). Global Value Chains – A Ladder for Development? International Review of Applied Economics, 34(3-4), 456-474.
Dünhaupt, P., Herr, H., Mehl, F., & Teipen, C. (2020). Opportunities for Development Through Integration in Global Value Chains? IPE Working Paper No. 140/2020. Berlin: Institute for Political Economy.
Dünhaupt, P., Herr, H., Mehl, F., & Teipen, C. (forthcoming). Comparing National and Industry-specific Trajectories of Economic and Social Upgrading As Well As Various Stretegic Solutions. In C. Teipen, P. Dünhaupt, H. Herr, & F. Mehl (Eds.), Economic and Social Upgrading in Global Value Chains: Comparative Analyses, Macroeconomic Effects, the Role of Institutions and Strategies for the Global South. London: Palgrave.
Easterly, W. (1999). The ghost of financing gap: testing the growth model used in the international financial institutions. Journal of Development Economics, 60, 423–438.
Farole, T. (2016). Do Global Value Chains Create Jobs? IZA World of Labor, 291. doi:10.15185/izawol.291
Gereffi, G. (1994). The Organization of Buyer-Driven Global Commmodity Chains: How U.S. Retailers Shape Overseas Production Networks. In G. Gereffi & M. Korzeniewicz (Eds.), Commodity Chains and Global Capitalism (pp. 95–122). Westport, CT: Greenwood Press.
35
Gereffi, G. (2013). Global Value Chains in a Post-Washington Consensus World. Review of International Political Economy, 1-29. doi:10.1080/09692290.2012.756414.
Gereffi, G., Humphrey, J., & Sturgeon, T. (2005). The Governance of Global Value Chains. Review of International Political Economy, 12, 78–104. doi:10.1080/09692290500049805.
Global Trade Alert (2021). Global Dynamics. Global Trade Alert. https://www.globaltradealert.org/global_dynamics. Accessed 7 June 2021.
Grossman, G.M., & Helpman, E. (1991). Trade: Knowledge Spillovers and Growth. European Economic Review, 35(2-3), 517-526.
Herr, H. (2019). Industrial Policy for Economic and Social Upgrading in Developing Countries. Singapore: Friedrich-Ebert Foundation. http://library.fes.de/pdf-files/bueros/singapur/15190.pdf
Herr. H., & Priewe. J. (2005). Development Strategies Beyond the Washington Consensus. Internationale Politik und Gesellschaft, 2, 72-97.
Hirschman, A. O. (1958). The Strategy of Economic Development. New Haven: Yale University Press.
Hummel, D., Ishii, J., & Yi, K.-M. (2001). The Nature and Growth of Vertical Specialization in World Trade. Journal of International Economics, 54(1), 75-96.
Humphrey, J. and Schmitz, H. (2000). Governance and Upgrading: Linking Industrial Cluster and Global Value Chain Research. Institute for Development Studies Working Paper 120. Sussex: Institute for Development Studies, University of Sussex.
Humphrey, J., & Schmitz, H. (2002). How Does Insertion in Global Value Chains Affects Upgrading in Industrial Clusters. Regional Studies, 36, 1017–1027. doi:10.1080/0034340022000022198.
Humphreys, M., Sachs, J.D., & Stiglitz, J.E. (2007). Escaping the Resource Curse. New York: Columbia University Press.
Koopman. R., Wang. Z., & Wie. S.-J (2012). Estimating Domestic Content in Exports when Processing Trade is Pervasive. Journal of Development Economics, 99, 178-189.
Krueger, A. (1974). The Political Economy of Rent-Seeking Society. American Economic Review, 64(3), 291-303.
Krugman, P. (1992). The Age of Diminished Expectations: US Economic Policy in the 1980s. Cambridge: MIT Press.
Lewis, W. A. (1954). Economic development with unlimited supplies of labour. Manchester School of Economics and Social Studies, 10, 139-191.
Mayer, J., Butkevicius, A., & Kadri, A. (2002). Dynamic Products in World Exports. UNCTAD Discussion Paper No. 159. Geneva: United Nations Conference on Trade and Development.
Mencinger, J. (2003). Does Foreign Investment Always Enhance Economic Growth? Kyklos, 56, 503–536.
Milberg, W. (2008). Shifting Sources and Uses of Profits: Sustaining US financialization with global value chains. Economy and Society, 37(3), 420-451.
36
Milberg, W., Jiang, X., & Gerreffi, G. (2014). Industrial policy in the era of vertically specialized industrialization. In J. Salazar-Xirinachs, I. Nubler, & R. Kozul-Wright (Eds.). Transforming Economies: making Industrial Policy Work for Growth, Jobs and Development (pp. 151-178). Geneva: UNCTAD and ILO.
Milberg, W., & Winkler, D. (2013). Outsourcing Economics – Global Value Chains in capitalist Development. New York: Cambridge University Press.
Nolan, P., Zhang, J., & Liu, C. (2008). The Global Business Revolution, the Cascade Effect, and the Challenge for Firms from Developing Countries. Cambridge Journal of Economics, 32, 29-47.
Palley, T. (2011). The Contradictions of Export-Led Growth. Public Policy Brief No. 119. Annandale-On-Hudson, NY: Levy Economics Institute of Bard College.
Pahl, S., & Timmer, M. (2020). Do Global Value Chains Enhance Economic Upgrading? A Long View. The Journal of Development Studies, 56(9), 1683-1705.
Peărić, M., Kusanović. T., & Jakovac. P. (2021). The Determinants of FDI Sectoral Structure in the Central and East European EU Countries. Economies, 9, 1-16. doi:https://doi.org/10.3390/economies9020066
Prebisch, R. (1950). The Economic Development of Latin America and Its Principal Problems. Lake Success, NY: United Nations Department of Economic Affairs.
Rodrik, D. (2015). Premature Deindustrialization. Journal of Economic Growth, 21, 1-33.
Rodrik, D. (2018). New Technologies, Global Value Chains, and the Developing Economies. Pathways for Prosperity Commission Background Paper Series No.1. Oxford: University of Oxford.
Shapiro. H. (2007). Industrial Policy and Growth. UN DESA Working Paper No. 53. Geneva: United Nations.
Singer, H. (1949). Economic progress in under-developed countries. Social Research, 16, 236−266.
Singer, H. (1950). The distribution of gains between investing and borrowing countries. The American Economic Review, 40(2), 473-485.
Stiglitz, J.E. (1996). Some lessons from the East Asian Miracle. The World Bank Research Observer, 11(2), 151-177.
Stiglitz. J.E. (2019). People, Power and Profits: Progressive Capitalism for an Age of Discontent. London: Penguin Books.
Stiglitz, J.E., & Greenwald, B. (2003). Towards a New Paradigm in Monetary Economics. Cambridge: Cambridge University Press.
Smichowski, B., Durand, C., & Knauss, S. (2018). Participation in global value chains and varieties of development patterns. HAL Working Paper hal-01817426. https://hal.archives-ouvertes.fr/hal-01817426.
Spinnler, T. (2020, March 2). Übernahme vor 20 Jahren – Das Ende von Mannesmann. Tagesschau. https://www.tagesschau.de/wirtschaft/boerse/mannesmann-vodafone-uebernahme-101.html. Accessed 13 July 2021.
Summers, L., & Pritchett, L. (1993). The structural-adjustment debate. The American Economic Review, 83, 383–389.

37
TrendEconomy (2021). Vietnam. TrendEconomy. https://trendeconomy.com/data/h2/Vietnam/TOTAL. Accessed 14 June 2021)
UNCTAD (2020). World Investment Report 2020. New York: United Nations.
UNCTAD Statistics (2021). Data Center. https://unctadstat.unctad.org/wds/ReportFolders/reportFolders.aspx?sCS_ChosenLang=en. Accessed 15 July 2021.
UNECA (2016). Transformative Industrial Policy for Africa. Addis Ababa: United Nations Economic Commission for Africa.
Urata, S., & Baek. Y. (2020). Does participation in global value chains increase productivity? An analysis of trade in value added data. Thailand and the World Economy, 38(1), 1-28.
Wade, R.H. (2003). Governing the market: economic theory and the role of government in East Asian industrialization. New Jersey: Princeton University Press.
Werner, M., Bair, J., & Fernández, V.R. (2014). Linking up to development? Global value chains and the making of a post-Washington consensus. Development and Change, 45(6), 1219–1247.
Williamson, J. (1989). What Washington means by policy reform. In J. Williamson (Ed.), Latin American Readjustment: How Much Has Happened? (pp. 7-20). Washington, D.C.: Peterson Institute for International Economics.
World Bank (2020). Trading for Development in the Age of Global Value Chains. World Development Report 2020. Washington: The World Bank Group.
World Bank (2021). World Development Indicators. World Bank. https://databank.worldbank.org/source/world-development-indicators. Accessed 15 July 2021.
WTO (2021). Statistics – Trade Profiles. World Trade Organization. https://www.wto.org/english/res_e/statis_e/trade_profiles_list_e.htm. Accessed 14 June 2021.
Imprint Editors: Sigrid Betzelt, Eckhard Hein (lead editor), Martina Metzger, Martina Sproll, Christina Teipen, Markus Wissen, Jennifer Pédussel Wu, Reingard Zimmer ISSN 1869-6406 Printed by HWR Berlin Berlin August 2021