global trends in aquaculture and compound aquafeed production · weight in 2016; total mollusk...
TRANSCRIPT

W W W.WA S.ORG • WOR L D AQUACULT UR E • JU NE 2018 33
production, aquaculture is currently dominated by the production of aquatic animal species; over 70 percent of total production being in the form of fish, mollusks and crustaceans in 2016, and only 27.3 percent of production being in the form of aquatic plants or seaweeds (FAO 2018, Fig. 2).
Total fish production in 2016 was 54.1 million t (up 5.0 percent from the previous year) with over 171 different species reported and total production valued at US$ 138.45 billion (Fig. 3). Moreover, despite that over 70 percent of our plant is covered with ocean or salt water, over 85.7 percent of fish production were freshwater fish species (mainly carps, tilapia and catfishes), and to a lesser extent diadromous fish species (9.2 percent, including salmonids, milkfish, eels, etc.), and marine fish species, respectively (5.1 percent, FAO 2018).
Global Aquaculture ProductionAquaculture, the farming of aquatic plants and animals,
continues to be the world’s most diverse food production sector, with over 277 different species reported in 2016, including 20 species of aquatic plants, 59 species of mollusks, 27 species of crustaceans and over 171 fish species (FAO 2018).
According to the latest statistical information from FAO, total global aquaculture production increased by 4.5 percent from 105.46 million t (live weight equivalent) in 2015 to a new high of 110.21 million t in 2016, with total production valued at US$ 243.26 billion (Fig. 1, FAO 2018).
Major Species ProductionIn contrast to terrestrial agricultural food production systems
where plant cereals and oilseeds dominate agricultural food
Global Trends in Aquaculture and Compound Aquafeed Production
Albert G.J. Tacon
( C O N T I N U E D O N P A G E 3 4 )
FIGURE 1. Total global aquaculture and capture fisheries production Aquaculture production increasing at an APR of 8.12% per year compared with 2.54% for capture fisheries from 1950 to 2016 (FAO 2018).
0.0
20.0
40.0
60.0
80.0
100.0
120.0
1950 1954 1958 1962 1966 1970 1974 1978 1982 1986 1990 1994 1998 2002 2006 2010 2014
91.99t
110.21t
milliont2016
Figure1.Totalglobalaquaculture&capturefisheriesproductionAquacultureproductionincreasingatanAPRof8.12%peryearcomparedwith
2.54%forcapturefisheriesfrom1950to2016(FAO2018).
CAPTUREFISHERIES
AQUACULTURE
2016
FIGURE 2. Aquaculture production by major species group in 2016. (values given in million t and US$ billion; FAO 2018)
Figure2.Aquacultureproductionbymajorspeciesgroupin2016.
(valuesgiveninmilliont&US$billion;FAO2018)
FISH49.1%54.1Mt
FISH56.9%138.5$B
27.3%30.1Mt
15.6%17.2Mt
12.1%29.4$B
4.8%11.6$B
7.1%7.9Mt
23.5%57.1$B
Byweight110.21milliont
ByvalueUS$243.26billion
MACRO-ALGAE
MOLLUSCS CRUSTACEANS AQUATICINVERTEBRATES AMPHIBIANS&REPTILES
FISH
FIGURE 3. Aquaculture production by major species group in 2016.(values given in million t and US$ billion; FAO 2018)
Figure3.Aquacultureproductionbymajorspeciesgroupin2016.(valuesgiveninmilliont&US$billion;FAO2018)
Freshwaterfishes 46,387,932Diadromousfishes 4,957,342Marinefishes 2,745,874
Grasscarp 6,068,015Silvercarp 5,300,736Commoncarp 4,556,622Niletilapia 4,199,567Bigheadcarp 3,526,812Catla 2,960,554Atlanticsalmon 2,247,759Roholabeo 1,843,496Pangascatfishnei 1,741,057Milkfish 1,188,082Rainbowtrout 814,091Marinefishesnei 844,305
Total54,091,148tonnes
Majorcountryproducersin2016:China54.5%,India9.5%,Indonesia7.9%,VietNam4.9%,Bangladesh3.8%,Egypt2.5%,Norway2.4%,Myanmar1.7%,Chile1.3%
US$138.5billion
FISH–171speciesreported
FISH49.1%54.1t
85.7%9.2%5.1%
FIGURE 4. Aquaculture production by major species group in 2016.(values given in million t and US$ billion; FAO 2018)
Figure4.Aquacultureproductionbymajorspeciesgroupin2016.(valuesgiveninmilliont&US$billion;FAO2018)
Shrimps 5,180,563Freshwatercrustaceans 2,280,687Crabs,seaspiders 399,124Lobsters 1,628
Whitelegshrimp 4,155,827Redswampcrawfish 919,887Chinesemittencrab 812,183Gianttigerprawn 701,081Orientalriverprawn 272,592Giantriverprawn 233,898Indo-Pacificswampcrab 89,390
Total7,862,016t
Majorcountryproducersin2016:China56.1%,VietNam8.9%,Indonesia8.0%,India6.8%,Ecuador5.4%,Thailand4.3%,Bangladesh1.8%(FAO,2018)
US$57.1billion
CRUSTACEANS–27speciesreported
7.1%7.9t

34 JU NE 2018 • WOR L D AQUACULT UR E • W W W.WA S.ORG
By value the second largest major aquaculture species group in 2016 were the crustaceans at over US$ 57.1 billion, with over 7.86 million t reported (up 6.9 percent from the previous year) from over 27 different crustacean species; 65.9 percent of total crustacean production being marine shrimp species at 5.18 million t (Fig. 4).
Molluks represented the second largest animal species group at 17.2 million t or 15.6 percent of total aquaculture production by weight in 2016; total mollusk production valued at US$ 29.4 billion in 2016, with filter feeding marine/brackishwater mollusk species dominating production, including oysters, clams and mussels (Fig. 5).
Last but not least, aquatic plants represented over a quarter of global aquaculture production at 30.1 million t in 2016, with production up by 2.6 percent by weight from the previous year; representing a very diverse group ranging from the production of unicellular algal species produced in sophisticated land-based culture facilities to the production of edible macrophytes under outdoor ambient culture conditions (Fig. 6).
Dominance of the Asian RegionBy geographical region, Asia currently dominates aquaculture
production with over 92.1 percent of total global production. Aquaculture production within the African continent displaying the highest APR of 10.2 percent per year and Europe the lowest at 2.3 percent per year since 2000 (Fig. 7).
Top Country ProducersChina dominates global aquaculture production at 63.72
million t or 57.8 percent of total global production in 2016 (Fig. 8) and remains the world largest global producer of fish (Fig. 3), crustaceans (Fig. 4), mollusks (Fig. 5), and aquatic plants (Fig. 6).
Asia’s dominance in aquaculture production after China is followed by six other Asian countries, namely Indonesia (2nd largest country producer at 5.7 million t), India (5.7 million t), Viet Nam (3.6 million t), Bangladesh (2.2 million t), the Philippines (2.2 million t) and the Republic of Korea (1.9 million t; Fig. 8).
Table 1 shows the top twenty aquaculture producers in 2016; the Asian dominance being broken by Egypt (8th largest country producer), Norway (9th), Chile (11th), Brazil (14th), Ecuador (16th), the USA (17th) and Nigeria (20th).
Major Fed Fish and Crustacean SpeciesIn contrast to mollusks and aquatic plants, whose production
is usually reliant on the natural availability and supply of nutrients available within an open culture system, the bulk of fish and crustacean aquaculture production is dependent on the external supply of feed inputs in the form of nutritionally complete formulated aquaculture feeds or to a lesser extent the supply of lower-cost supplementary feed inputs.
In general, the use of supplementary feeds is currently
FIGURE 5. Aquaculture production by major species group in 2016.(values given in million t and US $ billion; FAO 2018)
FIGURE 6. Aquaculture production by major species group in 2016.(values given in million t and US$ billion; FAO 2018)
Figure5.Aquacultureproductionbymajorspeciesgroupin2016.(valuesgiveninmilliont&US$billion;FAO2018)
Oysters 5,594,822Clams,cockles,arkshells 5,570,141Scallops,pectens 2,126,930Mussels 2,007,507Miscmarinemolluscs 1,153,615Abalones,winkles,conchs 400,230Freshwatermolluscs 285,894Total–17,177,107t
MOLLUSCS–59speciesreported
Majorcountryproducersin2016:China84.4%,Japan2.2%,KoreaR2.1%,Chile1.8%,Vietnam1.4%,Spain1.3%,USA1.0%(FAO2018)
US$29.4billion
15.6%17.2t
Figure6.Aquacultureproductionbymajorspeciesgroupin2016.(valuesgiveninmilliont&US$billion;FAO2018)
Redseaweeds 18,472,933Brownseaweeds 10,512,535Greenseaweeds 15,958Miscaquaticplants 1,137,964Spirulinanei 88,585TOTAL30,139,389t
ALGAE–20speciesreported
Majorreportedcountryproducersin2016:China48.0%,Indonesia38.6%,Philippines4.7%,KoreaR4.5%(FAO2018)
27.3%30.1t
US$11.7billion
FIGURE 7. Total global aquaculture production by region in 2016 (values given in t; FAO 2018)
FIGURE 8. Top aquaculture producers by country in 2016. (values given in t; FAO 2018)
Figure7.Totalglobalaquacultureproductionbyregionin2016(valuesgivenint;FAO2018)
ASIA(t) 101,510,124 AMERICAS 3,363,281 EUROPE 2,946,630 AFRICA 2,121,210 OCEANIA 229,006 AMERICAS3.05%
EUROPE2.67%
AFRICA1.92%
ASIA92.11%
2016110,208,218t
ASIA(APR) 6.4 AMERICAS 5.4 EUROPE 2.3 AFRICA 10.2 OCEANIA 3.2 AllAPRscalculatedfrom2000to2016
China
Indonesia
India(F)
VietNam
Philippines
Bangladesh
Korea,Rep.
Norway
3.3%
China 63,720,041 Indonesia 16,581,000 India 5,703,002 VietNam 3,634,531 Bangladesh 2,203,554 Philippines 2,200,914 Korea,Rep. 1,859,220 Egypt 1,370,660 Norway 1,326,216 Japan 1,067,974
Chile 1,050,117
Myanmar 1,017,644
Thailand 962,571
Others 7,510,774
Figure8.Topaquacultureproducersbycountryin2016.(valuesgivenint;FAO2018)
CHINA 57.8%
INDONESIA 15.0%
5.2%
OTHER 6.8%
Total production 110,208,218 t, valued at US$ 243.26 billion

W W W.WA S.ORG • WOR L D AQUACULT UR E • JU NE 2018 35
restricted to the production of lower-cost (in marketing terms) filter-feeding fish species (13.6 million t in 2016), including silver carp, bighead carp, catla and rohu (these species representing 25.2 percent of total fish production in 2016 (FAO 2018)
In contrast to predominantly filter-feeding fish species, Table 2 shows the top compound feed fed fish and crustacean species groups produced in 2016. Total estimated fed fish and crustacean production in 2016 was estimated at 43.49 million t, with fed Chinese carp dominating production (15.09 million t or 34.7 percent of total fed species production in 2016), followed by tilapia (5.90 million t, 13.5 percent), shrimp (5.18 million t, 11.9 percent), catfish (5.06 million t, 11.6 percent), marine fish species (2.74 million t, 6.3 percent), other miscellaneous freshwater and diadromous fish species (2.51 million t, 5.8 percent), salmon (2.41 million t, 5.5 percent), freshwater crustaceans (2.28 million t, 5.2 percent), milkfish (1.19 million t, 2.7 percent), trout (0.84 million t, 1.9 percent), and eels (0.29 million t, 0.66 percent), respectively.
Table 3 shows the reported global production of the major fed species groups by major cultured species and country producers in 2016, together with the assumptions used for estimating major species growth and feed usage from 2000 to 2016, with estimates for 2020 and 2025.
Figure 9 to 19 shows the total global production of the major fed species from 2000 to 2016 based on reported FAO species production data (FAO 2018) and estimated compound feed usage, together with
an estimate for species production and feed usage for 2020 and 2025. On the basis of the data presented it is estimated that total
compound aquafeed usage was 49.6 million t in 2016, and expected to rise to 60.4 million t by 2020 and 76.2 million t by 2025, respectively (Figs. 20 and 21).
Concluding RemarksAquaculture continues to be the world’s fastest growing and most
diverse food production sector, with over 95.6 percent of total aquacul-ture production being realized within developing countries and the sec-tor growing at an average APR of 6.64 percent per year, compared with 1.15 percent for economically developed countries (FAO 2018).
NotesAlbert G.J. Tacon, Aquatic Farms Ltd, Kaneohe, HI 96734 USAagjtacon@aquahana
ReferencesFAO. 2018. FAO Fisheries Department, Fishery Information, Data and
Statistics Unit. FishStatJ, a tool for fishery statistics analysis, Release: 3.04.5, Universal Software for Fishery Statistical Time Series. Global aquaculture production: Quantity 1950–2016; Value 1950–2016; Global capture production: 1950–2016; 2018-03-16.
BrandThe Standard in Growth and Survival Augmentation
AlgaMac EnrichHigh in DHA and Natural Astaxanthin
Celebrating 37 years serving the aquaculture industry with high quality diets, Artemia cysts and hatchery equipment including the AlgaMac series algae replacement/substitution rich in DHA for shrimp, fish and bivalve applications.
AlgaMac-3050 Flake20-22% DHA! - dry wt basis in crumble flake form.
AlgaMac Protein PlusAll celled DHA enriched Rotifer Growout Diet
AlgaMac EnhanceTwo whole cell algaes with amino acids, nucleic acids, vitamins and beta-glucans
Series
World renowned
AlgaMacOther high quality
feeds from Bio-Marine:
EconoMacMicroparticle diet: Larval-PL stages
Formulated Diets (4000 series)Micro-crumble diet: Larval-PL stages
AstaroseNatural source of Astaxanthin
SpirulinaSpray-dried Algae
ArteMac Artemia ReplacementReplace up to 100% Artemia with this nutritionally superior diet.
MadMac Maturation StimulatorFresh, make on-site. Rich in DHA.
Aeration Filtration Heating Lab Supplies Meters
Tubing & Hose UV/Ozone Water Quality
Microscopes Pipe/Fittings/Valves Pumps Refractometers Systems Design
... and more.
Hatchery Equipment & Supplies
PO Box 5, Hawthorne, California 90250 USA Tel: 310-973-5275 / Fax: 310-676-9387
If you wish to test our diets, please contact us for a sample.
Red AlgaMacRotifer & Artemia Enrichment.
New
www.aquafauna.comemail: [email protected]
( F I G U R E S 9 - 2 1 A N D T A B L E S 1 - 3 C O N T I N U E D O N P A G E S 3 8 T H R O U G H 4 6 )

36 JU NE 2018 • WOR L D AQUACULT UR E • W W W.WA S.ORG
TABLE 1. Top 20 aquaculture producers in 2016. (values given in t; APR % 2000-2016; FAO 2018)
01China 63,720,041 5.2
02Indonesia 16,581,000 19.203India 5,703,002 7.004VietNam 3,634,531 13.005Bangladesh 2,203,554 7.806Philippines 2,200,914 4.407KoreaRep 1,859,220 6.608Egypt 1,370,660 9.109Norway 1,326,216 6.410Japan 1,067,974 -1.2
11Chile 1,050,117 5.8
12Myanmar 1,017,644 15.713Thailand 962,571 1.714Brazil 581,230 7.915KoreaDPR 554,100 1.116Ecuador 451,090 13.317USA 444,369 -0.218Malaysia 407,887 5.719Iran 398,129 15.320Nigeria 306,727 16.8
Table1.Top20aquacultureproducersin2016.(valuesgivenint;APR%2000-2016;FAO2018)
TABLE 2. Top fed fish and crustacean species pro-duction in 2016. (values given in million t; FAO 2018)
*Excludes13.6tofpredominantlyfilterfeeding/supplementarydietfedfedspecies,includingsilver
carp,bigheadcarp,catla&rohuor25.2%totalfishproductionin2016(FAO2018)
Top fed species
Tonnes
APR - % (2000-2016)
US$ billion
Top producer
Chinese carp * 15.09 4.7 34.60 China 91.8% Tilapia 5.90 10.5 11.30 China 31.6% Shrimp 5.18 9.9 32.01 China 38.8% Catfishes 5.06 15.2 9.75 Indonesia 25.9% Marine fish 2.74 6.7 12.28 China 49.3% Other MFW/D fish 2.51 14.6 11.08 China 67.6% Salmon 2.41 5.5 15.38 Norway 51.1% FW crustaceans 2.28 11.0 22.53 China 92.3% Milkfish 1.19 6.0 1.70 Indonesia 62.3% Trout 0.84 3.2 3.59 Iran 19.3% Eel 0.29 1.9 2.14 China 85.5% Total 43.49 7.36 156.36
Table2.Topfedfishandcrustaceanspeciesproductionin2016.(valuesgiveninmilliont;FAO2018)
Year
2000200120022003200420052006200720082009201020112012201320142015201620202025
TABLE 3. Reported global production of major fed aquaculture species from 2000 to 2016 and estimated compound feed usage from 2000 to 2025 (values given in thousand t).
CHINESE FED CARPS: total production was 15,088,952 t in 2016, with average APR of 4.7 percent/year since 2000, and a total farm gate value of US$ 34.6 billion in 2016 (FAO 2018). Data excludes predominantly filter feeding carp species, including silver carp (5,300,736 t), bighead carp (3,526,812 t), catla (2,960,554 t) and rohu (1,843,496 t; these species totaling 13,631,598 t or 25.2 percent of the total fish production of 54,091,148 t in 2016; FAO 2018).
Total product ion1
7,186 7,732 8,107 8,470 8,198 8,624 8,815 9,308 9,692 10,404 11,076 11,599 12,422 13,048 13,809 14,475 15,089 17,652 20,464
Percent on feeds3
37 38 42 43 44 45 46 47 48 49 50 51 52 53 54 55 56 60 65
Spec ies EFCR4
2 1.9 1.9 1.9 1.9 1.8 1.8 1.8 1.8 1.8 1.8 1.7 1.7 1.7 1.7 1.7 1.7 1.6 1.6
Growth (%/year)2
3.9 7.6 4.8 4.5 -3.2 5.2 2.2 5.6 4.1 7.3 6.5 4.7 7.1 5.0 5.8 4.8 4.2 4 3
Total feeds used5
5,318 5,582 6,469 6,920 6,853 6,985 7,299 7,875 8,374 9,176 9,968 10,056 10,981 11,756 12,677 13,534 14,365 16,946 21,282
MAJOR SPECIES PRODUCED IN 2016
Grass carp 6,068,015 t (40.2%) Common carp 4,556,622 t (30.2%) Carassius spp 3,006,082 t (19.9%)Wuchang bream 826,178 t (5.5%)Black carp 632,055 t (4.2%)
MAJOR COUNTRY PRODUCERS IN 2016
China 13,859,935 t (91.8%) Indonesia 498,297 t (3.3%) Bangladesh 113,927 t Viet Nam 107,114 tRussian Federation 76,452 t

W W W.WA S.ORG • WOR L D AQUACULT UR E • JU NE 2018 37
0
5,000
10,000
15,000
20,000
25,000
1 2 3 4 5 6 7 8 9 10 11 12 13 14 15 16 17 18 19 20 21 22 23 24 25 262000 2010
202520202005 2016
21,282
16,946
14,365
Figure9.ReportedglobalproductionofChinesefedcarpsandestimatedfeedusagefrom2000to2025.
thousandt
TotalChinesecarpproductionwas15,088,952tin2016,increasingatanaverageAPRof4.7%/yearsince2000,valuedatUS$34.6billion(FAO2018)
15,089
17,65220,464
0
2,000
4,000
6,000
8,000
10,000
12,000
14,000
16,000
1 2 3 4 5 6 7 8 9 10 11 12 13 14 15 16 17 18 19 20 21 22 23 24 25 262000 2010
202520202005 2016
15,203
11,318
9,126
Figure10.Reportedglobalproductionoftilapiaandestimatedfeedusagefrom2000to2025.
thousandt
Totaltilapiaproductionwas5,898,752tin2016increasingatanaverageAPRof10.5%/yearsince
2000,valuedatUS$11.3billion(FAO2018)
5,8997,446
9,502
FIGURE 9. Reported global production of Chinese fed carps and estimated feed usage from 2000 to 2025.
FIGURE 10. Reported global production of tilapia and estimated feed usage from 2000 to 2025.
Year
2000200120022003200420052006200720082009201020112012201320142015201620202025
TABLE 3. Continued
TILAPIA: total production was 5,898,752 tonnes (mt) in 2016, with average APR of 10.5%/year since 2000, and a total farm gate value of US $ 11.3 billion in 2016 (FAO, 2018).
Total product ion1
1,190 1,302 1,417 1,587 1,795 1,992 2,234 2,554 2,826 3,109 3,541 3,996 4,562 4,885 5,315 5,693 5,899 7,446 9,502
Percent on feeds3
75 76 77 78 79 80 81 82 83 84 85 86 87 88 89 90 91 95 100
Spec ies EFCR4
1.9 1.9 1.8 1.8 1.8 1.8 1.7 1.7 1.7 1.7 1.7 1.7 1.7 1.7 1.7 1.7 1.7 1.6 1.6
Growth (%/year)2
14.7 9.4 8.2 12.0 13.1 11.0 12.1 14.3 10.6 10.0 13.9 12.8 14.2 7.1 8.8 7.1 3.6 6.0 5.0
MAJOR SPECIES PRODUCED IN 2016
Nile tilapia 4,199,567 mt (71.2%) Tilapias nei 1,177,350 mt (20.0%)Blue-Nile tilapia hybrid 466,005 mt (7.9%) Mozambique tilapia 38,553 mt Tilapia shiranus 4,851 mtThree spotted tilapia 4,151 mtBlue tilapia 3,179 mt Red breast tilapia 3,142 mtLongfin tilapia 1,100 mt
MAJOR COUNTRY PRODUCERS IN 2016
China 1,866,381 mt (31.6%)Indonesia 1,187,812 mt (20.1%)Egypt 940,309 mt (15.9%)Bangladesh 342,567 mt (5.8%)Philippines 259,045 mt (4.4%)Brazil 239,091 mt (4.0%)Thailand 208,144 mt (3.5%)Viet Nam 183,817 mt (3.1%)Uganda 74,654 mtTaiwan 63,028 mtColombia 81,800 mt Mexico 58,191 mt
Total feeds used5
1,696 1,880 1,953 2,215 2,530 2,852 3,056 3,493 3,948 4,440 5,117 5,842 6,747 7,308 8,042 8,710 9,126 11,318 15,203
38 JU NE 2018 • WOR L D AQUACULT UR E • W W W.WA S.ORG
0
1,000
2,000
3,000
4,000
5,000
6,000
7,000
8,000
9,000
10,000
1 2 3 4 5 6 7 8 9 10 11 12 13 14 15 16 17 18 19 20 21 22 23 24 25 262000 2010
202520202005 2016
9,016
6,815
5,267
Figure11.Reportedglobalproductionofcatfishesandestimatedfeedusagefrom2000to2025.
thousandt
Totalcatfishproductionwas5,063,713tin2016,increasingatanaverageAPRof15.2%/yearsince
2000,valuedatUS$9.75billion(FAO2018)
5,064
6,393
8,159
0
500
1,000
1,500
2,000
2,500
3,000
3,500
4,000
4,500
1 2 3 4 5 6 7 8 9 10 11 12 13 14 15 16 17 18 19 20 21 22 23 24 25 26
2000 2010
202520202005 2016
3,634
2,532
1,791
Figure12.Reportedglobalproductionofotherfreshwater&diadromousfish&estimatedfeedusagefrom2000to2025.
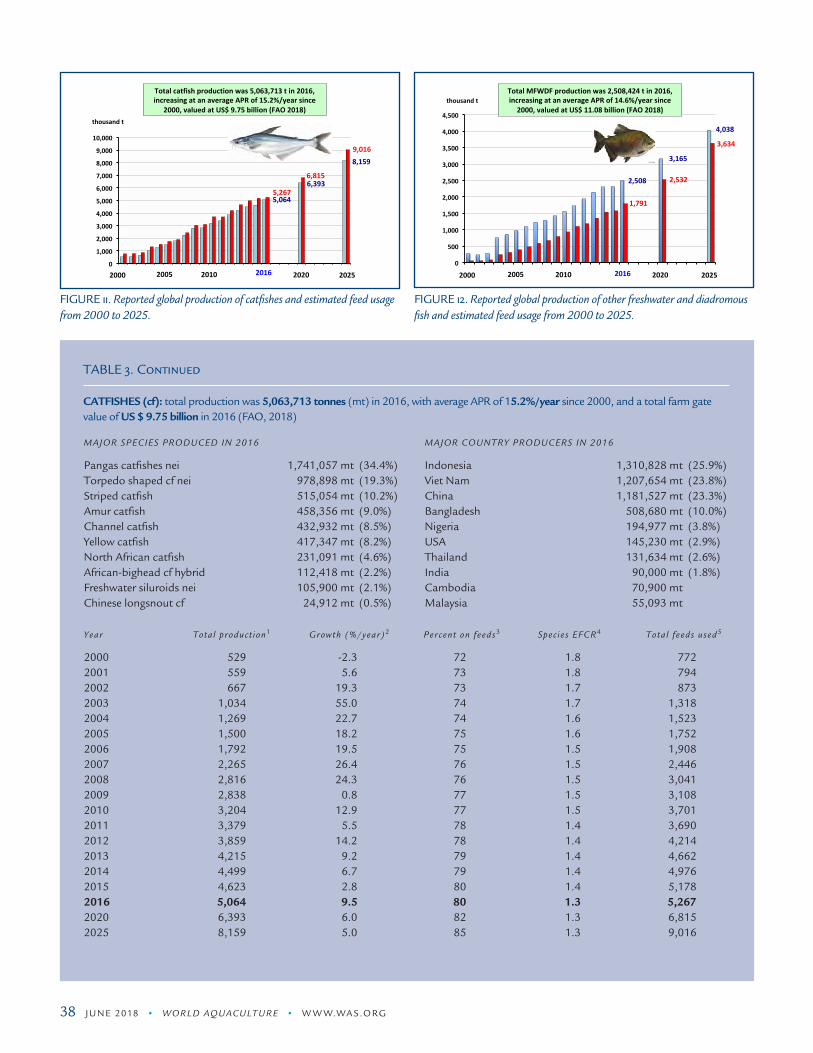
thousandtTotalMFWDFproductionwas2,508,424tin2016,increasingatanaverageAPRof14.6%/yearsince2000,valuedatUS$11.08billion(FAO2018)
2,508
3,165
4,038
FIGURE 11. Reported global production of catfishes and estimated feed usage from 2000 to 2025.
FIGURE 12. Reported global production of other freshwater and diadromous fish and estimated feed usage from 2000 to 2025.
Year
2000200120022003200420052006200720082009201020112012201320142015201620202025
TABLE 3. Continued
CATFISHES (cf): total production was 5,063,713 tonnes (mt) in 2016, with average APR of 15.2%/year since 2000, and a total farm gate value of US $ 9.75 billion in 2016 (FAO, 2018)
Total product ion1
529 559 667 1,034 1,269 1,500 1,792 2,265 2,816 2,838 3,204 3,379 3,859 4,215 4,499 4,623 5,064 6,393 8,159
Percent on feeds3
72 73 73 74 74 75 75 76 76 77 77 78 78 79 79 80 80 82 85
Spec ies EFCR4
1.8 1.8 1.7 1.7 1.6 1.6 1.5 1.5 1.5 1.5 1.5 1.4 1.4 1.4 1.4 1.4 1.3 1.3 1.3
Growth (%/year)2
-2.3 5.6 19.3 55.0 22.7 18.2 19.5 26.4 24.3 0.8 12.9 5.5 14.2 9.2 6.7 2.8 9.5 6.0 5.0
MAJOR SPECIES PRODUCED IN 2016
Pangas catfishes nei 1,741,057 mt (34.4%)Torpedo shaped cf nei 978,898 mt (19.3%)Striped catfish 515,054 mt (10.2%)Amur catfish 458,356 mt (9.0%)Channel catfish 432,932 mt (8.5%)Yellow catfish 417,347 mt (8.2%) North African catfish 231,091 mt (4.6%)African-bighead cf hybrid 112,418 mt (2.2%)Freshwater siluroids nei 105,900 mt (2.1%)Chinese longsnout cf 24,912 mt (0.5%)
MAJOR COUNTRY PRODUCERS IN 2016
Indonesia 1,310,828 mt (25.9%)Viet Nam 1,207,654 mt (23.8%)China 1,181,527 mt (23.3%)Bangladesh 508,680 mt (10.0%)Nigeria 194,977 mt (3.8%)USA 145,230 mt (2.9%)Thailand 131,634 mt (2.6%)India 90,000 mt (1.8%)Cambodia 70,900 mtMalaysia 55,093 mt
Total feeds used5
772 794 873 1,318 1,523 1,752 1,908 2,446 3,041 3,108 3,701 3,690 4,214 4,662 4,976 5,178 5,267 6,815 9,016

W W W.WA S.ORG • WOR L D AQUACULT UR E • JU NE 2018 39
0
500
1,000
1,500
2,000
2,500
3,000
3,500
4,000
4,500
1 2 3 4 5 6 7 8 9 10 11 12 13 14 15 16 17 18 19 20 21 22 23 24 25 262000 2010
202520202005 2016
4,259
3,674
3,141
Figure13.Reportedglobalproductionofsalmonandestimatedfeedusagefrom2000to2025.
thousandt
Totalsalmonproductionwas2,414,586tin2016,increasingatanaverageAPRof5.5%/yearsince2000,valuedatUS$15.38billion(FAO2018)
2,4152,826
3,276
0
1,000
2,000
3,000
4,000
5,000
6,000
7,000
1 2 3 4 5 6 7 8 9 10 11 12 13 14 15 16 17 18 19 20 21 22 23 24 25 26
2000 2010
202520202005 2016
5,974
4,715
3,781
Figure14.Reportedglobalproductionofmarinefishesandestimatedfeedusagefrom2000to2025.
thousandt
Totalmarinefishproductionwas2,745,874tin2016,increasingatanaverageAPRof6.7%/yearsince2000,valuedatUS$12.28billion(FAO2018)
2,746
3,467
4,425
FIGURE 13. Reported global production of salmon and estimated feed usage from 2000 to 2025.
FIGURE 14. Reported global production of marine fishes and estimated feed usage from 2000 to 2025.
Year
2000200120022003200420052006200720082009201020112012201320142015201620202025
TABLE 3. Continued
OTHER miscellaneous freshwater and diadromous fish species: total production was 2,508,424 tonnes (mt) in 2016, with average APR of 14.6%/year since 2000, and a total farm gate value of US $ 11.08 billion in 2016 (FAO, 2018)
Total product ion1
282 240 286 760 871 979 1,101 1,234 1,295 1,429 1,556 1,730 1,943 2,151 2,308 2,320 2,508 3,165 4,038
Percent on feeds3
10 12 14 16 18 20 22 24 26 28 30 32 34 35 37 40 42 50 60
Spec ies EFCR4
2 2 2 2 2 2 2 2 2 2 2 2 1.8 1.8 1.8 1.7 1.7 1.6 1.5
Growth (%/year)2
7.5 -14.9 19.2 166 14.6 12.4 12.5 12.1 4.9 10.3 8.9 11.2 12.3 10.7 7.3 0.5 8.1 6.0 5.0
MAJOR SPECIES PRODUCED IN 2016
Snakehead 518,207 mt (20.7%) Asian swamp eel 386,179 mt (15.4%)Largemouth black bass 376,070 mt (15.0%)Mandarin fish 304,929 mt (12.2%)Pirapatinga 288,567 mt (11.5%)Giant gourami 153,306 mt (6.1%)Cachama 142,135 mt (5.7%)Climbing perch 59,326 mt (2.4%)Barramundi 56,933 mt (2.3%)Indonesian snakehead 41,236 mt (1.6%)Tambacu hybrid 36,900 mt (1.5%)Snakeskin gourami 35,711 mt (1.4%)Striped snakehead 21,721 mtPacu 15,847 mtNile perch 15,624 mt
MAJOR COUNTRY PRODUCERS IN 2016
China 1,694,674 mt (67.6%)Indonesia 309,653 mt (12.3%)Brazil 227,110 mt (9.0%)Bangladesh 59,730 mt (2.4%)Nigeria 46,537 mt (1.8%)Viet Nam 35,200 mt (1.4%)Cambodia 32,240 mt (1.3%)Myanmar 28,401 mt (1.2%)Colombia 25,405 mt (1.0%)
Total feeds used5
56 58 80 243 314 392 484 592 673 800 934 1,107 1,189 1,355 1,537 1,578 1,791 2,532 3,634

40 JU NE 2018 • WOR L D AQUACULT UR E • W W W.WA S.ORG
0
200
400
600
800
1,000
1,200
1,400
1,600
1,800
2,000
1 2 3 4 5 6 7 8 9 10 11 12 13 14 15 16 17 18 19 20 21 22 23 24 25 262000 2010
202520202005 2016
1,579
1,270
1,030
Figure15.Reportedglobalproductionofmilkfishandestimatedfeedusagefrom2000to2025.
thousandt
Totalmilkfishproductionwas1,188,082tin2016,increasingatanaverageAPRof6.0%/yearsince2000,valuedatUS$1.70billion(FAO2018)
1,188
1,443
1,755
0
200
400
600
800
1,000
1,200
1,400
1,600
1 2 3 4 5 6 7 8 9 10 11 12 13 14 15 16 17 18 19 20 21 22 23 24 25 262000 2010
202520202005 2016
1,433
1,2381,100
Figure16.Reportedglobalproductionoftroutandestimatedfeedusagefrom2000to2025.
thousandtTotaltroutproductionwas845,623tin2016,
increasingatanaverageAPRof3.2%/yearsince2000,valuedatUS$3.59billion(FAO2018)
846952
1,102
FIGURE 15. Reported global production of milkfish and estimated feed usage from 2000 to 2025.
FIGURE 16. Reported global production of trout and estimated feed usage from 2000 to 2025.
Year
2000200120022003200420052006200720082009201020112012201320142015201620202025
TABLE 3. Continued
SALMON: total production was 2,414,586 tonnes (mt) in 2016, with average APR of 5.5%/year since 2000, and a total farm gate value of US $ 15.38 billion in 2016 (FAO, 2018)
Total product ion1
1,025 1,205 1,224 1,281 1,380 1,403 1,471 1,527 1,590 1,656 1,603 1,928 2,280 2,290 2,548 2,570 2,416 2,826 3,276
Percent on feeds3
100 100 100 100 100 100 100 100 100 100 100 100 100 100 100 100 100 100 100
Spec ies EFCR4
1.3 1.3 1.3 1.3 1.3 1.3 1.3 1.3 1.3 1.3 1.3 1.3 1.3 1.3 1.3 1.3 1.3 1.3 1.3
Growth (%/year)2
12.3 17.6 1.6 4.7 7.7 1.7 4.8 3.8 4.1 4.1 -3.3 20.3 18.3 0.4 11.3 0.9 -6.0 4.0 3.0
MAJOR SPECIES PRODUCED IN 2016
Atlantic salmon 2,247,759 mt (93.1%)Coho salmon 124,188 mt (5.1%)Salmonids nei 25,706 mt (1.1%)Chinook salmon 12,943 mt (0.5%)Salmonoids nei 3,990 mt
MAJOR COUNTRY PRODUCERS IN 2016
Norway 1,233,619 mt (51.1%)Chile 643,205 mt (26.6%)UK 163,140 mt (6.8%)Canada 149,110 mt (6.2%)Faroe Islands 83,300 mt (3.4%)Australia 56,115 mt (2.3%)Ireland 16,300 mt (0.7%)USA 16,185 mt (0.7%)
Total feeds used5
1,332 1,566 1,591 1,665 1,794 1,824 1,912 1,985 2,067 2,153 2,084 2,506 2,964 2,977 3,312 3,341 3,141 3,674 4,259

W W W.WA S.ORG • WOR L D AQUACULT UR E • JU NE 2018 41
0
100
200
300
400
500
600
700
1 2 3 4 5 6 7 8 9 10 11 12 13 14 15 16 17 18 19 20 21 22 23 24 25 26
2000 2010
202520202005 2016
580
491420
Figure17.Reportedglobalproductionofrivereelsandestimatedfeedusagefrom2000to2025.
thousandt
Totalrivereelsproductionwas286,375tin2016,increasingatanaverageAPRof1.9%/yearsince2000,valuedatUS$2.14billion(FAO2018)
286334
387
0
1,000
2,000
3,000
4,000
5,000
6,000
7,000
8,000
9,000
10,000
1 2 3 4 5 6 7 8 9 10 11 12 13 14 15 16 17 18 19 20 21 22 23 24 25 26
2000 2010
202520202005 2016
9,485
8,435
7,129
Figure18.Reportedglobalproductionofshrimpandestimatedfeedusagefrom2000to2025.
thousandt
Totalshrimpproductionwas5,180,563tin2016,increasingatanaverageAPRof9.9%/yearsince2000,valuedatUS$32.01billion(FAO2018)
5,1816,060
7,026
0
1,000
2,000
3,000
4,000
5,000
6,000
7,000
8,000
9,000
10,000
1 2 3 4 5 6 7 8 91011121314151617181920212223242526
Series1
Series2
FIGURE 17. Reported global production of river eels and estimated feed usage from 2000 to 2025.
FIGURE 18. Reported global production of shrimp and estimated feed usage from 2000 to 2025.
Year
2000200120022003200420052006200720082009201020112012201320142015201620202025
TABLE 3. Continued
TROUT: total production was 845,623 tonnes (mt) in 2016, with average APR of 3.2%/year since 2000, and a total farm gate value of US $ 3.59 billion in 2016 (FAO, 2018)
Total product ion1
512 570 566 572 580 575 620 681 696 772 774 812 904 840 822 778 846 952 1,102
Percent on feeds3
100 100 100 100 100 100 100 100 100 100 100 100 100 100 100 100 100 100 100
Spec ies EFCR4
1.3 1.3 1.3 1.3 1.3 1.3 1.3 1.3 1.3 1.3 1.3 1.3 1.3 1.3 1.3 1.3 1.3 1.3 1.3
Growth (%/year)2
7.6 11.3 -0.7 1.1 1.4 -0.9 7.8 9.8 2.2 10.9 0.3 4.9 11.3 -7.1 -2.1 -5.3 8.7 3.0 3.0
MAJOR SPECIES PRODUCED IN 2016
Rainbow trout 814,091 mt (96.3%)Trouts nei 25,415 mt (3.0%)Sea trout 4,189 mt (0.49%)Brook trout 1,928 mt
MAJOR COUNTRY PRODUCERS IN 2016
Iran 163,325 mt (19.3%)Turkey 107,013 mt (12.6%)Norway 87,852 mt (10.4%)Chile 84,607 mt (10.0%)Peru 52,246 mt (6.2%)China 37,635 mt (4.4%)Italy 36,800 mt (4.3%)Denmark 31,295 mt (3.7%)France 27,100 mt (3.2%)Russian Federation 25,960 mt (3.1%)USA 21,977 mt (2.6%)
Total feeds used5
665 741 736 744 754 747 806 885 905 1,004 1,006 1,056 1,175 1,091 1,080 1,024 1,100 1,238 1,433

42 JU NE 2018 • WOR L D AQUACULT UR E • W W W.WA S.ORG
0
500
1,000
1,500
2,000
2,500
3,000
3,500
4,000
1 2 3 4 5 6 7 8 9 10 11 12 13 14 15 16 17 18 19 20 21 22 23 24 25 26
2000 2010
202520202005 2016
3,728
2,995
2,427
Figure19.Reportedglobalproductionoffreshwatercrustaceansandestimatedfeedusagefrom2000to2025.
thousandtTotalFWcrustaceanproductionwas2,280,687tin2016,increasingatanaverageAPRof11.0%/yearsince2000,valuedatUS$22.5billion(FAO2018)
2,281
2,773
3,374
28.0%
18.0%11.2%3.6%
6.9%2.1%2.1%0.8%
8.1%
14.6%4.6% Carp
Tilapia
Catfish
Miscfreshwaterfish
Salmon
Trout
Milkfish
Eels
Marinefish
Shrimp
Freshwatercrustaceans
Figure20.Totalestimatedglobalcompoundfeedusagebymajorfedspeciesgroupwas49.6milliontin2016.
FIGURE 19. Reported global production of freshwater crustaceans and estimated feed usage from 2000 to 2025.
FIGURE 20. Total estimated global compound feed usage by major fed species group was 49.6 million t in 2016.
Year
2000200120022003200420052006200720082009201020112012201320142015201620202025
TABLE 3. Continued
MILKFISH: total production was 1,188,082 tonnes (mt) in 2016, with average APR of 6.0%/year since 2000, and a total farm gate value of US $ 1.70 billion in 2016 (FAO, 2018)
Total product ion1
468 495 528 552 574 595 585 667 676 718 809 891 943 1,044 1,041 1,115 1,188 1,443 1,755
Percent on feeds3
34 35 36 37 38 39 40 41 42 43 45 46 47 48 49 50 51 55 60
Spec ies EFCR4
2 2 2 2 2 2 2 2 2 2 2 2 2 2 1.9 1.8 1.7 1.6 1.5
Growth (%/year)2
5.9 5.8 6.7 4.5 4.0 3.7 -1.7 14.0 1.3 6.2 12.7 10.1 5.8 10.7 -0.3 7.1 6.5 5.0 4.0
MAJOR SPECIES PRODUCED IN 2016
Milkfish 1,188,082 tonnes
MAJOR COUNTRY PRODUCERS IN 2016
Indonesia 740,720 mt (62.3%)Philippines 398,088 mt (33.5%)Taiwan 44,548 mt (3.7%)Singapore 2,210 mtMalaysia 2,049 mt
Total feeds used5
318 347 380 408 436 464 468 547 568 617 728 820 886 1,002 969 1,003 1,030 1,270 1,579

W W W.WA S.ORG • WOR L D AQUACULT UR E • JU NE 2018 43
0
10,000
20,000
30,000
40,000
50,000
60,000
70,000
80,000
90,000
2000 2005 2010 2015 2020 2025 2030
Fedfishproduction Aquafeedproduction
49.6
Figure21.Totalglobalfarmedfedfishproduction&estimatedfeedusage:2000to2025(milliont).
AQUAFEEDproduction2000-2016:APR8.30%/year2016-2025:APR4.9%/year
76.2
60.4
FEDFISHproduction2000-2016:APR7.4%/year2016-2025:APR4.0%/year
FIGURE 21. Total global farmed fed fish production and estimated feed usage: 2000 to 2025 (million t).
Year
2000200120022003200420052006200720082009201020112012201320142015201620202025
TABLE 3. Continued
RIVER EELS: total production was 286,375 tonnes (mt) in 2016, with average APR of 1.9%/year since 2000, and a total farm gate value of US $ 2.14 billion in 2016 (FAO, 2018)
Total product ion1
212 210 210 210 224 217 239 273 265 275 271 254 241 233 250 274 286 334 387
Percent on feeds3
92 92 93 93 94 94 95 95 95 95 96 96 96 96 97 97 98 98 100
Spec ies EFCR4
1.8 1.7 1.7 1.7 1.6 1.6 1.6 1.6 1.6 1.6 1.6 1.6 1.6 1.6 1.5 1.5 1.5 1.5 1.5
Growth (%/year)2
6.7 -0.9 -0.2 0.2 6.5 -2.9 9.9 14.2 -2.9 3.8 -1.4 -6.3 -5.1 -3.3 7.3 9.6 4.4 4 3
MAJOR SPECIES PRODUCED IN 2016
Japanese eel 278,177 mt (97.1%)European eel 6,994 mt (2.4%)River eels nei 1,204 mt (0.4%)
MAJOR COUNTRY PRODUCERS IN 2016
China 244,777 mt (85.5%)Japan 18,907 mt (6.6%)Korea Rep. 9,836 mt (3.4%)Taiwan 4,657 mt (1.6%)Netherlands 2,300 mt (0.8%)
Total feeds used5
351 329 332 332 337 327 363 415 403 418 416 390 370 358 364 399 420 491 580
Aquaculture, the farming of aquatic plants and animals, continues to be the world’s
most diverse food production sector, with over 277 different species reported in 2016,
including 20 species of aquatic plants, 59 species of mollusks, 27 species of
crustaceans and over 171 fish species. According to the latest statistical information from FAO, total global aquaculture production
increased by 4.5 percent from 105.46 million t (live weight equivalent) in 2015 to a new high
of 110.21 million t in 2016, with total production valued at US$ 243.26 billion.

44 JU NE 2018 • WOR L D AQUACULT UR E • W W W.WA S.ORG
Year
2000200120022003200420052006200720082009201020112012201320142015201620202025
TABLE 3. Continued
Marine fishes: total production was 2,745,874 tonnes (mt) in 2016, with average APR of 6.7%/year since 2000, and a total farm gate value of US $ 12.28 billion in 2016 (FAO, 2018)
Total product ion1
977 1,051 1,162 1,227 1,276 1,438 1,635 1,721 1,940 1,938 1,881 2,062 2,177 2,259 2,373 2,547 2,746 3,467 4,425
Percent on feeds3
60 62 65 67 70 70 71 72 72 73 74 75 76 77 78 80 81 85 90
Spec ies EFCR4
2 2 2 2 1.9 1.9 1.9 1.9 1.9 1.9 1.9 1.8 1.8 1.8 1.7 1.7 1.7 1.6 1.5
Growth (%/year)2
16.4 7.6 10.5 5.6 4.0 12.7 13.7 5.3 12.7 -0.1 -2.9 9.6 5.6 3.8 5.0 7.3 7.8 6.0 5.0
MAJOR SPECIES PRODUCED IN 2016
Marine fishes nei 844,305 mt (30.7%)European seabass 191,003 mt (7.0%)Gilthead seabream 185,980 mt (6.8%)Large yellow croaker 165,496 mt (6.0%)Mullets nei 163,646 mt (6.0%)Groupers nei 153,261 mt (5.6%)Japanese seabass 148,925 mt (5.4%)Japanese amberjack 140,895 mt (5.1%)Snubnose pompano 115,331 mt (4.2%)Porgies/seabreams nei 75,615 mt (2.7%)Silver seabream 72,286 mt (2.6%)Red drum 71,293 mt (2.6%)Lefteye flounder nei 68,509 mt (2.5%)Turbot 59,616 mt (2.2%)Bastard halibut 43,929 mt (1.6%)Cobia 43,107 mt (1.6%)Tiger pufferfish 26,847 mtAmberjacks nei 24,121 mtPacific bluefin tuna 22,169 mtKorean rockfish 18,032 mtRighteye flounders nei 15,117 mtFlathead grey mullet 13,682 mtMangrove red snapper 10,420 mt
MAJOR COUNTRY PRODUCERS IN 2016
China 1,353,059 mt (49.3%)Japan 234,346 mt (8.5%)Egypt 221,711 mt (8.1%)Viet Nam 156,333 mt (5.7%)Turkey 142,685 mt (5.2%)Bangladesh 113,239 mt (4.1%)Greece 97,866 mt (3.6%)India 90,000 mt (3.3%)Korea Rep. 79,755 mt (2.9%)Spain 46,287 mt (1.7%)Taiwan 38,002 mt (1.4%)Indonesia 29,831 mt (1.1%)Malaysia 24,445 mtItaly 15,499 mtTunisia 15,239 mtCroatia 11,008 mtAustralia 10,913 mtIran 10,162 mtMexico 9,246 mt
Total feeds used5
1,172 1,303 1,511 1,644 1,697 1,912 2,206 2,354 2,654 2,688 2,645 2,784 2,978 3,131 3,147 3,464 3,781 4,715 5,974

W W W.WA S.ORG • WOR L D AQUACULT UR E • JU NE 2018 45
Year
2000200120022003200420052006200720082009201020112012201320142015201620202025
TABLE 3. Continued
MARINE SHRIMP: total production was 5,180,563 tonnes (mt) in 2016, with average APR of 9.9%/year since 2000, and a total farm gate value of US $ 32.01 billion in 2016 (FAO, 2018)
Total product ion1
1,137 1,311 1,467 2,051 2,364 2,668 3,111 3,294 3,400 3,532 3,629 4,046 4,168 4,301 4,679 4,875 5,181 6,060 7,026
Percent on feeds3
77 78 78 79 79 80 80 81 81 82 82 83 84 84 85 85 86 87 90
Spec ies EFCR4
2 2 1.9 1.9 1.9 1.9 1.8 1.8 1.8 1.8 1.7 1.7 1.7 1.7 1.7 1.7 1.6 1.6 1.5
Growth (%/year)2
8.6 15.3 11.9 39.8 15.3 12.9 16.6 5.9 3.2 3.9 2.7 11.5 3.0 3.2 8.8 4.2 6.3 4.0 3.0
MAJOR SPECIES PRODUCED IN 2016
Whiteleg shrimp 4,155,827 mt (80.2%)Giant tiger prawn 701,081 mt (13.5%)Penaeid shrimp nei 183,454 mt (3.5%)Kuruma prawn 57,351 mt (1.1%)Fleshy prawn 39,289 mtBanana prawn 24,681 mtMetapenaeid shrimp nei 7,132 mtIndian white prawn 5,202 mtSpeckled shrimp 3,806 mtBlue shrimp 2,402 mt
MAJOR COUNTRY PRODUCERS IN 2016
China 2,011,692 mt (38.8%)Indonesia 636,755 mt (12.3%)Viet Nam 633,427 mt (12.2%)India 521,269 mt (10.0%)Ecuador 422,000 mt (8.1%)Thailand 327,561 mt (6.3%)Mexico 127,814 mt (2.5%)Bangladesh 79,510 mt (1.5%)Philippines 61,682 mt (1.2%)Myanmar 54,179 mt (1.0%)Brazil 52,100 mt (1.0%)
Total feeds used5
1,751 2,045 2,174 3,006 3,548 4,055 4,480 4,803 4,957 5,213 5,059 5,709 5,952 6,141 6,761 7,044 7,129 8,435 9,485
In contrast to terrestrial agricultural food production systems where plant cereals and oilseeds dominate agricultural food production, aquaculture is currently dominated
by the production of aquatic animal species; over 70 percent of total production being in the form of fish, mollusks and crustaceans in 2016,
and only 27.3 percent of production being in the form of aquatic plants or seaweeds.
Aquaculture continues to be the world’s fastest growing and most diverse food production sector, with over 95.6 percent of total aquaculture production being realized within
developing countries and the sector growing at an average APR of 6.64 percent per year, compared with 1.15 percent for economically developed countries.

46 JU NE 2018 • WOR L D AQUACULT UR E • W W W.WA S.ORG
Empyreal® 75 is the industry’s original high-protein concentrate made from cornthat provides the nutrition fi sh need. To learn more, visit e75aqua.com.
Changing the way fi sh,and the industry, view protein.
B A I L E Y L A U E R M A NCargill Corn Milling June AdCaraqua130812Pub: World Aqua Society Magazine Color: CMYK Trim: 8.6875” x 11.1875”
Year
2000200120022003200420052006200720082009201020112012201320142015201620202025
SUMMARY TOTALS for major fed species and aquafeed production in 2016 and beyond
Total product ion1
13,947 15,196 16,211 18,529 19,377 20,905 22,558 24,796 26,570 28,226 30,032 32,359 35,317 37,219 39,657 41,385 43,504 52,511 61,755
Total feeds used5
13,843 15,158 16,656 19,271 20,605 22,215 23,904 26,650 28,909 31,141 33,346 35,655 39,252 41,748 44,930 47,485 49,577 60,429 76,173
1 Total reported species group production for 2000 to 2016 are taken from FAO (2018), and estimates for 2020 and 2025 are calculated based on expected growth. 2 Mean annual percent growth. 3 Estimated percent of total species-group production fed on commercial aquaculture feeds. 4 Estimated average species-group economic feed conversion ratio (total feed fed / total species-group biomass increase). 5 Estimated total species-group aquaculture feed used (total species-group production x FCR [feed conversion ratio]).
Year
2000200120022003200420052006200720082009201020112012201320142015201620202025
TABLE 3. Continued
FRESHWATER CRUSTACEANS: total production was 2,280,687 tonnes (mt) in 2016, with average APR of 11.0%/year since 2000, and a total farm gate value of US $ 22.53 billion in 2016 (FAO, 2018)
Total product ion1
429 521 577 785 846 914 955 1,272 1,374 1,555 1,688 1,662 1,818 1,953 2,013 2,115 2,281 2,773 3,374
Percent on feeds3
40 41 42 43 44 45 46 47 48 49 50 51 52 53 54 55 56 60 65
Spec ies EFCR4
2.4 2.4 2.3 2.3 2.2 2.2 2.1 2.1 2 2 2 2 1.9 1.9 1.9 1.9 1.9 1.8 1.7
Growth (%/year)2
57.1 21.4 10.7 36.0 7.8 8.0 4.5 33.2 8.0 13.2 8.6 -1.5 9.4 7.4 3.1 5.1 7.8 5.0 4.0
MAJOR SPECIES PRODUCED IN 2016
Red swamp crawfish 919,887 mt (40.3%)Chinese mitten crab 812,183 mt (35.6%)Oriental river prawn 272,592 mt (12.0%)Giant river prawn 233,898 mt (10.3%)Freshwater prawns nei 41,423 mt (1.8%)
MAJOR COUNTRY PRODUCERS IN 2016
China 2,104,267 mt (92.3%)USA 67,659 mt (3.0%)Bangladesh 53,003 mt (2.3%)Thailand 14,950 mtMyanmar 13,545 mtIndia 10,162 mt
Total feeds used5
412 513 557 776 819 905 922 1,255 1,319 1,524 1,688 1,695 1,796 1,967 2,065 2,210 2,427 2,995 3,728