global strategic outlook - si-revizija.si
TRANSCRIPT

Allianz Global Investors
Global Strategic Outlook
Q2 2014
Understand. Act.

2
Global Strategic Outlook - 2nd Quarter 2014
Qui leno suspicor Amor quibus mido Consido noster luvabrum
Content
8 Section one: Strategy summary
11 Section two: Thematic piece
15 Section three: Equities outlook
28 Section four: Fixed income outlook
35 Section five: Multi asset outlook
37 Section six: ESG outlook
40 Section seven: Economic forecast and valuation review
43 Section eight: Global Policy Council biographies

3
The case for active investment in a volatile worldAt a time when events in Ukraine have dominated headlines and geopolitical unrest has triggered an increase in short-term risk aversion amongst investors, we will begin by reflecting on the link between recent market events and the implications for our core outlook for 2014. Against the backdrop of shorter term market volatility, we will then discuss why, as active global investment managers, we strongly believe that we need to take a proactive approach to critically reviewing how we generate above-average long-term returns for our clients through superior active management strategies.
Geopolitical unrest and the impact on markets: our core view remains in placeWith the first quarter of 2014 proving to be an eventful one, let us begin by briefly revisiting our core outlook for 2014 before reviewing this in light of short-term events, in particular the crisis in Ukraine, and how they are impacting our outlook in practice.
Our core outlook for 2014 1. Modest global economic recovery: the global economy should continue to benefit from a modest recovery
that is gaining momentum, underpinned by a longer term recovery in the US economy.
Introduction
Andreas Utermann Global Chief Investment Officer, Allianz Global Investors
“We stay close to the needs of our clients so we can provide the strategies and customised solutions that deliver forward thinking and intelligent ways to achieve their objectives.”
At Allianz Global Investors we follow a two word philosophy.
Understand. Act.

4
Global Strategic Outlook - 2nd Quarter 2014
2. Monetary policy set to be ‘looser for longer’: central bank policy will remain ‘looser for longer’ and will become even more critical to markets as they manage a smooth transition from QE, via incremental tapering steps, to becoming expert at providing sensitive and well-timed future guidance on monetary policy in the face of possible interest rate increases ahead.
3. Risk assets drive returns: risk assets will likely drive returns in 2014 against a continuing background of Financial Repression.
The impact of the Ukraine crisis on financial marketsFinancial markets clearly believe that the central bank ‘put’ is still very much in place, as exemplified by the relatively nonchalant reaction of financial markets to the geopolitical turmoil resulting from the crisis unfolding in Ukraine.
Even the latest and most critical stage in the crisis so far – Russia’s annexation of the Crimean peninsula – has done no more than make markets pause for breath. In fact, markets remain quietly confident against a background of a global economy which continues to gradually strengthen, in line with our forecast.
In our opinion, the latest development should not have come as a significant surprise to spectators, with President Putin repeatedly expressing his conviction in the past, both privately and publicly, that the destiny of Crimea (and even Kiev) and Russia were intertwined. And, with fiction presaging reality, Tom Clancy’s posthumously published December 2013 novel Command Authority describes a Russia/Ukraine conflict, with Crimea ultimately incorporated into Russia.
Overall, we continue to expect that the political and economic fallout will be relatively minimal in the short term, though an escalation of this confrontation into eastern Ukraine cannot be excluded. In the medium term, a more assertive Russia could lead to the re-emergence of cold war-like tensions, which could cause global trade to suffer and possibly trigger negative repercussions for the price of commodities. Both could impact global growth.
The re-emergence of a more belligerent Russia will certainly also remind Europeans of the raison d’etre of the European Union. A crisis on Europe’s door step cannot help but strengthen the resolve among European institutions – which until recently had been somewhat weaker – to work more effectively together. This message was also emphasized by the US in recent weeks, which craves a strong, unified Europe that is capable of taking firm and effective action on the global political and economic stage.
Our central thesis of central bank rates being ‘lower for longer’ is currently being tested by subtle shifts in the rhetoric of the Bank of England and the US Federal Reserve. Forward guidance is gradually being abandoned, and a more bullish tone on economic growth and employment conditions is starting to signal potential rate increases in 2015. The same cannot be said of the European Central Bank and Bank of Japan, where the tone remains more dovish with both still struggling to raise inflation expectations amid continued weak economic activity.
Meanwhile, as predicted, riskier assets have found the going tougher so far in 2014, with lower and more volatile returns from equities, while emerging market assets have suffered from continued retrenchment by foreign investors. The next quarter or two should give us more certainty as to where we are headed.
Active management and the hunt for long-term returns in the midst of uncertaintyAgainst the backdrop of what remains an uncertain political and economic landscape, one of the most important long-term themes coming out of our semi-annual Investment Forum at Allianz Global Investors has been the urgent need for investors to be prepared to take more risk in the search for long-term attractive returns.
But, in what has become an increasingly difficult market environment for all investors, we believe that it is not sufficient to challenge only our clients and other investors to review how they invest and their approach to risk. In a rapidly changing world, we also need to challenge ourselves, as professional investors, to deliver the best possible long-term returns for our clients, to be constantly vigilant and to adapt to a changing investment environment.
4

Global Strategic Outlook - 2nd Quarter 2014
The analysis: active management has become harderWith the knowledge that, as active managers, we attach the highest importance to our ability to generate attractive long-term returns for our investors, we have, for some time now, been carefully monitoring and analysing the overall market environment in which we operate.
That analysis (and also the analysis of others, including Mercer Consultants) shows that one thing is crystal clear – while active managers have generated real value for investors in past decades, it is getting much tougher for them to deliver outperformance within a market environment where low levels of volatility and high levels of correlation have translated into lower long-term active returns for investors (see Figure 1 overleaf).
Over the past 30 years, global active equity managers have generated substantial value for clients, according to Mercer’s GIMD database. However, more recently, the pace of outperformance has slowed significantly; at the end of 2013, the median global active equity manager was trailing the benchmark on a three- and five-year basis.
The solutionSo what should active managers do to help their clients in this new environment? There are a number of proven strategies to help deliver higher active returns for clients in the face of headwinds (see Figure 2 overleaf).
The first is to drive higher returns by using risk more effectively in one of two ways: increase the level of risk as measured by ‘active share’1 and increase the return per risk.
At Allianz Global Investors, we have reacted to the challenges posed by low volatility and have increased the level of risk as measured by active share. We have also increased the return per risk by expanding the investment universe, the strategy set and the implementation set.
Further supporting this view is well-known research from the Yale School of Management, which has shown there to be two effective ways for managers to generate superior alpha in practice: via focused stock picking and diversified stock picking.
• Focused stock pickers’ portfolios have a smaller set of conviction investments and tend to be more highly concentrated – generally in the range of 40 to 50 securities. These portfolios typically generate a higher active share and higher tracking errors, and tend to be more successful in an environment of less-constrained investing.
• Conversely, diversified stock pickers’ portfolios generally have a lower tracking error but still have a high active share – although slightly lower than that of focused stock pickers.
Of these two ‘sweet spots’, more of Allianz Global Investors’ equity portfolios sit in the concentrated stock picker’s camp than the other. We have demonstrated abilities to generate high alpha for our clients, either in a benchmark-relative core equity setting or a benchmark agnostic unconstrained setting.
We also have strong product offerings in the second camp – diversified strategies that combine a high level of active share with a low level of tracking error, producing alpha that is attractive both in terms of level and stability.
Yet, perhaps most important of all, our focus has consistently been on improving our ability to select the right securities and capture big trends – including expanding our unconstrained investing capabilities:
• We have increased our research coverage, from 300 stocks to more than 2,000.
• We have increased our focus on picking high-conviction ideas and promoted deeper analysis by narrowing the number of stocks our analysts cover.
• We have launched an unconstrained equity product line that implements our views in unconstrained and focused portfolios.
5
1Active share is a relatively new measurement that gauges how active a portfolio manager really is by calculating the sum of all positive, active single stock overweights. In essence, the higher a portfolio’s active share number, the less similar it is to its benchmark.

6
Global Strategic Outlook - 2nd Quarter 2014
Allianz Global Investors is now focusing on implementing these enhancements across all our strategies. Our long-term aim is to ensure that every strategy is, based on this analysis, optimally positioned to deliver the best possible long-term active return for our clients.
Active management evolving to meet client needsWithin a volatile and ever-changing market environment, we, as active long-term investors, remain committed to constantly striving to review and improve how we can deliver superior returns for our clients.
In essence, this requires us to remain ever-vigilant as active managers, constantly reviewing how we manage our clients’ assets and challenging ourselves to renew and improve what we do every day. We believe that the future is bright for active management and we are excited by the challenge of continuing to develop and refine our entire range of investment strategies for the long-term benefit of our clients.
Read our full white paper on active investing online at http://allianzgi.com/activemanagement.
This chart shows the performance of the MSCI World index rebased to 100 from December 1993, indicated by the light blue surface. It also shows the relative perfor-mance of global equity managers against the MSCI World Index, indi-cated by the dark blue line. Over this period active global equity managers have outper-formed the MSCI World by 3.9% per annum on average. Source: Mercer, Allianz Global Investors,
as at December 2013.Relative performance, median manager (RHS)MSCI World (LHS)
Figure 1: Active equity managers have generated substantial value for clients over the long run
-10%
0%
10%
20%
30%
40%
0
100
200
300
400
500
Dec 93 Dec 96 Dec 99 Dec 02 Dec 05 Dec 08 Dec 11
Relative PerformanceAverage Global Equity Manager vs. MSCI World [USD]
Absolute PerformanceMSCI World [USD]
Past performance is not a reliable indicator of future results. If the currency in which the past performance is displayed differs from the currency of the country in which the investor resides then the investor should be aware that due to the exchange rate fluctuations the performance shown may be higher or lower if converted into the investor’s local currency.

7
Global Strategic Outlook - 2nd Quarter 2014
Two ways to react to lower returns per risk: Increase risk, or increase return per risk.
CaseyQuik (2013); Allianz Global Investors.
Figure 2: Capability levers for new active management
1. Risk LeverIncrease Risk Taking
2. Return per Risk LeverExpand Investment Universe
3. Return per Risk LeverExpand Strategy Set
4. Return per Risk LeverExpand Implementation Set
Activ
e Sh
are/
Trac
king
Err
or
Asse
t Cla
ss/S
ecto
r
Activ
e Re
turn
Liquidity Profile
High
LowHigh Low
Geographic
AllCapMultiSector
SingleCap/Sector
Local Global
Sector AllocationCountry
Allocation
MarketTiming
MacroEconomicExposures
FundamentalCompany Research
InvestmentStyles
Short-termTradingStrategies
TradingCosts
InformationGain
130/30
Long-onlyConstraint
Tracking Error

8
Global Strategic Outlook - 2nd Quarter 2014
Stefan Hofrichter, CFAHead of Global Economics and Strategy
Still preferring risky assets – despite some roadblocks Since the beginning of 2014, risky assets have tended to generate positive returns. While global equities in the developed world, as measured by the MSCI World price index, have, admittedly, produced relatively flat quarterly returns as at the time of writing, when dividends are taken into consideration, the total return has been slightly positive. Corporate bonds, both in the US and in Europe, have outperformed sovereign bonds and generated a decent absolute return of around 2% for investment grade credits and close to 3% for high yield debt. Within the euro zone, the stellar performance of bonds issued by the periphery has continued. While this was especially true for Portuguese bonds, which generated double digit returns in expectation of Portugal’s return to the capital markets, bond markets in Italy, Spain and Ireland also significantly outperformed the JPM EMU index, as did that of Greece. Emerging market bonds in hard currencies (USD), too, generated positive returns, principally because of the fall in US yields. While it paid off to remain invested in the aforementioned asset classes, the performance of various other capital markets indicates that headwinds for risky assets were mounting, since high quality sovereign bonds, like US Treasuries and German Bunds, generated positive returns as well. Global bonds, measured by the Citi Global BIG index, even slightly outperformed the global MSCI equity index. Meanwhile, emerging market currencies, equities and local bonds suffered, demonstrating investors’ diminishing risk appetite.
This overall performance pattern points to a market environment which looks slightly more balanced compared to late last year. We think this is unlikely to change. While we retain a preference for risky assets, we now see some roadblocks on the way. These require fine tuning of portfolios and also warrant a reduction in the exposure to risky assets.
In particular, several positive factors for risky assets remain in place.
Firstly, monetary policy remains highly accommodative around the world. While the US Federal Reserve (Fed) continues to reduce its monthly purchases of US Treasuries and asset-backed securities – a process which is likely to end in autumn of this year – US interest rates are not expected to rise until mid-2015. Although this may be around one quarter earlier than so far anticipated by markets, Fed Fund target rates should remain below equilibrium levels at least until the end of 2016, according to the Fed’s guidance. Admittedly, the Fed’s change in its forward guidance – replacing the explicit threshold level for the unemployment rate of 6.5% by a broad assessment of the labour market, inflation and the economic cycle – is likely to generate more uncertainty about future Fed rate decisions. This kind of forward guidance, which is not only state-dependent (as opposed to being fully committed), but also opaque, could lead to greater volatility in sovereign bond markets, not just in US Treasuries, but also, possibly, in equity markets. Nevertheless, as the Fed’s policy stance is likely to remain highly accommodative as long as rates do not exceed a ‘neutral’ level, which we perceive to be in the area of 4%, economic activity and risky assets should get support. This view also holds true for the Bank of England (BoE), which has also had to change its forward guidance and opt for a less transparent version. In line with the Fed, the BoE is likely to start hiking rates in 2015, and is most likely to be the first major central bank to do so. Higher rates, though, do not imply that UK monetary policy will become tight in absolute terms.
Neither is the European Central Bank likely to change its ultra-easy monetary policy any time soon. If anything, we should expect more unconventional measures if the euro continues to strengthen.
Global | US | Europe | Asia-Pacific
1. Strategy summary

9
Global Strategic Outlook - 2nd Quarter 2014 Global | US | Europe | Asia-Pacific
Elsewhere, the Bank of Japan is the only central bank which is credibly committed to a massive balance sheet expansion. It can be expected to increase its QE programme further in the spring, given the recent weakness in some economic data and the likely contraction of gross domestic product (GDP) in the second quarter related to its planned value added tax (VAT) increase.
Secondly, economic data continue to confirm our expectation of a gradual, albeit not forceful, economic recovery globally, with relatively stronger momentum in the West compared to Japan and the emerging markets.
We expect US growth to be above-trend this year, due to the fact that fiscal policy will be less of a drag on growth than last year, which technically increases GDP growth compared to 2013. Recent weakness in US data is, to some extent, explained by the cold winter. However, this can hardly be the full explanation. Durable goods orders, while still growing, had already started to lose momentum in the second half of 2013. Housing momentum, too, has receded. Beyond the weather, there may be several factors explaining the recent softness in US data: an inventory cycle; weaker disposable income; and a decline in corporate earnings growth (while earnings levels remain strong). The inventory cycle usually only lasts for a few months and could turn up again in the course of the year. Disposable income, too, could very well pick up again soon, as employment and labour income have recently been very strong. Earnings, admittedly, are already well above-trend, and may mean-revert to the long-term trend.
In Europe, too, economic data are on the rise, pointing to close-to-potential GDP growth in the region. What is even more important is the fact that growth is spreading both geographically and qualitatively: periphery countries, with the exception of Greece, have by now already left their recessions behind and have started to generate positive growth rates. In addition, growth contribution is no longer confined to exports. Private final domestic demand has picked up as well, notably in investments. The receding stress in the financial system, less fiscal austerity and the pick-up in global activity are clearly supporting factors for growth.
Japan’s growth outlook, on the other hand, is less clear. Growth in the second quarter is likely to be negative, due to the planned hike in the VAT rate. Developments in the second half of this year will be crucial. With rising import prices and a declining momentum in the yen’s depreciation, it remains to be seen whether growth at or above potential, as expected by consensus, remains realistic. Admittedly, another round of QE would be another ‘shot in the arm’ for the economy. Longer term, the growth outlook really depends on an improvement in domestic demand. Investment activity has started to pick up and would benefit from tax incentives going forward. Wages, though, are still not really growing, thereby dampening private consumption. A lasting return to higher nominal GDP growth without solid private household spending is unlikely though.
In the emerging markets, economic data remain mixed. Factors which are, and will be, weighing on the growth outlook are manifold: tighter monetary policy in response to the capital flight at the beginning of the year; a weak yen, which puts pressure on Asian competitiveness; too much private sector debt weighing on growth, especially in China; and weaker growth in China, putting pressure on commodity prices. On the other hand, stronger growth in the developed world, as well as export support via weaker currencies, should help emerging markets.
Thirdly, valuations of risky assets are in many cases still reasonable. This is particularly true for non-US equities. European equities at Shiller PEs (our preferred valuation measure) in the region of 17, are trading at a discount to their long-term average. Emerging market equities, too, are at their lowest valuation readings since 2005 and at the biggest discount to developed markets apart from the period 1997 to 2004, i.e. the years after the Asian and Russian crisis. At a multiple of around 25, US equities are roughly 50% above their long-term average valuations. While this does not necessarily prevent markets from rising near term, medium-term expected returns, adjusted for inflation, are expected to be a low single-digit number. The prospect for Japanese equities is more difficult to assess. While not cheap relative to other markets in PE terms, they are, however, attractively priced on price-to-book measures. On balance, we deem the Japanese market

10
Global Strategic Outlook - 2nd Quarter 2014
to be roughly fairly priced. To summarize, despite the doubling of global developed and emerging market equity prices during the last five years, most markets do not look really expensive in our estimation.
Spreads for corporate bonds have tightened substantially. However, current valuations can still be justified by the reasonable economic outlook, low market volatility and implied default rates, which are higher than the ones observed historically. Admittedly, valuations are no longer a strong buy-signal for corporate bonds, as was the case from 2009 until early 2013. Besides corporate bonds, we are also of the opinion that spreads for emerging market bonds offer value for long-term investors.
Despite these positive factors, however, headwinds are mounting for risky assets.
One is potential investor fatigue. After several quarters of improving economic data and strong returns from equities and spread products, many investors have already positioned themselves cautiously. In other words, we may reach a point where there is a lack of marginal buyers. This is particularly the case now, as fundamental economic data remain good, but are no longer surprising on the upside. On a monthly basis, global economic data continue to come in better than in previous months, but this improvement is losing momentum, as our breadth indicators are showing. In addition, consensus has finally started to embrace the better macro environment. While in the second half of 2013, consensus growth expectations lagged behind the improvement in news flow, the opposite can be observed now: consensus growth expectations are picking up and are broadening geographically, exactly at a time when global economic news flow is losing momentum. Add to this the rather lofty valuations of US equities, it would not take much for the equity market’s rally to turn into a lull.
Secondly, emerging markets are still facing potential problems, as mentioned above. This is particularly true for the biggest emerging economy, China, where the high leverage in the private sector constitutes a structural headwind to growth. The first bond default, the recent bank run on a small rural bank in Eastern China, the sharp drop in the price of copper (which has been widely used as collateral for corporate credit in China), as well as the weakness in the renminbi (which may also be explained by authorities trying to shy away from hot money inflows) are the most obvious signals of stress in the Chinese financial system. However, we think that authorities are willing
and capable of controlling an eventual aggravation of the debt problem and will be able to avoid a hard landing, or even a financial crisis. Nevertheless, investors may continue to demand a risk premium for investing in the theme ‘Chinese long-term growth outlook’. This could well not only continue to affect Chinese assets, but also other emerging market assets and currencies, as well as commodity prices. In addition, in the developed world, it could affect mining stocks, stocks with a strong exposure to China, as well as the currencies of commodity-exporting countries in the developed world, irrespective of their current valuation assessment.
Finally, political risks have returned to the headlines. Although the euro-zone debt crisis seems to be yesterday’s story according to the capital markets, this is not the case from an economic viewpoint, given the fragmentation of the credit markets and the high unemployment rates in the periphery countries. While we are of the opinion that the Ukraine crisis will not escalate further, primarily because both parties involved, the West and Russia, have no rational interest in inflicting lasting damage on their respective economies, we cannot totally rule out an adverse scenario. For us, the critical variables to watch as barometers for stress in the financial system are energy prices, credit default swap (CDS) spreads for Western banks and swap spreads, as well as economic sentiment indicators. So far, at least, none raise concerns.
In summary, balancing all factors, we come to the conclusion that is still pays off to hold onto risky assets. Nevertheless, the spectacular gains of 2013 are unlikely to be repeated and investors need to be active in avoiding the roadblocks that lay ahead.
Global | US | Europe | Asia-Pacific

11
Global Strategic Outlook - 2nd Quarter 2014
Stefan Hofrichter, CFAHead of Global Economics and Strategy
In Europe and the US, inflation rates have been dropping for about two years. At the time of writing (February 2014), the average rate of inflation in the euro zone is less than 1%, below 2% in the US, and around 2% in the UK. Meanwhile, in a few countries in the periphery of the euro zone (including Greece and Cyprus), prices have recently fallen compared to the previous year. Only in Japan are inflation rates rising.
The question that plagues investors is: will the trend of falling inflation rates in Europe and the US continue, or will it transition into deflation? In a few months, or quarters, will we see falling prices, not just in a few countries of the euro zone, but across Europe and possibly also in North America? Such an eventuality would have massive ramifications for investment decisions. Falling prices would mean companies have inadequate leeway for passing on price increases, placing pressure on their margins and profits. In addition, equities often produce negative returns during times of falling prices, as Japan has demonstrated over the past two decades. Furthermore, the current high levels of corporate, household and government debt would increase in real terms, causing debt problems to intensify once more.
To be able to assess the outlook for inflation, one must first understand why inflation rates in many industrialized nations have recently been falling. In our opinion, there are three important reasons for this.
Firstly, the economic environment across the western industrialized world means many companies, private households and governments are trying to reduce their high levels of debt. This is a long, drawn-out process, typically characterized by low economic growth lasting several years – and consequently also by moderate inflation. In the euro zone, we are still at the beginning of this development, but in the US and the UK, the deleveraging phase has not yet come to an end. We continue to expect trend growth in western
industrialized countries in the coming years. However, this growth is likely to be lower than before the crisis, which suggests a continuing subdued price environment.
The second reason for the continuing disinflation trend is closely tied to the above argument. Employees in the western industrialized world currently only have weak negotiating power. Contrary to widespread belief, inflation often runs ahead of, rather than trailing, wage rises. In other words, rising inflation could be possible even in the presence of moderate wage rises. However, in the long run, inflation can rise only if wage hikes eventually follow and rising demand is generated through rising incomes, reinforcing the original inflationary impetus. In the current environment, this is difficult to imagine. Quite the contrary, in fact, since the current low growth in wages in western industrialized countries is, at present, still reinforcing the disinflationary trend.
Thirdly, prices for internationally traded goods are currently under pressure, especially goods that are exported from emerging markets and raw materials. In itself, this development is nothing out of the ordinary; it has been observed several times over past years. But, against the background of recent upheavals in the emerging markets and Japan’s extremely expansive monetary policy, the risk of continued pressure on import prices in industrialized countries in the coming months should not be discounted. Monetary policy in Japan is resulting in a deterioration of the macro environment, in particular for Asian emerging markets. This growth-inhibiting effect also means weaker demand for raw materials, producing an indirect effect on commodity-exporting countries, especially those in Latin America. The greater the pressure on the currencies in the emerging markets becomes, the greater the feedback effects for industrialized countries, both for aggregate demand and for inflation rates due to falling import prices.
2. Thematic piece: Will deflation follow disinflation? Inflation outlook for the next two years

12
Global Strategic Outlook - 2nd Quarter 2014
These forces are expected to result in falling inflation rates in western industrialized countries in the coming months. But, at Allianz Global Investors, we are assuming that during 2014 – at the latest in 2015 – inflation rates will not only stabilize, but will show a moderate rise. In our opinion, there are several factors which will act against the disinflationary forces, and prevent a slide into Japan-style deflation.
One key argument is the cyclical recovery in industrialized countries. While we are assuming only a low rate of European growth this year – at best, we expect this will be in line with trend growth (approximately 1.25% in the euro zone) – this represents a definite improvement compared to the preceding year when the region was still in recession. For the US, we expect growth to be significantly higher than in 2013, since the braking effects of a restrictive fiscal policy will be significantly lower in 2014. As in the past, stronger economic growth should lead to a rise in inflation rates since, in macroeconomic terms, the difference between supply and demand is narrowing.
Stable long-term inflation expectations of around 2% also argue against the risk of deflation (see Figures 1a and 1b opposite). This is crucial. If the opposite were the case – if companies and households were to defer expenditure into the future – economic growth would drop, with negative effects on prices. Without a doubt, however, current inflation expectations are no cause for complacency, since trend changes in inflation rates are usually unexpected and inflation expectations adjust only after a delay. This means fiscal policy is of special importance, since it can help stabilize inflation expectations through appropriate measures, such as large-scale purchases of bonds.
The rate of growth in the global broad monetary supply – we analyse global monetary supply since the major trend changes in inflation rates are, in most cases, global – is around 6% to 7% (see Figure 2 opposite); within the range of the growth of global nominal GDP, the acceleration that has been evident since mid-2011 provides further reasons why we should not assume deflation in the western world. Ordinarily, changes in monetary supplies precede inflation by about two to three years – this argues for speedy stabilization of inflation rates.
Ultimately, there are some very crucial differences between the current situation in Europe and the US and that of Japan, which suffered from deflation for about 25 years following the bursting of its bubble at the beginning of the 1990s. In our view, these differences clearly argue against a repeat of the Japan scenario – and thus against a deflation scenario. Firstly, western central banks reacted swiftly and resolutely following the bursting of the bubble in 2007. Interest rates were quickly lowered – the interest level at the short end of the interest curve has been lower than the prevailing rate of inflation for several years – and liquidity was made available on a large scale (see Figure 3a to 3c on page 14). In contrast, the Japanese central bank reacted only after years of delay following the bursting of its country’s bubble. Additionally, the corporate and household debt level in the developed world today is significantly lower than in Japan two decades ago. This means that the deleveraging process should also be completed significantly more quickly. Finally, in most industrialized countries, the real estate sector, which was the actual cause of the great recession of past years, is not only stabilizing but also undergoing a significant recovery in some cases. This is an important support for the recovery of the banking sector since it reduces the need for write-offs in loan portfolios. In contrast, in Japan, real estate prices fell for a period of around 20 years, and thus crippled lending.
Taking all the arguments into consideration, we come to the conclusion that, while it is possible that the disinflation trend may extend into the next few months, inflation rates should stabilize in both the US and Europe over the coming quarters. We are explicitly assuming that both the US and Europe will be able to avoid a deflationary scenario such as the one in Japan. In the long term (that is over the next three to five years), a crucial factor will be whether the western central banks again normalize their monetary policy, or whether they – as we expect – remain expansive for too long.
This means we will not be saying goodbye to the low interest environment anytime soon, but we think the risk profile for bonds will continue to be asymmetric in view of the inflation outlook.

13
Global Strategic Outlook - 2nd Quarter 2014
13
Source: Datastream, AllianzGI Economics and Strategy,as at January 2014.
Figure 1a: EMU survey of professional forecasters (SPF): Inflation in 2 years and 5 years
EMU SPF: CPI inflation next 2 yearsEMU SPF: CPI inflation next 5 years
1.4
1.5
1.6
1.7
1.8
1.9
2.0
2.1
2.2
1999
2000
2001
2002
2003
2004
2005
2006
2007
2008
2009
2010
2011
2012
2013
2014
%
Source: Thomson Reuters Datastream,as at 3 January 2014.
Figure 1b: USA: Survey of Professional Forecasters Inflation in 10 yearsUniversity of Michigan Survey: Inflation in 5 years
University of Michigan: CPI inflation next 5 yearsSPF: CPI inflation next 10 years
2.0
2.5
3.0
3.5
4.0
4.5
5.0
1990
1992
1994
1996
1998
2000
2002
2004
2006
2008
2010
2012
%
2014
Source: Datastream, AllianzGI Economics and Strategy, as at September 2013.
Figure 2: Global broad money supply, YoY
0123456789
10
200
1
200
2
200
3
200
4
200
5
200
6
200
7
200
8
200
9
201
0
201
1
201
2
201
3
%

14
Global Strategic Outlook - 2nd Quarter 2014
The Japanese data on these charts start from September 1992 but has been pushed forward and overlaid to illustrate the differences between economies in a recession environment.
Source: Datastream, AllianzGI Economics & Strategy,as at 7 January 2014.
Figure 3a: Quick response by central banks – negative real yields
USAGermanyJapan
2008
2009
2010
2011
2012
2013
2014
2015
2016
2017
2018
2019
2020
2021
2022
2023
2024
2025
2026
2027
2028
2029
%
-4-3-2-101234
Source: Datastream, AllianzGI Economics& Strategy, as at January 2014.
Figure 3b: Recovery in house prices – good for banks (2008/1992 = 100)
House Prices: New Houses: IrelandHouse Prices per square metre: National: Spain
UKJapan Land Prices Euro Area Germany
USA
20
40
60
80
100
120
140
2006
2007
2008
2009
2010
2011
2012
2013
2014
2015
2016
2017
2018
2019
2020
2021
2022
2023
2024
2025
2026
2027
Figure 3c: Private sector leverage much lower in US and Europe
Source: Datastream, AllianzGI Economics & Strategy,as at 7 January 2014.
EMUUSAJapan
2008
2009
2010
2011
2012
2013
2014
2015
2016
2017
2018
2019
2020
2021
2022
2023
2024
2025
2026
2027
2028
2029
140
160
180
200
220
240

Global Strategic Outlook - 2nd Quarter 2014
15
Global | US | Europe | Asia-Pacific
3. Equities outlook - US
US equity market returns have proven a little more challenging in the first quarter of 2014. As the US Federal Reserve’s (Fed) policy has become less accommodative, investor confidence in economic and earnings growth prospects has eroded somewhat. Foreign risks have also become more evident, and investor portfolio preferences have become less favourable. Nevertheless, compelling alternatives to equity investments remain sparse at best, and we do not detect a significant recession risk for 2014. Nor can we identify any convincing reason why policy makers would be inclined to induce, or even tolerate, the onset of a recession, although irreversible policy mistakes are always possible. While US equity returns may not be as rewarding as they have been since the March 2009 low in major indices, we still anticipate they will outperform most other major asset classes in the year ahead.
Regarding the Fed’s stance on monetary policy, the incoming Chair Janet Yellen appears intent on diminishing her dovish reputation. As of the last Federal Open Market Committee (FOMC) meeting, the Fed looks set to continue with a steady reduction in the size of its asset purchases, which should lead to the end of quantitative easing by October of this year. Indications from the Chair’s first press conference are that hikes in the policy rate could begin as early as April 2015. The short end of the yield curve lifted higher in response to this clarification of forward guidance, as investors had previously believed the autumn of 2015 would mark the earliest likely hike in the federal funds rate.
Surprisingly, this clarification of the likely trajectory for monetary policy has emerged while inflation expectations have remained fairly steady at around 2.25%, and actual inflation outcomes have proven more benign than Fed targets or forecasts. A swifter removal of quantitative easing and an earlier onset of policy rate normalization have come to the fore, even as US economic growth remains sluggish and inflation remains benign, suggesting that the Fed wishes to reduce the odds of future financial instability. Such instability can result from the provision of excess
liquidity to investors and from the artificial and prolonged suppression of interest rates (and hence the suppression of discount rates used by investors to value assets). We must conclude that, for a majority of the FOMC, the potential costs of proceeding with quantitative easing now appear to outweigh the estimated benefits. Consequently, investors must assess the probable path of future risk-free interest rates and reasonable risk premia for various asset classes, without the prospect of an extra push from any further unconventional policy measures that tend to involve outsized balance sheet expansion by the Fed.
Consensus forecasts for 2014 US earnings and economic growth have also come into question, as the year started off with especially adverse weather conditions which caused disruption to both production and consumption activity. However, the proclivity of brokerage house economists and the financial media to blame all the signs of slower growth on weather must be earnestly questioned. For example, take a close look at capital spending, which is, to our way of thinking, one of the key drivers of economic growth in capitalist economies. We have been searching for signs of an improving pace of capital spending growth over the past year, following the high profit margins, improved earnings momentum, low credit costs and rising capacity utilization rates that developed in 2013. However, orders for non-defence capital goods (excluding aircraft orders, which tend to be especially lumpy) have been flat in dollar level terms since February of last year (see Figure 1 overleaf). To attribute this stall in orders to adverse weather over the last three months is foolhardy at best, and simply erroneous at worst. Similarly, existing home sales have dropped steadily in unit level terms since their peak in July of last year, with the recent result for February sales activity nearly 15% below the July 2013 peak. Weather cannot account for all of this.
Two of the key cyclical drivers of US economic growth – capital spending and housing – began showing signs of slowing as early as a year ago, well before the
Rob Parenteau, CFAEconomist, External Advisor
16
Global Strategic Outlook - 2nd Quarter 2014 Global | US | Europe | Asia-Pacific
adverse weather, and even well before the first indications that the Fed was likely to begin tapering its asset purchases. This raises the degree of uncertainty for equity investors, particularly around the likelihood of the US economy hitting ‘escape velocity’ and returning to a real GDP growth path closer to 3% in 2014. In turn, the pace of the corporate earnings rebound due in 2014 must also be viewed with more suspicion, and not just because of adverse weather in the first quarter.
Beyond the challenges posed by the removal of QE and an earlier return to interest rate normalization, plus a slower than expected start to 2014 business activity, there lies a third related challenge emerging with regard to corporate sector balance sheets and portfolio preference shifts. A peculiar puzzle can be found in the Fed’s summary of cash flows and balance sheets for the US non-financial business sector. Companies are still running positive free cash flow positions, as net investment in productive assets remains subdued, while reported profit margins remain near record highs. For the non-financial sector, this free cash flow position averaged USD 213 billion for calendar 2013, only slightly below the 2012 pace of USD 232 billion. However, in stark contrast to the USD 384 billion reduction in liabilities that non-financial businesses accomplished in 2009 (in part with this free cash flow), this key segment of the economy increased its liabilities by USD 928 billion in 2013 alone (see Figure 2 opposite), with two-thirds of that funding raised in the corporate bond market.
This sharp increase in corporate debt, combined with a positive free cash flow position in the non-financial business sector, is somewhat peculiar. Conceivably, corporate profits have been overstated; hence the unusual reliance on debt financing. More likely, the corporate debt surge reveals the scale of share repurchase activity, which is estimated at USD 383 billion for 2013, as well as the scope of acquisition activity. This activity can show up as part of the USD 775 billion that the Fed recorded as the increase in miscellaneous assets in 2013 (i.e. goodwill and other intangible assets that are marked up in an acquisition). In other words, debt has been used to create a demand for equities, thereby elevating both stock prices and earnings per share results, during what has been an abnormally slow economic recovery.
From an equity investor perspective, then, it becomes important to closely monitor corporate debt market conditions as the Fed progresses on its path of QE removal and interest rate normalization. Should bond investors perceive bond market risk/reward prospects as adversely skewed against them, this source of direct and indirect demand for equities could diminish in 2014. This may indeed happen, given that corporate bond risk premia are currently quite low and risk-free yields appear to have only one way to go – higher – which introduces prospective short-term losses through duration exposure. At the same time, we are noticing a heavier IPO calendar, as well as more insider selling by management, much like we saw in the terminal stage of the tech/telecom boom of the late 1990s. Finally, some of the high momentum social media and biotech related stocks have seen significant waves of profit taking since late February, suggesting that, at least for the moment, a turn in risk aversion has developed amongst some of the more aggressive institutional investment firms of late.
Each of these developments – from a less accommodative Fed, to a slower-than-expected growth path, and now a more challenging corporate finance picture – can create headwinds for the US equity market. But, with commodity prices falling, bond yields due to renormalize, and generous valuations (if not outright bubble conditions) in various real estate markets, there remain few attractive alternatives to equities for intelligent investors to pursue. While we will continue to investigate and assess the developing risks on these and other fronts, equities, to our mind, remain the best of a bad bunch when it comes to the likelihood of achieving the returns clients are seeking in asset markets. While some emerging equity markets may have cheaper valuations, and some euro-zone equity markets may offer a more compelling improvement in earnings momentum, we would be very surprised if US equity markets did not also participate on the upside. This is particularly the case if investor perceptions of a more dangerous world encourage the usual ‘flight to quality’ response which has tended to benefit US financial assets in the past.

17
Global Strategic Outlook - 2nd Quarter 2014 Global | US | Europe | Asia-Pacific
Shaded areas indicate US recessions.
Shaded areas indicate US recessions.
Source: US Department of Commerce: Census Bureau, as at 28 February 2014.
Non-financial corporate business; net lending/borrowing. Millions of dollars, seasonally adjustedNon-financial corporate business; total liabilities. Millions of dollars, seasonally adjusted
Figure 2: US business have been issuing loads of debt despite high free cash flow
-1,500,000
-1,000,000
-500,000
0
500,000
1,000,000
1,500,000
2,000,000
2003
2004
2005
2006
2007
2008
2009
2010
2011
2012
2013
Source: US Department of Commerce: Census Bureau,as at 19 March 2014.
Manufacturers' New Orders1
Figure 1: US capital goods orders have been flat for the past year19
95
1996
1997
1998
1999
2000
2001
2002
2003
2004
2005
2006
2007
2008
2009
2010
2011
2012
2013
44,000
48,000
52,000
56,000
60,000
64,000
68,000
72,000
2014
1Manufacturers’ New Orders: Nondefense Capital Goods Excluding Aircraft, Millions of Dollars, Monthly, Seasonally Adjusted.

18
Global Strategic Outlook - 2nd Quarter 2014
Neil DwaneChief Investment Officer, Equity Europe
Global | US | Europe | Asia-Pacific
Equities outlook - Europe
Equity markets have oscillated around their end of year levels for much of the first quarter 2014 as, following a few initial profit warnings, investors relax into the long-lasting results season. Within the markets, the recovery and rising confidence in the peripheral euro-zone countries have been the stand-out features, with Greece, Portugal and Italy all rising over 10% this year, mirroring the outperformance of the credit markets and narrowing spreads. This also reflects the re-emerging economic performance of Europe (see Figure 1 opposite).
Corporate results have, in fact, been worse than expected, not just in Europe but globally, which accounts for some of the lack of market momentum after such a strong performance in 2013. However, given the austere environment in Europe, investors have latched onto hopes of industry and corporate restructurings, such as those in the Telecoms sector, fuelled by the Verizon deal with Vodafone, as well as promising signs that many banks are seeking to raise capital ahead of the Asset Quality Review, due to be overseen by the European Central Bank (ECB) later this year.
Despite the weak results, it is important to note that equity markets have absorbed near record amounts of placings and new company listings. While these have drained cash away from portfolios and new money allocations, the market has been very resilient, especially given the uncertainties in the regional and emerging markets.
So far, dividends have not been as disappointing as earnings. This reflects company management’s willingness to pay out returns to shareholders, as well as the robustness of corporate balance sheets – a factor which we believe will continue to support many European equities during this period of financial repression. Earnings and outlooks have also been affected by the sharp deteriorations in many emerging market currencies against the backdrop of the latest uncertainties affecting Russia and Ukraine.
Clearly the tensions in Ukraine may raise investor nervousness around Central and Eastern Europe. It also makes Europe more vulnerable to an ‘energy’ shock, since around 40% of European gas originates from Russia and is piped through Ukraine. However, whilst this increasing geopolitical tension is worth watching, we believe that it remains in the interests of none for the situation to escalate significantly further. Although Russia seems intent on welcoming any other regions with Russian-speaking majorities, like the Crimea, into its Federation, this bluntness may in fact encourage the European Union (EU) to act more uniformly and forcibly, and should also encourage closer co-operation between the EU and the US.
Another feature of the European economies has been the falling level of inflation and the strengthening of the euro, both of which have been a headwind to Europe’s slow economic recovery. It is clear that these continue to concern the European Central Bank (ECB), but as yet it remains unwilling to act since these developments are forcing the austerity and economic restructuring processes, which the EU needs so badly, to remain in place. In turn, this is keeping governments within the euro zone focused on further economic changes and policies, as we are now seeing from the new Italian government under Prime Minister Renzi.
As we anticipate the coming of spring in Europe, thoughts will turn to the European Parliament elections in May; an anti-EU vote is seen as very likely in the UK, France and elsewhere. However, it is Allianz Global Investors’ view that this will not deter either the EU or Germany from continuing with the current steady policy progress towards ‘more Europe’ and ‘more integration’, alongside the financial and banking reforms which are also in the works from the ECB. Thus, in spite of the geopolitical uncertainty and political issues within the EU, European equities remain attractively valued, and still offer some of the best dividend yields available in the global equity markets.

19
Global Strategic Outlook - 2nd Quarter 2014 Global | US | Europe | Asia-Pacific
While the US has been growing since 2013, Europe just returned to growth last year.
Source: International Monetary Fund, as at December 2013.
Figure 1: Europe‘s recession is over. The IMF projects growth for the Eurozone in 2014IMF Economic growth forecasts
IrelandFrance
ItalyGermany
PortugalSpain
GreeceUnited Kingdom
-8
-4
0
4
8
2004
2005
2006
2007
2008
2009
2010
2011
2012
2013
2014
2015
2016
2017
2018
IMF Forecasts
%

20
Global Strategic Outlook - 2nd Quarter 2014
Equities outlook - Asia-Pacific
Asia Pacific economies are expected to continue slowing down as we enter the second quarter. Japan will implement the sales tax hike in April and we are waiting to see how Bank of Japan (BoJ) will respond to the subsequent expected weakness in the economy. For non-Japan Asia, we expect the quarter will be dominated by the elections in India and Indonesia. Elsewhere, China should continue to implement its comprehensive and ambitious reform plan against a backdrop of rising credit default risks.
Japan 2014 has started with a mixed bag of news for Japan. GDP growth for the fourth quarter of 2013 suggested that the economy grew at a much slower pace than expected relative to the previous quarter. Real GDP grew 0.3% quarter-on-quarter in the fourth quarter and at 1.0% on an annualized rate. While exports remained sluggish, domestic demand was relatively resilient as consumer spending and business investment gathered momentum. Meanwhile, machinery business orders rose 9.3% on a year-on-year basis, reaching a five-year high in November.
The consumer prices index (CPI) increased 1.4% year-on-year in January, while the core inflation rate, which excludes food and energy, was 0.7%. For calendar 2013, the inflation rate went up 0.4%, the first annual rise since 2008, and the BoJ has reiterated its aim for an inflation rate of 2% as the level necessary to offset deflationary pressures. Against this backdrop, the employment situation continues to improve, with the unemployment rate falling to 3.7% in December, the lowest level since 2008.
The housing market has also shown signs of recovery. Housing starts rose 11% on a year-on-year basis in 2013, the highest rate of increase in more than a decade. Most of the growth came from the sales of new homes, whilst sales of existing homes have been slow.
The current account balance has been steadily falling since the third quarter of 2011 as Japan has needed to import more energy to replace the output from its now dormant nuclear power plants. As a result, for the
first time since the early 1980s, the current account balance has registered a deficit of 0.3% of GDP. Meanwhile, the fiscal deficit has been rising because of the government’s stimulus programmes; at over 200% of GDP, Japan has the highest debt/GDP ratio among developed countries.
To strengthen its fiscal situation, the Japanese government has announced it will raise its sales tax from 5% to 8%, leading to fears that this could impact consumer spending and cause a slowdown in growth in the second quarter of 2014. Another concern is falling real wages, which declined in 2013, nearing the record lows they reached in 2009. Prime Minister Abe has been asking companies to raise pay and we will be carefully watching the progress of the wage negotiations between unions and companies which are due to take place in the spring. Meanwhile, the BoJ is keeping a close eye on the economic outlook and is expected to provide more easing to offset any slowdown in the economy.
Much has been said about Abe’s third arrow but, so far, we have not seen any concrete measures announced. Reform measures already implemented by the government have focused on the opening of tax efficient accounts for local investors and the relaxation of visa issuance for foreign investors. Abe’s speech in Davos reiterated his commitment to reforms, and he has expressed a firm desire for a reduction in the effective corporate tax rate. At the end of last year, the Cabinet approved measures to reignite the growth strategy. These measures included a strategic special zone law and a law to bolster industrial competitiveness. In addition, the government is still looking to lift the ban on casinos in the country: it is expected that this debate will begin in the next ordinary session of the Diet around mid-April this year.
Following its strong run in 2013, the stock market has corrected year-to–date. However, we do not see this as the start of a down market and continue to believe in Abe’s commitment to his third arrow. The weakness of the Japanese yen continues to be the main upward driver of Japanese equities. Earnings releases from
Raymond Chan, CFAChief Investment Officer, Equity Asia-Pacific
Global | US | Europe | Asia-Pacific

21
Global Strategic Outlook - 2nd Quarter 2014
Japanese companies so far this year are well ahead of the consensus. As a result of their recent underperformance, Japanese equities are trading on some of the lowest multiples within the developed world.
China At the National People’s Congress (NPC) meeting in March, Premier Li Keqiang officially announced China’s economic, fiscal and monetary targets for 2014. GDP growth at around 7.5%, CPI inflation at 3.5%, the fiscal deficit at 2.1% of GDP and M2 growth at around 13% are all in-line with market expectations. We think the economic growth target could be a challenging one in this reform year, which involves economic rebalancing, but still believe the government has the tools to manage a soft landing.
As we have argued before, the Chinese economy is going through the debt de-leveraging process and we expect economic indicators will continue to show decelerating trends. The government initiatives to contain the local government debt problem, eliminate excess capacities and tighten emission standards are expected to have a negative impact on the pace of economic growth.
CPI should stay significantly below the government’s full year target of 3.5% for the next couple of months, before edging higher in the second half of 2014. Under this current stable inflation environment, the risk of monetary tightening by the Chinese central bank is low. Also, interbank rates have trended down substantially in the past three months, with the 7-day SHIBOR falling from a recent high of over 8% to below 3%. These more accommodative liquidity conditions are crucial for supporting job creation and SME (small-to-medium enterprise) financing activities.
We believe the probability of across-the-board measures to control the housing market is quite small. Instead, there is a rising expectation that customized measures will be introduced, adjusted according to different local market conditions, to maintain a generally stable overall housing market. While top-tier cities should see an increase in mass market home supply and the continuation of home purchase restrictions, low-tier cities, which are currently suffering from a high inventory problem, are expected to face controls over land and home supplies going forward.
Regarding the well-recognized local government debt problem, following the nationwide government debt audit conducted last year, the central government and relevant regulatory authorities are now believed to have a better grasp of the situation. The recently announced fiscal reforms – to regulate local government financing activities, introduce a more transparent government budget, and allow private sector capital to invest in state-owned assets – are all gradual, but pragmatic, and move to tackle the problem.
As for trust or wealth management products, there could be individual cases of default to remove investors’ false perceptions of implicit guarantees, and to promote effective risk-based pricing. Although this may lead to short-term volatility or an over-reaction in the financial markets, and providing there are no contagion effects on the whole system, this is a crucial step in the right direction to establishing a healthy credit market.
On the exchange rate policy, the People’s Bank of China has introduced volatility to stop the one-way bet mentality in the currency markets. As a result, after hitting a record high of 6.0393, the Chinese renminbi started to weaken against the US dollar in February. The recent weakness of the currency has triggered the unwinding of structured products in the offshore market and carry trades among domestic players. Strategically, we believe internationalization of the renminbi will continue to take place, with further easing in the Qualified Foreign Institutional Investor and the Qualified Domestic Institutional Investor schemes and more functions being added to the offshore centres on the horizon.
Investors’ worries about a possible credit crisis and a subsequent economic hard landing, as well as scepticism about the country’s ability to rebalance its economy, are keeping the stock market under pressure. However, corporate earnings have been showing consistent growth despite this challenging environment. Therefore, this weak market performance is more of a reflection of elevated risk premium. With a near-term lack of direction in the Chinese economy, we believe the performance divergence among individual stocks will remain substantial. Sectors which should benefit from China’s economic rebalancing, such as environmental protection, new energy, tourism, healthcare services, IT infrastructure and automation-related capital
Global | US | Europe | Asia-Pacific

22
Global Strategic Outlook - 2nd Quarter 2014 Global | US | Europe | Asia-Pacific
goods will remain the focus for investors. In addition, we also see investment opportunities in selective ‘old economy’ cyclical sectors that have been trading at extremely depressed valuations and are very under-owned. Although we do not expect a significant demand pick-up in China, some cyclical industries, such as cement and dry bulk shipping, are actually seeing improved supply conditions which warrant a certain extent of valuation recovery.
Korea On the back of better global demand, Korea’s export growth continued to accelerate in the fourth quarter of 2013, registering a gain of 3.7% year-on-year compared to 0.4% in the first quarter of 2013, 0.7% in the second quarter and 2.7% in the third quarter. Export performance over 2013 also compared favourably to that of 2012, where a 1.3% decline was recorded. As a result of this better export performance, Korea’s production activities have improved modestly. In the October to November period, Korea’s industrial production increased 2.7% on average which was the fastest growth in seven quarters. Capacity utilization also inched up to 75.8% from 74.6% in the third quarter. While this is still below the 80% ratio which would usually lead to more corporate investments, it is nonetheless encouraging. Meanwhile, consumer sentiment has reached its highest level since January 2011.
With a steady recovery in exports, Korea’s current account surplus hit a record high in October at USD 9.5 billion, while, for calendar year 2013, Korea’s current account surplus reached 6.7% of GDP. This provides Korea with a buffer in the current uncertain environment where a number of emerging market economies are plagued by current account deficits and depreciating currencies.
Korea’s strong current account position has also helped to drive the continued appreciation of its currency. The Korean won strengthened against both the US dollar and the Japanese yen throughout the second half of 2013. Although the won has weakened somewhat since the beginning of 2014, if it were to resume its upward trend, Korea’s export performance may eventually be affected.
In February, President Park announced her “Three-year Innovation Plan”, marking her first anniversary in office. Her reform program targets 4% annual GDP growth, a 70% overall employment rate and USD 40,000 per capita income in the next three years. Under her plans, public sector companies are urged to
restructure and shore up their balance sheets. For private sector growth, the government is developing policies to support small-to-medium sized enterprises. Moreover, it is likely that the government will introduce further measures to support the housing market, which has been weak over the past few years. Given favourable government policies and rising rents, we expect the housing market to see some recovery, which should provide a boost to overall consumption as a result of the positive wealth effect.
India We are becoming more constructive on India due to improving macro data and the impending central elections. Broad macro data has bottomed out and has stopped deteriorating further. While India’s GDP has been below 5% for the last seven quarters, with 4.4% being the trough, the latest GDP data came in at 4.7% year-on-year for the fourth quarter of 2013. The twin deficits have also shown signs of improvement. The fiscal deficit has improved from 5.7% of GDP in fiscal year 2012 to 4.6% in fiscal year 2014, and the government has restricted the deficit to 4.1% of GDP in fiscal year 2015. Meanwhile, the current account deficit, which peaked at 6.5% of GDP in December 2012, improved to 0.8% of GDP in the final quarter of 2013. Wholesale price inflation has averaged around 7.8% over the last three years, but has come down to around 5.1% for January 2014. While consumer price inflation still remains above comfort levels, it has stopped deteriorating. The newly appointed central bank governor has adopted a CPI target of 6% for the next two years, compared to the current level of 8.8% in January 2014.
With India’s central elections due by 16 May 2014, the stock market looks forward to a Bharatiya Janata Party-led government headed by Narendra Modi. Mr Modi gives the impression of being a strong decision maker and, as chief minister for state of Gujarat for over a decade, has a reputation for being business friendly as well as having a strong track record in attracting foreign direct investment flows.
Some Indian companies have focused on improving efficiency operationally and have implemented measures to reduce import dependence. Any upturn in sales growth could provide good leverage to the profitability of these companies. Selected private banks and well-managed capital goods companies, in particular, should enjoy a pre-election rally. We will continue to avoid companies with highly leveraged

23
Global Strategic Outlook - 2nd Quarter 2014
Inflation in February appeared to be on a more manageable level of 7.75%, down from 8.22% in the previous month.
Thailand The outlook for politics in Thailand remains uncertain and there is no easy way to find a political solution that is acceptable to all vested parties and social groups. The battle between the ruling Pheu Thai Party, led by Prime Minister Yingluck Shinawatra, and the opposition Democratic Party is reflective of a secular split in the Thai society. The populist Pheu Thai Party draws its support from the poor and rural parts of Thailand, whilst the Democratic Party has the support from the Thai elites and the middle class. Political risk is also heightened by the ailing health of the King, who has been in power for 67 years and is still revered by the entire country.
The increased political chaos means that the economy will probably continue to deteriorate. The Bank of Thailand cut interest rates further in March on the back of weak economic activity. Credit growth has already slowed sharply and it will likely continue to do so, alleviating the central bank’s concerns over rising leverage. The silver lining in the likely ongoing weakness of domestic spending is that the economy is rebalancing more quickly, and the current account is likely to turn to surplus later this year.
balance sheets, focusing instead on the export-dominated technology and pharmaceutical sectors.
Indonesia Whilst we had previously been cautious and had maintained an underweight position in Indonesia, we have now moved to a neutral position as we prepare for a pre-election rally. The current governor of Jakarta, Jokowi, has gained national popularity and is now seen as a strong candidate for the Indonesian presidential election to be held in July 2014. If he was selected by his political party to run, the market would react positively as he is seen as a pro-reform achiever.
Bond yields have started to come down, as evidenced by the decline in 10-year yields from 9% to around 8.3% in February. After a dramatic double-digit fall last year, since the start of 2014 the Indonesian rupiah has strengthened against the US dollar. Foreign investors have been net buyers of equities and fixed income this year.
The trade balance has improved since beginning of the year to USD 1.5 billion. This dramatic turnaround was most likely exaggerated by the front-loadings of mining exports ahead of the ban imposed by the government in January. The Finance Minister forecasts a current account deficit in the second quarter, but an overall improvement for the entire year as a result of likely surpluses generated in the second half of 2014.
Global | US | Europe | Asia-Pacific

24
Global Strategic Outlook - 2nd Quarter 2014
Equities outlook - style
Klaus TeloekenChief Investment Officer, Systematic Equity
Q1 2014 has been a solid quarter for style investorsThe first quarter of 2014 has been a solid quarter for style investors as most investment style favourites, such as positive earnings revisions, high price momentum or small caps, were all ahead of the benchmark (see Figure 1 overleaf). Among the major investment styles, only value stocks and high quality names lagged, while growth styles showed mixed returns.
Regional differences in the performance of investment styles have been pronouncedThe backdrop from an investment style perspective was most favourable in Europe as all major investment styles contributed to returns. In the other regions, the investment style value underperformed markedly, particularly in the emerging markets and the US. This divergence in style performance reflects the different status of the economic and the market cycle within the different regions.
In Europe, the economic recovery is still in an early mid-cycle after the economic trough in mid-2012. Indeed, the performance of investment styles over the first quarter followed the typical pattern of a mid-cycle economic recovery: typically, in the early stages of an economic recovery, higher beta investment styles, such as value, take the lead, and continue their outperformance throughout most of the mid-cycle.
Trend following strategies, like price momentum and earnings revisions strategies, often suffer in the early stage of an upturn but then adapt to the new environment and return to efficiency again in the mid-cycle. Hence, in the mid-stage of an economic recovery, all major investment styles, like value, momentum or earnings revisions, are expected to contribute. Indeed, this is what we have observed in Europe in the first three months of 2014.
In the emerging markets, the performance of value stocks suffered from the deteriorating economic cycle, as value stocks are typically more cyclical names.
In the US, the performance of investment styles is reminiscent of the later stages of a bull market. In March 2014, the bull market has celebrated its fifth anniversary. The average length of equity bull markets since 1930 has been 63 months, and so the current bull market is nearing the average duration. Even worse, in only three of the last 12 major bull markets did the bull market last for more than 63 months: the average duration of 63 months is heavily skewed by the super bull market which started in the late 1980s and lasted for 150 months.
In that respect, it is worrisome that, in terms of investment style performance, similarities to bull market peaks are rising. Normally, in the later stage of a bull market, investors’ focus narrows to ’story stocks’. These are typically expensive, higher risk names with strong price momentum and high growth expectations. In this environment, value stocks usually lag.
This is a performance pattern that we observed before the market peak in 2000 and 2007, and this same pattern was also in place in the US in the first quarter of 2014.
However, despite growing similarities, we don’t think that we are yet at a market peak like in 2000 or 2007. For one thing, the performance lead of high momentum, high risk ‘story stocks’ over value stocks, while substantial, is not yet at the extreme levels seen in 2000 and 2007.
Also, persistent inflows into high risk, high momentum stocks indicate that the current regime should continue for the next months. Finally, we don‘t think that we are anywhere close to the peak of the economic cycle, and typically, economic and market peaks go hand-in-hand. However, a stronger acceleration of the outperformance of high momentum, high risk stocks would clearly be a red flag.
Global | US | Europe | Asia-Pacific

25
Global Strategic Outlook - 2nd Quarter 2014
Where do we stand in the economic cycle?Macro-economic indicators and measures of market behaviour indicate a mid-cycle stage, rather than a late-cycle one. Our Economic Similarity Index compares the current economic environment with the environment of the past years, based on a set of more than 20 macro-economic indicators and indicators of market behaviour. Based on this indicator, the current economic environment in most regions is rather similar to the economic environment in winter 1991/92, 2004 to mid-2005 and most of 2010 (see Figure 2 overleaf).
This similarity is driven by measures of uncertainty, like equity market volatility or risk spreads in the bond markets, but also by changes in OECD leading indicators, economic surprise indicators and interest rates. In all these periods, we have been in the mid-stage of an economic recovery, not in a late stage. By our measures, Europe and Japan are still early mid-cycle, while the US and emerging markets are later mid-cycle.
Which investment styles do we favour going forward?Typically, in the mid-stage of an economic recovery, all major investment styles, such as value, momentum and earnings revisions, are expected to contribute. This is true for the run-up to the mid-cycle peak, but also thereafter, as Figure 3 overleaf demonstrates. Hence, we continue to favor stocks that combine strong price momentum and positive revisions with reasonable valuations.
When would we change our medium term investment style preference for price momentum, earnings revisions and value?Price momentum and earnings revision strategies are expected to do well as long as the prevailing environment (market, economic and interest rate) remains stable, or only changes gradually. In this case, trend following strategies are easily able to adapt.
However, trend following strategies are vulnerable to sudden market disruptions, like the steep rise in interest rates in 1994, the Asian Financial Crisis in 2007, or the market turnarounds in 2000, 2003 and 2009.
On the other hand, a gradual removal of the monetary stimuli, like the tapering of QE in the US in 2014 or the start of interest rate tightening in spring 2015, would not compromise the investment case for trend following strategies: a gradual removal leaves enough time for trend following strategies to adapt, as the experience during the tightening in 2004/2005 shows.
Value strategies, like a low Price/Earnings strategy, often suffer in periods of higher macro-economic distress, as high levels of uncertainty erode the credibility of earnings expectations. As a consequence, investors do not react to seemingly low Price/Earnings ratios. Therefore, a strong economic slowdown would clearly be detrimental for many value strategies.
However, a typical mid-cycle slowdown would not compromise our investment case for value strategies, as the strong performance of value strategies during the mid-cycle slowdown mid-2004 to mid-2005 shows.
SummaryThe first quarter of 2014 has been a solid quarter for style investors as most investment style favourites, such as positive earnings revisions, high price momentum or small caps, were all ahead of the benchmark. Among the major investment styles, only value stocks and high quality names lagged, while growth styles showed mixed returns.
Going forward, in the mid-stage of an economic recovery, all major investment styles, such as value, momentum and earnings revisions, are expected to contribute. This is true for the run-up to the mid-cycle peak, and also thereafter. Hence, we continue to favour stocks that combine strong price momentum and positive revisions with reasonable valuations.
Global | US | Europe | Asia-Pacific

26
Global Strategic Outlook - 2nd Quarter 2014 Global | US | Europe | Asia-Pacific
Using over 20 macro-economic indicators, the Economic Similarity Index compares the current economic environment with that of past years. Each reading on this chart compares the February 2014 index score with the date on the horizontal axis.
2014
AC World World Europe USA Japan Emerging Asia Pacific (ex. Japan)
Value -2.9% -0.8% 0.9% -1.6% -1.0% -6.4% -5.8%
Growth 0.9% -0.2% -0.8% 0.0% -1.4% 2.8% 2.6%
Revisions 0.6% 0.2% 2.8% 0.3% -3.2% -0.4% -1.1%
Momentum 3.2% 0.4% 1.2% 1.7% -4.0% 4.9% 3.9%
Quality -1.0% -1.7% -2.7% -2.3% 1.1% -1.5% -1.3%
Risk 3.7% 2.7% 4.9% 3.2% -2.8% 6.8% 5.1%
Size 1.7% 0.8% 3.8% -1.1% 0.2% 0.2% -0.3%
Dividend Yield -0.4% 1.6% 0.5% 0.5% 2.3% -2.0% -0.9%
Dividend Growth 0.5% -0.4% -0.6% -0.6% 1.1% 2.7% 3.3%
Dividend Reliability 0.7% -0.1% -0.7% -0.4% 1.0% 2.1% 2.5%
Value -2.9% -0.8% 0.9% -1.6% -1.0% -6.4% -5.8%
Momentum 3.2% 0.4% 1.2% 1.7% -4.0% 4.9% 3.9%
Revisions 0.6% 0.2% 2.8% 0.3% -3.2% -0.4% -1.1%
Small Caps 1.7% 0.8% 3.8% -1.1% 0.2% 0.2% -0.3%
Low Risk -3.7% -2.7% -4.9% -3.2% 2.8% -6.8% -5.1%
Source: Allianz Global Investors research, as at 24 March 2014.
Source: Allianz Global Investors, as at January 2014.
Figure 2: Economic similarity index
0.0
0.5
1.0
1.5
2.0
2.5
3.0
3.5
1987
1989
1991
1993
1995
1997
1999
2001
2003
2005
2007
2009
2011
2013
Figure 1: Relative performance of stock selection criteria in 2014

27
Global Strategic Outlook - 2nd Quarter 2014
This chart shows the cumulative average performance of investment styles for 0-36 months after the trough of an economic cycle. Data is from December 1927 until December 2013.
The chart summarizes the relative performance of regional investment styles over a 3-month period as a function of changes in the OECD leading indicator, ranked in tertiles (rates up, rates unchanged, rates down). The analysis was done on a region-by-region basis, and the results then aggregated to a global view. Period 1987-2013.
Global | US | Europe | Asia-Pacific
Source: Allianz Global Investors, as at 31 March 2014.
RevisionsQualityHigh Volatility Small Cap MomentumGrowth Valuation
Figure 3: Relative performance of investment styles vs. MSCI world and OECD leading indicator
0%
2%
4%
6%
8%
-10%
0%
10%
20%
30%
0 2 4 6 8 10 12 14 16 18 20 22 24 26 28 30 32 34 36
OECD leading indicator (RHS)
Source: Allianz Global Investors, as at 31 March 2014.
Figure 4: Relative performance over 3 months of global investment styles as a function of leading indicators
Leading Indicator downLeading Indicator unchangedLeading Indicator Up
-3.0%-2.0%-1.0%0.0%1.0%2.0%3.0%4.0%5.0%
Value P/B Ratio DividendYield
Revisions Momentum Growth Quality Small Cap High Risk
Past performance is not a reliable indicator of future results. If the currency in which the past performance is displayed differs from the currency of the country in which the investor resides then the investor should be aware that due to the exchange rate fluctuations the performance shown may be higher or lower if converted into the investor’s local currency.

28
Global Strategic Outlook - 2nd Quarter 2014
Ingo MainertChief Investment Officer Balanced Europe
Signs of a broadening and re-synchronisation of the global economic recovery are still in place. In the first quarter of 2014, economic data was partially weaker due to unusually cold weather in some regions. Overall, economic data coming from industrialized countries has remained encouraging, underpinned by robust sentiment and optimistic leading indicators. In contrast to previous periods, the current recovery is driven by developed countries and not by emerging regions. Our view is that the global economy looks to be the most orderly for many years, comprising a seemingly stable combination of modest growth and low inflation.
While US economic data has been negatively affected by extraordinarily bad weather, latest reports, including business surveys, continue to underline our positive assessment of the US economy. If there are fewer fiscal headwinds this year, growth momentum should continue, supported by the pick-up in employment, well-advanced private sector deleveraging and increasing bank credit. Overall, the outlook for the US economy looks brighter than for other developed markets.
In our view, the US Federal Reserve (Fed) shows a strong commitment to continue tapering asset purchases, although the hurdles for any adjustment appear high. Given the decline in the unemployment rate, which will soon meet the 6.5% threshold, we expect the Fed to change its focus from the unemployment rate to the low level of inflation to justify the continuation of its low interest rate policy into next year. Markets currently fully trust in the “lower for longer” theme set by the Fed. Should labour market supply be tighter than the Fed expects, and should wage inflation start to pick up, driven by positive data surprises, we could see an earlier-than-expected Fed Fund rate hike. (Currently the expectations are for the first increases to occur mid-2015.)
The moderate recovery is also taking hold in the euro zone, with more solid sentiment indicators pointing to a gradual acceleration of economic growth in the first
half of 2014. While Germany remains the major driving force, macro data in several peripheral countries (in particular Spain) has picked up noticeably over recent months. On the other hand, the disinflationary trend continues, driven by more flexible labour markets following structural reforms. Going forward, the recovery will be supported by accelerating global economic activity, coupled with the shift from additional austerity to more growth stimulating measures, as well as by continued accommodative monetary policy (and restrained inflation).
The European Central Bank (ECB) has reiterated its dovish bias via their “vague” forward guidance. However, due to a mild upside surprise in inflation and improving macro data, the ECB did not announce new policy measures and seems set to keep interest rates on hold for a considerable time.
In Japan, economic conditions showed further improvement towards the end of last year with purchasing managers’ indices and exports rising further and industrial production growing strongly. This is consistent with the nation’s expansionary fiscal and monetary policy and the associated depreciation of the yen. We are monitoring the effect of the scheduled increase in the consumption tax in April on current consumption. Looking forward, the Bank of Japan (BoJ) stands ready to increase the extent of its stimulus, but so far it has not suggested that this will be needed to meet its inflation goal. Consumer price inflation picked up markedly over 2013 and is now close to the BoJ’s 2% inflation target. The increase in core inflation appears to mostly reflect the effect of rising prices for imports and rising administered prices. Therefore, we expect that the Japanese bond market will be further supported and that yields will be capped on the upside by the BoJ.
Our view for higher rates at the medium and longer part of the curve in advanced economies, due to improving economic activity and in anticipation of declining monetary stimulus by the Fed, has been challenged by the weather-related softer tone of US
4. Fixed income outlook - global
Global | US | Europe | Asia-Pacific

Global Strategic Outlook - 2nd Quarter 2014
data. Additionally, there are concerns regarding Chinese growth and over the global political environment (Russia/Ukraine). Going forward, we expect the front end of curves to remain largely anchored by central bank policy rates for the time being (more so in Europe than in the US), but to see upside potential for yields in the medium to longer term part of the curves in advanced economies. Overall, we believe that the demand for corporate bonds and peripheral government bonds in Europe will remain strong.
29

30
Global Strategic Outlook - 2nd Quarter 2014 Global | US | Europe | Asia-Pacific
Fixed Income outlook - Europe
Regardless of market events, nothing seems able to stop spreads narrowing between the euro-zone periphery and Germany. Recent doubts over growth in the US and China, questions surrounding monetary policies, and Ukraine-related geopolitical risks have had almost no effect on this underlying trend. As a result, in terms of absolute yields, refinancing rates have not been so low for Italy and Spain since 2005. After such an impressive rally, it is worth asking how much more spreads can narrow.
The systemic component priced into peripheral spreads has receded sharply, and for good reasons. Europe has done what it had to do in terms of fiscal integration, decisively and credibly. The six-pack, the two-pack, and the European Semester mechanism have led to concrete targets in fiscal discipline and the reduction of structural deficits. These official commitments, which are regularly monitored and evaluated, are now providing investors unprecedented visibility on euro-zone countries’ fiscal outlook and debt prospects. The eleventh hour agreement on how the bank resolution fund will operate also sent a strong signal. With their backs against the wall, and despite conflicting points of view on this subject between the European Parliament, the Commission, the European Central Bank (ECB), and member-state governments, Europeans reached a crucial agreement that lays the foundation for the Banking Union. And, finally, a German court decision left the door open to the ECB’s Outright Monetary Transactions (OMT).
The sharp reduction in systemic risk has been decisive in the return of confidence. Market surveys confirm that investors have shifted their exposure considerably to the euro zone, and that ‘non-domestic’ investors are wading in, snapping up the government bonds that peripheral banks had been buying. The approach has also become far more selective than a mere assessment of euro-zone risk. The market has become more discriminating and analysts have homed in on each country’s specific risks. With this in mind, we have classified euro-zone issuers into three broad categories:
• Issuers whose prospects point more towards widening spreads than narrowing, including Austria, the Netherlands and Finland, which we are underweighting in our portfolios;
• Issuers whose yields we expect to be stable versus Germany, such as: France, which has received the benefit of the doubt on its ability to implement the announced reforms, particularly regarding a supply driven policy; Belgium, whose deficit-reduction performances have been remarkable; and Ireland, whose support programme expired at the end of 2013 and whose yields have dropped spectacularly, thus limiting the outlook for returns over the coming months;
• And, finally, issuers that still offer some potential for a medium-term narrowing in yields, including Spain, Italy and Portugal. Unsurprisingly, these are the countries with the greatest execution risk on reforms. While doubts persist in terms of deficit-control, particularly in the cases of Spain and Portugal, recent economic performances are laying the foundation for, ultimately, a structural improvement. Italy’s new political landscape is promising, and the announcements of a new election law and reforms of the labour market and public administrations are helping to truly set a new course.
There are two main types of risks which weigh on this constructive vision: disappointment on euro-zone growth, which would make it harder to achieve demanding deficit-reduction targets, and premature action by central banks in normalizing their monetary policy, as an earlier-than-expected withdrawal of liquidity from the markets would undermine all risky assets, and would probably exert upward pressure on peripheral spreads. We nonetheless expect ECB policy to remain accommodating for some time to come, thus postponing the effects of a shift in monetary policy.
Franck DixmierChief Investment Officer, Fixed Income Europe

31
Global Strategic Outlook - 2nd Quarter 2014 Global | US | Europe | Asia-Pacific
The credit market, meanwhile, has continued along the lines of the second half of 2013. Monetary policies and the macro-economic environment are still generally favourable, although the slowdown in growth in China poses a threat for 2014.
On the fundamental level, with operating margins at best stable, European companies could be tempted to use their cash to fund acquisitions (as we have seen in the telecom/cable sector with Numericable’s takeover of SFR and Vodafone’s takeover of Ono). However, they are unlikely to significantly raise their shareholder return or spend significantly on capital expenditure. On the contrary, in the investment grade segment we have seen many issuers hold onto their cash and take advantage of extremely low refinancing rates to extend their debt maturities. In the high yield segment, issuers are refinancing their bank debt with longer dated and cheaper bond debt. Although these factors are relatively favourable to short-term credit fundamentals, in the longer term, given the weak growth in Europe and elsewhere, under-investment by European companies raises risk as to their future competitiveness.
Regarding European banks, credit fundamentals are being driven by favourable market conditions. Banks in peripheral countries (i.e. Greece, Italy, Spain, Portugal and Ireland) have recovered market access to senior debt, which will allow them to wean themselves from ECB financing by the time LTROs expire in mid-2015. Banks in core countries (i.e. the United Kingdom, France, Switzerland, Germany, the Netherlands, Belgium and Sweden) now have access to more subordinated financing to help them shore up their equity. For example, new hybrid “Additional Tier 1” instruments are expanding rapidly, with more than EUR 10 billion issued in the year to date.
We will, nonetheless, be keeping an eye on changes in bank balance sheet quality over the next few months. Peripheral banks are still operating under the burden of the recession of the past two years, which has meant a constant worsening in asset quality metrics, albeit now at a slower pace, particularly in Italy and Spain. Against this backdrop, second-tier banks in these countries look vulnerable to the asset quality review being conducted jointly by the European Banking Authority and the ECB. The various capital increases announced (but not yet carried out) by Italian banks are good news, although we consider
them, on the whole, to be undersized. Core banks are benefiting from the stabilization in asset quality, and continue to shore up their financial profiles, but still face an uncertain regulatory environment. Moreover, some investment banking driven models are still being subjected to heavy fines that are eating into their profitability.
Regarding credit market momentum, technicals continue to weigh heavily on valuations in this low interest rate environment. Demand for investment grade and high yield corporate bonds continues to outstrip supply on the primary market. This imbalance has led to a narrowing in credit spreads and greater negotiating clout for issuers. For example, on the high yield market, Heidelberger Cement, which is rated BB+, issued a five-year bond with a 2.25% coupon. At the other extreme of the high yield segment, the Greek bank Piraeus, which is rated CCC, issued a three-year bond with a yield to maturity of just 5.125%. The high yield index’s spread has returned to its 2006 level, i.e. very close to its all-time low. The investment grade market looks less expensive in relative terms, due to the banking segment, which is still far from having returned to its narrowest spreads. All in all, momentum is still positive. The risk that is specific to the credit asset class in Europe remains moderate, but investor behaviour and valuation levels recall the exuberance of late 2006.
Our investment strategy aims to rank specific risks, which the market is no longer doing efficiently, while maintaining full exposure to this asset class. Narrower market spreads are allowing us to position ourselves on issuers that we believe are stable, at the expense of a marginal decline in yields.

32
Global Strategic Outlook - 2nd Quarter 2014 Global | US | Europe | Asia-Pacific
Fixed Income outlook - Asia-Pacific
Review and outlook – March 2014The first quarter of 2014 was another volatile one as markets were clouded by economic and political issues across the globe. In January, amid lingering concerns of quantitative easing (QE) tapering and emerging market risks, Asian local bond markets weakened. Meanwhile, in the latter half of the quarter, markets became increasingly concerned over a possible weakening outlook for the global economy, fragilities in China’s financial system, and tensions between the West and Russia over the situation in Ukraine.
Mixed economic data during the quarter can be explained, in part, by unusually cold weather in the US and effects of holidays, such as the Lunar New Year. In fact, purchasing managers’ indices (PMIs) in the euro zone and US are showing signs of strength, with other activity data confirming this trend (see Figure 1 opposite).
Data from China, on the other hand, appears worrying. While some of the weakness can be ascribed to the effects of the Lunar New Year holidays, we remain cautious and continue to monitor data releases closely. The Chinese government has several things on its agenda, including tightening credit, clamping down on shadow banking activity, implementing measures to temper high property prices, and the need to generate 7.5% growth. On top of that, the market saw the first ever onshore domestic default during the quarter, and we believe more defaults are in the pipeline. It will be interesting to observe how the recent default will be resolved, since this will have important implications and set precedents for future defaults. In the latter part of the quarter, the Chinese government widened the trading band of the Chinese renminbi as part of the on-going renminbi internationalization process. This is in line with China’s desire to have a more market-driven currency with greater flexibilities. With several important issues to juggle simultaneously, the ability of the Chinese authorities to manage these issues warrants close observation and means we err on the side of caution in the near term. We are also monitoring closely the situation in Ukraine, as it could
be a long drawn out process of political manoeuvring between the West and Russia. However, we strongly feel that Asian fixed income assets will have minimal spillover effects.
Overall, Asian local currency bond markets returned 1.8% for the year-to-date period ending 19 March 2014. Asian local currency fixed income markets were weak at the beginning of the year, with the HSBC Asian Local Bond Index (ALBI) declining by 1.2% in January. The index subsequently rallied strongly in the latter part of the quarter, more than recovering the losses in January on the back of a flight to quality due to geopolitical risks in Ukraine. The best performing country in the ALBI was Indonesia, which returned an impressive 5.4% in local currency terms, helped by the news of a presidential bid by Jakarta governor Joko Widodo. India was the next best performing country returning 2.2% in local currency terms. Meanwhile, the Philippines was the laggard, but still produced a positive return of 0.6% (see Figure 2 opposite).
Asian currencies were mixed. Once again Indonesia was the best performer as the rupiah returned 7.6%, followed by the Thai baht at 2.0%. The worst performing currency was the Chinese renminbi which depreciated by 2.3% on the back of fears of a slowdown and credit crisis (see Figure 3 overleaf).
In Asian credit markets, despite relatively stable fundamentals, spreads were also under pressure, due to similar macro-driven concerns. Using JACI (the JP Morgan Asian Credit Index) as a reference, the total return for Asian credits on a year-to-date basis as at 19 March 2014 was 2.3%, helped in part by a decline in US Treasury yields. With sentiment turning more cautious, the sovereign sector outperformed the broad corporate sector, while, within the credit universe, BBB-rated credits recorded the strongest results, returning 3.5% (see Figure 4 overleaf).
Issuance remained strong over the period with around USD 31 billion of primary issuance, of which 40% came from China issuers, 19% from Korea, 14% from Indonesia and 12% from Hong Kong. This large amount of new supply was a contributing factor to the spread widening, as investors found it difficult to digest amidst a backdrop of negative news on China.
David TanChief Investment Officer, Fixed Income Asia

33
Global Strategic Outlook - 2nd Quarter 2014
33
Global | US | Europe | Asia-Pacific
OutlookThe tapering of QE has been negative for investor flows. However, it also has brought some sanity to valuation levels. Yields have risen while spreads and currencies have retraced. We expect volatility to persist for the time being, amid negative headline news with regards to China and the Ukraine. We also expect to see more defaults coming out of China. Although this expected trend of rising defaults will weigh on sentiment in the short term, we view this as being a positive development in the long run. It should encourage a better credit culture in the Chinese debt market, with more defined and tested procedures to handle bankruptcies. The Chinese government has also recognized the growth slowdown and is rolling out projects faster. For instance, on 16 March, the State Council recently unveiled the long-awaited urbanization plan which aims for 60% of the country’s more than 1.3 billion people to be living in cities by
2020, up from 52.6% in 2012. China’s top planner, the National Development and Reform Commission, also recently granted approval for five railway construction projects with a total investment at around CNY 142 billion.
Over the past few months, we have seen improvements in the current accounts of both India and Indonesia, following actions taken by their governments and central banks. As a result, both countries have seen their currencies recover from their recent lows.
In the near term, we are cautious on Asian markets because of the concerns over China, as well as the elections looming in the second quarter for both Indonesia and India. While we expect the market to consolidate in the near-term, the second half of the year is likely to be much stronger for Asian fixed income markets in general.
40
45
50
55
60
65
Mar 11 Aug 11 Jan 12 Jun 12 Nov 12 Apr 13 Sep 13 Feb 14
Source: Bloomberg Finance L.P.,Allianz Global Investors, as at 28 February 2014.
Figure 1: Manufacturing Purchasing Managers Indices
US Euro zoneChina
Source: Bloomberg Finance L.P., Allianz Global Investors, as at 19 March 2014.
Figure 2: Asian local bond markets returns (12 months to March 2014)
0.0% 1.0% 2.0% 3.0% 4.0% 5.0% 6.0%Philippines
ChinaMalaysia
KoreaTaiwan
Hong KongSingapore
ThailandIndia
Indonesia
HSBC ALBI Index
Total returns in local currency terms
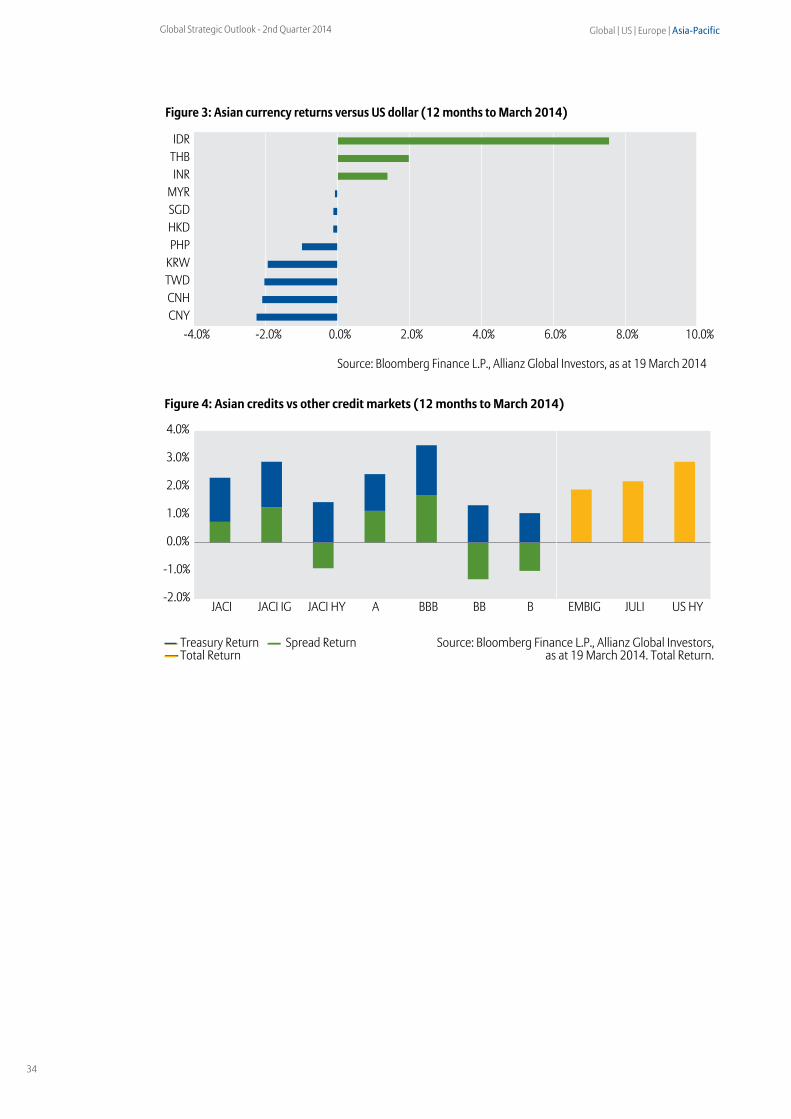
34
Global Strategic Outlook - 2nd Quarter 2014
Source: Bloomberg Finance L.P., Allianz Global Investors, as at 19 March 2014
Figure 3: Asian currency returns versus US dollar (12 months to March 2014)
-4.0% -2.0% 0.0% 2.0% 4.0% 6.0% 8.0% 10.0%CNYCNHTWDKRWPHPHKDSGDMYR
INRTHBIDR
Figure 4: Asian credits vs other credit markets (12 months to March 2014)
Source: Bloomberg Finance L.P., Allianz Global Investors,as at 19 March 2014. Total Return.Total Return
Spread ReturnTreasury Return
-2.0%
-1.0%
0.0%
1.0%
2.0%
3.0%
4.0%
JACI JACI IG JACI HY A BBB BB B EMBIG JULI US HY
Global | US | Europe | Asia-Pacific

35
Global Strategic Outlook - 2nd Quarter 2014
5. Multi asset outlook
Herold RohwederGlobal Chief Investment Officer, Multi Asset
Emerging from a crisis?The first quarter of this year has been marred by increasing uncertainty about the strength of developed market recovery, led by the US, but heavily influenced by geopolitical risk emanating from emerging markets.
Given the significant inventory build experienced by the US in the last quarter of 2013, growth in the first quarter faces some tough headwinds. This has been compounded by particularly unseasonable weather in certain regions of the US during January and February that has distorted economic data releases. While we continue to have faith in the US recovery, its economic surprise index turned down early in 2014, and, although the majority of this weakness can be explained by weather-related effects, not all of it may be entirely attributable to them. For example, household disposable income remains disappointingly weak, and is the key to a consumer-led recovery in the US. In effect, wages are not rising enough, despite the unemployment rate having fallen much further and faster than the Federal Reserve (Fed) expected when it anchored its forward guidance to this measure.
Developed market equities have remained remarkably resilient to the crises in emerging markets this year, most likely due to the low to negative real interest rates and excess liquidity still present in the system. Emerging markets have experienced over three years of underperformance compared to developed markets, but the most recent declines are the result of differing country-level risks. Some, naively, have cited the Fed’s decision to taper asset purchases, which has resulted in outflows from developing economies, as justification for the recent decline in emerging market assets. The reality, however, is more complicated. Yes, equity markets in Indonesia and Turkey have suffered due to foreign investor outflows related to the unwinding of high yield trades, but central banks moved swiftly in the first quarter to stabilize their currencies by raising domestic interest rates, dramatically so in the case of Turkey. In emerging market countries that supply commodities to China,
the transition to a slower trend growth is proving more damaging to them than anticipated, and equity markets in Russia and Colombia have suffered as a result. Furthermore, the whole of emerging Asia has experienced a double blow of reduced trade with China, as growth is slowing and Japan attempts to engender inflation. The latter saw the Bank of Japan (BoJ) as the primary driver of liquidity expansion last year, depreciating the yen dramatically, which then diminished the competitiveness of emerging Asian countries such as Korea. Our view is that the BoJ will await the effect of the April consumer tax hike before it decides whether to provide more monetary stimulus. What is clear from recent rhetoric is that, if their ability to achieve the inflation target is in doubt, they will respond with further stimulus to support Japanese equities. In the medium term, we are more cautious that the supply-side reforms required for Japan to truly emerge from its deflationary debt spiral are being implemented. Ideally, we would welcome increased labour market reform, with greater female participation, increased migration and higher wages, but all of this will take a decade to bring to fruition.
The euro zone has been acutely impacted by the BoJ’s monetary expansion policy, with the European Central Bank (ECB) having relied, to date, on rhetoric to talk down its currency, rather than on genuine balance sheet expansion. Moreover, the implementation of supply-side reforms, resulting in lower wages and increased productivity, has led much of the periphery into deflation, or at the very least disinflation. While some might argue that Europe is headed for a debt-deflation spiral akin to Japan, we would cite the stability of inflation rate expectations, that remain well anchored, and the recovery in the economy, in particular the loosening in credit constraints and the reduced refinancing costs in the periphery. This is most obviously evident from the continuing decline in peripheral sovereign bond yields that have now reverted back to 2007 levels, with both the International Monetary Fund and ECB having reduced their focus on austerity measures.
Global | US | Europe | Asia-Pacific

36
Global Strategic Outlook - 2nd Quarter 2014
Where does this leave emerging markets then? In the very near term there are arguments for at least neutralizing exposure to emerging market equities; positioning and sentiment remains almost excessively negative, while the levels of aggregate external debt in the developing economies are much lower than during previous emerging market crises. In addition, central banks have responded rapidly to stabilize their currencies. However, on a medium-term view, our analysis would indicate that emerging markets may have turned a corner, and the gap between developed and emerging earnings may continue to narrow in the future as relative productivity improvements are harder to come by. Furthermore, there are increasing signs of excess leverage in the private sector, particularly in emerging Asia, and the lack of any meaningful reform agenda, other than in Mexico and possibly India, makes us more cautious.
Asset allocation outlookGlobal equities should remain underpinned by: ongoing accommodative monetary policy; a cyclical recovery led by the US; only a moderate slowdown in China; and a lack of meaningful spill-over from heightened geopolitical risk in emerging markets. However, we recognize there are risks to this outlook, and so have recently reduced our exposure to risky assets, albeit still remaining overweight. We retain a preference for European over US equities on a valuation basis; the latter region now looks expensive on a normalized earnings basis.
Within fixed income assets, we have a meaningful underweight in sovereign government bonds, particularly in the US and UK, where interest rates are expected to increase first. This is offset, to some extent, by an overweight to spread products, where, despite the magnificent rally to date, fundamentals are still, in most cases, justifying the valuation of spreads even at these levels. Furthermore, the level of defaults remains very low. However, at the time of writing, we have taken some profits within US high yield debt, focusing on where valuations are the least attractive.
After a long period of structurally underweighting commodities, we are more optimistic regarding future returns at the time of writing, and have, therefore, moved portfolio allocation to a very moderate overweight position. Price momentum has turned more positive, although, within commodity sub-sectors, price action has been differentiated. This justifies our positioning remaining close to neutral, with just a marginal overweight at the time of writing.
Some soft commodities, such as corn and wheat, may experience lasting supply effects, allowing prices to continue rising, while metal prices are vulnerable to weaker Chinese growth. Precious metals, in contrast, are likely to do better in the near term, with heightened uncertainty and still low real yields.
Previously, we had argued that hedging out risk would be timely due to its cheapness. However, volatility has spiked sharply in the first quarter of 2014, due to rising geo-political risk, which has diminished the valuation argument. Therefore, we are still inclined to be positioned overweight in anticipation of further upward spikes related to political turmoil in the coming months.
Global | US | Europe | Asia-Pacific

37
Global Strategic Outlook - 2nd Quarter 2014
37
6. ESG outlook
David DiamondGlobal Co-Head of ESG
1The Rt. Hon. Clare Short, The Development of the Extractives Industries Transparency Initiative, Journal of World Energy Law and Business, 2014, Vol. 7, No.1
ESG = Environmental, Social and Governance
Engaging with companies and governments for better governance of extractive industries In this publication, we have previously made the case that participating in investor networks and other initiatives is essential to bring about more sustainable government policies, financial markets and also corporate practices.
Indeed, as part of its fiduciary duty, Allianz Global Investors seeks to be a leader in three areas of the investment value chain: 1) contributing upstream to improved market governance; 2) integrating ESG factors in its investment decisions; and 3) playing a role downstream for improved corporate governance and ESG integration by investee companies.
Recent GSO articles have presented Allianz Global Investors’ leadership or support for upstream initiatives, such as an Investor position paper on proposed EU reforms for the Audit Market, and downstream initiatives, such as the Investor position paper on Bangladesh which calls for apparel brands and retailers to reform their sourcing procedures after the fatal factory disasters in that country.
Upstream
Participating in corporate or multi-stakeholder initiatives and investor networks to bring about more sustainable government policies, financial markets and corporate practice.
Investing
ESG criteria considered in order to manage portfolios with financial and/or other objectives.
Downstream
Active share ownership, proxy voting policies and company engagement in order to protect long- term investor interests.
This article will illustrate how the Extractive Industries Transparency Initiative (EITI), a global transparency and governance initiative, plays a key role both upstream and downstream in the investment value chain. By engaging with sovereign governments and companies, this initiative presents a unique opportunity for investors to mitigate risks at both the macro-economic and company specific level, with direct and indirect benefits for both equity and fixed income assets.
The ‘resource curse’: a systemic problem no country or company can resolve aloneIn the late 1990s and early 2000s, the so-called ‘resource curse’, associated with extractive industries, increasingly gained international recognition from economists and academics, such as Jeffrey Sachs, Joseph Stiglitz and Paul Collier. They highlighted that the potential benefits of natural resource wealth were not being realized.1 Many countries which were rich in natural resources tended to underperform economically, and, of the over 3.5 billion people living in countries rich in oil, gas and minerals, the vast majority were seeing few benefits.
With good governance, the exploitation of these resources could generate large revenues to foster economic growth and diversification, while reducing poverty. However, when governance was weak and extractive deals were opaque, the result was often corruption, poverty, and, increasingly, armed conflict.
Faced with this paradox, and in response to a non-governmental organization campaign by Publish What You Pay directed at British Petroleum (BP) in 2001, the company decided to publish its USD 111 million signature bonus paid to the Angolan government. The government backlash was swift and threatened to force BP to forfeit its assets and leave the country. This ultimately led Lord Browne, the company’s then CEO, to conclude, “clearly a unilateral approach, where one company or one country was under pressure to ‘publish what you pay’ was not workable”.1
Global | US | Europe | Asia-Pacific

38
Global Strategic Outlook - 2nd Quarter 2014
In the next two years and initially under the auspices of the UK government, representatives of governments, industry and civil society convened and ultimately launched the Extractive Industries Transparency Initiative (EITI). This initiative aimed to bring together stakeholders, with very different interests, around the same table, in order to seek solutions to this systemic governance problem and agree a common goal of transparency as a means to achieve them.
What is EITI exactly and what has it achieved over the last over ten years?Since 2003, EITI has developed and refined a set of principles, procedures and rules that constitute what is increasingly recognized as the global transparency standard for the extractive industries. In a nutshell and at a macro level, countries decide to commit to a public reconciliation of all material financial payments made by companies, and compare them to the material revenues received by the government. The process is implemented by all stakeholders locally in each country and is supervised by the EITI International Board.
Comprised of representatives from governments, civil society and companies including investors, in 2013, the EITI Board decided to significantly expand the EITI reporting scope. The revised EITI Standard now requires additional disclosures, including licensing information, sales by state-owned companies, sub-national transfers and significant social payments by companies. Other requirements promote the EITI as not simply about transparency, but also about better accountability, the idea being that any citizen should be able to understand the contribution of extractives to their country’s economy.
EITI has expanded significantly to encompass over 40 countries that have signed up and are actively implementing the initiative. 25 of these have been deemed ‘compliant’ by the EITI Board, according the EITI’s previous set of reporting rules, but will have to revalidate their status according to the new Standard in the coming years. In turn, the initiative is supported by the G8 and G20, as well as institutions like the World Bank. Key stakeholders supporting the initiative include over 60 of the largest oil, gas and mining companies, 90 institutional investors and dozens of civil society organizations.
After Norway, which signed up to EITI early on to serve as an example that this initiative was not just for emerging and frontier markets, the US recently
applied and was admitted as a candidate country. Other OECD countries, including Australia, the UK, France and Germany, are closely following suit.
In recent years, as the initiative ramps up, stakeholders now have transparent, public access to reported data on over USD 1 trillion of natural resources revenues and payments. This is already twice the amount reported in 2011, and five times the amount reported in 2009.
EITI is clearly delivering lots of data, but what are the other benefits for investors in particular?
Benefits for investors: a more level playing field and a better investment environmentPolitical, economic and social instability, caused by lack of transparency and poor governance, is a clear risk to securing long-term supply to resources. This is particularly the case for extractive companies, where investments are capital intensive and dependent on long-term stability to generate returns.
Transparency reporting standards required by EITI and complementary regulation-driven reporting in the EU, US and Canada can contribute to a better investment climate. This can reduce instability and enhance the business prospects for companies and, thus, returns for investors.
In poorly governed and opaque markets, companies can be vulnerable to accusations of complicity in corrupt behaviour, impairing their local and global ‘license to operate’. This renders them vulnerable to local conflict and insecurity, and possibly compromises their long-term commercial prospects in those countries.
EITI, and the other regulatory developments, contribute to a level playing field, which means companies will have to think twice about the business risk when dealing with poorly governed regimes. Transparency on payments can result in less corruption in the bidding process, and ultimately better access to these resources.
Moreover, financial markets are beginning to recognize the value of the EITI label. Of the over 40 countries now implementing EITI, Azerbaijan was the first country to be declared EITI Compliant by the EITI Board in 2009. Subsequently, Fitch Ratings announced that they upgraded Azerbaijan’s long-term foreign and local currency Issuer Default Ratings, declaring in its press release that it “draws comfort from the
38
Global | US | Europe | Asia-Pacific

39
Global Strategic Outlook - 2nd Quarter 2014
transparency of the SOFAZ [the State Oil Fund that leads on EITI], underlined by Azerbaijan being the first country to be fully compliant with the international Extractive Industries Transparency Initiative.”
Azerbaijan recently leveraged its minimum investment grade status for the first time on capital markets, when it raised USD 1.2 billion in an international bond debut in March 2014.
As such, a commitment to EITI may contribute to an improvement in a country’s sovereign credit rating over the long term.
Remaining questions for EITI supporting investors Institutional investors have a keen interest in the ongoing and future credibility of the EITI Standard and the global brand it represents. As a stamp of approval, it needs to continue to be backed by robust criteria, rules and procedures governing the attribution of compliance status to countries.
But beyond achieving compliance on transparency, investors are also increasingly keen to see proof of EITI’s actual impacts on the ground. They will want to see evidence that revenue and payments transparency are progressively having knock on, positive effects.
These include:
• At the country level: reduced corruption and mismanagement; strengthened legal, regulatory and tax frameworks; increased foreign direct investment inflows to GDP; and increased country debate on the resource revenue contribution to government budgets and expenditure.
• At the company level: better access to resources; improved license to operate; and reduced exposure to corruption risks.
EITI is increasingly seen not just as a global transparency standard, but also as a contributor to the journey to better accountability and management of resource wealth for the benefit of all stakeholders.
David Diamond, Global Co-Head of ESG at AllianzGI, represents institutional investors on the EITI Board. For more information visit www.eiti.org
1
Global | US | Europe | Asia-Pacific

40
Global Strategic Outlook - 2nd Quarter 2014
2013 2014 (forecast)
AllianzGI Consensus AllianzGI Consensus
USReal GDP % chg SAAR 1.93 1.90 2.50 2.70CPI 1.50 1.50 1.70 1.70Short-Term (official) Rates 0.0-0.25 0.25 0.0-0.25 0.2510 Year Rates 2.80 2.83 3.35 3.35US Dollar Index 81.00 80.85 85.50 84.60UKReal GDP % chg SAAR* 1.90 1.80 2.60 2.70HCPI*** 2.50 2.60 2.30 2.00Short-Term (official) Rates 0.50 0.50 0.50 0.5010 Year Rates 2.80 2.83 3.50 3.41GBP/USD 1.73 1.60 1.63 1.63EurolandReal GDP % chg SAAR* -0.42 -0.40 1.30 1.10CPI** 1.39 1.40 1.10 1.00Short-Term (official) Rates 0.25 0.25 0.25 0.2510 Year Rates (Germany) 1.80 1.83 2.35 2.20EUR/USD 1.37 1.34 1.30 1.31JapanReal GDP % chg SAAR* 1.60 1.70 1.50 1.40CPI** 0.40 0.40 2.30 2.60Short-Term (official) Rates 0.0-0.10 0.10 0.0-0.10 0.1010 Year Rates 0.55 0.67 1.50 0.82JPY/USD 105.00 100.00 110.00 110.00ChinaReal GDP % chg SAAR* 7.70 7.70 7.10 7.40CPI** 2.60 2.60 3.00 2.801 Y Lending Rate 6.00 6.00 6.00 6.0010 Year Rates 4.75 4.58 4.75 4.48USD/CNY 6.08 6.09 6.05 6.00IndiaReal GDP % chg SAAR 4.70 5.00 4.50 4.70CPI 10.90 6.10 9.40 9.50Short-Term (official) Rates 9.00 8.00 9.25 8.0010 Year Rates 9.05 8.74 8.95 8.45INR/USD 58.00 62.50 59.00 62.50CommoditiesGold 1325 1420 1350 1225Oil 95 98 98 98
*Seasonally Adjusted Annual Rate. **Consumer Price Index. ***Harmonized Consumer Price Index. Source: Allianz Global Investors, as at 31 March 2014. Forecasts are not a reliable indicator of future results.
7. Economic forecast summary

41
Global Strategic Outlook - 2nd Quarter 2014
31-Mar-14Qtr-to-date31-Dec-1331-Mar-14
Yr-to-date31-Dec-1331-Mar-14
% Change From Calendar Year 2013
Calendar Year High
Calendar Year Low
Equities USS&P 500 1872.34 1.30% 1.30% -0.30% 7.49% 29.60%NASDAQ 4198.99 0.54% 0.54% -3.65% 5.05% 38.32%MS Value 2027.72 2.34% 2.34% 0.00% 8.73% 28.61%MS Growth 2916.81 0.33% 0.33% -2.41% 6.20% 31.01%S&P 500 VIX 13.88 1.17% 1.17% -35.26% 14.33% -23.86%NASDAQ VIX 18.12 17.36% 17.36% -15.49% 34.02% -24.90%Equities JapanNikkei 225 14827.83 -8.98% -8.98% -8.98% 5.85% 56.72%Equities EuropeDJ Euro Stoxx 50 2916.37 -0.10% -0.10% -2.15% 4.14% 13.26%FTSE 100 6598.37 -2.23% -2.23% -3.90% 2.31% 14.43%Dax 30 9601.58 0.52% 0.52% -1.55% 6.85% 25.48%Cac 40 4391.50 2.22% 2.22% -0.63% 6.91% 17.99%Equities Asia-PacificMSCI Asia Pacific ex-Japan (USD) 1373.26 2.00% 2.00% 0.00% 9.01% 1.46%CurrenciesEUR/USD 1.3788 -0.02% -0.02% -1.10% 2.17% 4.52%USD/YEN 103.2150 -1.99% -1.99% -1.99% 2.20% 21.48%GBP/USD 1.6672 0.66% 0.66% -0.52% 2.31% 1.89%Commoditiesoil brent 107.31 -3.66% -3.66% -3.82% 1.62% 0.93%gold (USD) 1289.28 6.74% 6.74% -6.31% 6.74% -27.34%S&P Goldman Sachs Commodity Index 4971.53 2.94% 2.94% -1.46% 7.48% -1.22%Short-Term RatesFed Funds Target 0.25% 0 bps 0 bps 0 bps 0 bps 0 bps3-Month T-Bill 0.05% -2 bps -2 bps -3 bps 3 bps 2 bps3-Month Euro 0.31% 3 bps 3 bps -1 bps 3 bps 10 bps3-Month Yen 0.21% -1 bps -1 bps -1 bps 0 bps -9 bpsLong-Term Government Bonds2-Year Treasuries 0.39% 3 bps 3 bps -6 bps 9 bps 11 bps5-Year Treasuries 1.71% 1 bps 1 bps -5 bps 27 bps 98 bps10-Year Treasuries 2.73% -28 bps -28 bps -28 bps 14 bps 125 bps10-Year Bund 1.57% -37 bps -37 bps -38 bps 3 bps 63 bps10-Year JGB 0.63% -11 bps -11 bps -11 bps 5 bps -5 bpsUS Corporate BondsBarclays US Aggregate AAA 10+ years 4.04% -16 bps -16 bps -29 bps 0 bps 151 bpsBarclays US Aggregate BAA 10+ years 5.15% -40 bps -40 bps -40 bps 3 bps 92 bpsspread BAA/AAA 1.11% -24 bps -24 bps -11 bps 3 bps -59 bpsBarclays High Yield 6.97% -61 bps -61 bps -65 bps 19 bps -147 bpsEMU Corporate BondsBarclays Euro Aggregate AAA 1.06% -23 bps -23 bps -26 bps 3 bps 41 bpsBarclays Euro Aggregate BAA 1.33% -25 bps -25 bps -27 bps 2 bps 37 bpsspread BAA/AAA 0.27% -2 bps -2 bps -1 bps -1 bps -4 bps
The periodic changes for equity indices are percentage changes, whilst for bond indices the change is given in basis points. A 1% point change is equivalent to 100 basis points. The calendar high and low columns represent the deviation of the index in percentage or basis points terms accordingly, compared to the index level at the end of the period of review. Source: Datastream, as at 31 March 2014. Past performance is not a reliable indicator of future results.
Financial markets review

42
Global Strategic Outlook - 2nd Quarter 2014
Z-Score average
Delta to 3 months
ago
Z-Score relative
P/E
Z-Score relative
P/B
Z-Score relative
P/CF
Z-Score relative
DY
Oil & Gas -0.5 0.0 -0.4 -0.5 -1.3 -0.4
Oil Production -0.6 0.0 -0.7 -0.7 -1.5 -0.5
Oil Services -0.2 0.0 -0.4 0.2 0.0 0.6
Basic Materials -0.2 0.0 0.3 -0.9 0.1 0.4
Chemicals 1.0 0.0 0.4 1.3 1.4 -0.9
Bas Resources -0.6 0.0 0.1 -1.4 -0.4 0.6
Industrials 1.2 0.0 1.1 1.6 1.8 -0.4
Construction & Materials 0.5 0.1 1.0 0.0 0.4 -0.6
Industrial Goods + Services 1.4 -0.1 0.7 2.0 2.6 -0.2
Consumer Goods 0.8 -0.3 0.2 1.8 1.1 0.1
Auto 0.6 -0.3 -0.4 0.9 1.1 -0.7
Food & Beverages 0.6 -0.4 1.0 1.1 0.5 0.3
Personal Household Goods 0.9 -0.3 0.3 2.2 1.0 -0.2
HealthCare 1.0 0.5 2.6 0.5 -0.3 -1.1
Consumer ServIces 0.4 0.0 0.3 1.3 -0.4 -0.6
Retail 0.2 -0.3 0.6 0.5 -0.3 0.0
Media 0.3 0.1 0.0 1.1 -0.7 -0.8
Travel & Leisure 0.5 0.1 -0.1 1.2 0.3 -0.4
Telecoms -0.7 -0.3 -0.5 -0.4 -1.3 0.5
Utilities 0.2 0.2 1.4 -1.0 -0.4 -0.8
Financials -0.6 -0.2 -1.0 -1.1 0.4 0.6
Banks -0.9 -0.2 -1.0 -1.4 -0.7 0.5
Insurance -0.6 -0.3 -0.6 -1.1 0.1 1.0
Technology -0.1 0.2 -0.4 0.6 -0.3 0.3
Software 0.2 0.3 0.1 1.1 0.1 0.5
Hardware -0.7 0.1 -0.8 -0.3 -0.7 1.1Note: The table summarizes AllianzGI’s constant monitoring of relative sector valuations: We compare the current relative valuation with the average historic relative valuation by using z-scores for four widely used valuation measures, namely Price/Earnings (P/E), Price/Book (P/B), Price/Cash flow (P/CF), and dividend yield (DY). The z-score average column describes the average of all four valuation measures. The dividend yield enters the average with inverse sign, as a high dividend yield indicates a low valuation. Source: Datastream, AllianzGI, as at March 2014.
Legend: ◼ Numbers in green indicate z-scores of below -1 (attractive relative valuation) ◼ Numbers in red indicate z-scores of above +1 (expensive relative valuation)
Relative sector valuations

Global Strategic Outlook - 2nd Quarter 2014
Biog
raph
ies
43
8. Global Policy Council
The Global Policy Council (GPC) is a monthly meeting of the regional CIOs, Economics and Strategy team and senior investment professionals, chaired by our Global CIO, Andreas Utermann. The council focuses on the direction of the global economy, regional economic outlooks, prospects for the global bond and equity markets, and periodic thematic pieces of proprietary research.
Andreas E F UtermannGlobal Chief Investment Officer, Allianz Global Investors
Andreas Utermann is Global Chief Investment Officer (CIO) and co-head of Allianz Global Investors. Andreas joined Allianz Global Investors and its Global Executive Committee in 2002 as Global CIO Equities. Between his joining and the end of 2011, Andreas was also Global CIO and Co-Head of RCM. Andreas holds a number of non-Executive positions in the industry, including Board Memberships of the CFA Society of the UK, the AMIC Council of the ICMA as well as being a member of the Advisory Council of the DVFA. Prior to joining, Andreas worked for 12 years at Merrill Lynch Investment Managers (formerly Mercury Asset Management), where he was the Global Head and CIO, Equities. Before joining MLIM, Andreas worked for two years at Deutsche Bank AG. He holds a BSc in Economics from the London School of Economics and an MA in Economics from Katholieke Universiteit Leuven. Andreas is an Associate of the Institute of Investment Management and Research and is fluent in English, German, French and Dutch.
Raymond Chan, CFAChief Investment Officer, Equity Asia-Pacific
Raymond is responsible for all investment professionals in Asia ex-Japan, reporting to the Global CIO in London, and is the Chairman of the Global Balanced Investment Committee and the Regional Portfolio Management Group (RPMG) in Hong Kong. Raymond has overall responsibility for the investment process and performance. He has 22 years of portfolio management experience in the region and is the lead manager for the Core Regional (Asia Pacific ex-Japan equity) products. Prior to joining the Group, Raymond was Associate Director and Head of Greater China team with Barclays Global Investors in Hong Kong, where he specialized in Hong Kong, China and Taiwan stock markets and managed single country and regional portfolios. Raymond’s Hong Kong Fund at Barclays was ranked no. 1 offshore fund in 1997. He is a CFA charterholder and holds an M.A. in Finance and Investment from the University of Exeter and a B.A. (Hons.) in Economics from the University of Durham, UK.

Global Strategic Outlook - 2nd Quarter 2014
44
Neil DwaneChief Investment Officer Equity Europe
Neil is Chief Investment Officer Europe, based in Frankfurt, and is responsible for all portfolio management, research and trading activities in Frankfurt, Paris and London. Neil is a member of the AllianzGI European Executive Committee as well as the Global Investment Management Group and is Chairperson of the European Equity Management Group, which consists of the most senior equity investment team leaders in Europe. Neil joined the company in 2001 as Head of UK and European Equity Management from JP Morgan Investment Management where he had been an UK and European specialist portfolio manager since 1996. He began his investment career in 1988 with Kleinwort Benson Investment Management as an analyst, later as a fund manager before moving to Fleming Investment Management in 1992. Neil holds a BA in Classics from Durham University and is a member of the Institute of Chartered Accountants.
Stefan Hofrichter, CFAHead of Global Economics and Strategy
As Head of Allianz Global Investors Economics & Strategy team since 2011, Stefan’s research covers global economics as well as global and European asset allocation. Stefan joined the firm in 1996 as an equity portfolio manager and assumed his current role as an economist and strategist in 1998. Between 2004 and 2010, he also had responsibility for various retail and institutional mandates, including global and European traditional balanced funds, global multi-asset absolute return and multi-manager alpha-porting funds. Stefan became a member of the firm’s Global Policy Council in 2004 and is a member of the Pan-European Tactical Multi Asset Investment Committee, established in 2013. Stefan also chaired the German Asset Allocation Committee between 2010 and 2012. Stefan holds a Diplom degree in Economics from the University of Konstanz (1995) and in Business Administration from the University of Applied Sciences of the Deutsche Bundesbank, Hachenburg (1991). Stefan became a CFA Charterholder in 2000.
Ingo MainertChief Investment Officer Balanced Europe
Ingo joined from cominvest in February 2009, following Commerzbank’s purchase of Dresdner Bank. Ingo is a Managing Director and CIO Balanced Europe. Ingo takes this role having headed Asset Management of cominvest since June 2006. Ingo started his professional career with Commerzbank in 1988 and first held analyst and currency specialist functions following his traineeship, before taking management responsibility in Commerzbank as Team Head Equity Strategy Germany in 1994 and Head of Fixed Income Research in 1998 before moving to the Asset Management side of the business as Head of Global Markets Research Division in 2001 at Commerz Asset Managers. Since 2002 he held a position as Head of Balanced Portfolio Management Division at cominvest, was then named Head of Asset Management Private Banking at Commerzbank in August 2004 and was finally appointed Managing Director and CIO of Cominvest. Ingo is a Certified Investment Analyst and a board member of the DVFA Society of Investment Professionals in Germany; he graduated from the Johann Wolfgang Goethe-University with a Diploma in Business Administration.
Franck DixmierChief Investment Officer, Fixed Income Europe
Franck Dixmier, CIO Fixed Income Europe, joined the Allianz Group in 1995 as Fixed Income Portfolio Manager. In 1998 he became the Head of Fixed Income for AGF Asset Management (the former name of AllianzGI in France). In this role he was also responsible for the AGF insurance portfolios. In 2008, Franck became a Member of the Executive Committee, and Chief Investment Officer of Allianz Global Investors France. He was appointed Deputy CEO of AllianzGI France and CIO of AllianzGI Investments Europe in 2010. Franck Dixmier graduated with a Master’s Degree in Economics and Finance from the Paris Dauphine University (Master’s degree - DEA conjoncture économique et prospective).

45
Global Strategic Outlook - 2nd Quarter 2014
45
David TanChief Investment Officer, Fixed Income Asia
David Tan joined Allianz Global Investors in 2012. He is the Chief Investment Officer, Fixed Income Asia Pacific. David has extensive experience in the management of Asian bonds as well as platform and business development. His experience in managing Asian bonds dates back to 1993. He joined Allianz Global Investors from AXA Investment Managers UK, where his last position was Executive Director Fixed Income Asia Pacific and Middle East with responsibility for business development. From end of 2008 to early 2011 David was Chief Investment Officer of Kyobo AXA Investment Managers in Korea. Prior to that, David was based in Singapore as Head of Fixed Income Asia, with responsibility for all the bond portfolio management activities in the region. David has a Bachelor of Business Administration (Finance) with joint majors in Economics from Simon Fraser University, Canada.
Klaus TeloekenChief Investment Officer Systematic Equity
Dr. Klaus Teloeken is the Co-CIO of the Systematic Equity team. He joined Allianz Global Investors in 1996 as a quantitative analyst, and in 2001 he assumed the role as Head of Systematic Equity. He oversees more than EUR17 billion of assets under management, and is responsible for the development and the management of systematic investment strategies for equities. In this role, Klaus has developed the team’s Best Styles and High Dividend product line. He is also responsible for the management of the Best Styles Global and High Dividend Global product. Klaus studied mathematics and computer science in Dortmund, Germany.
Contributors – non GPC members
David DiamondGlobal Co-Head of ESG
David joined Allianz Global Investors in 2008 in charge of all ESG related commitments for AllianzGI France, including Head of ESG Research. In October 2012 he was promoted Global Co-head of ESG. In that capacity he is responsible for all governance related activities, including engagement and proxy voting. He currently represents investors, including Allianz Global Investors, on the boards of the Extractive Industries Transparency Initiative (EITI) and the French Social Investment Forum (FIR). He has also participated in several Global Reporting Initiative (GRI) working groups. Prior to AllianzGI, David had joined Crédit Lyonnais Asset Management as an SRI analyst in 2001 after several postings at Paribas Asset Management (Marketing Dept) and then BNP Paribas Asset Management (European equities financial analyst and advisor to the UN Pension Fund) from 1996 through 2001. He was Senior Sustainability Analyst and Head of Shareholder Engagement at Amundi from 2003-08. He graduated with a B.A. in Art History from Williams College (Massachusetts, USA) in 1990. David also has a Master’s degree in Management from ESCP-Europe (Paris-Oxford-Berlin) in 1996.
Dr. Herold RohwederGlobal Chief Investment Officer Multi Asset
Herold Rohweder is a Managing Director and Global Chief Investment Officer Multi Asset at Allianz Global Investors. He is also a member of the US Executive Committee of Allianz Global Investors and member of the Global Investment Management Group. Herold joined Allianz in 1989 as a portfolio manager for global balanced, European equities and European fixed income. In 1998 Herold initiated the Systematic Asset Management effort for equity and multi asset investments at Allianz Asset Management. Since 2011 Herold has been Global CIO Multi Asset at Allianz Global Investors. Herold graduated from Wayne State University, Detroit with a Master-of-Arts degree in Economics and has received a Ph.D. from the Economics department of the University of Kiel, Germany.

Global Strategic Outlook - 2nd Quarter 2014
46
Robert Parenteau, CFAEconomist and Investment Strategist, External Advisor
As the sole proprietor of MacroStrategy Edge, Rob employs macroeconomic insights to contribute to asset allocation and equity sector selection decisions. Rob received his BA (Hons.) in political economy from Williams College in January 1983 and earned his CFA in 1989. Rob also serves as a research associate of the Levy Economics Institute.

47
Global Strategic Outlook - 2nd Quarter 2014
Disclaimer
Investing involves risk. The value of an investment and the income from it will fluctuate and investors may not get back the principal invested. Past performance is not indicative of future performance. Investments in commodities may be affected by overall market movements, changes in interest rates, and other factors such as weather, disease, embargoes and international economic and political developments. Investments in smaller companies may be more volatile and less liquid than investments in larger companies. Investments in emerging markets may be more volatile than investments in more developed markets. Dividends are not guaranteed. Bonds are subject to interest rate risk and the credit risk of the issuer. High-yield or “junk” bonds have lower credit ratings and involve a greater risk to principal. Convertible securities involve the added risk that securities must be converted before it is optimal. This is a marketing communication. It is for informational purposes only. This document does not constitute investment advice or a recommendation to buy, sell or hold any security and shall not be deemed an offer to sell or a solicitation of an offer to buy any security. Forecasts are inherently limited and should not be relied upon as an indicator of future results.
The views and opinions expressed herein, which are subject to change without notice, are those of the issuer or its affiliated companies at the time of publication. Certain data used are derived from various sources believed to be reliable, but the accuracy or completeness of the data is not guaranteed and no liability is assumed for any direct or consequential losses arising from their use. The duplication, publication, extraction or transmission of the contents, irrespective of the form, is not permitted.
This material has not been reviewed by any regulatory authorities. In mainland China, it is used only as supporting material to the offshore investment products offered by commercial banks under the Qualified Domestic Institutional Investors scheme pursuant to applicable rules and regulations.
This document is being distributed by the following Allianz Global Investors companies: Allianz Global Investors U.S. LLC, an investment adviser registered with the U.S. Securities and Exchange Commission (SEC); Allianz Global Investors Europe GmbH, an investment company in Germany, authorized by the German Bundesanstalt für Finanzdienstleistungsaufsicht (BaFin); Allianz Global Investors Hong Kong Ltd. and RCM Asia Pacific Ltd., licensed by the Hong Kong Securities and Futures Commission; Allianz Global Investors Singapore Ltd., regulated by the Monetary Authority of Singapore [Company Registration No. 199907169Z]; and Allianz Global Investors Japan Co., Ltd., registered in Japan as a Financial Instruments Business Operator; Allianz Global Investors Korea Ltd., licensed by the Korea Financial Services Commission; and Allianz Global Investors Taiwan Ltd., licensed by Financial Supervisory Commission in Taiwan. Unless stated otherwise, all data is as of 31 March 2014.
Copyright © 2014 Allianz Global Investors

Allianz Global Investors Europe GmbHBockenheimer Landstrasse 42-44D-60323 Frankfurt am MainGermany
Phone +49 69 263 140Fax +49 69 263 [email protected] www.allianzglobalinvestors.com 14
-136
5 | M
arch
201
4