global reinsurance highlights 2019...global reinsurance highlights 2019 3 global reinsurance...
TRANSCRIPT
PUBLISHED BY:
Global Reinsurance Highlights 2019


3Global Reinsurance Highlights | 2019
Global Reinsurance Highlights 2019 Edition
For further information, please visit our reinsurance page on our website www.spratings.com

November 5-6, 2019 The Hamilton Princess Hotel, Bermuda
Register now: spglobal.com/bermuda
Enabling stability in shifting currents
spglobal.com/bermuda
S&P Global Ratings’ Annual Bermuda Reinsurance Conference
Hot topic panels and key insights from leading industry experts will cover:
– Economic conditions and geopolitical risks
– Structural changes in the sector
– Reinsurance pricing adequacy heading into 2020
– The future state of ILS and alternative capital
– Evolution of the reinsurance value chain
– Climate change and catastrophe risk
– Cyber threats and opportunities
Don’t miss this year’s leading reinsurance industry event, offering essential market insights, top industry trends and valuable networking opportunities!

5Global Reinsurance Highlights | 2019
Contributors
Project LeadersJohannes BenderTaoufik GharibDavid Masters
ContributorsManuel Adam, FrankfurtJohannes Bender, FrankfurtCharles-Marie Delpuech, LondonTracy Dolin, New YorkMathieu Farnarier, LondonTaoufik Gharib, New YorkRobert Greensted, LondonJean Paul Huby Klein, FrankfurtMaren Josefs, LondonMilan Kakkad, MumbaiAli Karakuyu, LondonSaurabh Khasnis, CentennialHardeep Manku, TorontoDavid Masters, LondonLauren Slade, New YorkBrian Suozzo, New YorkSimon Virmaux, Paris
Data TeamSamantha Byrne, LondonAntun Zvonar, New York
Editorial Project CoordinatorFleur Hollis, London
Editorial TeamHeather Bayly, LondonRose Burke, ParisElizabeth Kusta, ChicagoJo Parker, TorontoAlexandria Vaughan, London
Publisher Graeme Cathie Tel: +44 (0) 203 301 8238 [email protected]
EditorWyn Jenkins Tel: +44 (0)203 301 [email protected]
Sub editorRos Bromwich
DirectorNicholas Lipinski
Design and ProductionGarrett FallonRussell Cox
Cover imageShutterstock / vertre
For S&P Global Ratings For Intelligent Insurer
The views expressed in this publication are not necessarily those shared by the publisher, Newton Media Limited. Although Newton Media has made every effort to ensure the accuracy of this publication, no responsibility or liability is accepted by Newton Media for any loss to any person, legal or physical, as a result of any statement, fact or figure contained in this publication. This publication is not a substitute for advice on a specific transaction.
The publication of advertisements does not represent endorsement by Newton Media or S&P Global Ratings.
Newton Media Limited. Kingfisher House, 21-23 Elmfield Road, Bromley, BR1 1LT, United Kingdom
Published in part by S&P Global Ratings, a part of S&P Global.
Executive offices: 55 Water Street, New York, NY 10041.
Editorial offices: 55 Water Street, New York, NY 10041.
Copyright 2019 by Standard & Poor’s Financial Services LLC.
Reproduction in whole or in part prohibited except by permission. All rights reserved.
All advertising content has been sourced and placed by Newton Media. S&P Global Ratings receives no fee for the content of this publication.
No content (including ratings, credit-related analyses and data, valuations, model, software or other application or output therefrom) or any part thereof (Content) may be modified, reverse engineered, reproduced or distributed in any form by any means, or stored in a database or retrieval system, without the prior written permission of Standard & Poor’s Financial Services LLC or its affiliates (collectively, S&P). The Content shall not be used for any unlawful or unauthorized purposes. S&P and any third-party providers, as well as their directors, officers, shareholders, employees or agents (collectively S&P Parties) do not guarantee the accuracy, completeness, timeliness or availability of the Content. S&P Parties are not responsible for any errors or omissions (negligent or otherwise), regardless of the cause, for the results obtained from the use of the Content, or for the security or maintenance of any data input by the user. The Content is provided on an “as is” basis.
S&P PARTIES DISCLAIM ANY AND ALL EXPRESS OR IMPLIED WARRANTIES, INCLUDING, BUT NOT LIMITED TO, ANY WARRANTIES OF MERCHANTABILITY OR FITNESS FOR A PARTICULAR PURPOSE OR USE, FREEDOM FROM BUGS, SOFTWARE ERRORS OR DEFECTS, THAT THE CONTENT’S FUNCTIONING WILL BE UNINTERRUPTED OR THAT THE CONTENT WILL OPERATE WITH ANY SOFTWARE OR HARDWARE CONFIGURATION. In no event shall S&P Parties be liable to any party for any direct, indirect, incidental, exemplary, compensatory, punitive, special or consequential damages, costs, expenses, legal fees, or losses (including, without limitation, lost income or lost profits and opportunity
costs or losses caused by negligence) in connection with any use of the Content even if advised of the possibility of such damages.
Credit-related and other analyses, including ratings, and statements in the Content are statements of opinion as of the date they are expressed and not statements of fact. S&P’s opinions, analyses and rating acknowledgment decisions (described below) are not recommendations to purchase, hold, or sell any securities or to make any investment decisions, and do not address the suitability of any security.
S&P assumes no obligation to update the Content following publication in any form or format. The Content should not be relied on and is not a substitute for the skill, judgment and experience of the user, its management, employees, advisors and/or clients when making investment and other business decisions. S&P does not act as a fiduciary or an investment advisor except where registered as such.
While S&P has obtained information from sources it believes to be reliable, S&P does not perform an audit and undertakes no duty of due diligence or independent verification of any information it receives.
To the extent that regulatory authorities allow a rating agency to acknowledge in one jurisdiction a rating issued in another jurisdiction for certain regulatory purposes, S&P reserves the right to assign, withdraw or suspend such acknowledgement at any time and in its sole discretion. S&P Parties disclaim any duty whatsoever arising out of the assignment, withdrawal or suspension of an acknowledgment as well as any liability for any damage alleged to have been suffered on account thereof.
S&P keeps certain activities of its business units separate from each other in order to preserve the independence and objectivity of their respective activities. As a result, certain business units of S&P may have information that is not available to other S&P business units. S&P has established policies and procedures to maintain the confidentiality of certain non-public information received in connection with each analytical process.
S&P may receive compensation for its ratings and certain analyses, normally from issuers or underwriters of securities or from obligors. S&P reserves the right to disseminate its opinions and analyses. S&P’s public ratings and analyses are made available on its Web sites, www.standardandpoors.com (free of charge), and www.ratingsdirect.com and www.globalcreditportal.com (subscription), and may be distributed through other means, including via S&P publications and third-party redistributors. Additional information about our ratings fees is available at www.standardandpoors.com/usratingsfees.
S&P GLOBAL, S&P GLOBAL RATINGS, STANDARD & POOR’S, S&P and RATINGSDIRECT are registered trademarks of Standard & Poor’s Financial Services LLC.

6 Global Reinsurance Highlights | 2019
Contents
8 Soundbites
10 Reinsurance Outlook Secular Headwinds Continue Despite Positive Pricing Momentum
18 Catastrophe Risk Global Reinsurers Aim To Rebalance Their Natural Catastrophe Exposure
24 California WildfiresJolted By California Wildfires, Re/Insurers Recalibrate Their Risk Appetite
28 Cyber RiskGlobal Reinsurers Face The Iceberg Threat Of Cyber Risk
32 ILS Convergence Capital Will Remain Key For Reinsurers Despite Recent Losses
38 Adverse Development Covers Re/Insurers Seek Structured Solutions For Their Legacy Business
44 Reinsurance M&A More Consolidation To Come For Global Reinsurers
51 Global Reinsurance Peer Review
58 Top 40 By Company
60 Global Reinsurers By Country
72 Ratings Definitions
74 Addresses
7Global Reinsurance Highlights | 2019
Foreword
Reinsurance Secular Headwinds Continue Despite Positive Pricing MomentumBy Johannes Bender, Taoufik Gharib, and David Masters
T he renewal discussions for 2020 in Monte Carlo this year are happening after back-to-back record catastrophe years in 2018 and 2017, which hit traditional reinsurers
and alternative capital. Property casualty reinsurance prices have been hardening during the 2019 renewals, giving them some positive momentum heading into 2020. The fundamental secular competitive trends have not changed, however.
In our lead article, 2020 Reinsurance Sector Outlook: Secular Headwinds Continue Despite Positive Pricing Momentum, we discuss why we continue to have a stable outlook for the global reinsurance sector. The article also discusses the main challenges and opportunities for the sector, the main competitive dynamics with regard to alternative capital, pricing, and mergers and acquisitions, as well as our earnings forecast for the sector versus its cost of capital.
In Global Reinsurers Aim To Rebalance Their Natural Catastrophe Exposure, we take a closer look at global reinsurers’ exposure to 2018 and 2017 natural catastrophe losses. We also examine how reinsurers’ appetite for tail risk has changed following rate increases, and how the sector is equipped for future natural catastrophe losses.
The California wildfires of 2017-2018 surprised re/insurers by generating insured losses of about $33 billion, beyond the market’s understanding of the risk. In Jolted By California Wildfires, Re/Insurers Recalibrate Their Risk Appetite, we discuss how re/insurers were hit and how the market may react in terms of pricing and risk assessment for California wildfires.
Economic and insured cyber losses are mounting for insurers and reinsurers. In Global Reinsurers Face The Iceberg Threat Of Cyber Risk, we have a look at the cyber insurance market and at the main challenges and opportunities re/insurers are facing to leverage that fast growing risk.
The article Convergence Capital Will Remain Key For Reinsurers Despite Recent Losses discusses how investors in insurance-linked securities reacted to negative returns over the past two and a half years, as well as how convergence capital will affect competitive dynamics in the global reinsurance sector.
In Re/insurers Seek Structured Solutions For Their Legacy Business, we explain how re/insurers are using structured solutions such as loss portfolio transfers and adverse development covers to optimize their portfolios and achieve better risk-adjusted returns.
Reinsurers’ merger and acquisition activity remains a hot topic, particularly because some players are posting
subpar shareholder returns due to cost inefficiency, margin pressure, and still-excess capacity. In More Consolidation To Come For Global Reinsurers, we outline the main drivers for further consolidation among reinsurance, the insurance, and insurance-linked security markets, and the potential credit impact of further consolidation.
Global Reinsurance Highlights 2019 again includes a peer comparison supplement that exhibits some of the important data points and trends that we’ve identified from our analysis of the sector. This year’s publication captures the key issues facing reinsurance management, investors, and other stakeholders. We hope that you will enjoy the 2019 edition and welcome your feedback on possible enhancements for future years. n
Johannes BenderFrankfurt, (49) 69-33-999-196 [email protected]
Taoufik GharibNew York, (1) [email protected]
David MastersLondon, (44) [email protected]

8 Global Reinsurance Highlights | 2019
Soundbites
Reinsurance Outlook Taoufik Gharib, Johannes Bender, Hardeep Manku, David Masters, Ali Karakuyu
• Robust capitalization, sophisticated enterprise risk management practices, and still-rational underwriting continue to underpin our stable outlook on the global reinsurance sector.
• The sector continues to battle secular headwinds, as the influx of alternative capital challenges reinsurers’ business models, despite its recent slowdown, and we expect its growth to pick up once the latest bumps are smoothed over.
• Property and casualty reinsurance prices have been hardening during the 2019 renewals in reaction to record back-to-back catastrophe years in 2017-2018 and the resulting loss creep, with positive momentum heading into 2020.
• We’ve revised our 2019-2020 earnings forecast slightly upward following hardening reinsurance prices, with an expected combined ratio of 95%-98% and a return on equity of 7%-9%.
• The reinsurance sector didn’t earn its cost of capital in 2017 and 2018, but 2019 looks somewhat more promising.
Catastrophe RiskCharles-Marie Delpuech, Johannes Bender
• Global reinsurance has remained resilient, despite insured losses from natural catastrophes reaching a record back-to-back high over the past two years.
• Some reinsurers have chosen to stop retrenching; instead, they are taking advantage of higher premium rates by increasing their exposure to catastrophe risk.
• Although we expect risk discipline to prevail, global reinsurers’ greater exposure to catastrophe risk could heighten their earnings and capital volatility.
California WildfiresHardeep Manku, Taoufik Gharib, Saurabh Khasnis, Brian Suozzo
• The California wildfires of 2017-2018, with insured losses of about $33 billion, surprised re/insurers as the losses were outside of the market understanding of the risk, and they affected both property and casualty business lines.
• These wildfires, in conjunction with other catastrophe losses, had limited impact on the creditworthiness of re/insurers.
• There is no consensus among re/insurers on the price adequacy despite significant rate increases, or comfort with the risk in spite of substantial updates to wildfire risk models.
• The reinsurance pricing for California wildfires could be up 30%-70% heading into the 2020 renewals; capacity will continue to be constrained as this market remains in disarray, which will fuel further rate increases.
Cyber RiskJohannes Bender, Manuel Adam, Robert Greensted, Jean Paul Huby Klein, Milan Kakkad, Tracy Dolin
• Economic and insured cyber losses are mounting, and we believe considerable nonaffirmative “silent cyber” exposure is embedded in traditional re/insurance products.
• If re/insurers do not start to screen their insurance portfolios for nonaffirmative cyber exposures or manage them, losses could become significant and create volatility in capital and earnings in the near future.
• Underwriting cyber risks aren’t straightforward because of the potential for large accumulation risk, their human origin, uncertainties about diversification benefits, limited historical data, and still basic modelling and IT expertise.
• We believe the global affirmative cyberinsurance market will continue to expand faster than the vast majority of other traditional lines and could reach $8 billion in gross written premium by 2022, compared with about $5 billion in 2018.
• Reinsurers are well placed to harness this business potential, in our view, if they can develop cyber ecosystems and improve cyber modeling, while managing accumulation risk and silent cyber exposure.

9Global Reinsurance Highlights | 2019
ILSMaren Josefs, David Masters, Ali Karakuyu
• The amount of convergence capital being provided to reinsurers globally has fallen for the first time in 10 years, reflecting two and a half years of negative returns and trapped collateral from large natural catastrophes.
• Despite these challenges, we believe capital will continue to flow into the market, particularly to insurance-linked security funds with strong underwriting, established track records of successful capital deployment and transparent reporting.
• In our view, convergence capital will continue to play an important role in the competitive dynamics of the global reinsurance market and bolster capacity.
• We also believe traditional reinsurers will continue to factor third-party capital into their strategies to help them respond to the ongoing challenging competitive environment.
Adverse Development CoversSaurabh B Khasnis, Taoufik Gharib, Hardeep Manku, David Masters
• Competitive market conditions have forced global property and casualty re/insurers to rethink their strategies and redeploy their capital toward optimal risk/reward opportunities.
• As a result, re/insurers have shown growing interest in structured solutions, such as loss portfolio transfers and adverse development covers , for their legacy liabilities.
• If well executed, these structured solutions can benefit cedants and reinsurers. Cedants can lower earnings and capital volatility while reducing capital requirements. Reinsurers can enhance their business profiles and earnings by leveraging their underwriting and claims expertise while strengthening their client relationships.
• However, these solutions do not provide a complete legal finality, and the cedants retain the ultimate risk of policyholder claims. New Insurance Business Transfer laws in the U.S. could bridge this gap, but the laws are still in nascent stages and not yet applied consistently across states.
Reinsurance M&AAli Karakuyu, Johannes Bender, David Masters, Taoufik Gharib, Hardeep Manku
• Challenging market conditions in the global reinsurance sector and cheap financing sources will continue to drive consolidation.
• Merger and acquisition activity over the past two years demonstrates the convergence of primary insurance, reinsurance, and insurance-linked securities markets, and the desire to diversify internationally.
• The reinsurance sector’s M&A track record is patchy from a credit perspective, and deals are typically credit-neutral at best for the acquirer on completion.
Soundbites
ILSMaren Josefs, David Masters, Ali Karakuyu
Adverse Development CoversTaoufik Gharib, Saurabh Khasnis, Hardeep Manku, David Masters
M&AAli Karakuyu, Johannes Bender, David Masters, Taoufik Gharib, Hardeep Manku

10 Global Reinsurance Highlights | 2019
2020 Reinsurance Sector Outlook
Secular Headwinds Continue Despite Positive Pricing Momentum By Taoufik Gharib, Johannes Bender, Hardeep Manku, David Masters, and Ali Karakuyu
Reinsurers are battling the commoditization of their business and the rise of alternative capital nibbling at their margins. In response, they could take a page from the playbook of other disrupted industries to stay relevant and become more innovative.
Shu
tter
stoc
k /
vetr
e

11Global Reinsurance Highlights | 2019
2020 Reinsurance Sector Outlook
also capitalize on increasingly frequent opportunities (see Chart 3). During the past couple of years, the rise of populism in politics in the U.S. and Europe, the trade war between the U.S. and China, and increased tensions in the Middle East with the U.S. re-imposing sanctions on Iran, have heightened geopolitical instability, as has the U.K.’s ongoing Brexit negotiation with the European Union.
So far, the reinsurance market has been somewhat insulated, but a potential recession in the U.S. within the next 12 months (S&P Global Ratings’ U.S. Chief Economist estimates recession risk at 30%-35%) and these increasing geopolitical risks could dampen global GDP growth prospects and could ultimately curb reinsurers’ top line growth.
Are reinsurers complacent in their centuries-old industry and stuck in their old ways of doing business?
Do reinsurance prices react only to natural catastrophe insured losses and adverse reserve developments? Are reinsurers sitting on their hands awaiting external forces of change or are they self-critical enough to initiate change from within? These are some of the seminal questions that reinsurers need to tackle in the years to come.
S&P Global Ratings has kept its stable outlook on the global reinsurance sector and on the majority of the reinsurers it rates (see Charts 1 and 2). This assessment is mostly based on reinsurers’ still-robust capital adequacy and relatively disciplined underwriting, at least so far, supported by well-developed enterprise risk management (ERM), and an overall improving reinsurance pricing environment. On the other hand, the fundamental secular competitive trends haven’t abated, even after back-to-back record catastrophe years in 2017 and 2018.
Furthermore, the reinsurance industry’s cost of capital (COC) has been declining since the 2008 financial crisis, and reached a floor at year-end 2016, increasing in 2017 and 2018 due to rising interest rates and the volatility stemming from heavy catastrophe losses. However, this rising trend has reversed course in 2019 because of central banks’ interest rate cuts and their prospective dovish monetary easing stance.
In addition, reinsurance pricing has been hardening through the 2019 renewals, and reinsurers’ optimism for the upcoming renewals in 2020 should help the sector broadly earn its COC in 2019 and 2020, assuming average catastrophe years. This expected improvement in the sector’s return on capital (ROC) relative to its COC is one of the key factors behind our decision to maintain our stable outlook on the global reinsurance sector, despite the disappointing recent track record.
Reinsurers Face Ups And Downs, Both Old And NewIn its current state, the global reinsurance industry battles many threats, but could
0
2
4
6
8
10
12
14
16
A- A A+ AA- AA AA+
(No.
)
Chart 1: Top 40 Global Reinsurers Rating Distribution*
*Financial strength rating on core operating subsidiaries as of Aug. 6, 2019.Copyright © 2019 by Standard & Poor's Financial Services LLC. All rights reserved.
Negative(2%)
Stable(88%)
Positive(10%)
Chart 2: Top 40 Global Reinsurers Outlook Distribution*
*As of Aug. 6, 2019.
Copyright © 2019 by Standard & Poor's Financial Services LLC. All rights reserved.
(20)
(10)
0
10
20
30
40
50
60
70
80
AAA AA A BBB
(%)
Chart 4: Capital Adequacy Of The Top 20 Global Reinsurers ByConfidence Level (2014-2018)
Copyright © 2019 by Standard & Poor's Financial Services LLC. All rights reserved.
0
2
4
6
8
10
12
14
16
18
20052006
20072008
20092010
20112012
20132014
20152016
20172018
2019 Q1
2019F
2020F
(%)
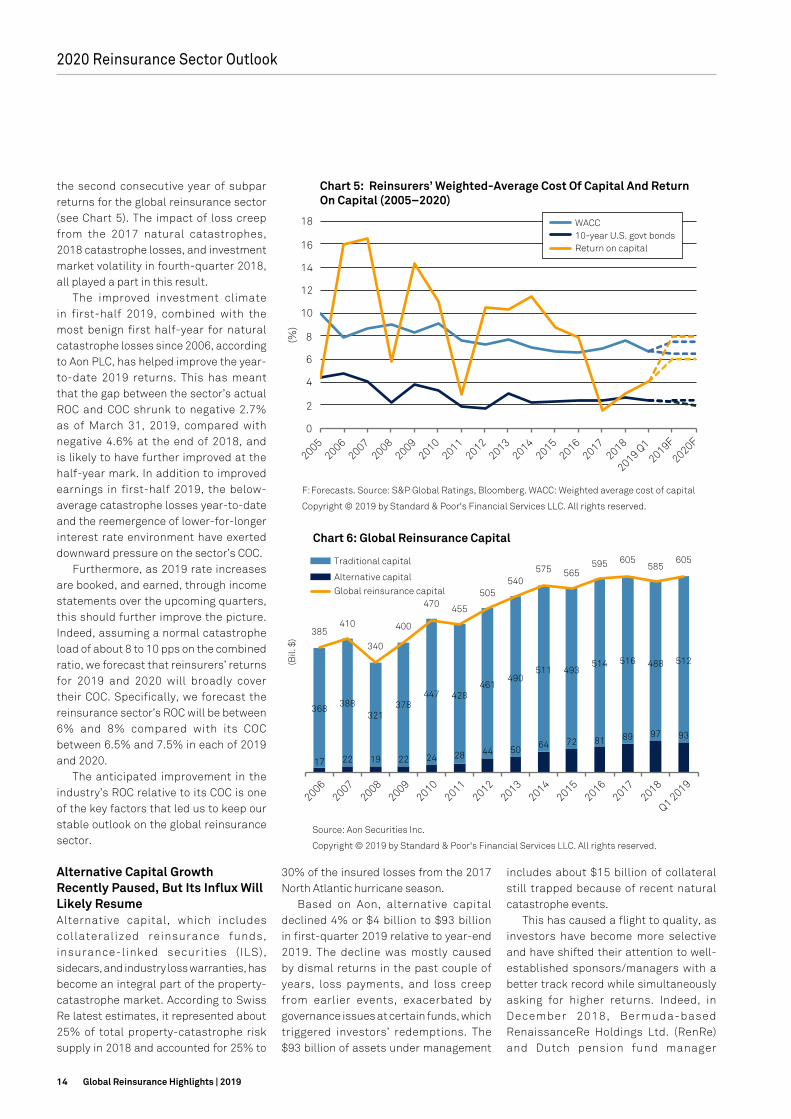
Chart 5: Reinsurers’ Weighted-Average Cost Of Capital And Return On Capital (2005–2020)
F:Forecasts. Source: S&P Global Ratings, Bloomberg. WACC: Weighted average cost of capital
Copyright © 2019 by Standard & Poor's Financial Services LLC. All rights reserved.
17 22 19 22 24 28 44 50 64 72 81 89 97 93
368 388321
378447 428
461490
511 493514 516 488 512
385410
340
400
470 455
505540
575 565595 605
585605
20062007
20082009
20102011
20122013
20142015
20162017
2018
Q1 2019
(Bil.
$)
Traditional capital
Alternative capital
Global reinsurance capital
Chart 6: Global Reinsurance Capital
Source: Aon Securities Inc.
Copyright © 2019 by Standard & Poor's Financial Services LLC. All rights reserved.
5.7
11.210.3
13.6
9.0
10.0 10.0
0
2
4
6
8
10
12
14
16
2014 2015 2016 2017 2018 2019F 2020F
(%)
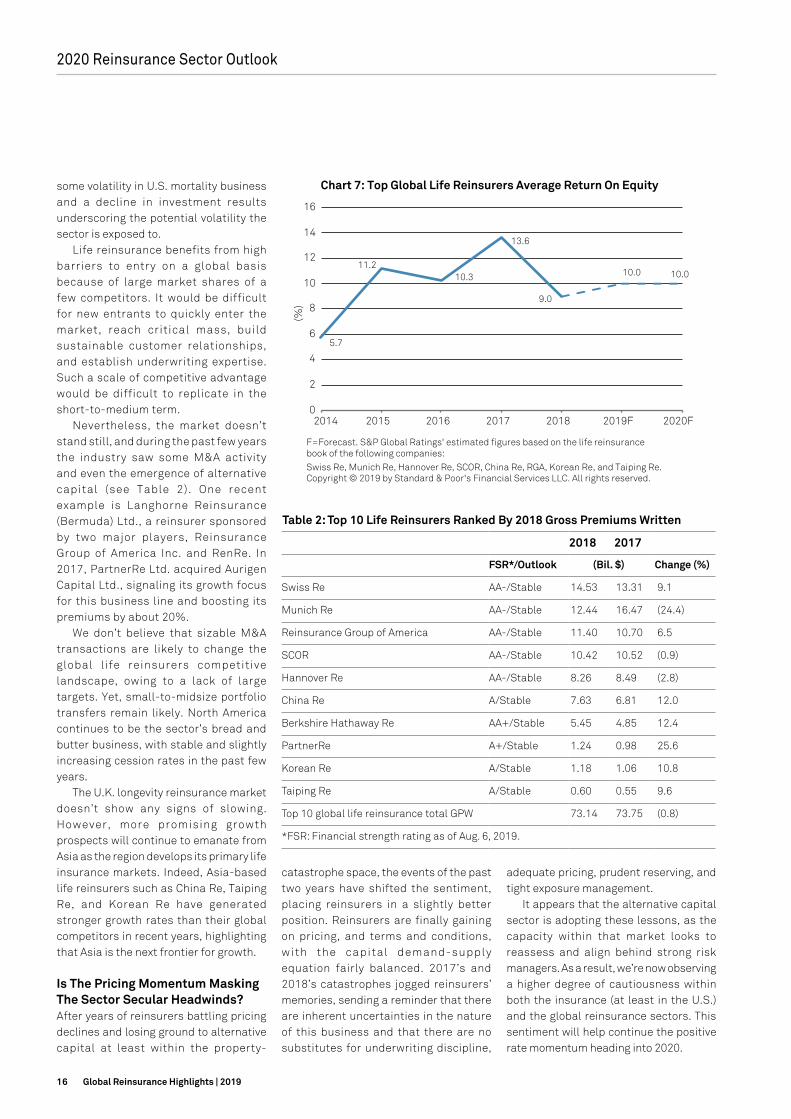
Chart 7: Top Global Life Reinsurers Average Return On Equity
F=Forecast. S&P Global Ratings' estimated figures based on the life reinsurance book of the following companies:
Swiss Re, Munich Re, Hannover Re, SCOR, China Re, RGA, Korean Re, and Taiping Re. Copyright © 2019 by Standard & Poor's Financial Services LLC. All rights reserved.
2014
2015
2016
2017
2018
WACC10-year U.S. govt bondsReturn on capital
0
2
4
6
8
10
12
14
16
A- A A+ AA- AA AA+
(No.
)
Chart 1: Top 40 Global Reinsurers Rating Distribution*
*Financial strength rating on core operating subsidiaries as of Aug. 6, 2019.Copyright © 2019 by Standard & Poor's Financial Services LLC. All rights reserved.
Negative(2%)
Stable(88%)
Positive(10%)
Chart 2: Top 40 Global Reinsurers Outlook Distribution*
*As of Aug. 6, 2019.
Copyright © 2019 by Standard & Poor's Financial Services LLC. All rights reserved.
(20)
(10)
0
10
20
30
40
50
60
70
80
AAA AA A BBB
(%)
Chart 4: Capital Adequacy Of The Top 20 Global Reinsurers ByConfidence Level (2014-2018)
Copyright © 2019 by Standard & Poor's Financial Services LLC. All rights reserved.
0
2
4
6
8
10
12
14
16
18
20052006
20072008
20092010
20112012
20132014
20152016
20172018
2019 Q1
2019F
2020F
(%)
Chart 5: Reinsurers’ Weighted-Average Cost Of Capital And Return On Capital (2005–2020)
F:Forecasts. Source: S&P Global Ratings, Bloomberg. WACC: Weighted average cost of capital
Copyright © 2019 by Standard & Poor's Financial Services LLC. All rights reserved.
17 22 19 22 24 28 44 50 64 72 81 89 97 93
368 388321
378447 428
461490
511 493514 516 488 512
385410
340
400
470 455
505540
575 565595 605
585605
20062007
20082009
20102011
20122013
20142015
20162017
2018
Q1 2019
(Bil.
$)
Traditional capital
Alternative capital
Global reinsurance capital
Chart 6: Global Reinsurance Capital
Source: Aon Securities Inc.
Copyright © 2019 by Standard & Poor's Financial Services LLC. All rights reserved.
5.7
11.210.3
13.6
9.0
10.0 10.0
0
2
4
6
8
10
12
14
16
2014 2015 2016 2017 2018 2019F 2020F
(%)
Chart 7: Top Global Life Reinsurers Average Return On Equity
F=Forecast. S&P Global Ratings' estimated figures based on the life reinsurance book of the following companies:
Swiss Re, Munich Re, Hannover Re, SCOR, China Re, RGA, Korean Re, and Taiping Re. Copyright © 2019 by Standard & Poor's Financial Services LLC. All rights reserved.
2014
2015
2016
2017
2018
WACC10-year U.S. govt bondsReturn on capital

12 Global Reinsurance Highlights | 2019
Capitalization Took A Hit Or Two, But Remains A Pillar Of Strength The reinsurance sector benefits from robust capitalization, which remains a strength for most reinsurers. This capital strength cushions the industry from severity exposure, such as catastrophe
risk and long-tail reserve risk that reinsurers assume in their underwriting operations, as it often serves as a backstop for the primary insurance market. To cope with these risks, global reinsurers tend to be strongly capitalized with generally conservative
investment portfolios while maintaining sophisticated ERM programs.
The top 20 global reinsurers’ capital adequacy remained redundant by 5% at the ‘AA’ confidence level in 2018—a slight decrease from 2017, despite the catastrophe losses and the stock market volatility in fourth-quarter 2018 (see Chart 4). This cohort of reinsurers lost their capital redundancy at the ‘AAA’ confidence level in 2017 and 2018 because of the heavy catastrophe losses, adjustments to the large global reinsurers’ asset liability management and/or longevity risk capital charges, and continued buybacks and special dividends. We believe capitalization will remain a pillar of strength for the sector in the next two years.
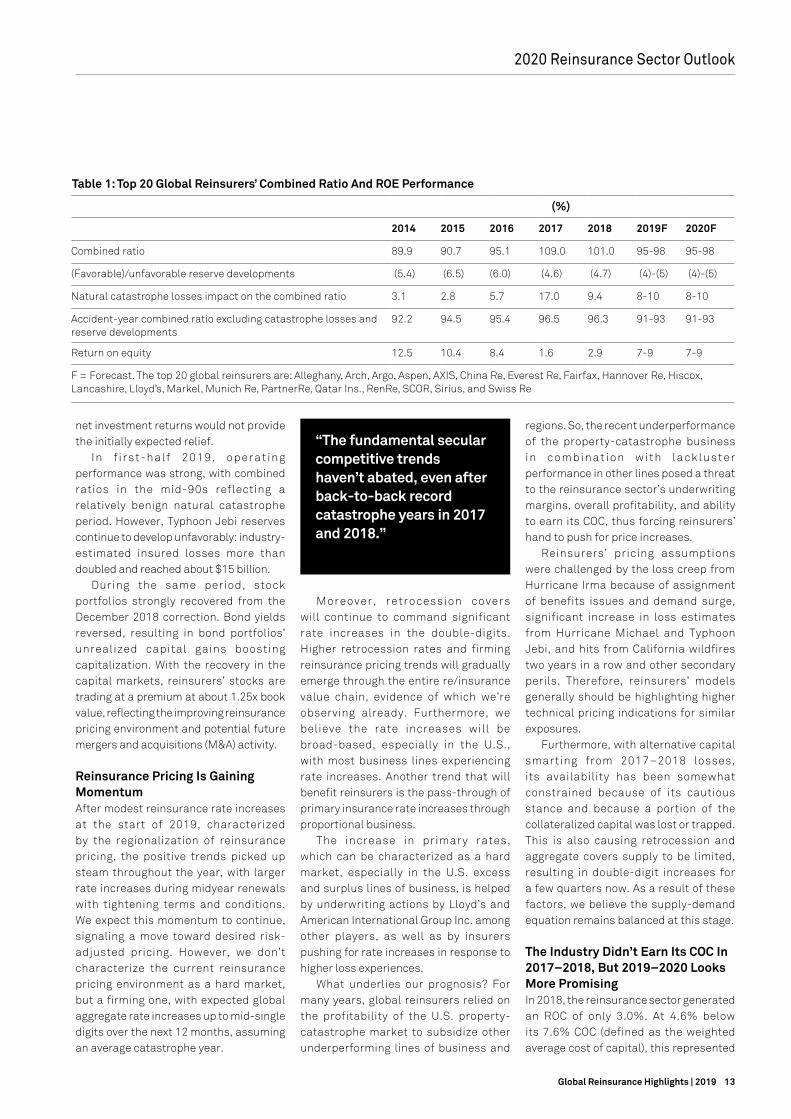
The sector’s operating performance was subpar in the past two years as the industry experienced major catastrophe losses. As a result, the top 20 reinsurers generated underwriting losses in 2017 and 2018 with combined ratios of 109% and 101%, respectively (see Table 1). These catastrophe losses hurt the combined ratios by 17 percentage points (pps) in 2017 and 9.4 pps in 2018, which also included loss creep from earlier events such as Hurricanes Irma and Maria.
Reserve releases contributed about five pps to the underwriting results in the past two years at a declining rate relative to the previous years, given that the sector was in a soft pricing cycle. Our expectation of lower reserve releases prospectively relative to the past few years hasn’t changed.
When we strip out the effects of catastrophe losses and reserve releases, accident-year combined ratios have worsened during the past five years, reflecting pricing pressure, albeit they leveled out in 2018. The 2019 renewals brought hardening reinsurance rates, with positive momentum heading into 2020. As a result, we forecast a slight improvement in profitability in 2019–2020, with an estimated combined ratio of 95% to 98% and an ROE of 7% to 9%. As interest rates are now declining, dashing hope for net investment yield improvement, reinsurers need to sharpen their focus on disciplined underwriting as
2020 Reinsurance Sector Outlook
0
2
4
6
8
10
12
14
16
A- A A+ AA- AA AA+
(No.
)
Chart 1: Top 40 Global Reinsurers Rating Distribution*
*Financial strength rating on core operating subsidiaries as of Aug. 6, 2019.Copyright © 2019 by Standard & Poor's Financial Services LLC. All rights reserved.
Negative(2%)
Stable(88%)
Positive(10%)
Chart 2: Top 40 Global Reinsurers Outlook Distribution*
*As of Aug. 6, 2019.
Copyright © 2019 by Standard & Poor's Financial Services LLC. All rights reserved.
(20)
(10)
0
10
20
30
40
50
60
70
80
AAA AA A BBB
(%)
Chart 4: Capital Adequacy Of The Top 20 Global Reinsurers ByConfidence Level (2014-2018)
Copyright © 2019 by Standard & Poor's Financial Services LLC. All rights reserved.
0
2
4
6
8
10
12
14
16
18
20052006
20072008
20092010
20112012
20132014
20152016
20172018
2019 Q1
2019F
2020F
(%)
Chart 5: Reinsurers’ Weighted-Average Cost Of Capital And Return On Capital (2005–2020)
F:Forecasts. Source: S&P Global Ratings, Bloomberg. WACC: Weighted average cost of capital
Copyright © 2019 by Standard & Poor's Financial Services LLC. All rights reserved.
17 22 19 22 24 28 44 50 64 72 81 89 97 93
368 388321
378447 428
461490
511 493514 516 488 512
385410
340
400
470 455
505540
575 565595 605
585605
20062007
20082009
20102011
20122013
20142015
20162017
2018
Q1 2019
(Bil.
$)
Traditional capital
Alternative capital
Global reinsurance capital
Chart 6: Global Reinsurance Capital
Source: Aon Securities Inc.
Copyright © 2019 by Standard & Poor's Financial Services LLC. All rights reserved.
5.7
11.210.3
13.6
9.0
10.0 10.0
0
2
4
6
8
10
12
14
16
2014 2015 2016 2017 2018 2019F 2020F
(%)
Chart 7: Top Global Life Reinsurers Average Return On Equity
F=Forecast. S&P Global Ratings' estimated figures based on the life reinsurance book of the following companies:
Swiss Re, Munich Re, Hannover Re, SCOR, China Re, RGA, Korean Re, and Taiping Re. Copyright © 2019 by Standard & Poor's Financial Services LLC. All rights reserved.
2014
2015
2016
2017
2018
WACC10-year U.S. govt bondsReturn on capital
Economic conditions and globalgeopolitical risks
Lower-for-longer interest rates
Climate change and catastropherisk
Alternative capital threateningbusiness models
The industry not meeting itscost of capital
Regulations increasing cost ofdoing business
Alignment of compensation amongstakeholders
Hardening reinsurance pricing
Human capital and talentmanagement
Alternative capital partnershipsimproving competitive positions
Technology investments,innovation, and insurtech
Expense management and costefficiencies
New products and markets (ESG,cyber re, life re, mortgage re)
Closing the protection gap
Threats
Chart 3: Threats And Opportunities For The Global Reinsurance Sector
Opportunities
Source: S&P Global RatingsCopyright © 2019 by Standard & Poor's Financial Services LLC. All rights reserved.
13Global Reinsurance Highlights | 2019
net investment returns would not provide the initially expected relief.
In f i rst-half 2019, operat ing performance was strong, with combined ratios in the mid-90s reflecting a relatively benign natural catastrophe period. However, Typhoon Jebi reserves continue to develop unfavorably: industry-estimated insured losses more than doubled and reached about $15 billion.
During the same period, stock portfolios strongly recovered from the December 2018 correction. Bond yields reversed, resulting in bond portfolios’ unrealized capital gains boosting capitalization. With the recovery in the capital markets, reinsurers’ stocks are trading at a premium at about 1.25x book value, reflecting the improving reinsurance pricing environment and potential future mergers and acquisitions (M&A) activity.
Reinsurance Pricing Is Gaining Momentum After modest reinsurance rate increases at the start of 2019, characterized by the regionalization of reinsurance pricing, the positive trends picked up steam throughout the year, with larger rate increases during midyear renewals with tightening terms and conditions. We expect this momentum to continue, signaling a move toward desired risk-adjusted pricing. However, we don’t characterize the current reinsurance pricing environment as a hard market, but a firming one, with expected global aggregate rate increases up to mid-single digits over the next 12 months, assuming an average catastrophe year.
Moreover, retrocession covers will continue to command significant rate increases in the double-digits. Higher retrocession rates and firming reinsurance pricing trends will gradually emerge through the entire re/insurance value chain, evidence of which we’re observing already. Furthermore, we believe the rate increases will be broad-based, especially in the U.S., with most business lines experiencing rate increases. Another trend that will benefit reinsurers is the pass-through of primary insurance rate increases through proportional business.
The increase in primary rates, which can be characterized as a hard market, especially in the U.S. excess and surplus lines of business, is helped by underwriting actions by Lloyd’s and American International Group Inc. among other players, as well as by insurers pushing for rate increases in response to higher loss experiences.
What underlies our prognosis? For many years, global reinsurers relied on the profitability of the U.S. property-catastrophe market to subsidize other underperforming lines of business and
regions. So, the recent underperformance of the property-catastrophe business i n c o m b i n a t i o n w i t h l a c k l u s t e r performance in other lines posed a threat to the reinsurance sector’s underwriting margins, overall profitability, and ability to earn its COC, thus forcing reinsurers’ hand to push for price increases.
Reinsurers’ pricing assumptions were challenged by the loss creep from Hurricane Irma because of assignment of benefits issues and demand surge, significant increase in loss estimates from Hurricane Michael and Typhoon Jebi, and hits from California wildfires two years in a row and other secondary perils. Therefore, reinsurers’ models generally should be highlighting higher technical pricing indications for similar exposures.
Furthermore, with alternative capital smarting from 2017–2018 losses, its availability has been somewhat constrained because of its cautious stance and because a portion of the collateralized capital was lost or trapped. This is also causing retrocession and aggregate covers supply to be limited, resulting in double-digit increases for a few quarters now. As a result of these factors, we believe the supply-demand equation remains balanced at this stage.
The Industry Didn’t Earn Its COC In 2017–2018, But 2019–2020 Looks More Promising In 2018, the reinsurance sector generated an ROC of only 3.0%. At 4.6% below its 7.6% COC (defined as the weighted average cost of capital), this represented
“The fundamental secular competitive trends haven’t abated, even after back-to-back record catastrophe years in 2017 and 2018.”
2020 Reinsurance Sector Outlook
Table 1: Top 20 Global Reinsurers’ Combined Ratio And ROE Performance
(%)
2014 2015 2016 2017 2018 2019F 2020F
Combined ratio 89.9 90.7 95.1 109.0 101.0 95-98 95-98
(Favorable)/unfavorable reserve developments (5.4) (6.5) (6.0) (4.6) (4.7) (4)-(5) (4)-(5)
Natural catastrophe losses impact on the combined ratio 3.1 2.8 5.7 17.0 9.4 8-10 8-10
Accident-year combined ratio excluding catastrophe losses and reserve developments
92.2 94.5 95.4 96.5 96.3 91-93 91-93
Return on equity 12.5 10.4 8.4 1.6 2.9 7-9 7-9
F = Forecast. The top 20 global reinsurers are: Alleghany, Arch, Argo, Aspen, AXIS, China Re, Everest Re, Fairfax, Hannover Re, Hiscox, Lancashire, Lloyd’s, Markel, Munich Re, PartnerRe, Qatar Ins., RenRe, SCOR, Sirius, and Swiss Re
14 Global Reinsurance Highlights | 2019
the second consecutive year of subpar returns for the global reinsurance sector (see Chart 5). The impact of loss creep from the 2017 natural catastrophes, 2018 catastrophe losses, and investment market volatility in fourth-quarter 2018, all played a part in this result.
The improved investment climate in first-half 2019, combined with the most benign first half-year for natural catastrophe losses since 2006, according to Aon PLC, has helped improve the year-to-date 2019 returns. This has meant that the gap between the sector’s actual ROC and COC shrunk to negative 2.7% as of March 31, 2019, compared with negative 4.6% at the end of 2018, and is likely to have further improved at the half-year mark. In addition to improved earnings in first-half 2019, the below-average catastrophe losses year-to-date and the reemergence of lower-for-longer interest rate environment have exerted downward pressure on the sector’s COC.
Furthermore, as 2019 rate increases are booked, and earned, through income statements over the upcoming quarters, this should further improve the picture. Indeed, assuming a normal catastrophe load of about 8 to 10 pps on the combined ratio, we forecast that reinsurers’ returns for 2019 and 2020 will broadly cover their COC. Specifically, we forecast the reinsurance sector’s ROC will be between 6% and 8% compared with its COC between 6.5% and 7.5% in each of 2019 and 2020.
The anticipated improvement in the industry’s ROC relative to its COC is one of the key factors that led us to keep our stable outlook on the global reinsurance sector.
Alternative Capital Growth Recently Paused, But Its Influx Will Likely Resume Alternative capital, which includes collateralized reinsurance funds, insurance-linked securities (ILS), sidecars, and industry loss warranties, has become an integral part of the property-catastrophe market. According to Swiss Re latest estimates, it represented about 25% of total property-catastrophe risk supply in 2018 and accounted for 25% to
includes about $15 billion of collateral still trapped because of recent natural catastrophe events.
This has caused a flight to quality, as investors have become more selective and have shifted their attention to well-established sponsors/managers with a better track record while simultaneously asking for higher returns. Indeed, in December 2018, Bermuda-based RenaissanceRe Holdings Ltd. (RenRe) and Dutch pension fund manager
30% of the insured losses from the 2017 North Atlantic hurricane season.
Based on Aon, alternative capital declined 4% or $4 billion to $93 billion in first-quarter 2019 relative to year-end 2019. The decline was mostly caused by dismal returns in the past couple of years, loss payments, and loss creep from earlier events, exacerbated by governance issues at certain funds, which triggered investors’ redemptions. The $93 billion of assets under management
2020 Reinsurance Sector Outlook
0
2
4
6
8
10
12
14
16
A- A A+ AA- AA AA+
(No.
)
Chart 1: Top 40 Global Reinsurers Rating Distribution*
*Financial strength rating on core operating subsidiaries as of Aug. 6, 2019.Copyright © 2019 by Standard & Poor's Financial Services LLC. All rights reserved.
Negative(2%)
Stable(88%)
Positive(10%)
Chart 2: Top 40 Global Reinsurers Outlook Distribution*
*As of Aug. 6, 2019.
Copyright © 2019 by Standard & Poor's Financial Services LLC. All rights reserved.
(20)
(10)
0
10
20
30
40
50
60
70
80
AAA AA A BBB
(%)
Chart 4: Capital Adequacy Of The Top 20 Global Reinsurers ByConfidence Level (2014-2018)
Copyright © 2019 by Standard & Poor's Financial Services LLC. All rights reserved.
0
2
4
6
8
10
12
14
16
18
20052006
20072008
20092010
20112012
20132014
20152016
20172018
2019 Q1
2019F
2020F
(%)
Chart 5: Reinsurers’ Weighted-Average Cost Of Capital And Return On Capital (2005–2020)
F:Forecasts. Source: S&P Global Ratings, Bloomberg. WACC: Weighted average cost of capital
Copyright © 2019 by Standard & Poor's Financial Services LLC. All rights reserved.
17 22 19 22 24 28 44 50 64 72 81 89 97 93
368 388321
378447 428
461490
511 493514 516 488 512
385410
340
400
470 455
505540
575 565595 605
585605
20062007
20082009
20102011
20122013
20142015
20162017
2018
Q1 2019
(Bil.
$)
Traditional capital
Alternative capital
Global reinsurance capital
Chart 6: Global Reinsurance Capital
Source: Aon Securities Inc.
Copyright © 2019 by Standard & Poor's Financial Services LLC. All rights reserved.
5.7
11.210.3
13.6
9.0
10.0 10.0
0
2
4
6
8
10
12
14
16
2014 2015 2016 2017 2018 2019F 2020F
(%)
Chart 7: Top Global Life Reinsurers Average Return On Equity
F=Forecast. S&P Global Ratings' estimated figures based on the life reinsurance book of the following companies:
Swiss Re, Munich Re, Hannover Re, SCOR, China Re, RGA, Korean Re, and Taiping Re. Copyright © 2019 by Standard & Poor's Financial Services LLC. All rights reserved.
2014
2015
2016
2017
2018
WACC10-year U.S. govt bondsReturn on capital
0
2
4
6
8
10
12
14
16
A- A A+ AA- AA AA+
(No.
)
Chart 1: Top 40 Global Reinsurers Rating Distribution*
*Financial strength rating on core operating subsidiaries as of Aug. 6, 2019.Copyright © 2019 by Standard & Poor's Financial Services LLC. All rights reserved.
Negative(2%)
Stable(88%)
Positive(10%)
Chart 2: Top 40 Global Reinsurers Outlook Distribution*
*As of Aug. 6, 2019.
Copyright © 2019 by Standard & Poor's Financial Services LLC. All rights reserved.
(20)
(10)
0
10
20
30
40
50
60
70
80
AAA AA A BBB
(%)
Chart 4: Capital Adequacy Of The Top 20 Global Reinsurers ByConfidence Level (2014-2018)
Copyright © 2019 by Standard & Poor's Financial Services LLC. All rights reserved.
0
2
4
6
8
10
12
14
16
18
20052006
20072008
20092010
20112012
20132014
20152016
20172018
2019 Q1
2019F
2020F
(%)
Chart 5: Reinsurers’ Weighted-Average Cost Of Capital And Return On Capital (2005–2020)
F:Forecasts. Source: S&P Global Ratings, Bloomberg. WACC: Weighted average cost of capital
Copyright © 2019 by Standard & Poor's Financial Services LLC. All rights reserved.
17 22 19 22 24 28 44 50 64 72 81 89 97 93
368 388321
378447 428
461490
511 493514 516 488 512
385410
340
400
470 455
505540
575 565595 605
585605
20062007
20082009
20102011
20122013
20142015
20162017
2018
Q1 2019
(Bil.
$)
Traditional capital
Alternative capital
Global reinsurance capital
Chart 6: Global Reinsurance Capital
Source: Aon Securities Inc.
Copyright © 2019 by Standard & Poor's Financial Services LLC. All rights reserved.
5.7
11.210.3
13.6
9.0
10.0 10.0
0
2
4
6
8
10
12
14
16
2014 2015 2016 2017 2018 2019F 2020F
(%)
Chart 7: Top Global Life Reinsurers Average Return On Equity
F=Forecast. S&P Global Ratings' estimated figures based on the life reinsurance book of the following companies:
Swiss Re, Munich Re, Hannover Re, SCOR, China Re, RGA, Korean Re, and Taiping Re. Copyright © 2019 by Standard & Poor's Financial Services LLC. All rights reserved.
2014
2015
2016
2017
2018
WACC10-year U.S. govt bondsReturn on capital
15Global Reinsurance Highlights | 2019
PGGM announced the creation of a Class 3B Bermudian reinsurer, Vermeer Reinsurance Ltd., to provide capacity focused on risk remote layers in the U.S. property-catastrophe market.
Vermeer was initially capitalized with $600 million of equity from PGGM, with up to a further $400 million available to pursue growth opportunities in 2019, for a total of $1 billion of capital. Moreover, RenRe raised an additional $700 million in third-party capital in June 2019 in its various ventures including DaVinci, Vermeer, Upsilon, and Medici.
Earlier this year, the giant fixed-income manager PIMCO entered the ILS market. In May 2019, SCOR SE announced its acquisition of Coriolis Capital Ltd., an ILS fund manager expanding its ILS capacity to $2.1 billion. In June 2019, White Mountains Insurance Group Ltd. acquired a minority interest stake in Elementum Advisors LLC with over $4 billion of assets under management. Lastly, in July 2019, Markel Corp. announced the creation of its new retrocessional ILS fund platform, complementing its Nephila Capital Ltd. acquired in 2018, while placing its wounded CATCo Investment Management Ltd. into run-off.
This recent high activity highlights that alternative capital is still vibrant (see chart 6) and that long-term investors have enjoyed good uncorrelated returns over a longer time. It also highlights that there’s increasing alignment between the reinsurance sector and alternative capital. In addition, the case for investing in insurance risk for diversification purposes in a low interest rate environment remains valid. As a result, we believe alternative capital backed by long-term investors remains committed to property-catastrophe risk and is here to stay. We expect, once the recent bumps are smoothed over and the recent losses are fully digested, growth will resume.
Mergers And Acquisitions Remain In Vogue Mergers and acquisitions remain a hot topic for the reinsurance sector, as some players are posting subpar
returns due to cost inefficiency, margin pressure, and still-excess reinsurance capacity. Furthermore, organic growth opportunities are somewhat limited and the fact that some cedants prefer to deal with fewer and larger global reinsurers is further increasing the pressure on small players with less diversified product offerings and dragged by higher cost structures. In particular, those players with narrower business profiles and a limited geographic footprint will likely either consider M&A or become targets themselves.
It seems that the acquisition of alternative capital managers is also heating up as alternative capital has grown in importance, following the motto: “if you can’t beat them, join them”. In recognition, reinsurers and some primary insurers have built their alternative capital strategies to harness this capital either through building from scratch or through acquisitions. Overall, we foresee further convergence in the insurance, reinsurance, and ILS markets in the next few years as structural changes in the industry continue to place pressure on reinsurers, especially considering that capital is still relatively cheap.
From a credit perspective, we tend to view M&A transactions slightly negatively at the outset, given the associated execution risk. Establishing clear execution objectives is vital for a successful M&A transaction. Consolidation could create growth opportunit ies through combined platforms, a stronger competitive position in chosen products and regions, increased diversification benefits, and potential expense synergies that could improve earnings and strengthen the financial profile.
A well-executed deal can enhance the consolidated entities’ creditworthiness and improve their shareholders’ value. Unfortunately, the industry doesn’t have a stellar track record when it comes to M&A deals, as they inherently come with elevated execution risk, cultural clash, overpromising cost synergies, and overlapping businesses. However, there are a few success stories.
Life Reinsurance Provides A Calm Harbor In A Volatile P/C World While business conditions have been challenging for P/C reinsurance, life reinsurance has had a relatively strong performance, offsetting some of the property-catastrophe volatility generated in the past couple of years for those reinsurers with meaningful life reinsurance exposure. In fact, in the past two years, the life reinsurance segment contributed materially to these groups’ bottom lines.
The global life reinsurance industry has well-developed underwriting expertise that enables it to perform well. Access to global exposure and key data for underwriting allow global players to develop and maintain longstanding, trusting relationships with primary life insurers. Therefore, they experience less margin compression relative to capacity-driven P/C reinsurers.
We believe that life reinsurance’s business conditions will remain sound during the next two years with a strong ROE of 10% in 2019–2020. However, some earnings volatility could occur if material changes in key actuarial assumptions for calculating premium rates (that is, mortality, morbidity, and longevity) were to occur. For example, in 2012–2014, most reinsurers with exposure to the Australian disability business were facing adverse developments, and the industry suffered a loss of about $1 billion.
We estimated that the life reinsurance sector’s ROE slightly declined to about 9% in 2018, from 13.6% in 2017 (see Chart 7). However, in 2017 the sector benefitted from significant tax gains from the U.S. tax reform. Excluding this exceptional effect, we estimated the sector’s ROE would have been 10.2% in 2017. The moderate decline in ROE in 2018 reflects
2020 Reinsurance Sector Outlook
“We don’t characterize the current reinsurance pricing environment as a hard market, but a firming one.”
16 Global Reinsurance Highlights | 2019
some volatility in U.S. mortality business and a decline in investment results underscoring the potential volatility the sector is exposed to.
Life reinsurance benefits from high barriers to entry on a global basis because of large market shares of a few competitors. It would be difficult for new entrants to quickly enter the market, reach critical mass, build sustainable customer relationships, and establish underwriting expertise. Such a scale of competitive advantage would be difficult to replicate in the short-to-medium term.
Nevertheless, the market doesn’t stand still, and during the past few years the industry saw some M&A activity and even the emergence of alternative capital (see Table 2). One recent example is Langhorne Reinsurance (Bermuda) Ltd., a reinsurer sponsored by two major players, Reinsurance Group of America Inc. and RenRe. In 2017, PartnerRe Ltd. acquired Aurigen Capital Ltd., signaling its growth focus for this business line and boosting its premiums by about 20%.
We don’t believe that sizable M&A transactions are likely to change the global life reinsurers competitive landscape, owing to a lack of large targets. Yet, small-to-midsize portfolio transfers remain likely. North America continues to be the sector’s bread and butter business, with stable and slightly increasing cession rates in the past few years.
The U.K. longevity reinsurance market doesn’t show any signs of slowing. However, more promising growth prospects will continue to emanate from Asia as the region develops its primary life insurance markets. Indeed, Asia-based life reinsurers such as China Re, Taiping Re, and Korean Re have generated stronger growth rates than their global competitors in recent years, highlighting that Asia is the next frontier for growth.
Is The Pricing Momentum Masking The Sector Secular Headwinds? After years of reinsurers battling pricing declines and losing ground to alternative capital at least within the property-
catastrophe space, the events of the past two years have shifted the sentiment, placing reinsurers in a slightly better position. Reinsurers are finally gaining on pricing, and terms and conditions, with the capital demand-supply equation fairly balanced. 2017’s and 2018’s catastrophes jogged reinsurers’ memories, sending a reminder that there are inherent uncertainties in the nature of this business and that there are no substitutes for underwriting discipline,
adequate pricing, prudent reserving, and tight exposure management.
It appears that the alternative capital sector is adopting these lessons, as the capacity within that market looks to reassess and align behind strong risk managers. As a result, we’re now observing a higher degree of cautiousness within both the insurance (at least in the U.S.) and the global reinsurance sectors. This sentiment will help continue the positive rate momentum heading into 2020.
0
2
4
6
8
10
12
14
16
A- A A+ AA- AA AA+
(No.
)
Chart 1: Top 40 Global Reinsurers Rating Distribution*
*Financial strength rating on core operating subsidiaries as of Aug. 6, 2019.Copyright © 2019 by Standard & Poor's Financial Services LLC. All rights reserved.
Negative(2%)
Stable(88%)
Positive(10%)
Chart 2: Top 40 Global Reinsurers Outlook Distribution*
*As of Aug. 6, 2019.
Copyright © 2019 by Standard & Poor's Financial Services LLC. All rights reserved.
(20)
(10)
0
10
20
30
40
50
60
70
80
AAA AA A BBB
(%)
Chart 4: Capital Adequacy Of The Top 20 Global Reinsurers ByConfidence Level (2014-2018)
Copyright © 2019 by Standard & Poor's Financial Services LLC. All rights reserved.
0
2
4
6
8
10
12
14
16
18
20052006
20072008
20092010
20112012
20132014
20152016
20172018
2019 Q1
2019F
2020F
(%)
Chart 5: Reinsurers’ Weighted-Average Cost Of Capital And Return On Capital (2005–2020)
F:Forecasts. Source: S&P Global Ratings, Bloomberg. WACC: Weighted average cost of capital
Copyright © 2019 by Standard & Poor's Financial Services LLC. All rights reserved.
17 22 19 22 24 28 44 50 64 72 81 89 97 93
368 388321
378447 428
461490
511 493514 516 488 512
385410
340
400
470 455
505540
575 565595 605
585605
20062007
20082009
20102011
20122013
20142015
20162017
2018
Q1 2019
(Bil.
$)
Traditional capital
Alternative capital
Global reinsurance capital
Chart 6: Global Reinsurance Capital
Source: Aon Securities Inc.
Copyright © 2019 by Standard & Poor's Financial Services LLC. All rights reserved.
5.7
11.210.3
13.6
9.0
10.0 10.0
0
2
4
6
8
10
12
14
16
2014 2015 2016 2017 2018 2019F 2020F
(%)
Chart 7: Top Global Life Reinsurers Average Return On Equity
F=Forecast. S&P Global Ratings' estimated figures based on the life reinsurance book of the following companies: Swiss Re, Munich Re, Hannover Re, SCOR, China Re, RGA, Korean Re, and Taiping Re. Copyright © 2019 by Standard & Poor's Financial Services LLC. All rights reserved.
2014
2015
2016
2017
2018
WACC10-year U.S. govt bondsReturn on capital
Table 2: Top 10 Life Reinsurers Ranked By 2018 Gross Premiums Written
2018 2017
FSR*/Outlook (Bil. $) Change (%)
Swiss Re AA-/Stable 14.53 13.31 9.1
Munich Re AA-/Stable 12.44 16.47 (24.4)
Reinsurance Group of America AA-/Stable 11.40 10.70 6.5
SCOR AA-/Stable 10.42 10.52 (0.9)
Hannover Re AA-/Stable 8.26 8.49 (2.8)
China Re A/Stable 7.63 6.81 12.0
Berkshire Hathaway Re AA+/Stable 5.45 4.85 12.4
PartnerRe A+/Stable 1.24 0.98 25.6
Korean Re A/Stable 1.18 1.06 10.8
Taiping Re A/Stable 0.60 0.55 9.6
Top 10 global life reinsurance total GPW 73.14 73.75 (0.8)
*FSR: Financial strength rating as of Aug. 6, 2019.
2020 Reinsurance Sector Outlook

17Global Reinsurance Highlights | 2019
Although the current environment gives reinsurers some breathing room, the underlying factors spurring secular changes within the sector remain intact. Despite the losses and disciplined stance, there isn’t a scarcity of capacity—neither of traditional nor of alternative capital.
Product commodit izat ion wi l l advance, especially within the property-catastrophe market, centralization and optimization of reinsurance purchasing will continue, consolidation of brokers will further entrench the intermediaries, and growth opportunities remain limited except for a few pockets. Despite M&A activity in the past few years, the global P/C reinsurance market remains very fragmented and highly competitive.
S&P Global Ratings believes that these factors will continue to push the sector to evolve, forcing market consolidation, product and service innovation, expansion of product offerings, and reimagining of the re/insurance value chain. Indeed the market may look different, but it could be a long time before the competitive landscape changes. For now, reinsurers are optimistic about the pricing environment, but a long road to ensure continued relevance lies ahead. n
This report does not constitute a rating action.
Taoufik GharibNew York, (1) [email protected]
Johannes BenderFrankfurt, (49) [email protected]
Hardeep Manku Toronto, (1) [email protected]
David MastersLondon, (44) [email protected]
Ali Karakuyu London, (44) [email protected]
2020 Reinsurance Sector Outlook
18 Global Reinsurance Highlights | 2019
Catastrophe Risk
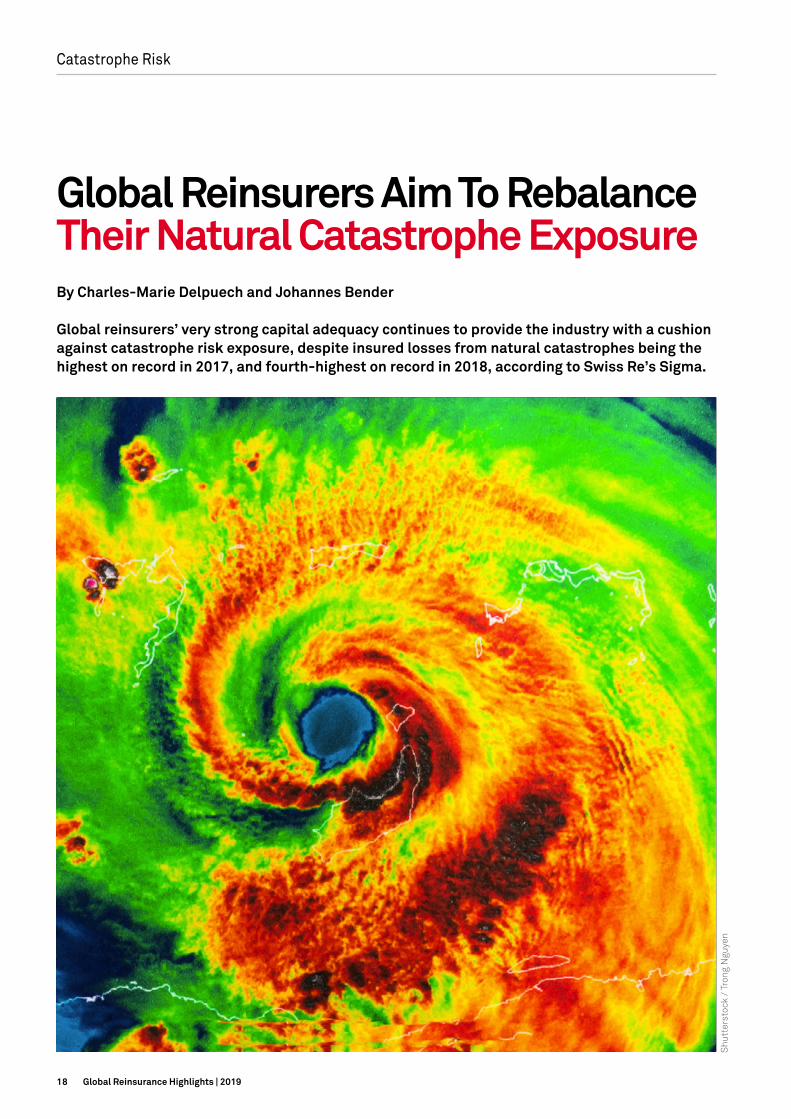
Global Reinsurers Aim To Rebalance Their Natural Catastrophe Exposure By Charles-Marie Delpuech and Johannes Bender
Global reinsurers’ very strong capital adequacy continues to provide the industry with a cushion against catastrophe risk exposure, despite insured losses from natural catastrophes being the highest on record in 2017, and fourth-highest on record in 2018, according to Swiss Re’s Sigma.
Shu
tter
stoc
k /
Tron
g N
guye
n

19Global Reinsurance Highlights | 2019
1
10
100
1,000
0 10 20 30 40 50 60 70 80
Ret
urn
peri
od in
yea
r (lo
g sc
ale)
Modeled net loss (bil. $)
Chart 1: 2018 Catastrophe Losses Were Below The 1-In-10-Year Level
Source: S&P Global Ratings estimates for the top 20 global reinsurers.
Copyright © 2019 by Standard & Poor's Financial Services LLC. All rights reserved.
2011
2017
2010
2012 2016
2013 2014 2015
2018
Natural catastrophe netexposure estimate
Actual annual aggregate net catastrophe loss (restated for premium growth)
Annual expected net loss
16
34
12
8 5 5
9
28
15
0
5
10
15
20
25
30
35
0
5
10
15
20
25
30
35
2010 2011 2012 2013 2014 2015 2016 2017 2018
Top 20 loss market share (%
)
Act
ual n
et lo
ss (m
il. $
)
Chart 2: The Top 20 Global Reinsurers Typically Take 20%Of Total Industry Losses
Source: Swiss Re Sigma, S&P Global Ratings. Copyright © 2019 by Standard & Poor's Financial Services LLC. All rights reserved.
0
10
20
30
40
50
60
70
80
90
100
Reinsurer 1
Reinsurer 2
Reinsurer 3
Reinsurer 4
Reinsurer 5
Reinsurer 6
Reinsurer 7
Reinsurer 8
Reinsurer 9
Reinsurer 1
0
Reinsurer 1
1
Reinsurer 1
2
Reinsurer 1
3
Est
imat
ed r
etur
n pe
riod
s (y
ears
)
Chart 3: Aggregate Net Losses From Typhoon Jebi Are BeyondThe 1-In-40-Year Level
Source: S&P Global Ratings. Copyright © 2019 by Standard & Poor's Financial Services LLC. All rights reserved.
(60)
(50)
(40)
(30)
(20)
(10)
0
10
20
30
40
Hurricane Harvey (August 2017)
Hurricane Irma (September 2017)
Hurricane Maria (September 2017)
California Wildfires (2017)
Net
incu
rred
dev
elop
men
t at y
ear-
end
2018
(a
s pe
rcen
tage
of y
ear-
end
2017
net
incu
rred
)
Chart 4: Loss Estimates In 2017 Showed Significant DisparitiesFrom The Average
Copyright © 2019 by Standard & Poor's Financial Services LLC. All rights reserved.
Average Min Max
Actual annual aggregate net catastrophe loss (restated for premium growth)
Top 20 loss market share
0.0
0.2
0.4
0.6
0.8
1.0
1.2
1.4
0 10 20 30 40 50 60 70 80 90
1-in
-10-
year
net
cat
astr
ophe
loss
ver
sus
ex
pect
ed P
BT
excl
udin
g ca
tast
roph
e lo
ss (x
)
1-in-250 year net catastrophe loss relative to reported shareholders' equity (%)
Chart 5: Large Reinsurers Allow More Of Their EarningsAnd Capital To Be At Risk
As of Jan. 1, 2019. PBT: Profit before tax. Source: S&P Global Ratings.
Copyright © 2019 by Standard & Poor's Financial Services LLC. All rights reserved.
Large global reinsurers Other
reinsurers
Midsize global reinsurers
Individual reinsurer
Peer group
(25)
(20)
(15)
(10)
(5)
0
5
10
15
20
(15) (10) (5) 0 5 10
Cha
nge
1-in
-10-
year
net
cat
astr
ophe
loss
ver
sus
ex
pect
ed P
BT
excl
udin
g ca
tast
roph
e lo
ss (%
poi
nt)
Change 1-in-250-year net catastrophe loss versus reported shareholders’ equity (% point)
Chart 6: Risk Positions Have Shifted As Larger ReinsurersTake On More Exposure
Since Jan. 1, 2018. PBT: Profit before tax. Source: S&P Global Ratings.
Copyright © 2019 by Standard & Poor's Financial Services LLC. All rights reserved.
Midsize global reinsurers
Large global reinsurers
Other reinsurers
Individual reinsurer
Peer group
0
2
4
6
8
10
12
14
16
18
0 1 2 3 4 5 6 7 8 9 10 11 12 13 14 15 16 17 18 19 20 21 22 2018
ann
ual n
et c
atas
trop
he lo
ss a
gain
st y
ear-
end
201
7 to
tal r
epor
ted
shar
ehol
ders
’ equ
ity
(%)
S&P Global relative catastrophe benchmark (ranking from least to most exposed left to right)
Chart 7: S&P Global Rating’s Relative Catastrophe BenchmarkPerformed Well In 2018
Bubble size shows 2018 annual net catastrophe loss against 2018 actualprofit before tax (excluding cat).
Source: S&P Global Ratings. Copyright © 2019 by Standard & Poor's Financial Services LLC. All rights reserved.
Arch
Markel
Qatar Re Argo
Fairfax
Hiscox
Alleghany
Hannover Re AXIS
Swiss Re PartnerRe
Munich Re
SCOR
Aspen
Everest Re
RenaissanceRe Sirius
Lancashire
Lloyd’s
0
10
20
30
40
50
60
70
80
90
0 10 20 30 40 50 60 70 80 90
2019
(rec
over
ies
as p
erce
ntag
e of
1-
in-2
50-y
ear
gros
s ex
posu
re)
2018 (recoveries as percentage of 1-in-250-year gross exposure)
Chart 8: Property Catastrophe Reinsurance Utilization At A 1-In-250-Year Level Is Broadly Flat
From Jan. 1, 2018 to Jan. 1, 2019. Copyright © 2019 by Standard & Poor's Financial Services LLC. All rights reserved.
Other reinsurersMidsize global reinsurers
Large global reinsurers
Peer average
Individual reinsurer
Peer group
Peer average
71.6 30.0 11.4
(16.2)22.0
11.3 (19.7) (35.7) (44.1) (58.1)
0
20
40
60
80
100
120
Surplu
s BBB
Surplu
s A
Surplu
s AA
Deficit AAA
Expected PBT 2019
2019 cat budget
1-in-1
0-year l
oss
1-in-5
0-year l
oss
1-in-1
00-year l
oss
1-in-2
50-year l
oss
Bil.
$
Chart 9: The Industry’s Capital Surplus Suggests It Would Be Resilient To Stress Scenarios
Aggregate figures for the top 20 reinsurers at year-end 2018. PBT: Profit before tax. Source: S&P Global Ratings estimates.
Copyright © 2019 by Standard & Poor’s Financial Services LLC. All rights reserved.
(3.0)
(2.5)
(2.0)
(1.5)
(1.0)
(0.5)
0.0
0.5
1.0
1.5
Lloyd’s
Lancashire
Aspen
Everest R
e
Alleghany
Munich R
e
AXIS
SCOR
Qatar R
e
SwissRe
Hiscox
Fairfax
Argo
Arch
PartnerR
e
Hannover Re
Sirius
RenRe
Mark
el
Chart 10: Strong Profits Offer Resilience, Even If The IndustryLost $100 Billion*
*Future experience may differ, because some reinsurers adjusted their catastropheexposures after the 2017-2018 events.
PBT: Profit before tax. Impact estimate based on 2017-2018 average loss marketshares for the top-20 global reinsurers.
Source: S&P Global Ratings. Copyright © 2019 by Standard & Poor's Financial Services LLC. All rights reserved.
Rel
ativ
e to
exp
ecte
d 20
19 P
BT
(x)
Expected PBT 2019
PBT post $100 billion aggregate loss
PBT post $150 billion aggregate loss
1 3
1
1
2
3
1
8
4
4
6
12
14
20
(10) (5) 0 5 10 15 20 25
After a 1-in-250-year scenario
After a 1-in-100-year scenario
After a 1-in-50-year scenario
After a 1-in-10-year scenario No notch1 notch2 notches3 notches4 notches
Chart 11: Reinsurer’s Capital Adequacy Could Slip Under Extreme Scenarios
Notch represents a capital adequacy category as per S&P Global Ratings criteria. Data as of Dec. 31, 2018.
Copyright © 2019 by Standard & Poor's Financial Services LLC. All rights reserved.
Companies that would lose notches / Companies that would retain their current capital adequacy
Capital buffers
Capital deficit
Expected profit and cat budget Cat losses
1
10
100
1,000
0 10 20 30 40 50 60 70 80
Ret
urn
peri
od in
yea
r (lo
g sc
ale)
Modeled net loss (bil. $)
Chart 1: 2018 Catastrophe Losses Were Below The 1-In-10-Year Level
Source: S&P Global Ratings estimates for the top 20 global reinsurers.
Copyright © 2019 by Standard & Poor's Financial Services LLC. All rights reserved.
2011
2017
2010
2012 2016
2013 2014 2015
2018
Natural catastrophe netexposure estimate
Actual annual aggregate net catastrophe loss (restated for premium growth)
Annual expected net loss
16
34
12
8 5 5
9
28
15
0
5
10
15
20
25
30
35
0
5
10
15
20
25
30
35
2010 2011 2012 2013 2014 2015 2016 2017 2018
Top 20 loss market share (%
)
Act
ual n
et lo
ss (m
il. $
)
Chart 2: The Top 20 Global Reinsurers Typically Take 20%Of Total Industry Losses
Source: Swiss Re Sigma, S&P Global Ratings. Copyright © 2019 by Standard & Poor's Financial Services LLC. All rights reserved.
0
10
20
30
40
50
60
70
80
90
100
Reinsurer 1
Reinsurer 2
Reinsurer 3
Reinsurer 4
Reinsurer 5
Reinsurer 6
Reinsurer 7
Reinsurer 8
Reinsurer 9
Reinsurer 1
0
Reinsurer 1
1
Reinsurer 1
2
Reinsurer 1
3
Est
imat
ed r
etur
n pe
riod
s (y
ears
)
Chart 3: Aggregate Net Losses From Typhoon Jebi Are BeyondThe 1-In-40-Year Level
Source: S&P Global Ratings. Copyright © 2019 by Standard & Poor's Financial Services LLC. All rights reserved.
(60)
(50)
(40)
(30)
(20)
(10)
0
10
20
30
40
Hurricane Harvey (August 2017)
Hurricane Irma (September 2017)
Hurricane Maria (September 2017)
California Wildfires (2017)
Net
incu
rred
dev
elop
men
t at y
ear-
end
2018
(a
s pe
rcen
tage
of y
ear-
end
2017
net
incu
rred
)
Chart 4: Loss Estimates In 2017 Showed Significant DisparitiesFrom The Average
Copyright © 2019 by Standard & Poor's Financial Services LLC. All rights reserved.
Average Min Max
Actual annual aggregate net catastrophe loss (restated for premium growth)
Top 20 loss market share
0.0
0.2
0.4
0.6
0.8
1.0
1.2
1.4
0 10 20 30 40 50 60 70 80 90
1-in
-10-
year
net
cat
astr
ophe
loss
ver
sus
ex
pect
ed P
BT
excl
udin
g ca
tast
roph
e lo
ss (x
)
1-in-250 year net catastrophe loss relative to reported shareholders' equity (%)
Chart 5: Large Reinsurers Allow More Of Their EarningsAnd Capital To Be At Risk
As of Jan. 1, 2019. PBT: Profit before tax. Source: S&P Global Ratings.
Copyright © 2019 by Standard & Poor's Financial Services LLC. All rights reserved.
Large global reinsurers Other
reinsurers
Midsize global reinsurers
Individual reinsurer
Peer group
(25)
(20)
(15)
(10)
(5)
0
5
10
15
20
(15) (10) (5) 0 5 10
Cha
nge
1-in
-10-
year
net
cat
astr
ophe
loss
ver
sus
ex
pect
ed P
BT
excl
udin
g ca
tast
roph
e lo
ss (%
poi
nt)
Change 1-in-250-year net catastrophe loss versus reported shareholders’ equity (% point)
Chart 6: Risk Positions Have Shifted As Larger ReinsurersTake On More Exposure
Since Jan. 1, 2018. PBT: Profit before tax. Source: S&P Global Ratings.
Copyright © 2019 by Standard & Poor's Financial Services LLC. All rights reserved.
Midsize global reinsurers
Large global reinsurers
Other reinsurers
Individual reinsurer
Peer group
0
2
4
6
8
10
12
14
16
18
0 1 2 3 4 5 6 7 8 9 10 11 12 13 14 15 16 17 18 19 20 21 22 2018
ann
ual n
et c
atas
trop
he lo
ss a
gain
st y
ear-
end
201
7 to
tal r
epor
ted
shar
ehol
ders
’ equ
ity
(%)
S&P Global relative catastrophe benchmark (ranking from least to most exposed left to right)
Chart 7: S&P Global Rating’s Relative Catastrophe BenchmarkPerformed Well In 2018
Bubble size shows 2018 annual net catastrophe loss against 2018 actualprofit before tax (excluding cat).
Source: S&P Global Ratings. Copyright © 2019 by Standard & Poor's Financial Services LLC. All rights reserved.
Arch
Markel
Qatar Re Argo
Fairfax
Hiscox
Alleghany
Hannover Re AXIS
Swiss Re PartnerRe
Munich Re
SCOR
Aspen
Everest Re
RenaissanceRe Sirius
Lancashire
Lloyd’s
0
10
20
30
40
50
60
70
80
90
0 10 20 30 40 50 60 70 80 90
2019
(rec
over
ies
as p
erce
ntag
e of
1-
in-2
50-y
ear
gros
s ex
posu
re)
2018 (recoveries as percentage of 1-in-250-year gross exposure)
Chart 8: Property Catastrophe Reinsurance Utilization At A 1-In-250-Year Level Is Broadly Flat
From Jan. 1, 2018 to Jan. 1, 2019. Copyright © 2019 by Standard & Poor's Financial Services LLC. All rights reserved.
Other reinsurersMidsize global reinsurers
Large global reinsurers
Peer average
Individual reinsurer
Peer group
Peer average
71.6 30.0 11.4
(16.2)22.0
11.3 (19.7) (35.7) (44.1) (58.1)
0
20
40
60
80
100
120
Surplu
s BBB
Surplu
s A
Surplu
s AA
Deficit AAA
Expected PBT 2019
2019 cat budget
1-in-1
0-year l
oss
1-in-5
0-year l
oss
1-in-1
00-year l
oss
1-in-2
50-year l
oss
Bil.
$
Chart 9: The Industry’s Capital Surplus Suggests It Would Be Resilient To Stress Scenarios
Aggregate figures for the top 20 reinsurers at year-end 2018. PBT: Profit before tax. Source: S&P Global Ratings estimates.
Copyright © 2019 by Standard & Poor’s Financial Services LLC. All rights reserved.
(3.0)
(2.5)
(2.0)
(1.5)
(1.0)
(0.5)
0.0
0.5
1.0
1.5
Lloyd’s
Lancashire
Aspen
Everest R
e
Alleghany
Munich R
e
AXIS
SCOR
Qatar R
e
SwissRe
Hiscox
Fairfax
Argo
Arch
PartnerR
e
Hannover Re
Sirius
RenRe
Mark
el
Chart 10: Strong Profits Offer Resilience, Even If The IndustryLost $100 Billion*
*Future experience may differ, because some reinsurers adjusted their catastropheexposures after the 2017-2018 events.
PBT: Profit before tax. Impact estimate based on 2017-2018 average loss marketshares for the top-20 global reinsurers.
Source: S&P Global Ratings. Copyright © 2019 by Standard & Poor's Financial Services LLC. All rights reserved.
Rel
ativ
e to
exp
ecte
d 20
19 P
BT
(x)
Expected PBT 2019
PBT post $100 billion aggregate loss
PBT post $150 billion aggregate loss
1 3
1
1
2
3
1
8
4
4
6
12
14
20
(10) (5) 0 5 10 15 20 25
After a 1-in-250-year scenario
After a 1-in-100-year scenario
After a 1-in-50-year scenario
After a 1-in-10-year scenario No notch1 notch2 notches3 notches4 notches
Chart 11: Reinsurer’s Capital Adequacy Could Slip Under Extreme Scenarios
Notch represents a capital adequacy category as per S&P Global Ratings criteria. Data as of Dec. 31, 2018.
Copyright © 2019 by Standard & Poor's Financial Services LLC. All rights reserved.
Companies that would lose notches / Companies that would retain their current capital adequacy
Capital buffers
Capital deficit
Expected profit and cat budget Cat losses
Catastrophe Risk
The magnitude of the 2018 losses—about 50% higher than reinsurers would expect in an average year—
also helped push up prices at the 2019 April and June/July renewals. Property catastrophe rates increased by 15% to 25% on loss-affected accounts.
S&P Global Ratings has noted that reinsurers’ strategic reaction to the price uptick, amid heightened catastrophe activities, has diverged. Most of the top 20 reinsurers chose to increase their exposure relative to capital, to benefit from the slightly improved conditions. A few stuck with defensive measures, allowing their exposure to contract further, as they had in 2018.
On average, reinsurers’ property-catastrophe risk appetite at a 1-in-250-year return period rose to 29% of shareholder equity, but some reinsurers saw reductions of more than five percentage points.
Meanwhile, alternative capital growth seems to have paused, at least temporarily. This did not materially shift reinsurer’s retrocession strategies.
Table 1: Top 20 Global Reinsurers
Group 1: Large global reinsurers Group 2: Midsize global reinsurers Group 3: Other re/insurance group
Hannover Rück SE Alleghany Corp. Arch Capital Group Ltd.
Lloyd’s AXIS Capital Holdings Ltd. Argo Group International Holdings Ltd.
Munich Reinsurance Co. Everest Re Group Ltd. Aspen Insurance Holdings Ltd.
SCOR SE Fairfax Financial Holdings Ltd. China Reinsurance (Group) Corp.
Swiss Reinsurance Co. Ltd. PartnerRe Ltd. Hiscox Insurance Co. Ltd.
RenaissanceRe Holdings Ltd. Lancashire Holdings Ltd.
Markel Corp.
Qatar Insurance Co. S.A.Q.
Sirius International Group Ltd.
“Although global reinsurers’ have maintained their underwriting discipline, we expect earnings volatility could be higher than historically observed, where exposure has increased.”
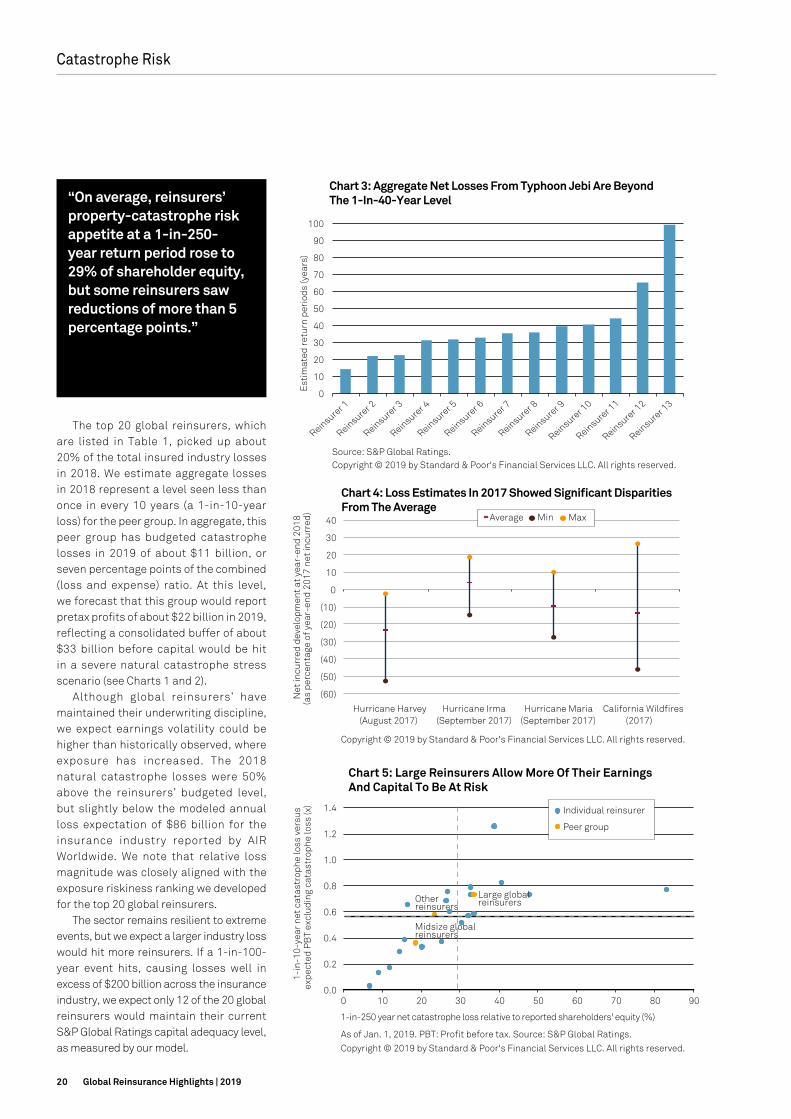
20 Global Reinsurance Highlights | 2019
Catastrophe Risk
The top 20 global reinsurers, which are listed in Table 1, picked up about 20% of the total insured industry losses in 2018. We estimate aggregate losses in 2018 represent a level seen less than once in every 10 years (a 1-in-10-year loss) for the peer group. In aggregate, this peer group has budgeted catastrophe losses in 2019 of about $11 billion, or seven percentage points of the combined (loss and expense) ratio. At this level, we forecast that this group would report pretax profits of about $22 billion in 2019, reflecting a consolidated buffer of about $33 billion before capital would be hit in a severe natural catastrophe stress scenario (see Charts 1 and 2).
Although global reinsurers’ have maintained their underwriting discipline, we expect earnings volatility could be higher than historically observed, where exposure has increased. The 2018 natural catastrophe losses were 50% above the reinsurers’ budgeted level, but slightly below the modeled annual loss expectation of $86 billion for the insurance industry reported by AIR Worldwide. We note that relative loss magnitude was closely aligned with the exposure riskiness ranking we developed for the top 20 global reinsurers.
The sector remains resilient to extreme events, but we expect a larger industry loss would hit more reinsurers. If a 1-in-100-year event hits, causing losses well in excess of $200 billion across the insurance industry, we expect only 12 of the 20 global reinsurers would maintain their current S&P Global Ratings capital adequacy level, as measured by our model.
1
10
100
1,000
0 10 20 30 40 50 60 70 80
Ret
urn
peri
od in
yea
r (lo
g sc
ale)
Modeled net loss (bil. $)
Chart 1: 2018 Catastrophe Losses Were Below The 1-In-10-Year Level
Source: S&P Global Ratings estimates for the top 20 global reinsurers.
Copyright © 2019 by Standard & Poor's Financial Services LLC. All rights reserved.
2011
2017
2010
2012 2016
2013 2014 2015
2018
Natural catastrophe netexposure estimate
Actual annual aggregate net catastrophe loss (restated for premium growth)
Annual expected net loss
16
34
12
8 5 5
9
28
15
0
5
10
15
20
25
30
35
0
5
10
15
20
25
30
35
2010 2011 2012 2013 2014 2015 2016 2017 2018
Top 20 loss market share (%
)
Act
ual n
et lo
ss (m
il. $
)
Chart 2: The Top 20 Global Reinsurers Typically Take 20%Of Total Industry Losses
Source: Swiss Re Sigma, S&P Global Ratings. Copyright © 2019 by Standard & Poor's Financial Services LLC. All rights reserved.
0
10
20
30
40
50
60
70
80
90
100
Reinsurer 1
Reinsurer 2
Reinsurer 3
Reinsurer 4
Reinsurer 5
Reinsurer 6
Reinsurer 7
Reinsurer 8
Reinsurer 9
Reinsurer 1
0
Reinsurer 1
1
Reinsurer 1
2
Reinsurer 1
3
Est
imat
ed r
etur
n pe
riod
s (y
ears
)
Chart 3: Aggregate Net Losses From Typhoon Jebi Are BeyondThe 1-In-40-Year Level
Source: S&P Global Ratings. Copyright © 2019 by Standard & Poor's Financial Services LLC. All rights reserved.
(60)
(50)
(40)
(30)
(20)
(10)
0
10
20
30
40
Hurricane Harvey (August 2017)
Hurricane Irma (September 2017)
Hurricane Maria (September 2017)
California Wildfires (2017)
Net
incu
rred
dev
elop
men
t at y
ear-
end
2018
(a
s pe
rcen
tage
of y
ear-
end
2017
net
incu
rred
)
Chart 4: Loss Estimates In 2017 Showed Significant DisparitiesFrom The Average
Copyright © 2019 by Standard & Poor's Financial Services LLC. All rights reserved.
Average Min Max
Actual annual aggregate net catastrophe loss (restated for premium growth)
Top 20 loss market share
0.0
0.2
0.4
0.6
0.8
1.0
1.2
1.4
0 10 20 30 40 50 60 70 80 90
1-in
-10-
year
net
cat
astr
ophe
loss
ver
sus
ex
pect
ed P
BT
excl
udin
g ca
tast
roph
e lo
ss (x
)
1-in-250 year net catastrophe loss relative to reported shareholders' equity (%)
Chart 5: Large Reinsurers Allow More Of Their EarningsAnd Capital To Be At Risk
As of Jan. 1, 2019. PBT: Profit before tax. Source: S&P Global Ratings.
Copyright © 2019 by Standard & Poor's Financial Services LLC. All rights reserved.
Large global reinsurers Other
reinsurers
Midsize global reinsurers
Individual reinsurer
Peer group
(25)
(20)
(15)
(10)
(5)
0
5
10
15
20
(15) (10) (5) 0 5 10
Cha
nge
1-in
-10-
year
net
cat
astr
ophe
loss
ver
sus
ex
pect
ed P
BT
excl
udin
g ca
tast
roph
e lo
ss (%
poi
nt)
Change 1-in-250-year net catastrophe loss versus reported shareholders’ equity (% point)
Chart 6: Risk Positions Have Shifted As Larger ReinsurersTake On More Exposure
Since Jan. 1, 2018. PBT: Profit before tax. Source: S&P Global Ratings.
Copyright © 2019 by Standard & Poor's Financial Services LLC. All rights reserved.
Midsize global reinsurers
Large global reinsurers
Other reinsurers
Individual reinsurer
Peer group
0
2
4
6
8
10
12
14
16
18
0 1 2 3 4 5 6 7 8 9 10 11 12 13 14 15 16 17 18 19 20 21 22 2018
ann
ual n
et c
atas
trop
he lo
ss a
gain
st y
ear-
end
201
7 to
tal r
epor
ted
shar
ehol
ders
’ equ
ity
(%)
S&P Global relative catastrophe benchmark (ranking from least to most exposed left to right)
Chart 7: S&P Global Rating’s Relative Catastrophe BenchmarkPerformed Well In 2018
Bubble size shows 2018 annual net catastrophe loss against 2018 actualprofit before tax (excluding cat).
Source: S&P Global Ratings. Copyright © 2019 by Standard & Poor's Financial Services LLC. All rights reserved.
Arch
Markel
Qatar Re Argo
Fairfax
Hiscox
Alleghany
Hannover Re AXIS
Swiss Re PartnerRe
Munich Re
SCOR
Aspen
Everest Re
RenaissanceRe Sirius
Lancashire
Lloyd’s
0
10
20
30
40
50
60
70
80
90
0 10 20 30 40 50 60 70 80 90
2019
(rec
over
ies
as p
erce
ntag
e of
1-
in-2
50-y
ear
gros
s ex
posu
re)
2018 (recoveries as percentage of 1-in-250-year gross exposure)
Chart 8: Property Catastrophe Reinsurance Utilization At A 1-In-250-Year Level Is Broadly Flat
From Jan. 1, 2018 to Jan. 1, 2019. Copyright © 2019 by Standard & Poor's Financial Services LLC. All rights reserved.
Other reinsurersMidsize global reinsurers
Large global reinsurers
Peer average
Individual reinsurer
Peer group
Peer average
71.6 30.0 11.4
(16.2)22.0
11.3 (19.7) (35.7) (44.1) (58.1)
0
20
40
60
80
100
120
Surplu
s BBB
Surplu
s A
Surplu
s AA
Deficit AAA
Expected PBT 2019
2019 cat budget
1-in-1
0-year l
oss
1-in-5
0-year l
oss
1-in-1
00-year l
oss
1-in-2
50-year l
oss
Bil.
$
Chart 9: The Industry’s Capital Surplus Suggests It Would Be Resilient To Stress Scenarios
Aggregate figures for the top 20 reinsurers at year-end 2018. PBT: Profit before tax. Source: S&P Global Ratings estimates.
Copyright © 2019 by Standard & Poor’s Financial Services LLC. All rights reserved.
(3.0)
(2.5)
(2.0)
(1.5)
(1.0)
(0.5)
0.0
0.5
1.0
1.5
Lloyd’s
Lancashire
Aspen
Everest R
e
Alleghany
Munich R
e
AXIS
SCOR
Qatar R
e
SwissRe
Hiscox
Fairfax
Argo
Arch
PartnerR
e
Hannover Re
Sirius
RenRe
Mark
el
Chart 10: Strong Profits Offer Resilience, Even If The IndustryLost $100 Billion*
*Future experience may differ, because some reinsurers adjusted their catastropheexposures after the 2017-2018 events.
PBT: Profit before tax. Impact estimate based on 2017-2018 average loss marketshares for the top-20 global reinsurers.
Source: S&P Global Ratings. Copyright © 2019 by Standard & Poor's Financial Services LLC. All rights reserved.
Rel
ativ
e to
exp
ecte
d 20
19 P
BT
(x)
Expected PBT 2019
PBT post $100 billion aggregate loss
PBT post $150 billion aggregate loss
1 3
1
1
2
3
1
8
4
4
6
12
14
20
(10) (5) 0 5 10 15 20 25
After a 1-in-250-year scenario
After a 1-in-100-year scenario
After a 1-in-50-year scenario
After a 1-in-10-year scenario No notch1 notch2 notches3 notches4 notches
Chart 11: Reinsurer’s Capital Adequacy Could Slip Under Extreme Scenarios
Notch represents a capital adequacy category as per S&P Global Ratings criteria. Data as of Dec. 31, 2018.
Copyright © 2019 by Standard & Poor's Financial Services LLC. All rights reserved.
Companies that would lose notches / Companies that would retain their current capital adequacy
Capital buffers
Capital deficit
Expected profit and cat budget Cat losses
1
10
100
1,000
0 10 20 30 40 50 60 70 80
Ret
urn
peri
od in
yea
r (lo
g sc
ale)
Modeled net loss (bil. $)
Chart 1: 2018 Catastrophe Losses Were Below The 1-In-10-Year Level
Source: S&P Global Ratings estimates for the top 20 global reinsurers.
Copyright © 2019 by Standard & Poor's Financial Services LLC. All rights reserved.
2011
2017
2010
2012 2016
2013 2014 2015
2018
Natural catastrophe netexposure estimate
Actual annual aggregate net catastrophe loss (restated for premium growth)
Annual expected net loss
16
34
12
8 5 5
9
28
15
0
5
10
15
20
25
30
35
0
5
10
15
20
25
30
35
2010 2011 2012 2013 2014 2015 2016 2017 2018
Top 20 loss market share (%
)
Act
ual n
et lo
ss (m
il. $
)
Chart 2: The Top 20 Global Reinsurers Typically Take 20%Of Total Industry Losses
Source: Swiss Re Sigma, S&P Global Ratings. Copyright © 2019 by Standard & Poor's Financial Services LLC. All rights reserved.
0
10
20
30
40
50
60
70
80
90
100
Reinsurer 1
Reinsurer 2
Reinsurer 3
Reinsurer 4
Reinsurer 5
Reinsurer 6
Reinsurer 7
Reinsurer 8
Reinsurer 9
Reinsurer 1
0
Reinsurer 1
1
Reinsurer 1
2
Reinsurer 1
3
Est
imat
ed r
etur
n pe
riod
s (y
ears
)
Chart 3: Aggregate Net Losses From Typhoon Jebi Are BeyondThe 1-In-40-Year Level
Source: S&P Global Ratings. Copyright © 2019 by Standard & Poor's Financial Services LLC. All rights reserved.
(60)
(50)
(40)
(30)
(20)
(10)
0
10
20
30
40
Hurricane Harvey (August 2017)
Hurricane Irma (September 2017)
Hurricane Maria (September 2017)
California Wildfires (2017)
Net
incu
rred
dev
elop
men
t at y
ear-
end
2018
(a
s pe
rcen
tage
of y
ear-
end
2017
net
incu
rred
)
Chart 4: Loss Estimates In 2017 Showed Significant DisparitiesFrom The Average
Copyright © 2019 by Standard & Poor's Financial Services LLC. All rights reserved.
Average Min Max
Actual annual aggregate net catastrophe loss (restated for premium growth)
Top 20 loss market share
0.0
0.2
0.4
0.6
0.8
1.0
1.2
1.4
0 10 20 30 40 50 60 70 80 90
1-in
-10-
year
net
cat
astr
ophe
loss
ver
sus
ex
pect
ed P
BT
excl
udin
g ca
tast
roph
e lo
ss (x
)
1-in-250 year net catastrophe loss relative to reported shareholders' equity (%)
Chart 5: Large Reinsurers Allow More Of Their EarningsAnd Capital To Be At Risk
As of Jan. 1, 2019. PBT: Profit before tax. Source: S&P Global Ratings.
Copyright © 2019 by Standard & Poor's Financial Services LLC. All rights reserved.
Large global reinsurers Other
reinsurers
Midsize global reinsurers
Individual reinsurer
Peer group
(25)
(20)
(15)
(10)
(5)
0
5
10
15
20
(15) (10) (5) 0 5 10
Cha
nge
1-in
-10-
year
net
cat
astr
ophe
loss
ver
sus
ex
pect
ed P
BT
excl
udin
g ca
tast
roph
e lo
ss (%
poi
nt)
Change 1-in-250-year net catastrophe loss versus reported shareholders’ equity (% point)
Chart 6: Risk Positions Have Shifted As Larger ReinsurersTake On More Exposure
Since Jan. 1, 2018. PBT: Profit before tax. Source: S&P Global Ratings.
Copyright © 2019 by Standard & Poor's Financial Services LLC. All rights reserved.
Midsize global reinsurers
Large global reinsurers
Other reinsurers
Individual reinsurer
Peer group
0
2
4
6
8
10
12
14
16
18
0 1 2 3 4 5 6 7 8 9 10 11 12 13 14 15 16 17 18 19 20 21 22 2018
ann
ual n
et c
atas
trop
he lo
ss a
gain
st y
ear-
end
201
7 to
tal r
epor
ted
shar
ehol
ders
’ equ
ity
(%)
S&P Global relative catastrophe benchmark (ranking from least to most exposed left to right)
Chart 7: S&P Global Rating’s Relative Catastrophe BenchmarkPerformed Well In 2018
Bubble size shows 2018 annual net catastrophe loss against 2018 actualprofit before tax (excluding cat).
Source: S&P Global Ratings. Copyright © 2019 by Standard & Poor's Financial Services LLC. All rights reserved.
Arch
Markel
Qatar Re Argo
Fairfax
Hiscox
Alleghany
Hannover Re AXIS
Swiss Re PartnerRe
Munich Re
SCOR
Aspen
Everest Re
RenaissanceRe Sirius
Lancashire
Lloyd’s
0
10
20
30
40
50
60
70
80
90
0 10 20 30 40 50 60 70 80 90
2019
(rec
over
ies
as p
erce
ntag
e of
1-
in-2
50-y
ear
gros
s ex
posu
re)
2018 (recoveries as percentage of 1-in-250-year gross exposure)
Chart 8: Property Catastrophe Reinsurance Utilization At A 1-In-250-Year Level Is Broadly Flat
From Jan. 1, 2018 to Jan. 1, 2019. Copyright © 2019 by Standard & Poor's Financial Services LLC. All rights reserved.
Other reinsurersMidsize global reinsurers
Large global reinsurers
Peer average
Individual reinsurer
Peer group
Peer average
71.6 30.0 11.4
(16.2)22.0
11.3 (19.7) (35.7) (44.1) (58.1)
0
20
40
60
80
100
120
Surplu
s BBB
Surplu
s A
Surplu
s AA
Deficit AAA
Expected PBT 2019
2019 cat budget
1-in-1
0-year l
oss
1-in-5
0-year l
oss
1-in-1
00-year l
oss
1-in-2
50-year l
oss
Bil.
$
Chart 9: The Industry’s Capital Surplus Suggests It Would Be Resilient To Stress Scenarios
Aggregate figures for the top 20 reinsurers at year-end 2018. PBT: Profit before tax. Source: S&P Global Ratings estimates.
Copyright © 2019 by Standard & Poor’s Financial Services LLC. All rights reserved.
(3.0)
(2.5)
(2.0)
(1.5)
(1.0)
(0.5)
0.0
0.5
1.0
1.5
Lloyd’s
Lancashire
Aspen
Everest R
e
Alleghany
Munich R
e
AXIS
SCOR
Qatar R
e
SwissRe
Hiscox
Fairfax
Argo
Arch
PartnerR
e
Hannover Re
Sirius
RenRe
Mark
el
Chart 10: Strong Profits Offer Resilience, Even If The IndustryLost $100 Billion*
*Future experience may differ, because some reinsurers adjusted their catastropheexposures after the 2017-2018 events.
PBT: Profit before tax. Impact estimate based on 2017-2018 average loss marketshares for the top-20 global reinsurers.
Source: S&P Global Ratings. Copyright © 2019 by Standard & Poor's Financial Services LLC. All rights reserved.
Rel
ativ
e to
exp
ecte
d 20
19 P
BT
(x)
Expected PBT 2019
PBT post $100 billion aggregate loss
PBT post $150 billion aggregate loss
1 3
1
1
2
3
1
8
4
4
6
12
14
20
(10) (5) 0 5 10 15 20 25
After a 1-in-250-year scenario
After a 1-in-100-year scenario
After a 1-in-50-year scenario
After a 1-in-10-year scenario No notch1 notch2 notches3 notches4 notches
Chart 11: Reinsurer’s Capital Adequacy Could Slip Under Extreme Scenarios
Notch represents a capital adequacy category as per S&P Global Ratings criteria. Data as of Dec. 31, 2018.
Copyright © 2019 by Standard & Poor's Financial Services LLC. All rights reserved.
Companies that would lose notches / Companies that would retain their current capital adequacy
Capital buffers
Capital deficit
Expected profit and cat budget Cat losses
“On average, reinsurers’ property-catastrophe risk appetite at a 1-in-250-year return period rose to 29% of shareholder equity, but some reinsurers saw reductions of more than 5 percentage points.”
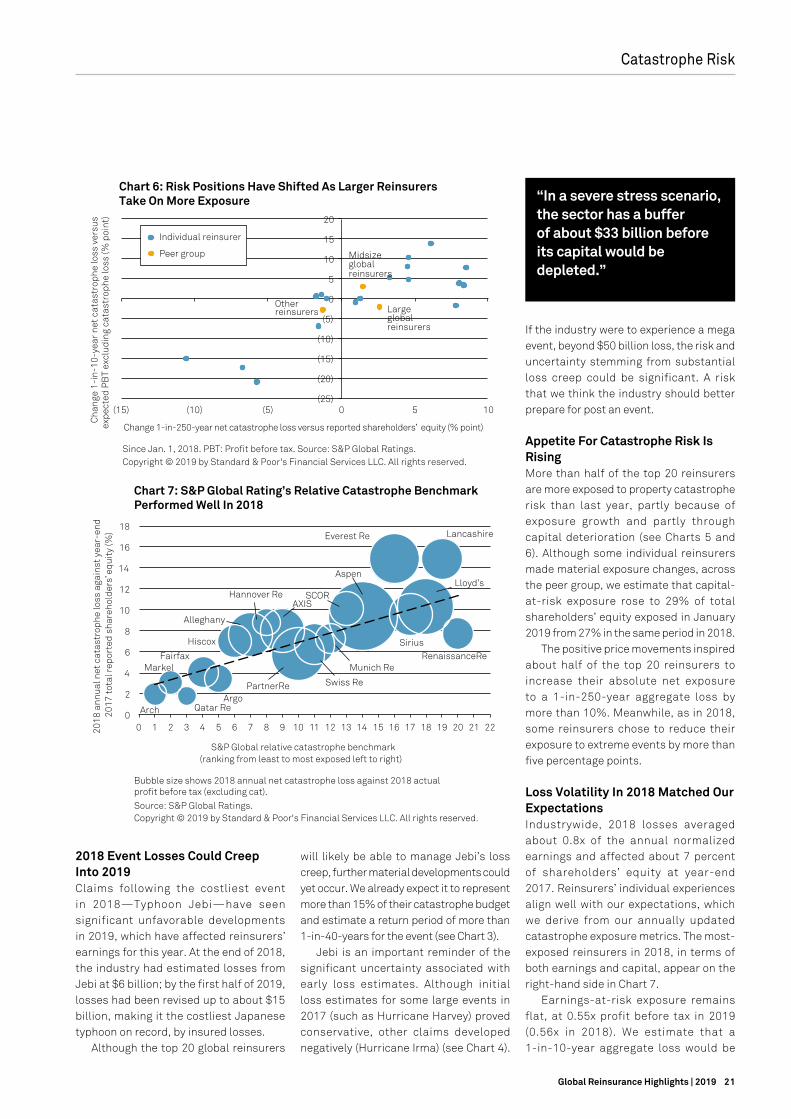
21Global Reinsurance Highlights | 2019
2018 Event Losses Could Creep Into 2019Claims following the costliest event in 2018—Typhoon Jebi—have seen significant unfavorable developments in 2019, which have affected reinsurers’ earnings for this year. At the end of 2018, the industry had estimated losses from Jebi at $6 billion; by the first half of 2019, losses had been revised up to about $15 billion, making it the costliest Japanese typhoon on record, by insured losses.
Although the top 20 global reinsurers
will likely be able to manage Jebi’s loss creep, further material developments could yet occur. We already expect it to represent more than 15% of their catastrophe budget and estimate a return period of more than 1-in-40-years for the event (see Chart 3).
Jebi is an important reminder of the significant uncertainty associated with early loss estimates. Although initial loss estimates for some large events in 2017 (such as Hurricane Harvey) proved conservative, other claims developed negatively (Hurricane Irma) (see Chart 4).
If the industry were to experience a mega event, beyond $50 billion loss, the risk and uncertainty stemming from substantial loss creep could be significant. A risk that we think the industry should better prepare for post an event.
Appetite For Catastrophe Risk Is RisingMore than half of the top 20 reinsurers are more exposed to property catastrophe risk than last year, partly because of exposure growth and partly through capital deterioration (see Charts 5 and 6). Although some individual reinsurers made material exposure changes, across the peer group, we estimate that capital-at-risk exposure rose to 29% of total shareholders’ equity exposed in January 2019 from 27% in the same period in 2018.
The positive price movements inspired about half of the top 20 reinsurers to increase their absolute net exposure to a 1-in-250-year aggregate loss by more than 10%. Meanwhile, as in 2018, some reinsurers chose to reduce their exposure to extreme events by more than five percentage points.
Loss Volatility In 2018 Matched Our ExpectationsIndustrywide, 2018 losses averaged about 0.8x of the annual normalized earnings and affected about 7 percent of shareholders’ equity at year-end 2017. Reinsurers’ individual experiences align well with our expectations, which we derive from our annually updated catastrophe exposure metrics. The most-exposed reinsurers in 2018, in terms of both earnings and capital, appear on the right-hand side in Chart 7.
Earnings-at-risk exposure remains flat, at 0.55x profit before tax in 2019 (0.56x in 2018). We estimate that a 1-in-10-year aggregate loss would be
Catastrophe Risk
“In a severe stress scenario, the sector has a bufferof about $33 billion before its capital would be depleted.”
1
10
100
1,000
0 10 20 30 40 50 60 70 80
Ret
urn
peri
od in
yea
r (lo
g sc
ale)
Modeled net loss (bil. $)
Chart 1: 2018 Catastrophe Losses Were Below The 1-In-10-Year Level
Source: S&P Global Ratings estimates for the top 20 global reinsurers.
Copyright © 2019 by Standard & Poor's Financial Services LLC. All rights reserved.
2011
2017
2010
2012 2016
2013 2014 2015
2018
Natural catastrophe netexposure estimate
Actual annual aggregate net catastrophe loss (restated for premium growth)
Annual expected net loss
16
34
12
8 5 5
9
28
15
0
5
10
15
20
25
30
35
0
5
10
15
20
25
30
35
2010 2011 2012 2013 2014 2015 2016 2017 2018
Top 20 loss market share (%
)
Act
ual n
et lo
ss (m
il. $
)
Chart 2: The Top 20 Global Reinsurers Typically Take 20%Of Total Industry Losses
Source: Swiss Re Sigma, S&P Global Ratings. Copyright © 2019 by Standard & Poor's Financial Services LLC. All rights reserved.
0
10
20
30
40
50
60
70
80
90
100
Reinsurer 1
Reinsurer 2
Reinsurer 3
Reinsurer 4
Reinsurer 5
Reinsurer 6
Reinsurer 7
Reinsurer 8
Reinsurer 9
Reinsurer 1
0
Reinsurer 1
1
Reinsurer 1
2
Reinsurer 1
3
Est
imat
ed r
etur
n pe
riod
s (y
ears
)
Chart 3: Aggregate Net Losses From Typhoon Jebi Are BeyondThe 1-In-40-Year Level
Source: S&P Global Ratings. Copyright © 2019 by Standard & Poor's Financial Services LLC. All rights reserved.
(60)
(50)
(40)
(30)
(20)
(10)
0
10
20
30
40
Hurricane Harvey (August 2017)
Hurricane Irma (September 2017)
Hurricane Maria (September 2017)
California Wildfires (2017)
Net
incu
rred
dev
elop
men
t at y
ear-
end
2018
(a
s pe
rcen
tage
of y
ear-
end
2017
net
incu
rred
)
Chart 4: Loss Estimates In 2017 Showed Significant DisparitiesFrom The Average
Copyright © 2019 by Standard & Poor's Financial Services LLC. All rights reserved.
Average Min Max
Actual annual aggregate net catastrophe loss (restated for premium growth)
Top 20 loss market share
0.0
0.2
0.4
0.6
0.8
1.0
1.2
1.4
0 10 20 30 40 50 60 70 80 90
1-in
-10-
year
net
cat
astr
ophe
loss
ver
sus
ex
pect
ed P
BT
excl
udin
g ca
tast
roph
e lo
ss (x
)
1-in-250 year net catastrophe loss relative to reported shareholders' equity (%)
Chart 5: Large Reinsurers Allow More Of Their EarningsAnd Capital To Be At Risk
As of Jan. 1, 2019. PBT: Profit before tax. Source: S&P Global Ratings.
Copyright © 2019 by Standard & Poor's Financial Services LLC. All rights reserved.
Large global reinsurers Other
reinsurers
Midsize global reinsurers
Individual reinsurer
Peer group
(25)
(20)
(15)
(10)
(5)
0
5
10
15
20
(15) (10) (5) 0 5 10
Cha
nge
1-in
-10-
year
net
cat
astr
ophe
loss
ver
sus
ex
pect
ed P
BT
excl
udin
g ca
tast
roph
e lo
ss (%
poi
nt)
Change 1-in-250-year net catastrophe loss versus reported shareholders’ equity (% point)
Chart 6: Risk Positions Have Shifted As Larger ReinsurersTake On More Exposure
Since Jan. 1, 2018. PBT: Profit before tax. Source: S&P Global Ratings.
Copyright © 2019 by Standard & Poor's Financial Services LLC. All rights reserved.
Midsize global reinsurers
Large global reinsurers
Other reinsurers
Individual reinsurer
Peer group
0
2
4
6
8
10
12
14
16
18
0 1 2 3 4 5 6 7 8 9 10 11 12 13 14 15 16 17 18 19 20 21 22 2018
ann
ual n
et c
atas
trop
he lo
ss a
gain
st y
ear-
end
201
7 to
tal r
epor
ted
shar
ehol
ders
’ equ
ity
(%)
S&P Global relative catastrophe benchmark (ranking from least to most exposed left to right)
Chart 7: S&P Global Rating’s Relative Catastrophe BenchmarkPerformed Well In 2018
Bubble size shows 2018 annual net catastrophe loss against 2018 actualprofit before tax (excluding cat).
Source: S&P Global Ratings. Copyright © 2019 by Standard & Poor's Financial Services LLC. All rights reserved.
Arch
Markel
Qatar Re Argo
Fairfax
Hiscox
Alleghany
Hannover Re AXIS
Swiss Re PartnerRe
Munich Re
SCOR
Aspen
Everest Re
RenaissanceRe Sirius
Lancashire
Lloyd’s
0
10
20
30
40
50
60
70
80
90
0 10 20 30 40 50 60 70 80 90
2019
(rec
over
ies
as p
erce
ntag
e of
1-
in-2
50-y
ear
gros
s ex
posu
re)
2018 (recoveries as percentage of 1-in-250-year gross exposure)
Chart 8: Property Catastrophe Reinsurance Utilization At A 1-In-250-Year Level Is Broadly Flat
From Jan. 1, 2018 to Jan. 1, 2019. Copyright © 2019 by Standard & Poor's Financial Services LLC. All rights reserved.
Other reinsurersMidsize global reinsurers
Large global reinsurers
Peer average
Individual reinsurer
Peer group
Peer average
71.6 30.0 11.4
(16.2)22.0
11.3 (19.7) (35.7) (44.1) (58.1)
0
20
40
60
80
100
120
Surplu
s BBB
Surplu
s A
Surplu
s AA
Deficit AAA
Expected PBT 2019
2019 cat budget
1-in-1
0-year l
oss
1-in-5
0-year l
oss
1-in-1
00-year l
oss
1-in-2
50-year l
oss
Bil.
$
Chart 9: The Industry’s Capital Surplus Suggests It Would Be Resilient To Stress Scenarios
Aggregate figures for the top 20 reinsurers at year-end 2018. PBT: Profit before tax. Source: S&P Global Ratings estimates.
Copyright © 2019 by Standard & Poor’s Financial Services LLC. All rights reserved.
(3.0)
(2.5)
(2.0)
(1.5)
(1.0)
(0.5)
0.0
0.5
1.0
1.5
Lloyd’s
Lancashire
Aspen
Everest R
e
Alleghany
Munich R
e
AXIS
SCOR
Qatar R
e
SwissRe
Hiscox
Fairfax
Argo
Arch
PartnerR
e
Hannover Re
Sirius
RenRe
Mark
el
Chart 10: Strong Profits Offer Resilience, Even If The IndustryLost $100 Billion*
*Future experience may differ, because some reinsurers adjusted their catastropheexposures after the 2017-2018 events.
PBT: Profit before tax. Impact estimate based on 2017-2018 average loss marketshares for the top-20 global reinsurers.
Source: S&P Global Ratings. Copyright © 2019 by Standard & Poor's Financial Services LLC. All rights reserved.
Rel
ativ
e to
exp
ecte
d 20
19 P
BT
(x)
Expected PBT 2019
PBT post $100 billion aggregate loss
PBT post $150 billion aggregate loss
1 3
1
1
2
3
1
8
4
4
6
12
14
20
(10) (5) 0 5 10 15 20 25
After a 1-in-250-year scenario
After a 1-in-100-year scenario
After a 1-in-50-year scenario
After a 1-in-10-year scenario No notch1 notch2 notches3 notches4 notches
Chart 11: Reinsurer’s Capital Adequacy Could Slip Under Extreme Scenarios
Notch represents a capital adequacy category as per S&P Global Ratings criteria. Data as of Dec. 31, 2018.
Copyright © 2019 by Standard & Poor's Financial Services LLC. All rights reserved.
Companies that would lose notches / Companies that would retain their current capital adequacy
Capital buffers
Capital deficit
Expected profit and cat budget Cat losses
1
10
100
1,000
0 10 20 30 40 50 60 70 80
Ret
urn
peri
od in
yea
r (lo
g sc
ale)
Modeled net loss (bil. $)
Chart 1: 2018 Catastrophe Losses Were Below The 1-In-10-Year Level
Source: S&P Global Ratings estimates for the top 20 global reinsurers.
Copyright © 2019 by Standard & Poor's Financial Services LLC. All rights reserved.
2011
2017
2010
2012 2016
2013 2014 2015
2018
Natural catastrophe netexposure estimate
Actual annual aggregate net catastrophe loss (restated for premium growth)
Annual expected net loss
16
34
12
8 5 5
9
28
15
0
5
10
15
20
25
30
35
0
5
10
15
20
25
30
35
2010 2011 2012 2013 2014 2015 2016 2017 2018
Top 20 loss market share (%
)
Act
ual n
et lo
ss (m
il. $
)
Chart 2: The Top 20 Global Reinsurers Typically Take 20%Of Total Industry Losses
Source: Swiss Re Sigma, S&P Global Ratings. Copyright © 2019 by Standard & Poor's Financial Services LLC. All rights reserved.
0
10
20
30
40
50
60
70
80
90
100
Reinsurer 1
Reinsurer 2
Reinsurer 3
Reinsurer 4
Reinsurer 5
Reinsurer 6
Reinsurer 7
Reinsurer 8
Reinsurer 9
Reinsurer 1
0
Reinsurer 1
1
Reinsurer 1
2
Reinsurer 1
3
Est
imat
ed r
etur
n pe
riod
s (y
ears
)
Chart 3: Aggregate Net Losses From Typhoon Jebi Are BeyondThe 1-In-40-Year Level
Source: S&P Global Ratings. Copyright © 2019 by Standard & Poor's Financial Services LLC. All rights reserved.
(60)
(50)
(40)
(30)
(20)
(10)
0
10
20
30
40
Hurricane Harvey (August 2017)
Hurricane Irma (September 2017)
Hurricane Maria (September 2017)
California Wildfires (2017)
Net
incu
rred
dev
elop
men
t at y
ear-
end
2018
(a
s pe
rcen
tage
of y
ear-
end
2017
net
incu
rred
)
Chart 4: Loss Estimates In 2017 Showed Significant DisparitiesFrom The Average
Copyright © 2019 by Standard & Poor's Financial Services LLC. All rights reserved.
Average Min Max
Actual annual aggregate net catastrophe loss (restated for premium growth)
Top 20 loss market share
0.0
0.2
0.4
0.6
0.8
1.0
1.2
1.4
0 10 20 30 40 50 60 70 80 90
1-in
-10-
year
net
cat
astr
ophe
loss
ver
sus
ex
pect
ed P
BT
excl
udin
g ca
tast
roph
e lo
ss (x
)
1-in-250 year net catastrophe loss relative to reported shareholders' equity (%)
Chart 5: Large Reinsurers Allow More Of Their EarningsAnd Capital To Be At Risk
As of Jan. 1, 2019. PBT: Profit before tax. Source: S&P Global Ratings.
Copyright © 2019 by Standard & Poor's Financial Services LLC. All rights reserved.
Large global reinsurers Other
reinsurers
Midsize global reinsurers
Individual reinsurer
Peer group
(25)
(20)
(15)
(10)
(5)
0
5
10
15
20
(15) (10) (5) 0 5 10
Cha
nge
1-in
-10-
year
net
cat
astr
ophe
loss
ver
sus
ex
pect
ed P
BT
excl
udin
g ca
tast
roph
e lo
ss (%
poi
nt)
Change 1-in-250-year net catastrophe loss versus reported shareholders’ equity (% point)
Chart 6: Risk Positions Have Shifted As Larger ReinsurersTake On More Exposure
Since Jan. 1, 2018. PBT: Profit before tax. Source: S&P Global Ratings.
Copyright © 2019 by Standard & Poor's Financial Services LLC. All rights reserved.
Midsize global reinsurers
Large global reinsurers
Other reinsurers
Individual reinsurer
Peer group
0
2
4
6
8
10
12
14
16
18
0 1 2 3 4 5 6 7 8 9 10 11 12 13 14 15 16 17 18 19 20 21 22 2018
ann
ual n
et c
atas
trop
he lo
ss a
gain
st y
ear-
end
201
7 to
tal r
epor
ted
shar
ehol
ders
’ equ
ity
(%)
S&P Global relative catastrophe benchmark (ranking from least to most exposed left to right)
Chart 7: S&P Global Rating’s Relative Catastrophe BenchmarkPerformed Well In 2018
Bubble size shows 2018 annual net catastrophe loss against 2018 actualprofit before tax (excluding cat).
Source: S&P Global Ratings. Copyright © 2019 by Standard & Poor's Financial Services LLC. All rights reserved.
Arch
Markel
Qatar Re Argo
Fairfax
Hiscox
Alleghany
Hannover Re AXIS
Swiss Re PartnerRe
Munich Re
SCOR
Aspen
Everest Re
RenaissanceRe Sirius
Lancashire
Lloyd’s
0
10
20
30
40
50
60
70
80
90
0 10 20 30 40 50 60 70 80 90
2019
(rec
over
ies
as p
erce
ntag
e of
1-
in-2
50-y
ear
gros
s ex
posu
re)
2018 (recoveries as percentage of 1-in-250-year gross exposure)
Chart 8: Property Catastrophe Reinsurance Utilization At A 1-In-250-Year Level Is Broadly Flat
From Jan. 1, 2018 to Jan. 1, 2019. Copyright © 2019 by Standard & Poor's Financial Services LLC. All rights reserved.
Other reinsurersMidsize global reinsurers
Large global reinsurers
Peer average
Individual reinsurer
Peer group
Peer average
71.6 30.0 11.4
(16.2)22.0
11.3 (19.7) (35.7) (44.1) (58.1)
0
20
40
60
80
100
120
Surplu
s BBB
Surplu
s A
Surplu
s AA
Deficit AAA
Expected PBT 2019
2019 cat budget
1-in-1
0-year l
oss
1-in-5
0-year l
oss
1-in-1
00-year l
oss
1-in-2
50-year l
oss
Bil.
$
Chart 9: The Industry’s Capital Surplus Suggests It Would Be Resilient To Stress Scenarios
Aggregate figures for the top 20 reinsurers at year-end 2018. PBT: Profit before tax. Source: S&P Global Ratings estimates.
Copyright © 2019 by Standard & Poor’s Financial Services LLC. All rights reserved.
(3.0)
(2.5)
(2.0)
(1.5)
(1.0)
(0.5)
0.0
0.5
1.0
1.5
Lloyd’s
Lancashire
Aspen
Everest R
e
Alleghany
Munich R
e
AXIS
SCOR
Qatar R
e
SwissRe
Hiscox
Fairfax
Argo
Arch
PartnerR
e
Hannover Re
Sirius
RenRe
Mark
el
Chart 10: Strong Profits Offer Resilience, Even If The IndustryLost $100 Billion*
*Future experience may differ, because some reinsurers adjusted their catastropheexposures after the 2017-2018 events.
PBT: Profit before tax. Impact estimate based on 2017-2018 average loss marketshares for the top-20 global reinsurers.
Source: S&P Global Ratings. Copyright © 2019 by Standard & Poor's Financial Services LLC. All rights reserved.
Rel
ativ
e to
exp
ecte
d 20
19 P
BT
(x)
Expected PBT 2019
PBT post $100 billion aggregate loss
PBT post $150 billion aggregate loss
1 3
1
1
2
3
1
8
4
4
6
12
14
20
(10) (5) 0 5 10 15 20 25
After a 1-in-250-year scenario
After a 1-in-100-year scenario
After a 1-in-50-year scenario
After a 1-in-10-year scenario No notch1 notch2 notches3 notches4 notches
Chart 11: Reinsurer’s Capital Adequacy Could Slip Under Extreme Scenarios
Notch represents a capital adequacy category as per S&P Global Ratings criteria. Data as of Dec. 31, 2018.
Copyright © 2019 by Standard & Poor's Financial Services LLC. All rights reserved.
Companies that would lose notches / Companies that would retain their current capital adequacy
Capital buffers
Capital deficit
Expected profit and cat budget Cat losses

22 Global Reinsurance Highlights | 2019
Catastrophe Risk
equivalent to global insured losses of about $100 billion. Although the industry would likely report profitable results under this stress level, an aggregate loss of this magnitude would be a capital event for a few of the global reinsurers. This was demonstrated in 2018, when aggregate losses were less severe. Losses from natural catastrophes wiped out earnings for five of the top 20 reinsurers last year.
Retrocession Retains A Vital RoleRetrocession remains a flexible way to shift exposure quickly. Although the market for retrocession has also shown signs of price hardening with significant rate increases, reinsurance utilization by primary reinsurers has been flat.
As of January 1, 2019, insurers were choosing to reinsure about half of their 1-in-250 exposure, on average. We think reinsurers typically take a strategic view of cover over the medium term. Nonetheless, we now see less arbitrage opportunity in buying retrocession than two or three years ago. At that time, reinsurers were seizing the opportunity to access alternative capital, which offered a good spread against the inward exposure.
Consequently, further rate hardening could lead global reinsurers to gradually cede less of their exposure in the future. The average utilization conceals a wide spectrum of coverage (see Chart 8).Buffers Remain Sufficient, For Normal YearsGiven the catastrophe losses of the past two years, we examined the sector’s
earnings and capital resilience to assess what effect further losses might have, at an aggregate level. Based on data from the top 20 reinsurers, we estimate that the sector would post profits before tax of about $22 billion in 2019 if natural catastrophe losses were at the budgeted level of about $11 billion. This represents about seven percentage points of the sector’s combined ratio for 2019.
In a severe stress scenario, this implies that the sector has a buffer of about $33 billion ($22 billion plus $11 billion) before its capital would be depleted, assuming no dividends or other shareholder returns.
For reference, the top 20 companies paid out about $9 billion in dividends and share buybacks in 2018. An earnings or capital event at an individual company
Definitions Used Earnings-at-risk exposure is defined as a 1-in-10-year modeled annual aggregate net loss compared with expected profits before taxes and net catastrophe claims.
Capital-at-risk exposure is defined as a 1-in-250-year modeled annual aggregate net loss against shareholders’ equity as reported (including preference shares).
1
10
100
1,000
0 10 20 30 40 50 60 70 80
Ret
urn
peri
od in
yea
r (lo
g sc
ale)
Modeled net loss (bil. $)
Chart 1: 2018 Catastrophe Losses Were Below The 1-In-10-Year Level
Source: S&P Global Ratings estimates for the top 20 global reinsurers.
Copyright © 2019 by Standard & Poor's Financial Services LLC. All rights reserved.
2011
2017
2010
2012 2016
2013 2014 2015
2018
Natural catastrophe netexposure estimate
Actual annual aggregate net catastrophe loss (restated for premium growth)
Annual expected net loss
16
34
12
8 5 5
9
28
15
0
5
10
15
20
25
30
35
0
5
10
15
20
25
30
35
2010 2011 2012 2013 2014 2015 2016 2017 2018
Top 20 loss market share (%
)
Act
ual n
et lo
ss (m
il. $
)
Chart 2: The Top 20 Global Reinsurers Typically Take 20%Of Total Industry Losses
Source: Swiss Re Sigma, S&P Global Ratings. Copyright © 2019 by Standard & Poor's Financial Services LLC. All rights reserved.
0
10
20
30
40
50
60
70
80
90
100
Reinsurer 1
Reinsurer 2
Reinsurer 3
Reinsurer 4
Reinsurer 5
Reinsurer 6
Reinsurer 7
Reinsurer 8
Reinsurer 9
Reinsurer 1
0
Reinsurer 1
1
Reinsurer 1
2
Reinsurer 1
3
Est
imat
ed r
etur
n pe
riod
s (y
ears
)
Chart 3: Aggregate Net Losses From Typhoon Jebi Are BeyondThe 1-In-40-Year Level
Source: S&P Global Ratings. Copyright © 2019 by Standard & Poor's Financial Services LLC. All rights reserved.
(60)
(50)
(40)
(30)
(20)
(10)
0
10
20
30
40
Hurricane Harvey (August 2017)
Hurricane Irma (September 2017)
Hurricane Maria (September 2017)
California Wildfires (2017)
Net
incu
rred
dev
elop
men
t at y
ear-
end
2018
(a
s pe
rcen
tage
of y
ear-
end
2017
net
incu
rred
)
Chart 4: Loss Estimates In 2017 Showed Significant DisparitiesFrom The Average
Copyright © 2019 by Standard & Poor's Financial Services LLC. All rights reserved.
Average Min Max
Actual annual aggregate net catastrophe loss (restated for premium growth)
Top 20 loss market share
0.0
0.2
0.4
0.6
0.8
1.0
1.2
1.4
0 10 20 30 40 50 60 70 80 90
1-in
-10-
year
net
cat
astr
ophe
loss
ver
sus
ex
pect
ed P
BT
excl
udin
g ca
tast
roph
e lo
ss (x
)
1-in-250 year net catastrophe loss relative to reported shareholders' equity (%)
Chart 5: Large Reinsurers Allow More Of Their EarningsAnd Capital To Be At Risk
As of Jan. 1, 2019. PBT: Profit before tax. Source: S&P Global Ratings.
Copyright © 2019 by Standard & Poor's Financial Services LLC. All rights reserved.
Large global reinsurers Other
reinsurers
Midsize global reinsurers
Individual reinsurer
Peer group
(25)
(20)
(15)
(10)
(5)
0
5
10
15
20
(15) (10) (5) 0 5 10
Cha
nge
1-in
-10-
year
net
cat
astr
ophe
loss
ver
sus
ex
pect
ed P
BT
excl
udin
g ca
tast
roph
e lo
ss (%
poi
nt)
Change 1-in-250-year net catastrophe loss versus reported shareholders’ equity (% point)
Chart 6: Risk Positions Have Shifted As Larger ReinsurersTake On More Exposure
Since Jan. 1, 2018. PBT: Profit before tax. Source: S&P Global Ratings.
Copyright © 2019 by Standard & Poor's Financial Services LLC. All rights reserved.
Midsize global reinsurers
Large global reinsurers
Other reinsurers
Individual reinsurer
Peer group
0
2
4
6
8
10
12
14
16
18
0 1 2 3 4 5 6 7 8 9 10 11 12 13 14 15 16 17 18 19 20 21 22 2018
ann
ual n
et c
atas
trop
he lo
ss a
gain
st y
ear-
end
201
7 to
tal r
epor
ted
shar
ehol
ders
’ equ
ity
(%)
S&P Global relative catastrophe benchmark (ranking from least to most exposed left to right)
Chart 7: S&P Global Rating’s Relative Catastrophe BenchmarkPerformed Well In 2018
Bubble size shows 2018 annual net catastrophe loss against 2018 actualprofit before tax (excluding cat).
Source: S&P Global Ratings. Copyright © 2019 by Standard & Poor's Financial Services LLC. All rights reserved.
Arch
Markel
Qatar Re Argo
Fairfax
Hiscox
Alleghany
Hannover Re AXIS
Swiss Re PartnerRe
Munich Re
SCOR
Aspen
Everest Re
RenaissanceRe Sirius
Lancashire
Lloyd’s
0
10
20
30
40
50
60
70
80
90
0 10 20 30 40 50 60 70 80 90
2019
(rec
over
ies
as p
erce
ntag
e of
1-
in-2
50-y
ear
gros
s ex
posu
re)
2018 (recoveries as percentage of 1-in-250-year gross exposure)
Chart 8: Property Catastrophe Reinsurance Utilization At A 1-In-250-Year Level Is Broadly Flat
From Jan. 1, 2018 to Jan. 1, 2019. Copyright © 2019 by Standard & Poor's Financial Services LLC. All rights reserved.
Other reinsurersMidsize global reinsurers
Large global reinsurers
Peer average
Individual reinsurer
Peer group
Peer average
71.6 30.0 11.4
(16.2)22.0
11.3 (19.7) (35.7) (44.1) (58.1)
0
20
40
60
80
100
120
Surplu
s BBB
Surplu
s A
Surplu
s AA
Deficit AAA
Expected PBT 2019
2019 cat budget
1-in-1
0-year l
oss
1-in-5
0-year l
oss
1-in-1
00-year l
oss
1-in-2
50-year l
oss
Bil.
$
Chart 9: The Industry’s Capital Surplus Suggests It Would Be Resilient To Stress Scenarios
Aggregate figures for the top 20 reinsurers at year-end 2018. PBT: Profit before tax. Source: S&P Global Ratings estimates.
Copyright © 2019 by Standard & Poor’s Financial Services LLC. All rights reserved.
(3.0)
(2.5)
(2.0)
(1.5)
(1.0)
(0.5)
0.0
0.5
1.0
1.5
Lloyd’s
Lancashire
Aspen
Everest R
e
Alleghany
Munich R
e
AXIS
SCOR
Qatar R
e
SwissRe
Hiscox
Fairfax
Argo
Arch
PartnerR
e
Hannover Re
Sirius
RenRe
Mark
el
Chart 10: Strong Profits Offer Resilience, Even If The IndustryLost $100 Billion*
*Future experience may differ, because some reinsurers adjusted their catastropheexposures after the 2017-2018 events.
PBT: Profit before tax. Impact estimate based on 2017-2018 average loss marketshares for the top-20 global reinsurers.
Source: S&P Global Ratings. Copyright © 2019 by Standard & Poor's Financial Services LLC. All rights reserved.
Rel
ativ
e to
exp
ecte
d 20
19 P
BT
(x)
Expected PBT 2019
PBT post $100 billion aggregate loss
PBT post $150 billion aggregate loss
1 3
1
1
2
3
1
8
4
4
6
12
14
20
(10) (5) 0 5 10 15 20 25
After a 1-in-250-year scenario
After a 1-in-100-year scenario
After a 1-in-50-year scenario
After a 1-in-10-year scenario No notch1 notch2 notches3 notches4 notches
Chart 11: Reinsurer’s Capital Adequacy Could Slip Under Extreme Scenarios
Notch represents a capital adequacy category as per S&P Global Ratings criteria. Data as of Dec. 31, 2018.
Copyright © 2019 by Standard & Poor's Financial Services LLC. All rights reserved.
Companies that would lose notches / Companies that would retain their current capital adequacy
Capital buffers
Capital deficit
Expected profit and cat budget Cat losses
1
10
100
1,000
0 10 20 30 40 50 60 70 80
Ret
urn
peri
od in
yea
r (lo
g sc
ale)
Modeled net loss (bil. $)
Chart 1: 2018 Catastrophe Losses Were Below The 1-In-10-Year Level
Source: S&P Global Ratings estimates for the top 20 global reinsurers.
Copyright © 2019 by Standard & Poor's Financial Services LLC. All rights reserved.
2011
2017
2010
2012 2016
2013 2014 2015
2018
Natural catastrophe netexposure estimate
Actual annual aggregate net catastrophe loss (restated for premium growth)
Annual expected net loss
16
34
12
8 5 5
9
28
15
0
5
10
15
20
25
30
35
0
5
10
15
20
25
30
35
2010 2011 2012 2013 2014 2015 2016 2017 2018
Top 20 loss market share (%
)
Act
ual n
et lo
ss (m
il. $
)
Chart 2: The Top 20 Global Reinsurers Typically Take 20%Of Total Industry Losses
Source: Swiss Re Sigma, S&P Global Ratings. Copyright © 2019 by Standard & Poor's Financial Services LLC. All rights reserved.
0
10
20
30
40
50
60
70
80
90
100
Reinsurer 1
Reinsurer 2
Reinsurer 3
Reinsurer 4
Reinsurer 5
Reinsurer 6
Reinsurer 7
Reinsurer 8
Reinsurer 9
Reinsurer 1
0
Reinsurer 1
1
Reinsurer 1
2
Reinsurer 1
3
Est
imat
ed r
etur
n pe
riod
s (y
ears
)
Chart 3: Aggregate Net Losses From Typhoon Jebi Are BeyondThe 1-In-40-Year Level
Source: S&P Global Ratings. Copyright © 2019 by Standard & Poor's Financial Services LLC. All rights reserved.
(60)
(50)
(40)
(30)
(20)
(10)
0
10
20
30
40
Hurricane Harvey (August 2017)
Hurricane Irma (September 2017)
Hurricane Maria (September 2017)
California Wildfires (2017)
Net
incu
rred
dev
elop
men
t at y
ear-
end
2018
(a
s pe
rcen
tage
of y
ear-
end
2017
net
incu
rred
)
Chart 4: Loss Estimates In 2017 Showed Significant DisparitiesFrom The Average
Copyright © 2019 by Standard & Poor's Financial Services LLC. All rights reserved.
Average Min Max
Actual annual aggregate net catastrophe loss (restated for premium growth)
Top 20 loss market share
0.0
0.2
0.4
0.6
0.8
1.0
1.2
1.4
0 10 20 30 40 50 60 70 80 90
1-in
-10-
year
net
cat
astr
ophe
loss
ver
sus
ex
pect
ed P
BT
excl
udin
g ca
tast
roph
e lo
ss (x
)
1-in-250 year net catastrophe loss relative to reported shareholders' equity (%)
Chart 5: Large Reinsurers Allow More Of Their EarningsAnd Capital To Be At Risk
As of Jan. 1, 2019. PBT: Profit before tax. Source: S&P Global Ratings.
Copyright © 2019 by Standard & Poor's Financial Services LLC. All rights reserved.
Large global reinsurers Other
reinsurers
Midsize global reinsurers
Individual reinsurer
Peer group
(25)
(20)
(15)
(10)
(5)
0
5
10
15
20
(15) (10) (5) 0 5 10
Cha
nge
1-in
-10-
year
net
cat
astr
ophe
loss
ver
sus
ex
pect
ed P
BT
excl
udin
g ca
tast
roph
e lo
ss (%
poi
nt)
Change 1-in-250-year net catastrophe loss versus reported shareholders’ equity (% point)
Chart 6: Risk Positions Have Shifted As Larger ReinsurersTake On More Exposure
Since Jan. 1, 2018. PBT: Profit before tax. Source: S&P Global Ratings.
Copyright © 2019 by Standard & Poor's Financial Services LLC. All rights reserved.
Midsize global reinsurers
Large global reinsurers
Other reinsurers
Individual reinsurer
Peer group
0
2
4
6
8
10
12
14
16
18
0 1 2 3 4 5 6 7 8 9 10 11 12 13 14 15 16 17 18 19 20 21 22 2018
ann
ual n
et c
atas
trop
he lo
ss a
gain
st y
ear-
end
201
7 to
tal r
epor
ted
shar
ehol
ders
’ equ
ity
(%)
S&P Global relative catastrophe benchmark (ranking from least to most exposed left to right)
Chart 7: S&P Global Rating’s Relative Catastrophe BenchmarkPerformed Well In 2018
Bubble size shows 2018 annual net catastrophe loss against 2018 actualprofit before tax (excluding cat).
Source: S&P Global Ratings. Copyright © 2019 by Standard & Poor's Financial Services LLC. All rights reserved.
Arch
Markel
Qatar Re Argo
Fairfax
Hiscox
Alleghany
Hannover Re AXIS
Swiss Re PartnerRe
Munich Re
SCOR
Aspen
Everest Re
RenaissanceRe Sirius
Lancashire
Lloyd’s
0
10
20
30
40
50
60
70
80
90
0 10 20 30 40 50 60 70 80 90
2019
(rec
over
ies
as p
erce
ntag
e of
1-
in-2
50-y
ear
gros
s ex
posu
re)
2018 (recoveries as percentage of 1-in-250-year gross exposure)
Chart 8: Property Catastrophe Reinsurance Utilization At A 1-In-250-Year Level Is Broadly Flat
From Jan. 1, 2018 to Jan. 1, 2019. Copyright © 2019 by Standard & Poor's Financial Services LLC. All rights reserved.
Other reinsurersMidsize global reinsurers
Large global reinsurers
Peer average
Individual reinsurer
Peer group
Peer average
71.6 30.0 11.4
(16.2)22.0
11.3 (19.7) (35.7) (44.1) (58.1)
0
20
40
60
80
100
120
Surplu
s BBB
Surplu
s A
Surplu
s AA
Deficit AAA
Expected PBT 2019
2019 cat budget
1-in-1
0-year l
oss
1-in-5
0-year l
oss
1-in-1
00-year l
oss
1-in-2
50-year l
oss
Bil.
$
Chart 9: The Industry’s Capital Surplus Suggests It Would Be Resilient To Stress Scenarios
Aggregate figures for the top 20 reinsurers at year-end 2018. PBT: Profit before tax. Source: S&P Global Ratings estimates.
Copyright © 2019 by Standard & Poor’s Financial Services LLC. All rights reserved.
(3.0)
(2.5)
(2.0)
(1.5)
(1.0)
(0.5)
0.0
0.5
1.0
1.5
Lloyd’s
Lancashire
Aspen
Everest R
e
Alleghany
Munich R
e
AXIS
SCOR
Qatar R
e
SwissRe
Hiscox
Fairfax
Argo
Arch
PartnerR
e
Hannover Re
Sirius
RenRe
Mark
el
Chart 10: Strong Profits Offer Resilience, Even If The IndustryLost $100 Billion*
*Future experience may differ, because some reinsurers adjusted their catastropheexposures after the 2017-2018 events.
PBT: Profit before tax. Impact estimate based on 2017-2018 average loss marketshares for the top-20 global reinsurers.
Source: S&P Global Ratings. Copyright © 2019 by Standard & Poor's Financial Services LLC. All rights reserved.
Rel
ativ
e to
exp
ecte
d 20
19 P
BT
(x)
Expected PBT 2019
PBT post $100 billion aggregate loss
PBT post $150 billion aggregate loss
1 3
1
1
2
3
1
8
4
4
6
12
14
20
(10) (5) 0 5 10 15 20 25
After a 1-in-250-year scenario
After a 1-in-100-year scenario
After a 1-in-50-year scenario
After a 1-in-10-year scenario No notch1 notch2 notches3 notches4 notches
Chart 11: Reinsurer’s Capital Adequacy Could Slip Under Extreme Scenarios
Notch represents a capital adequacy category as per S&P Global Ratings criteria. Data as of Dec. 31, 2018.
Copyright © 2019 by Standard & Poor's Financial Services LLC. All rights reserved.
Companies that would lose notches / Companies that would retain their current capital adequacy
Capital buffers
Capital deficit
Expected profit and cat budget Cat losses
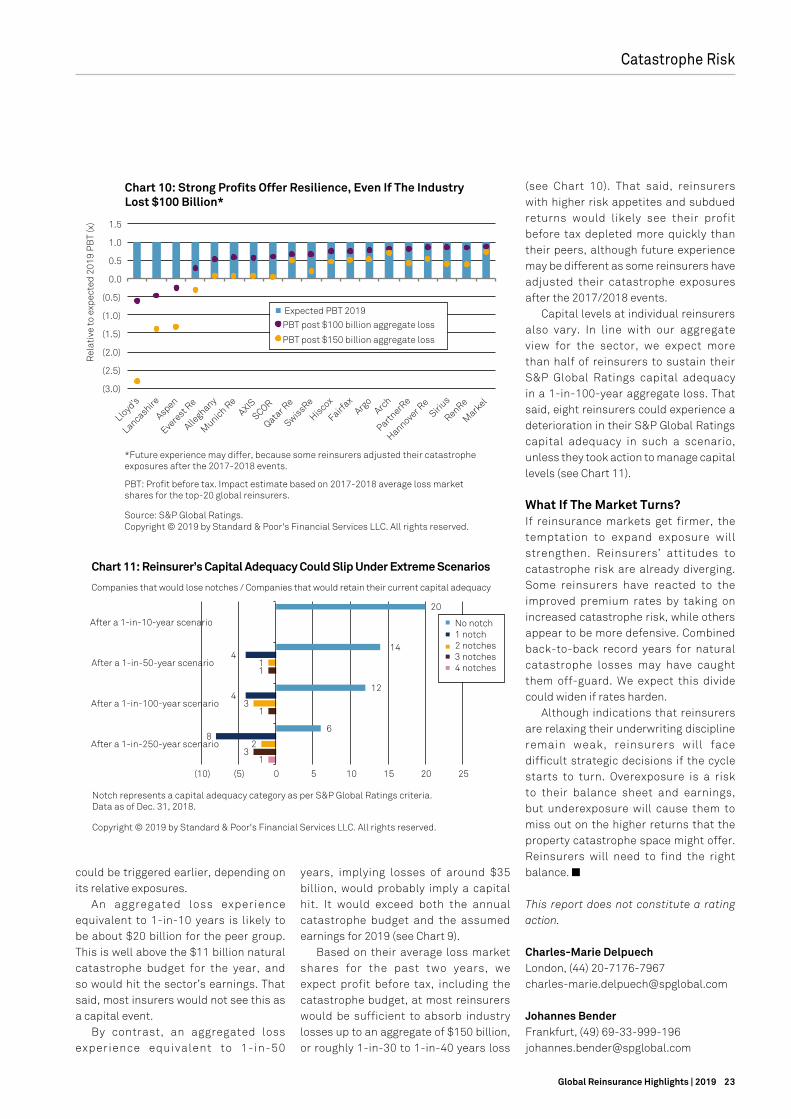
23Global Reinsurance Highlights | 2019
could be triggered earlier, depending on its relative exposures.
An aggregated loss experience equivalent to 1-in-10 years is likely to be about $20 billion for the peer group. This is well above the $11 billion natural catastrophe budget for the year, and so would hit the sector’s earnings. That said, most insurers would not see this as a capital event.
By contrast, an aggregated loss experience equivalent to 1-in-50
Catastrophe Risk
1
10
100
1,000
0 10 20 30 40 50 60 70 80
Ret
urn
peri
od in
yea
r (lo
g sc
ale)
Modeled net loss (bil. $)
Chart 1: 2018 Catastrophe Losses Were Below The 1-In-10-Year Level
Source: S&P Global Ratings estimates for the top 20 global reinsurers.
Copyright © 2019 by Standard & Poor's Financial Services LLC. All rights reserved.
2011
2017
2010
2012 2016
2013 2014 2015
2018
Natural catastrophe netexposure estimate
Actual annual aggregate net catastrophe loss (restated for premium growth)
Annual expected net loss
16
34
12
8 5 5
9
28
15
0
5
10
15
20
25
30
35
0
5
10
15
20
25
30
35
2010 2011 2012 2013 2014 2015 2016 2017 2018
Top 20 loss market share (%
)
Act
ual n
et lo
ss (m
il. $
)
Chart 2: The Top 20 Global Reinsurers Typically Take 20%Of Total Industry Losses
Source: Swiss Re Sigma, S&P Global Ratings. Copyright © 2019 by Standard & Poor's Financial Services LLC. All rights reserved.
0
10
20
30
40
50
60
70
80
90
100
Reinsurer 1
Reinsurer 2
Reinsurer 3
Reinsurer 4
Reinsurer 5
Reinsurer 6
Reinsurer 7
Reinsurer 8
Reinsurer 9
Reinsurer 1
0
Reinsurer 1
1
Reinsurer 1
2
Reinsurer 1
3
Est
imat
ed r
etur
n pe
riod
s (y
ears
)
Chart 3: Aggregate Net Losses From Typhoon Jebi Are BeyondThe 1-In-40-Year Level
Source: S&P Global Ratings. Copyright © 2019 by Standard & Poor's Financial Services LLC. All rights reserved.
(60)
(50)
(40)
(30)
(20)
(10)
0
10
20
30
40
Hurricane Harvey (August 2017)
Hurricane Irma (September 2017)
Hurricane Maria (September 2017)
California Wildfires (2017)
Net
incu
rred
dev
elop
men
t at y
ear-
end
2018
(a
s pe
rcen
tage
of y
ear-
end
2017
net
incu
rred
)
Chart 4: Loss Estimates In 2017 Showed Significant DisparitiesFrom The Average
Copyright © 2019 by Standard & Poor's Financial Services LLC. All rights reserved.
Average Min Max
Actual annual aggregate net catastrophe loss (restated for premium growth)
Top 20 loss market share
0.0
0.2
0.4
0.6
0.8
1.0
1.2
1.4
0 10 20 30 40 50 60 70 80 90
1-in
-10-
year
net
cat
astr
ophe
loss
ver
sus
ex
pect
ed P
BT
excl
udin
g ca
tast
roph
e lo
ss (x
)
1-in-250 year net catastrophe loss relative to reported shareholders' equity (%)
Chart 5: Large Reinsurers Allow More Of Their EarningsAnd Capital To Be At Risk
As of Jan. 1, 2019. PBT: Profit before tax. Source: S&P Global Ratings.
Copyright © 2019 by Standard & Poor's Financial Services LLC. All rights reserved.
Large global reinsurers Other
reinsurers
Midsize global reinsurers
Individual reinsurer
Peer group
(25)
(20)
(15)
(10)
(5)
0
5
10
15
20
(15) (10) (5) 0 5 10
Cha
nge
1-in
-10-
year
net
cat
astr
ophe
loss
ver
sus
ex
pect
ed P
BT
excl
udin
g ca
tast
roph
e lo
ss (%
poi
nt)
Change 1-in-250-year net catastrophe loss versus reported shareholders’ equity (% point)
Chart 6: Risk Positions Have Shifted As Larger ReinsurersTake On More Exposure
Since Jan. 1, 2018. PBT: Profit before tax. Source: S&P Global Ratings.
Copyright © 2019 by Standard & Poor's Financial Services LLC. All rights reserved.
Midsize global reinsurers
Large global reinsurers
Other reinsurers
Individual reinsurer
Peer group
0
2
4
6
8
10
12
14
16
18
0 1 2 3 4 5 6 7 8 9 10 11 12 13 14 15 16 17 18 19 20 21 22 2018
ann
ual n
et c
atas
trop
he lo
ss a
gain
st y
ear-
end
201
7 to
tal r
epor
ted
shar
ehol
ders
’ equ
ity
(%)
S&P Global relative catastrophe benchmark (ranking from least to most exposed left to right)
Chart 7: S&P Global Rating’s Relative Catastrophe BenchmarkPerformed Well In 2018
Bubble size shows 2018 annual net catastrophe loss against 2018 actualprofit before tax (excluding cat).
Source: S&P Global Ratings. Copyright © 2019 by Standard & Poor's Financial Services LLC. All rights reserved.
Arch
Markel
Qatar Re Argo
Fairfax
Hiscox
Alleghany
Hannover Re AXIS
Swiss Re PartnerRe
Munich Re
SCOR
Aspen
Everest Re
RenaissanceRe Sirius
Lancashire
Lloyd’s
0
10
20
30
40
50
60
70
80
90
0 10 20 30 40 50 60 70 80 90
2019
(rec
over
ies
as p
erce
ntag
e of
1-
in-2
50-y
ear
gros
s ex
posu
re)
2018 (recoveries as percentage of 1-in-250-year gross exposure)
Chart 8: Property Catastrophe Reinsurance Utilization At A 1-In-250-Year Level Is Broadly Flat
From Jan. 1, 2018 to Jan. 1, 2019. Copyright © 2019 by Standard & Poor's Financial Services LLC. All rights reserved.
Other reinsurersMidsize global reinsurers
Large global reinsurers
Peer average
Individual reinsurer
Peer group
Peer average
71.6 30.0 11.4
(16.2)22.0
11.3 (19.7) (35.7) (44.1) (58.1)
0
20
40
60
80
100
120
Surplu
s BBB
Surplu
s A
Surplu
s AA
Deficit AAA
Expected PBT 2019
2019 cat budget
1-in-1
0-year l
oss
1-in-5
0-year l
oss
1-in-1
00-year l
oss
1-in-2
50-year l
oss
Bil.
$
Chart 9: The Industry’s Capital Surplus Suggests It Would Be Resilient To Stress Scenarios
Aggregate figures for the top 20 reinsurers at year-end 2018. PBT: Profit before tax. Source: S&P Global Ratings estimates.
Copyright © 2019 by Standard & Poor’s Financial Services LLC. All rights reserved.
(3.0)
(2.5)
(2.0)
(1.5)
(1.0)
(0.5)
0.0
0.5
1.0
1.5
Lloyd’s
Lancashire
Aspen
Everest R
e
Alleghany
Munich R
e
AXIS
SCOR
Qatar R
e
SwissRe
Hiscox
Fairfax
Argo
Arch
PartnerR
e
Hannover Re
Sirius
RenRe
Mark
el
Chart 10: Strong Profits Offer Resilience, Even If The IndustryLost $100 Billion*
*Future experience may differ, because some reinsurers adjusted their catastropheexposures after the 2017-2018 events.
PBT: Profit before tax. Impact estimate based on 2017-2018 average loss marketshares for the top-20 global reinsurers.
Source: S&P Global Ratings. Copyright © 2019 by Standard & Poor's Financial Services LLC. All rights reserved.
Rel
ativ
e to
exp
ecte
d 20
19 P
BT
(x)
Expected PBT 2019
PBT post $100 billion aggregate loss
PBT post $150 billion aggregate loss
1 3
1
1
2
3
1
8
4
4
6
12
14
20
(10) (5) 0 5 10 15 20 25
After a 1-in-250-year scenario
After a 1-in-100-year scenario
After a 1-in-50-year scenario
After a 1-in-10-year scenario No notch1 notch2 notches3 notches4 notches
Chart 11: Reinsurer’s Capital Adequacy Could Slip Under Extreme Scenarios
Notch represents a capital adequacy category as per S&P Global Ratings criteria. Data as of Dec. 31, 2018.
Copyright © 2019 by Standard & Poor's Financial Services LLC. All rights reserved.
Companies that would lose notches / Companies that would retain their current capital adequacy
Capital buffers
Capital deficit
Expected profit and cat budget Cat losses
(see Chart 10). That said, reinsurers with higher risk appetites and subdued returns would likely see their profit before tax depleted more quickly than their peers, although future experience may be different as some reinsurers have adjusted their catastrophe exposures after the 2017/2018 events.
Capital levels at individual reinsurers also vary. In line with our aggregate view for the sector, we expect more than half of reinsurers to sustain their S&P Global Ratings capital adequacy in a 1-in-100-year aggregate loss. That said, eight reinsurers could experience a deterioration in their S&P Global Ratings capital adequacy in such a scenario, unless they took action to manage capital levels (see Chart 11).
What If The Market Turns?If reinsurance markets get firmer, the temptation to expand exposure will strengthen. Reinsurers’ attitudes to catastrophe risk are already diverging. Some reinsurers have reacted to the improved premium rates by taking on increased catastrophe risk, while others appear to be more defensive. Combined back-to-back record years for natural catastrophe losses may have caught them off-guard. We expect this divide could widen if rates harden.
Although indications that reinsurers are relaxing their underwriting discipline remain weak, reinsurers will face difficult strategic decisions if the cycle starts to turn. Overexposure is a risk to their balance sheet and earnings, but underexposure will cause them to miss out on the higher returns that the property catastrophe space might offer. Reinsurers will need to find the right balance. n
This report does not constitute a rating action.
Charles-Marie Delpuech London, (44) [email protected]
Johannes BenderFrankfurt, (49) [email protected]
years, implying losses of around $35 billion, would probably imply a capital hit. It would exceed both the annual catastrophe budget and the assumed earnings for 2019 (see Chart 9).
Based on their average loss market shares for the past two years, we expect profit before tax, including the catastrophe budget, at most reinsurers would be sufficient to absorb industry losses up to an aggregate of $150 billion, or roughly 1-in-30 to 1-in-40 years loss

24 Global Reinsurance Highlights | 2019
California Wildfires
Jolted By California Wildfires, Re/Insurers Recalibrate Their Risk Appetite By Hardeep Manku, Taoufik Gharib, Saurabh Khasnis, and Brian Suozzo
The back-to-back devastating California wildfires of 2017–2018 caught the property-casualty re/insurance sector by surprise with the intensity and frequency of the losses and challenging the sector’s understanding of this hazard. Nevertheless, in view of most re/insurers’ robust capitalization, these wildfires in conjunction with other catastrophe losses had limited impact on their creditworthiness.
Shu
tter
stoc
k /
Mik
hail
Roo
p

25Global Reinsurance Highlights | 2019
California Wildfires
droughts heightening the risk of wildfires. In addition, the level of urbanization,
and population and economic asset density, which are close to or encroaching on the wildlands (commonly referred to as the wildland-urban interface [WUI]), have been growing, which makes for a catastrophic event when these high-density areas, potentially with expensive properties, are hit.
The recent updates to the models targeted a higher level of sophistication for the primary causes of wildfires, resulting in higher frequency and severity of estimated losses. However, challenges persist in understanding this type of peril.
With back-to-back above-average catastrophe years, reinsurance and alternate capital are smarting from the losses—especially those from the California wildfires. Several re/insurers are not comfortable with their understanding of the risk, which has led to the sector taking a cautious approach,
with many curtailing or stopping their underwriting. This has constrained the available capacity for this risk.
Furthermore, retrocession capacity, which in the past provided a cheaper form of capital and enabled the players to pass on the property-catastrophe risk in general, is constrained as well. Whatever capacity is available is much more expensive after two subsequent years of double-digit rate increases.
S&P Global Ratings expects significant rate increases for wildfire reinsurance between now and next year’s renewal seasons. This may not be as apparent because this peril is usually combined with the other reinsurance coverage for primary perils; hence, the impact of pricing changes for wildfires gets somewhat lost in the aggregated pricing.
We expect this dynamic to influence the primary pricing as well, although more so in commercial lines than in personal lines.
Historically, the re/insurance sector has mostly focused on the primary perils such as U.S. hurricanes,
tornadoes, and earthquakes, which in the past have been major causes of property-catastrophe risk and losses. The events of 2017–2018 highlighted the increasing risk from secondary perils such as California wildfires, which have increased in frequency and severity (Table 1).
Eight of the most destructive fires occurred in the past two years, and five of the seven largest fires and 10 of the top 20 most destructive fires occurred after 2009. However, it took the events of 2017–2018 for the industry to start paying the kind of attention this peril deserves.
The modeling for California wildfires has been challenged by a number of factors. Climate change is one, but not the only, factor contributing to the increase in risk, with increasing frequency and severity of dry weather and extended
Table 1: California 2017–2018 Notable Wildfire Catastrophe Events
Date California wildfire event
Affected area Overall economic losses (mil. $, original values)
Insured losses (mil. $, original values)
Nov. 8-25, 2018 Camp Fire Paradise, Chico 16,500 12,500
Oct. 8-20, 2017 Central and Southern LNU Complex Fires
Napa County, Santa Rosa, Caligosta, Sonoma County, Solano County
14,800 11,400
Nov. 8-22, 2018 Woolsey Fire Thousand Oaks, Oak Park, Westlake Village, Agoura Hills, West Hills, Simi Valley, Chatsworth, Bell Canyon, Hidden Hills, Malibu, Calabasas
5,200 4,000
Dec. 4, 2017-Jan. 12, 2018
Thomas Fire Ventura County, Santa Paula, Ventura, Santa Barbara, Los Padres National Forest
2,900 2,200
July 23-Aug. 30, 2018
Carr Fire Shasta County, Redding, Keswick, Trinity County, French Gulch, Shasta Lake City, Igo, Ono, Summit City
1,700 1,200
Oct. 8-28, 2017 Mendocino Lake Complex Fire
Mendocino County 890 670
Dec. 5-17, 2017 Creek Fire Los Angeles County, San Fernando, Kagel Canyon 490 380
July 27- Sept. 19, 2018
Mendocino Complex Fire
Mendocino County, Ukiah, Lake County, Colusa County, Glenn County
270 200
Dec. 7-17, 2017 Lilac Fire San Diego County, Bonsall, Fallbrook 190 160
Total 42,940 32,710
Source: Munich Re NatCatSERVICE

26 Global Reinsurance Highlights | 2019
2017’s Losses Were Significant And WidespreadThe resultant losses from two years of back-to-back wildfires were widely spread across the re/insurance sector. Most of the insured losses were paid by five to six large national primary insurance companies with substantial homeowners business. This risk was well-insured on the personal and commercial sides, with the majority of homeowners covered by their insurance policies.
Insurers in turn used reinsurance and capital markets to mitigate the risk, which ended up propagating the losses throughout the value chain. As the severity of events became clearer and as the losses spread beyond property-catastrophe, they caused turmoil in the broader re/insurance market and not just in the alternative capital space.
The 2017 California wildfires were a major event and although hits to insurers and reinsurers were expected given loss levels, they also affected alternative capital providing retrocession covers. Although wildfires are considered a secondary peril and modeling is not as developed as that for, say, U.S. hurricane and tornado exposures, the property-catastrophe funds were taking a lot more wildfire risk than perhaps they realized or priced for, likely because wildfire exposures are usually part of the property-catastrophe or aggregate covers.
The losses from 2017 events were deep in the tail based on the market understanding of the risk at that time, so the sector largely considered it a low-probability occurrence.
And In 2018, They Were Even More SoHowever, after the 2018 wildfires, not only alternative capital but traditional re/insurers started questioning the understanding of this peril and their ability to appropriately price it. The losses stemmed not just from the property-catastrophe risk business but also from the casualty lines, including utilities, which went counter to re/insurers’ expectations.
In California, a utility company is responsible for paying property damages from wildfires linked to the company’s equipment, and does not necessarily have
to be found negligent to be held liable for the losses. With aging infrastructure and increasingly hot and dry weather, the risks have grown significantly in recent years. A recent example is Pacific Gas and Electric Co., which had to file for bankruptcy because of the extent of liabilities from the wildfires. According to the utility company, its liabilities could exceed $30 billion.
Models Let Re/Insurers DownThe first generation of California wildfire models came out in the early 2000s and were refined over the years; however, they fell well short of the loss experience in 2017–2018.
A 30 to 40-year historical dataset suggests increasing trendlines for wildfires and weather data, particularly for large fires. The scale of wildfires continues to expand, with an increase in WUI interface and density, natural drought cycles, climate change, forest management, and ignition sources all contributing to increased wildfire risk.
The 2017–2018 wildfires didn’t happen in the main fire season for either Northern or Southern California. The notable high-damage fires happened outside of the peak fire count or area burned periods, when winds are usually subdued. Recent extended drought conditions have reduced the wet season, extending the dry period into periods with higher wind. These conditions exposed unrecognized risks and higher severity for fires, with wind being recognized as a major hazard for severity.
According to a Swiss Re Sigma report, 2018 was the most deadly and destructive wildfire season in California, with record insurance losses, followed by 2017. The
loss events provided some important lessons necessitating a revamp of the pre-existing models.
Wildfire models typically involve four factors: ignition, spread, suppression, and damage. All of these factors were revised to take into account the recent lessons, human activity, community influence, and additional forces for the spread of wildfire footprint.
Although vendor models differ in terms of event frequency, size, severity, and other factors, the outcome of these updated models is ultimately higher estimated losses (both frequency and severity) than predicted by the pre-existing ones.
Reinsurance Pricing: Renewal Timing Was OffReinsurance pricing for wildfire risk did move in the past six to 12 months, but not as forcefully, as the sector appeared to assume 2017 was a one-off event. In addition, this risk is not priced on a stand-alone basis for the most part; rather, it is combined with other treaties including property-catastrophe and aggregate covers. Reinsurance pricing for wildfire risk moved by double digits in 2018, more so for commercial lines business, primarily utility companies.
2019 reinsurance renewals for treaties covering California wildfires didn’t provide any encouraging news from a pricing perspective, despite the second year of extensive wildfire insured losses. This is because many insurers buy multiyear treaties, so not all coverage is renewed at the same time.
Furthermore, a few of these treaties are renewed about six months in advance of the January renewal season, which for 2018 also pre-dated the California wildfires in the second half of that year. As a result, despite the 2017–2018 losses, 2019 reinsurance coverage was already in place, and hence, the pricing for this risk didn’t move as much in January renewals of this year.
The Insurability Of Risk Is Being QuestionedThere is no consensus in the re/insurance sector on the insurability of wildfire risk. Reinsurers’ comfort level with the
“S&P Global Ratings expects significantrate increases for wildfire reinsurancebetween now and next year’s renewalseasons.”
California Wildfires

27Global Reinsurance Highlights | 2019
updated models for this hazard is not that high and not consistent. While some reinsurers have become comfortable with the updated view of the risk and are willing to underwrite it—albeit at higher prices, others have either withdrawn from the risk entirely or have cut back significantly.
In addition, the retrocession capacity is just not available to the same extent as in previous years, more so for the aggregate covers, and whatever capacity is available is at much higher prices.
This dynamic extends beyond reinsurers; primary insurance companies are struggling not just with understanding the risk but also with their ability to raise rates, especially on personal lines.
Proposition 103, passed by California voters in 1988, mandates insurance companies to require “prior approval” from the California Department of Insurance before implementing property-casualty insurance rates. Any proposed increase of 7% or greater, regardless of rate indication, must go through a resource-draining process that many insurers try to avoid.
Furthermore, the Department of Insurance does not permit the use of catastrophe modeling in premium rate filings. This frustrates the primary insurers in achieving the level of rates they want, as the pricing wasn’t adequate to begin with, considering modeling deficiencies. In addition, the transfer of risk to reinsurers and capital markets (through insurance-linked notes), which had helped in the past, won’t be cheap.
Stuck between limited flexibility on primary rates and the rising cost of reinsurance, insurers are increasingly staying clear of this risk wherever feasible.
A Hefty Rate Increase Is In The Offing With reinsurers in slight disarray and given their lack of comfort with the California wildfire risk, pricing will inevitably increase. Reinsurance pricing could rise 30% to 70% between now and the January 2020 renewals in view of higher expected losses under the updated models. Given inherent difficulties with the modeling, we expect
a healthy risk margin to be built into those rate increases, given the uncertainties involved.
We also expect tightening terms and conditions, with reinsurers pushing to make the definitions for loss occurrence narrower; currently loss occurrence can have different insurer interpretations. With California approving a $21 billion fund to cover the cost of wildfires for the utilities, reinsurers may see a piece of that business, although details aren’t clear yet.
We expect primary insurance rates will rise as well. For the most part, the California market is served by large carriers, mostly nationals. Considering their large, and diversified, books, the impact from wildfires on the national business was not as severe. While primary carriers would like to take higher rates, considering the importance of the California market, insurers will keep writing the risk, although they will be more selective in certain fire lines, leverage the residual market to maintain a presence in the state, and work on the rates over time.
At the same time, primary insurers will raise rates as much as they can in the commercial lines market or for high-value homes, constrain their capacity if they can’t get the rates, or withdraw from the risk entirely. High-risk policies either end up with California Fair Plan Property Insurance (FAIR Plan; association of property insurers underwriting in California) or potentially make their way to the excess and surplus (E&S) lines market.
However, there are disadvantages to both: the FAIR Plan can constrain an open insurance market and it’s unclear how much volume it can handle, and the E&S market is pushing back as it is not set up to deal with this type of business or policies through the wholesale distribution channel. In addition, Lloyd’s is an E&S player in California, but is reducing its capacity due to the loss experience.
Re/Insurers Tread Carefully As They Reassess Their Risk AppetiteRe/insurers are in the business of risk-taking and these risks can be
indeterminate given the nature of the business. Nevertheless, we expect re/insurers to take a disciplined and measured approach considering the risk-reward trade-offs and to use their well-developed risk management practices to mitigate the risk, including development of risk measurement techniques, models, and tools to manage risk from secondary perils from both a frequency and a severity perspective.
The past two years have clearly highlighted that these secondary risks are not to be taken lightly. Indeed, reinsurers have reassessed their risk appetites in view of recent experiences. Considering the limitations of the wildfire catastrophe models, if re/insurers were to underestimate this risk, they may end up taking outsize exposures that could result in a capital event and ultimately hurt their credit worthiness. n
This report does not constitute a rating action.
Hardeep MankuToronto, (1) [email protected]
Taoufik GharibNew York, (1) [email protected]
Saurabh KhasnisCentennial, (1) [email protected]
Brian SuozzoNew York, (1) [email protected]
California Wildfires

28 Global Reinsurance Highlights | 2019
With these developments come risk. People and business are increasingly prone to cyber
risks, as demonstrated by ransomware attacks WannaCry and NotPetya in 2017, whose economic losses ranged from $4 billion to $10 billion each. The Center for Strategic and International Studies says cybercrime resulted in global
Cyber Risk
Global Reinsurers Face The Iceberg Threat Of Cyber RiskBy Johannes Bender, Manuel Adam, Robert J Greensted, Jean Paul Huby Klein, Milan Kakkad, and Tracy Dolin
Digitalization, interconnectivity, and innovation are already reshaping our lives, and there is much more to come with the internet of things, Industry 4.0, artificial intelligence, and simply the increase in access to the web globally.
Shu
tter
stoc
k /
sola
rsev
en
economic losses of about $600 billion in 2017, up from about $100 billion in 2014. This rapidly emerging risk has led to a fast-growing cyberinsurance market. Nevertheless, at this point the insured losses from these events are minuscule compared with the economic losses, and we expect this gap to narrow slightly but not change fundamentally.
Although some re/insurers started underwriting cyber risks more than 20 years ago, at least in the U.S., S&P Global Ratings believes the global market is still in an early stage. For reinsurers, cyber is an opportunity for growth—with the potential for building long-term relationships with customers. It’s also a threat, with a number of challenges,

29Global Reinsurance Highlights | 2019
Cyber Risk
limitations, and the possibility of large accumulation risk—and, if not handled properly, the potential for large claims that could cause earnings or capital volatility for re/insurers (see Table 1).
Affirmative: A Rapidly Growing Dedicated Cyberinsurance Market U n s u r p r i s i n g l y , d e m a n d f o r cyberinsurance continues to expand after strong growth in recent years because of the spike in frequency and severity of economic cyber losses. According to “The Global Risks Report 2019” by the World Economic Forum, although the top three risks by likelihood of occurrence remain environmental factors such as climate change and natural catastrophe, cyber risks and data theft have moved up to nos. four and five.
Moreover, prominent cyber incidents have increased awareness among individuals and businesses, such as the ransomware attacks WannaCry and NotPetya in 2017, and the targeted theft of personal data of about 500 million guests from international hotel group Marriot in 2018. At the same time, global policymakers have introduced several regulatory requirements for data protection and are creating new standards.
In particular, the U.S. has several data protection acts that have increased the costs of data breaches. According to “The Hiscox Cyber Readiness Report 2019” the mean loss from global cyber incidents for companies increased 61% to $369,000, while the frequency of recorded company attacks also rose 61%, up from 45% the year before.
Cyberinsurance is offered either as a separate product or as an additional peril for existing insurance policies for
first-party cyber liabilities (for example, malware or ransomware attacks, business interruption, online fraud, or identity theft) and third-party cyber liability (for example, data breach and potential legal fines).
Targeted customer segments range from multinationals to microbusinesses and private households. Demand for cyberinsurance not only stems from the need to cover financial losses from cyberattacks, but also comes from ancillary services offered with cyber policies, such as immediate IT support, data recovery, and forensic services as well as reputation and loss prevention management. Therefore, the cyberinsurance market extensively uses third-party services from cybersecurity companies that most insurers cannot offer in-house. Some larger insurance companies have started to build up in-house expertise and have hired IT professionals such as cybercrime experts.
Insured cyber losses remain a fraction of total economic cyber losses caused by cybercrime, with about $6 billion of insured losses in total (affirmative and nonaffirmative cyber losses), versus $600
billion of economic losses in 2018. At the same time, global affirmative cyber premiums remain low at about $5 billion in 2018, which indicates a large protection gap. In comparison, global economic losses from natural catastrophes in 2018 were about $155 billion and insured losses were about $76 billion, according to Swiss Re.
We believe the lack of global standards, including a homogenous definition of cyber events, liberal exclusions and relatively low sums at risk offered by re/insurers for now are keeping the market in its infancy. However, we estimate that the market has been very profitable, illustrating the lack of large insured cyber losses. According to Aon, the combined ratio for U.S. cyberinsurance averaged about 70% in 2015-2017. We expect returns will start to diminish as insurance providers currently benefit from an uncertainty premium.
The global cyberinsurance market today is dominated by the U.S., which represented about 70% of 2018 global premiums. Demand is mostly coming from various data protection regulations in several states where nonadherence to data security could lead to significant fines.
In July 2019, Equifax settled with the U.S. Federal Trade Commission over its 2017 data breach, which affected 147 million Americans. The settlement of up to $700 million includes as much as $425 million for individual compensation.
Another example is Facebook’s record-breaking $5 billion settlement with the commission announced in July 2019 for violating consumers’ privacy rights. However, we believe that cyberinsurance outside the U.S. will grow at a faster pace and could take about a 40% share of the global market in 2021.
“ If re/insurers do not start to screen their insurance portfolios for nonaffirmative cyber exposures or manage them, losses could become significant and create volatility in capital and earnings in the near future.”
Table 1: Cyber Risks—The Main Challenges And Opportunities For Reinsurers
Main challenges Main opportunities
Large accumulation risk Strong growth potential
Nonaffirmative ‘silent’ cyber exposure Long-term partnerships with clients
Potentially lower relevance of historical data because of the constantly evolving nature of the risks
Potential collaboration with governments and insurance-linked securities markets
Limited diversification benefits by regions, customers Strong operating margins backed by uncertainty premiums
Still basic model capabilities with limited track record Adding value and relevance for clients

30 Global Reinsurance Highlights | 2019
Europe will take the lead following implementation of General Data Protection Regulation in the EU in 2018. The regulation has a provision to levy fines of up to €20 million or 4% of global revenues. British Airways’ owner International Airlines Group, for example, is facing a fine of $230 million from customer data theft from its website, and Google is looking at a $50 million fine from France.
Asian markets recently entered the cyber insurance market and we believe this region will witness growth too, as awareness about cyberrisk is also rising.
We believe Asian markets will also witness growth, as awareness about cyber risk is rising there. The Singaporean government has announced plans to introduce a commercial cyberinsurance pool. As a result of rising cyber losses, increasing awareness, and growing demand for cyber products, outside the U.S., we believe the global market will grow to $8 billion in gross written premiums by 2022 (see Chart 1).
Underwriting Cyber Risks Means Looking At The Whole IcebergBefore discussing the underwriting features of affirmative cyber polices, it is important to review the cyber exposure that already exists in traditional products. Most of the risks are an iceberg threat, lurking below the surface for both non-life and life insurers. This nonaffirmative, or silent, cyber exposure can be plentiful.
Any policy that has no explicit exclusion for cyber incidents could be exposed, including products such as business interruption, marine, aviation, or transport. According to the U.S.-based Property Claim Services, the insured global cyber loss of the NotPetya attack was over $3 billion, with 90% covered in traditional policies such as business interruption.
As a result, insurers have started to address these “silent” exposures through explicit exclusions or by offering insureds affirmative cover. For example, Allianz has announced a group and worldwide cyber underwriting strategy to update and clarify all non-life policies for cyber risks.
Regulators too have become more vocal about silent cyber risk. In January
2019, the U.K.’s Prudential Regulation Authority called on U.K. insurers to actively manage nonaffirmative cyber risk and clearly define cyber strategies and risk appetites. In July 2019, Lloyd’s of London announced that its underwriters will have to clarify whether standard policies include or exclude cyber risks, starting next year.
S&P Global Ratings bel ieves that a proactive strategy to address nonaffirmative cyber exposure can help to further develop the cyberinsurance market by clarifying coverage for insureds, insurers, and brokers. We closely monitor re/insurance initiatives for addressing silent cyber exposures since we believe those companies that do not act to generate dedicated insurance premiums for the risk may experience earnings and capital volatility from cyber exposure.
For those wishing to underwrite for affirmative cyber risk, the path is not straightforward. Compared with insuring natural catastrophes, the most obvious difference with cyber risk is the human origin of the peril and in particular the criminal element. According to NetDiligence, 92% of insured data breach losses had a criminal origin in 2017 (see Chart 2). Cybercriminals are becoming more professional, aiming to develop more complex ransomware more quickly than protection technologies are created to block them.
This makes it much more difficult to model losses based on historic experience because it may not be a relevant indicator of the future.
While diversification by geography, business line, or customer base lessens natural catastrophe risk, the same cannot be said for cyber, where we believe diversification benefits are more limited. The cyberattacks WannaCry and NotPetya were global incidents encompassing many industries and geographies, demonstrating the enormous potential accumulation risk of cyber events.
The sector is also still in its infancy and has limited data on losses. Modeling capabilities are improving but are still more basic than for more traditional risks. What’s more, underwriting still relies highly on qualitative judgement and scenario-testing.
Reinsurers Are Well Placed To Help To Develop The Cyber Market In our view, reinsurers have been cautious about writing cyber reinsurance. Business appears to be still written mainly on a quota share basis, although we observe some increase in excess of loss and aggregate stop loss covers. We believe that the number of reinsurers and insurers that are offering cyber cover is rising.
In our view, even the market leaders are only cautiously increasing their exposures compared to other lines of
Cyber Risk
0
2
4
6
8
10
12
2016 2017 2018 2019e 2020e 2021e
Prem
ium
(bil.
$)
Chart 1: Global Cyberinsurance Premiums
e: Estimated. Sources: Munich Re, S&P Global Ratings. Copyright © 2019 by Standard & Poor's Financial Services LLC. All rights reserved.
69 71 76 82 92
31 29 24 18 8
0
10
20
30
40
50
60
70
80
90
100
2013 2014 2015 2016 2017
%
Noncriminal Criminal
Chart 2: Criminal Involvement In Insured Data Breach Losses
Source: NetDiligence.
Copyright © 2019 by Standard & Poor's Financial Services LLC. All rights reserved.
0
1
2
3
4
5
6
7
8
9
2016 2017 2018 2019e 2020e 2021e
Pre
miu
m (b
il. $
)
Chart 1: Global Cyberinsurance Premiums
e-Estimated. Sources: Munich Re, S&P Global Ratings.Copyright © 2019 by Standard & Poor's Financial Services LLC. All rights reserved.
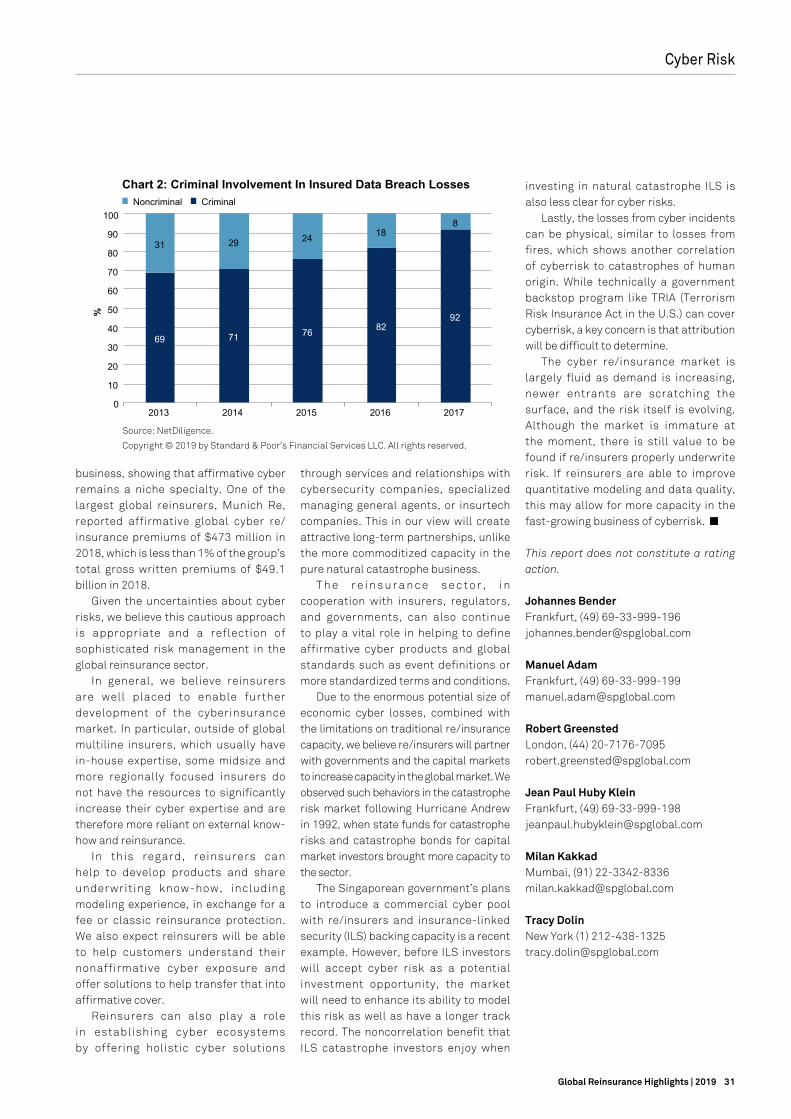
31Global Reinsurance Highlights | 2019
business, showing that affirmative cyber remains a niche specialty. One of the largest global reinsurers, Munich Re, reported affirmative global cyber re/insurance premiums of $473 million in 2018, which is less than 1% of the group’s total gross written premiums of $49.1 billion in 2018.
Given the uncertainties about cyber risks, we believe this cautious approach is appropriate and a reflection of sophisticated risk management in the global reinsurance sector.
In general, we believe reinsurers are well placed to enable further development of the cyberinsurance market. In particular, outside of global multiline insurers, which usually have in-house expertise, some midsize and more regionally focused insurers do not have the resources to significantly increase their cyber expertise and are therefore more reliant on external know-how and reinsurance.
In this regard, reinsurers can help to develop products and share underwriting know-how, including modeling experience, in exchange for a fee or classic reinsurance protection. We also expect reinsurers will be able to help customers understand their nonaffirmative cyber exposure and offer solutions to help transfer that into affirmative cover.
Reinsurers can also play a role in establishing cyber ecosystems by offering holistic cyber solutions
through services and relationships with cybersecurity companies, specialized managing general agents, or insurtech companies. This in our view will create attractive long-term partnerships, unlike the more commoditized capacity in the pure natural catastrophe business.
T h e r e i n s u r a n c e s e c t o r , i n cooperation with insurers, regulators, and governments, can also continue to play a vital role in helping to define affirmative cyber products and global standards such as event definitions or more standardized terms and conditions.
Due to the enormous potential size of economic cyber losses, combined with the limitations on traditional re/insurance capacity, we believe re/insurers will partner with governments and the capital markets to increase capacity in the global market. We observed such behaviors in the catastrophe risk market following Hurricane Andrew in 1992, when state funds for catastrophe risks and catastrophe bonds for capital market investors brought more capacity to the sector.
The Singaporean government’s plans to introduce a commercial cyber pool with re/insurers and insurance-linked security (ILS) backing capacity is a recent example. However, before ILS investors will accept cyber risk as a potential investment opportunity, the market will need to enhance its ability to model this risk as well as have a longer track record. The noncorrelation benefit that ILS catastrophe investors enjoy when
investing in natural catastrophe ILS is also less clear for cyber risks.
Lastly, the losses from cyber incidents can be physical, similar to losses from fires, which shows another correlation of cyberrisk to catastrophes of human origin. While technically a government backstop program like TRIA (Terrorism Risk Insurance Act in the U.S.) can cover cyberrisk, a key concern is that attribution will be difficult to determine.
The cyber re/insurance market is largely fluid as demand is increasing, newer entrants are scratching the surface, and the risk itself is evolving. Although the market is immature at the moment, there is still value to be found if re/insurers properly underwrite risk. If reinsurers are able to improve quantitative modeling and data quality, this may allow for more capacity in the fast-growing business of cyberrisk. n
This report does not constitute a rating action.
Johannes BenderFrankfurt, (49) [email protected]
Manuel AdamFrankfurt, (49) [email protected]
Robert GreenstedLondon, (44) [email protected]
Jean Paul Huby Klein Frankfurt, (49) [email protected]
Milan KakkadMumbai, (91) [email protected]
Tracy DolinNew York (1) [email protected]
Cyber Risk
0
2
4
6
8
10
12
2016 2017 2018 2019e 2020e 2021e Pr
emiu
m (b
il. $
)
Chart 1: Global Cyberinsurance Premiums
e: Estimated. Sources: Munich Re, S&P Global Ratings. Copyright © 2019 by Standard & Poor's Financial Services LLC. All rights reserved.
69 71 76 82 92
31 29 24 18 8
0
10
20
30
40
50
60
70
80
90
100
2013 2014 2015 2016 2017
%
Noncriminal Criminal
Chart 2: Criminal Involvement In Insured Data Breach Losses
Source: NetDiligence.
Copyright © 2019 by Standard & Poor's Financial Services LLC. All rights reserved.
0
1
2
3
4
5
6
7
8
9
2016 2017 2018 2019e 2020e 2021e
Pre
miu
m (b
il. $
)
Chart 1: Global Cyberinsurance Premiums
e-Estimated. Sources: Munich Re, S&P Global Ratings.Copyright © 2019 by Standard & Poor's Financial Services LLC. All rights reserved.
32 Global Reinsurance Highlights | 2019
Depending on their overal l p e r f o r m a n c e , s o m e f u n d s with large losses have had
redemptions—even to the extent that they are being wound down following several unfavourable loss-reserve developments, such as with the Markel Corp.’s CATCo Reinsurance Fund Ltd. By contrast, others with more positive
ILS
Convergence Capital Will Remain Key For Reinsurers Despite Recent Losses By Maren Josefs, David Masters, and Ali Karakuyu
In the past 12 months, the flow of the so-called convergence capital—funds from non-traditional, third-party sources—into the global reinsurance industry has decreased for the first time in 10 years. The reinsurance industry’s record back-to-back catastrophe loss years have affected all insurance-linked securities (ILS) funds, although the precise impact has varied.
Shu
tter
stoc
k /
Dro
neX
returns have seen, and continue to see, inflows.
In total, according to global broker Aon PLC, assets under management in the alternative capital sector fell by 4% to $93 billion as of March 31, 2019, compared with year-end 2018 (see Chart 1).
So far this year, it appears that investors have been cautious in entering the market
or reloading. This is not surprising given it follows the two worst-performing years (2017 was the worst) since the inception of the Eurekahedge ILS Advisers index (see Chart 2). Despite a benign period of catastrophe-insured losses so far in 2019, this year also hasn’t started well for the index constituents. Further loss creep and mark-to-market catastrophe bond losses
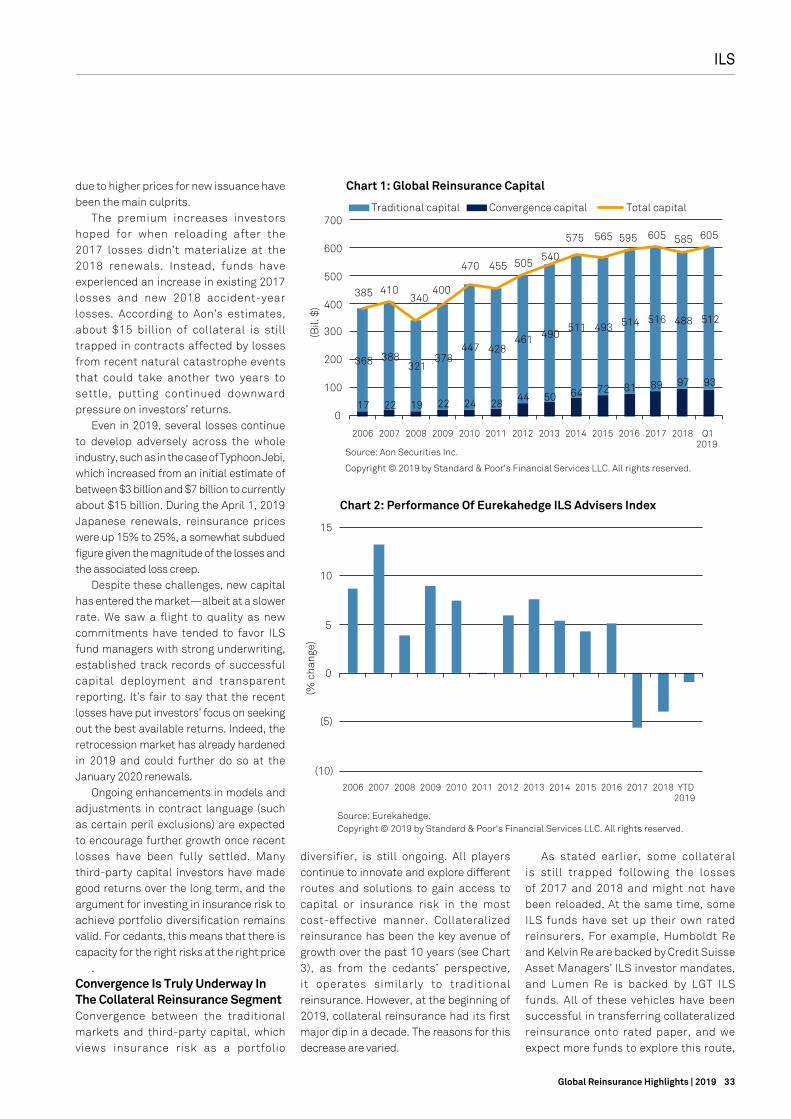
33Global Reinsurance Highlights | 2019
ILS
diversifier, is still ongoing. All players continue to innovate and explore different routes and solutions to gain access to capital or insurance risk in the most cost-effective manner. Collateralized reinsurance has been the key avenue of growth over the past 10 years (see Chart 3), as from the cedants’ perspective, it operates similarly to traditional reinsurance. However, at the beginning of 2019, collateral reinsurance had its first major dip in a decade. The reasons for this decrease are varied.
As stated earlier, some collateral is still trapped following the losses of 2017 and 2018 and might not have been reloaded. At the same time, some ILS funds have set up their own rated reinsurers. For example, Humboldt Re and Kelvin Re are backed by Credit Suisse Asset Managers’ ILS investor mandates, and Lumen Re is backed by LGT ILS funds. All of these vehicles have been successful in transferring collateralized reinsurance onto rated paper, and we expect more funds to explore this route,
17 22 19 22 24 2844 50 64 72 81 89 97 93
368 388321
378447 428
461 490511 493 514 516 488 512
385 410340
400
470 455 505540
575 565 595 605 585 605
0
100
200
300
400
500
600
700
2006 2007 2008 2009 2010 2011 2012 2013 2014 2015 2016 2017 2018 Q12019
(Bil.
$)
Traditional capital Convergence capital Total capital
Chart 1: Global Reinsurance Capital
Source: Aon Securities Inc.
Copyright © 2019 by Standard & Poor's Financial Services LLC. All rights reserved.
(10)
(5)
0
5
10
15
2006 2007 2008 2009 2010 2011 2012 2013 2014 2015 2016 2017 2018 YTD2019
(% c
hang
e)
Chart 2: Performance Of Eurekahedge ILS Advisers Index
Source: Eurekahedge.Copyright © 2019 by Standard & Poor's Financial Services LLC. All rights reserved.
0
20
40
60
80
100
120
2007 2008 2009 2010 2011 2012 2013 2014 2015 2016 2017 2018 Q1
2019
(Bil.
$)
Chart 3: Breakdown Of Alternative Capital By Source
Source: Aon Securities Inc.
Copyright © 2019 by Standard & Poor's Financial Services LLC. All rights reserved.
0
5
10
15
20
25
30
Large globalreinsurers
Midsize globalreinsurers
Other (re)insurancegroup
Total
(%)
Chart 4: Average Collateralized Tail Protection Purchased By Top 20 Reinsurers
Percentage of collateralized recoveries at a 1-in-a-250 year return period-Source: S&P Global Ratings.
Copyright © 2019 by Standard & Poor's Financial Services LLC. All rights reserved.
0
2,000
4,000
6,000
8,000
10,000
12,000
2016 2017 2018 2019
(Mil.
$)
H2 H1
Chart 5: Catastrophe Bond Issuance
Source: Trading Risk.
Copyright © 2019 by Standard & Poor's Financial Services LLC. All rights reserved.
0
2
4
6
8
10
12
14
1997 1999 2001 2003 2005 2007 2009 2011 2013 2015 2017 2019*
(%)
Average expected loss MultipleAverage expected coupon
Chart 6: Average Expected Loss And Coupon For Catastrophe Bonds And ILS
*As of July 19, 2019. Source: www.artemis.bm.
Copyright © 2019 by Standard & Poor's Financial Services LLC. All rights reserved.
0
5
10
15
20
25
30
35
40
45
0
2
4
6
8
10
12
14
16
18
2006 2007 2008 2009 2010 2011 2012 2013 2014 2015 2016 2017 2018 2019
YTD
(Bil. $)
(Bil.
$)
Chart 7: Catastrophe Bond And ILS Market Developments
Source: www.artemis.bm. New issuance and total outstanding by year
Copyright © 2019 by Standard & Poor's Financial Services LLC. All rights reserved.
Collateralized reinsurance
ILWs
Sidecars
Catastrophe bonds
Dec. 31, 2015Dec. 31, 2017Dec. 31, 2018
Mortgage ILS (left scale)
Cat bond and other ILS (left scale)
Total outstanding (right scale)
due to higher prices for new issuance have been the main culprits.
The premium increases investors hoped for when reloading after the 2017 losses didn’t materialize at the 2018 renewals. Instead, funds have experienced an increase in existing 2017 losses and new 2018 accident-year losses. According to Aon’s estimates, about $15 billion of collateral is still trapped in contracts affected by losses from recent natural catastrophe events that could take another two years to settle, putting continued downward pressure on investors’ returns.
Even in 2019, several losses continue to develop adversely across the whole industry, such as in the case of Typhoon Jebi, which increased from an initial estimate of between $3 billion and $7 billion to currently about $15 billion. During the April 1, 2019 Japanese renewals, reinsurance prices were up 15% to 25%, a somewhat subdued figure given the magnitude of the losses and the associated loss creep.
Despite these challenges, new capital has entered the market—albeit at a slower rate. We saw a flight to quality as new commitments have tended to favor ILS fund managers with strong underwriting, established track records of successful capital deployment and transparent reporting. It’s fair to say that the recent losses have put investors’ focus on seeking out the best available returns. Indeed, the retrocession market has already hardened in 2019 and could further do so at the January 2020 renewals.
Ongoing enhancements in models and adjustments in contract language (such as certain peril exclusions) are expected to encourage further growth once recent losses have been fully settled. Many third-party capital investors have made good returns over the long term, and the argument for investing in insurance risk to achieve portfolio diversification remains valid. For cedants, this means that there is capacity for the right risks at the right price
.Convergence Is Truly Underway In The Collateral Reinsurance SegmentConvergence between the traditional markets and third-party capital, which views insurance risk as a portfolio

34 Global Reinsurance Highlights | 2019
making the line between traditional reinsurance and alternative capital more blurred than ever.
ILS funds have various reasons for setting up their own rated carrier. Collateralized reinsurance involves a great deal of back-office administration, such as engaging managers to set up segregated accounts and trust agreements for individual transactions. In addition, traditional reinsurance contracts offer a structural feature that reinstates coverage at a pre-agreed price following a major loss event, which has been a major challenge for the collateralized reinsurance market.
To offer this reinstatement feature to a cedant, an ILS investor would have had to put up two limits at the inception of a policy, which would have rendered any transaction economically unviable. However, ILS funds have been able to offer such reinstatements through collaboration with a fronting partner.
Due to the discontinuation of Tokio Millennium Re’s fronting business following its acquisition by Renaissance Re Holdings Ltd. , the market ’s dependence on a few players—such as Hannover Rück SE and Allianz Risk Transfer AG—has increased. Using a fronting arrangement also means additional cost to the ILS fund, and it adds another party to the relationship with the cedant. With a rated carrier, the ILS fund still incurs costs in running its own carrier, but at the same time the fund operates more independently and is able to establish a direct relationship with its cedants/brokers.
In the traditional market, some insurers and reinsurers have set up, expanded, or acquired their own third-party capital-management capabilities (see “More Consolidation To Come For Global Reinsurers”) and they could use more quota share-type agreements to share their exposures with investors. These platforms help insurance and reinsurance companies attain greater scale and relevance as well as target lines of business where the returns might not support their own cost of capital adequately, which would allow them to provide more complete solutions to their clients.
In our view, in recent years traditional reinsurers have successfully leveraged capacity from third-party capital. This is partly reflected in the increase in collateralized retro utilization for the top 20 reinsurers on tail protection for a 1-in-250-year catastrophe event to about 20% as of Dec. 31, 2018, from about 13% as of Dec. 31, 2015 (see Chart 4). Compared to Dec 31, 2017, we observed the biggest increase in collateralized retro utilization in our group of other re/insurers. In the past two years, the highest collateralized retro utilization was among midsize global reinsurers.
In the past, traditional reinsurers arguably viewed third-party capital as a nice to have. Now, it has become the new norm, with established players incorporating third-party capital into their operations to stay competitive. A major component of our rating analysis is our assessment of a re/insurer’s business risk profile, with a particular focus on its competitive position compared to peers’.
We generally expect an insurer with a stronger overall competitive position to exhibit consistently higher and more stable profitability metrics than its
ILS
17 22 19 22 24 2844 50 64 72 81 89 97 93
368 388321
378447 428
461 490511 493 514 516 488 512
385 410340
400
470 455 505540
575 565 595 605 585 605
0
100
200
300
400
500
600
700
2006 2007 2008 2009 2010 2011 2012 2013 2014 2015 2016 2017 2018 Q12019
(Bil.
$)
Traditional capital Convergence capital Total capital
Chart 1: Global Reinsurance Capital
Source: Aon Securities Inc.
Copyright © 2019 by Standard & Poor's Financial Services LLC. All rights reserved.
(10)
(5)
0
5
10
15
2006 2007 2008 2009 2010 2011 2012 2013 2014 2015 2016 2017 2018 YTD2019
(% c
hang
e)
Chart 2: Performance Of Eurekahedge ILS Advisers Index
Source: Eurekahedge.Copyright © 2019 by Standard & Poor's Financial Services LLC. All rights reserved.
0
20
40
60
80
100
120
2007 2008 2009 2010 2011 2012 2013 2014 2015 2016 2017 2018 Q1
2019
(Bil.
$)
Chart 3: Breakdown Of Alternative Capital By Source
Source: Aon Securities Inc.
Copyright © 2019 by Standard & Poor's Financial Services LLC. All rights reserved.
0
5
10
15
20
25
30
Large globalreinsurers
Midsize globalreinsurers
Other (re)insurancegroup
Total
(%)
Chart 4: Average Collateralized Tail Protection Purchased By Top 20 Reinsurers
Percentage of collateralized recoveries at a 1-in-a-250 year return period-Source: S&P Global Ratings.
Copyright © 2019 by Standard & Poor's Financial Services LLC. All rights reserved.
0
2,000
4,000
6,000
8,000
10,000
12,000
2016 2017 2018 2019
(Mil.
$)
H2 H1
Chart 5: Catastrophe Bond Issuance
Source: Trading Risk.
Copyright © 2019 by Standard & Poor's Financial Services LLC. All rights reserved.
0
2
4
6
8
10
12
14
1997 1999 2001 2003 2005 2007 2009 2011 2013 2015 2017 2019*
(%)
Average expected loss MultipleAverage expected coupon
Chart 6: Average Expected Loss And Coupon For Catastrophe Bonds And ILS
*As of July 19, 2019. Source: www.artemis.bm.
Copyright © 2019 by Standard & Poor's Financial Services LLC. All rights reserved.
0
5
10
15
20
25
30
35
40
45
0
2
4
6
8
10
12
14
16
18
2006 2007 2008 2009 2010 2011 2012 2013 2014 2015 2016 2017 2018 2019
YTD
(Bil. $)
(Bil.
$)
Chart 7: Catastrophe Bond And ILS Market Developments
Source: www.artemis.bm. New issuance and total outstanding by year
Copyright © 2019 by Standard & Poor's Financial Services LLC. All rights reserved.
Collateralized reinsurance
ILWs
Sidecars
Catastrophe bonds
Dec. 31, 2015Dec. 31, 2017Dec. 31, 2018
Mortgage ILS (left scale)
Cat bond and other ILS (left scale)
Total outstanding (right scale)

35Global Reinsurance Highlights | 2019
competitors. Using third-party capital to profitably grow the top and bottom line should, in general, reflect positively on this assessment.
Catastrophe Bond Issuance Has Slowed, Mortgage ILS A Main Driver Behind New IssuanceIn the first half of 2019, natural catastrophe bond issuance was subdued compared with recent years. According to Trading Risk, it dropped by nearly 57%, to $3.5 billion compared with $8.2 billion in the first half of 2018 (see Chart 5). It cited pricing disparities between the catastrophe bond market and the traditional market as a possible cause. During the 2019 renewals, risk-adjusted returns were said to be more attractive for cedants in the traditional market than in the catastrophe bond market.
Nevertheless, four of the top 20 reinsurers we rate decided to seek retro capacity from the cat bond market (see Table 1). Of note was Swiss Re’s return to the cat bond market after a four-year absence.
The average level of risk assumed by investors (the expected loss) continues to decrease, while the average coupon continues to increase (see Chart 6). The average multiple (the coupon divided by the expected loss) has been trending upward—to 2.91x at end of July 2019 from 2.01x in 2018. In our view, this
demonstrates that the issues in the table were well received by investors, as all but one achieved multiples below the current average for 2019.
From the first issuance in 1997 to 2016, only 13 cat bonds out of roughly $80 billion of total issuance defaulted, which we define as having incurred a reduction in principal after making loss payments to the cedant (see “Catastrophe Bonds Have A Short, But Strong Track Record On Claims Payments,” Aug. 31, 2016). Up to this point, market critics argued that the cat bond market had not been put to the test despite surviving heavy cat loss years such as 2004, 2005, and 2011 without any major defaults. This was all to change from the following year onwards.
According to the Artemis Catastrophe Bond Default Directory, as of Aug 1, 2019, 18 cat bonds were at risk of default after the 2017 events, eight are at risk of default due to the 2018 events, and 10 more could be affected by an accumulation of losses from events in 2017 and 2018 combined. In total, this represents $3.2 billion of principal at risk, with the expectation that about 50% of this amount will eventually be paid out to cedants.
The majority of the bonds affected provided protection on an aggregate basis (losses from a number of different events are added to calculate total losses over a certain period). Argo and SCOR appear to be the two reinsurers in our top 20 benefitting
from a loss payment from their respective issues Loma Reinsurance (Bermuda) Ltd. (Series 2013-1) Class C and Atlas IX Capital Limited (Series 2015-1). We did not take any rating actions on cat bonds we rate following the 2018 events.
Depending on which reporting source one refers to, as some include and others exclude mortgage ILS, mortgage ILS has been a driving force in ILS issuance in 2018 and 2019 (see Chart 7). According to Artemis, mortgage ILS deals contributed an additional $2.9 billion and $3.6 billion in new ILS issuance, respectively, bringing total mortgage issuance since 2015 to $7.8 billion.
The expectation is for U.S. private mortgage insurers such as Arch Capital Group Ltd., Essent Group Ltd., Radian Group Inc., NMI Holdings Inc., and MGIC Investment Corp. to continue to seek similar levels of protection on an annual basis from the capital markets. Transferring the mortgage risk through an instrument similar to a cat bond allows these issuers to manage their capital, diversify their sources of reinsurance, and access capital with lower return hurdles.
Mortgage ILS also helps drive top-line underwriting growth while maintaining issuers’ exposures within their risk limits. Although mortgage ILS are structurally very similar to cat bonds, investors are exposed not only to the risk of the natural cat event but also to default and credit risk on the pool of mortgage insurance policies being securitized. As a result, mortgage ILS are more correlated to the financial markets than cat bonds.
This explains why ILS funds have not been major buyers of these issues, though their end investors might be. The end investors could allocate a portion of
ILS
17 22 19 22 24 2844 50 64 72 81 89 97 93
368 388321
378447 428
461 490511 493 514 516 488 512
385 410340
400
470 455 505540
575 565 595 605 585 605
0
100
200
300
400
500
600
700
2006 2007 2008 2009 2010 2011 2012 2013 2014 2015 2016 2017 2018 Q12019
(Bil.
$)
Traditional capital Convergence capital Total capital
Chart 1: Global Reinsurance Capital
Source: Aon Securities Inc.
Copyright © 2019 by Standard & Poor's Financial Services LLC. All rights reserved.
(10)
(5)
0
5
10
15
2006 2007 2008 2009 2010 2011 2012 2013 2014 2015 2016 2017 2018 YTD2019
(% c
hang
e)
Chart 2: Performance Of Eurekahedge ILS Advisers Index
Source: Eurekahedge.Copyright © 2019 by Standard & Poor's Financial Services LLC. All rights reserved.
0
20
40
60
80
100
120
2007 2008 2009 2010 2011 2012 2013 2014 2015 2016 2017 2018 Q1
2019
(Bil.
$)
Chart 3: Breakdown Of Alternative Capital By Source
Source: Aon Securities Inc.
Copyright © 2019 by Standard & Poor's Financial Services LLC. All rights reserved.
0
5
10
15
20
25
30
Large globalreinsurers
Midsize globalreinsurers
Other (re)insurancegroup
Total
(%)
Chart 4: Average Collateralized Tail Protection Purchased By Top 20 Reinsurers
Percentage of collateralized recoveries at a 1-in-a-250 year return period-Source: S&P Global Ratings.
Copyright © 2019 by Standard & Poor's Financial Services LLC. All rights reserved.
0
2,000
4,000
6,000
8,000
10,000
12,000
2016 2017 2018 2019
(Mil.
$)
H2 H1
Chart 5: Catastrophe Bond Issuance
Source: Trading Risk.
Copyright © 2019 by Standard & Poor's Financial Services LLC. All rights reserved.
0
2
4
6
8
10
12
14
1997 1999 2001 2003 2005 2007 2009 2011 2013 2015 2017 2019*
(%)
Average expected loss MultipleAverage expected coupon
Chart 6: Average Expected Loss And Coupon For Catastrophe Bonds And ILS
*As of July 19, 2019. Source: www.artemis.bm.
Copyright © 2019 by Standard & Poor's Financial Services LLC. All rights reserved.
0
5
10
15
20
25
30
35
40
45
0
2
4
6
8
10
12
14
16
18
2006 2007 2008 2009 2010 2011 2012 2013 2014 2015 2016 2017 2018 2019
YTD
(Bil. $)
(Bil.
$)
Chart 7: Catastrophe Bond And ILS Market Developments
Source: www.artemis.bm. New issuance and total outstanding by year
Copyright © 2019 by Standard & Poor's Financial Services LLC. All rights reserved.
Collateralized reinsurance
ILWs
Sidecars
Catastrophe bonds
Dec. 31, 2015Dec. 31, 2017Dec. 31, 2018
Mortgage ILS (left scale)
Cat bond and other ILS (left scale)
Total outstanding (right scale)
“All players continue to innovate and explore different routes and solutions to gain access to capital or insurance risk in the most cost-effective manner.”

36 Global Reinsurance Highlights | 2019
their assets to ILS funds, cat bonds, or other types of collateralized reinsurance and simultaneously another portion directly into mortgage ILS. Due to the unique characteristics of this asset class, we’d argue that mortgage ILS should be monitored on a stand-alone basis and not to be co-mingled with other ILS cat bonds issuance.
Sidecars Remain An Attractive Play For Sponsors And Investors AlikeDespite two heavy cat loss years that didn’t leave sidecar investors unscathed, our cohort of the top 20 reinsurers were able to attract capital to their existing sidecar strategies or even set up new vehicles, such as AXIS Capital with its Altura Re sidecar issues. Sidecars are a form of reinsurance managed by the cedant/sponsor but largely funded by third-party investors. A sidecar gives sponsors greater control of the quota share cessions to investors and allows them to earn fee income for the business ceded to the sidecar. This way, sponsors can significantly increase their underwriting capacity while effectively maintaining exposures within their risk limits.
A sidecar can sit alongside other third-party arrangements, and a sponsor can have a number of sidecars. For example, the Dutch pension fund PGGM is the sole investor in Munich Re’s Leo Re sidecar. Through this private arrangement, PGGM can have increased influence on the terms and scale of the sidecar rather than allocating to Munich Re’s Eden Re sidecar, which is backed by various other
investors. We expect sidecars to continue to play an important part in reinsurers’ strategies.
Climate Change, Model Development, And The Protection Gap Continue To Offer OpportunitiesInvestors are increasingly voicing concerns about climate change and model credibility. According to Swiss Re’s sigma report, more than 50% of the $219 billion in 2017 and 2018 global insured natural catastrophe losses resulted from so-called secondary perils. Secondary perils can be independent small to midsized events that occur more frequently than major natural
catastrophes. Examples include wildfires, droughts, and tornadoes as well as the secondary effects of a primary peril, such as a tsunami from an earthquake or precipitation from a cyclone.
In the past, these perils have often not been appropriately modelled or received much attention from the industry. This inattention has resulted in the unexpected accumulation of losses in the past two years, which hit alternative capital investors providing aggregate protection the hardest. As a consequence, the availability of aggregate capacity has declined.
With the growth in population in urban and other exposed areas across the globe coupled with projected climate
ILS
Table 1: Reinsurers Obtaining Retro Capacity
Issuer Sponsor Perils covered Trigger type Size (mil. $) Expected loss (%) Coupon (%) Multiple (x)
Bowline Re Ltd. (Series 2019-1) Class A Transatlantic Reinsurance Co. U.S. and Canada named storms, earthquake, and severe thunderstorm
Industry loss index, annual aggregate 100 1.36 4.75 3.49
Bowline Re Ltd. (Series 2019-1) Class B Transatlantic Reinsurance Co. U.S. and Canada named storms, earthquake, and severe thunderstorm
Industry loss index, annual aggregate 150 3.69 8.50 2.30
Atlas Capital UK 2019 PLC (Series 2019-1) SCOR Global P&C SE U.S. named storm, U.S. and Canada earthquake, and European windstorm
Industry loss index, annual aggregate 250 5.46 11.75 2.15
Matterhorn Re Ltd. (Series 2019-1) Swiss Re Northeast U.S. named storm Industry loss index, per occurrence 250 3.81 8.50 2.23
Northshore Re II Ltd. (Series 2019-1) AXIS Capital Holdings Ltd. subsidiaries U.S. named storms, U.S. and Canada earthquake, and European windstorm
Industry loss index, annual aggregate 165 2.84 7.50 2.64
Source: artemis.bm.
17 22 19 22 24 2844 50 64 72 81 89 97 93
368 388321
378447 428
461 490511 493 514 516 488 512
385 410340
400
470 455 505540
575 565 595 605 585 605
0
100
200
300
400
500
600
700
2006 2007 2008 2009 2010 2011 2012 2013 2014 2015 2016 2017 2018 Q12019
(Bil.
$)
Traditional capital Convergence capital Total capital
Chart 1: Global Reinsurance Capital
Source: Aon Securities Inc.
Copyright © 2019 by Standard & Poor's Financial Services LLC. All rights reserved.
(10)
(5)
0
5
10
15
2006 2007 2008 2009 2010 2011 2012 2013 2014 2015 2016 2017 2018 YTD2019
(% c
hang
e)
Chart 2: Performance Of Eurekahedge ILS Advisers Index
Source: Eurekahedge.Copyright © 2019 by Standard & Poor's Financial Services LLC. All rights reserved.
0
20
40
60
80
100
120
2007 2008 2009 2010 2011 2012 2013 2014 2015 2016 2017 2018 Q1
2019
(Bil.
$)
Chart 3: Breakdown Of Alternative Capital By Source
Source: Aon Securities Inc.
Copyright © 2019 by Standard & Poor's Financial Services LLC. All rights reserved.
0
5
10
15
20
25
30
Large globalreinsurers
Midsize globalreinsurers
Other (re)insurancegroup
Total
(%)
Chart 4: Average Collateralized Tail Protection Purchased By Top 20 Reinsurers
Percentage of collateralized recoveries at a 1-in-a-250 year return period-Source: S&P Global Ratings.
Copyright © 2019 by Standard & Poor's Financial Services LLC. All rights reserved.
0
2,000
4,000
6,000
8,000
10,000
12,000
2016 2017 2018 2019
(Mil.
$)
H2 H1
Chart 5: Catastrophe Bond Issuance
Source: Trading Risk.
Copyright © 2019 by Standard & Poor's Financial Services LLC. All rights reserved.
0
2
4
6
8
10
12
14
1997 1999 2001 2003 2005 2007 2009 2011 2013 2015 2017 2019*
(%)
Average expected loss MultipleAverage expected coupon
Chart 6: Average Expected Loss And Coupon For Catastrophe Bonds And ILS
*As of July 19, 2019. Source: www.artemis.bm.
Copyright © 2019 by Standard & Poor's Financial Services LLC. All rights reserved.
0
5
10
15
20
25
30
35
40
45
0
2
4
6
8
10
12
14
16
18
2006 2007 2008 2009 2010 2011 2012 2013 2014 2015 2016 2017 2018 2019
YTD
(Bil. $)
(Bil.
$)
Chart 7: Catastrophe Bond And ILS Market Developments
Source: www.artemis.bm. New issuance and total outstanding by year
Copyright © 2019 by Standard & Poor's Financial Services LLC. All rights reserved.
Collateralized reinsurance
ILWs
Sidecars
Catastrophe bonds
Dec. 31, 2015Dec. 31, 2017Dec. 31, 2018
Mortgage ILS (left scale)
Cat bond and other ILS (left scale)
Total outstanding (right scale)

37Global Reinsurance Highlights | 2019
change, the frequency and severity of these secondary peril events are expected to increase. The Camp Fire in California—with insured losses of US$12 billion—is proof that an event caused by a secondary peril can become one of the costliest of the year.
The experience from recent years has led to the major modelling companies to release updated models that capture wildfire as a modelled peril. Albeit still relatively new, this allows the industry—and hence investors—to separately charge for this peril. In the past, if an event definition included wildfire, the risk analysis presented to investors did not. Hence, going forward we expect investors to ask for exclusions for secondary perils not included in the risk analysis. We also would not be surprised to see wildfire as a stand-alone modelled peril for a cat bond.
Another good example of a secondary peril is flood following a major storm. In April of this year, the U.S. Federal Emergency Management Agency’s (FEMA) expanded its flood reinsurance program for the National Flood Insurance Program (NFIP) through the second placement of the $300 million FloodSmart Re Ltd. (Series 2019-1) cat bond and the issuance of its first bond of $500 million in July 2018. With advances in technology, the expectation is for exposure data and models to continue to improve.
Although neither will ever be perfect, new models and better exposure data provide underwriters—and ultimately i n v e s t o r s — w i t h b e t t e r t o o l s t o understand the insurance risk they are exposed to. Models are also being built to better understand longer-tail risks, such as certain casualty/liability lines, which
might lead to further opportunities to transfer risk into the capital markets.
Globally, efforts are underway to close the current protection gap. The payouts from insurers following the two costliest back-to-back years of losses on record only represent about 35% of total economic losses, according to Swiss Re. While new insurance schemes and pools in developing countries allow individuals and businesses to access insurance and hence increase opportunities for the market, a 2018 report by the California Earthquake Authority noted that the protection gap is even closer to home. Nearly 90% of residents or commercial structures in California did not have earthquake coverage.
This highlights the significant gap still present in developed markets and the significant opportunities where insurance risk seeking capital offered by investors can be deployed in collaboration with established insurance and reinsurance players to make insurance more accessible and affordable. n
This report does not constitute a rating action.
Maren JosefsLondon, (44) [email protected]
David MastersLondon, (44) [email protected]
Ali KarakuyuLondon, (44) [email protected]
Table 1: Reinsurers Obtaining Retro Capacity
Issuer Sponsor Perils covered Trigger type Size (mil. $) Expected loss (%) Coupon (%) Multiple (x)
Bowline Re Ltd. (Series 2019-1) Class A Transatlantic Reinsurance Co. U.S. and Canada named storms, earthquake, and severe thunderstorm
Industry loss index, annual aggregate 100 1.36 4.75 3.49
Bowline Re Ltd. (Series 2019-1) Class B Transatlantic Reinsurance Co. U.S. and Canada named storms, earthquake, and severe thunderstorm
Industry loss index, annual aggregate 150 3.69 8.50 2.30
Atlas Capital UK 2019 PLC (Series 2019-1) SCOR Global P&C SE U.S. named storm, U.S. and Canada earthquake, and European windstorm
Industry loss index, annual aggregate 250 5.46 11.75 2.15
Matterhorn Re Ltd. (Series 2019-1) Swiss Re Northeast U.S. named storm Industry loss index, per occurrence 250 3.81 8.50 2.23
Northshore Re II Ltd. (Series 2019-1) AXIS Capital Holdings Ltd. subsidiaries U.S. named storms, U.S. and Canada earthquake, and European windstorm
Industry loss index, annual aggregate 165 2.84 7.50 2.64
Source: artemis.bm.
17 22 19 22 24 2844 50 64 72 81 89 97 93
368 388321
378447 428
461 490511 493 514 516 488 512
385 410340
400
470 455 505540
575 565 595 605 585 605
0
100
200
300
400
500
600
700
2006 2007 2008 2009 2010 2011 2012 2013 2014 2015 2016 2017 2018 Q12019
(Bil.
$)
Traditional capital Convergence capital Total capital
Chart 1: Global Reinsurance Capital
Source: Aon Securities Inc.
Copyright © 2019 by Standard & Poor's Financial Services LLC. All rights reserved.
(10)
(5)
0
5
10
15
2006 2007 2008 2009 2010 2011 2012 2013 2014 2015 2016 2017 2018 YTD2019
(% c
hang
e)
Chart 2: Performance Of Eurekahedge ILS Advisers Index
Source: Eurekahedge.Copyright © 2019 by Standard & Poor's Financial Services LLC. All rights reserved.
0
20
40
60
80
100
120
2007 2008 2009 2010 2011 2012 2013 2014 2015 2016 2017 2018 Q1
2019
(Bil.
$)
Chart 3: Breakdown Of Alternative Capital By Source
Source: Aon Securities Inc.
Copyright © 2019 by Standard & Poor's Financial Services LLC. All rights reserved.
0
5
10
15
20
25
30
Large globalreinsurers
Midsize globalreinsurers
Other (re)insurancegroup
Total
(%)
Chart 4: Average Collateralized Tail Protection Purchased By Top 20 Reinsurers
Percentage of collateralized recoveries at a 1-in-a-250 year return period-Source: S&P Global Ratings.
Copyright © 2019 by Standard & Poor's Financial Services LLC. All rights reserved.
0
2,000
4,000
6,000
8,000
10,000
12,000
2016 2017 2018 2019
(Mil.
$)
H2 H1
Chart 5: Catastrophe Bond Issuance
Source: Trading Risk.
Copyright © 2019 by Standard & Poor's Financial Services LLC. All rights reserved.
0
2
4
6
8
10
12
14
1997 1999 2001 2003 2005 2007 2009 2011 2013 2015 2017 2019*
(%)
Average expected loss MultipleAverage expected coupon
Chart 6: Average Expected Loss And Coupon For Catastrophe Bonds And ILS
*As of July 19, 2019. Source: www.artemis.bm.
Copyright © 2019 by Standard & Poor's Financial Services LLC. All rights reserved.
0
5
10
15
20
25
30
35
40
45
0
2
4
6
8
10
12
14
16
18
2006 2007 2008 2009 2010 2011 2012 2013 2014 2015 2016 2017 2018 2019
YTD
(Bil. $)
(Bil.
$)
Chart 7: Catastrophe Bond And ILS Market Developments
Source: www.artemis.bm. New issuance and total outstanding by year
Copyright © 2019 by Standard & Poor's Financial Services LLC. All rights reserved.
Collateralized reinsurance
ILWs
Sidecars
Catastrophe bonds
Dec. 31, 2015Dec. 31, 2017Dec. 31, 2018
Mortgage ILS (left scale)
Cat bond and other ILS (left scale)
Total outstanding (right scale)
ILS
38 Global Reinsurance Highlights | 2019
Adverse Development Covers
Re/Insurers Seek Structured Solutions For Their Legacy Business By Saurabh Khasnis, Taoufik Gharib, Hardeep Manku, and David Masters
As competition in the re/insurance market remains heightened, global property and casualty (P/C) re/insurers are rethinking their business strategies and how best to deploy capital resources. Consequently, they’re increasingly using loss portfolio transfers (LPTs) and adverse development covers (ADCs) to de-emphasize their non-core legacy businesses that no longer offer optimal risk-return opportunities.
Shu
tter
stoc
k /
Ari
s S
uwan
mal
ee
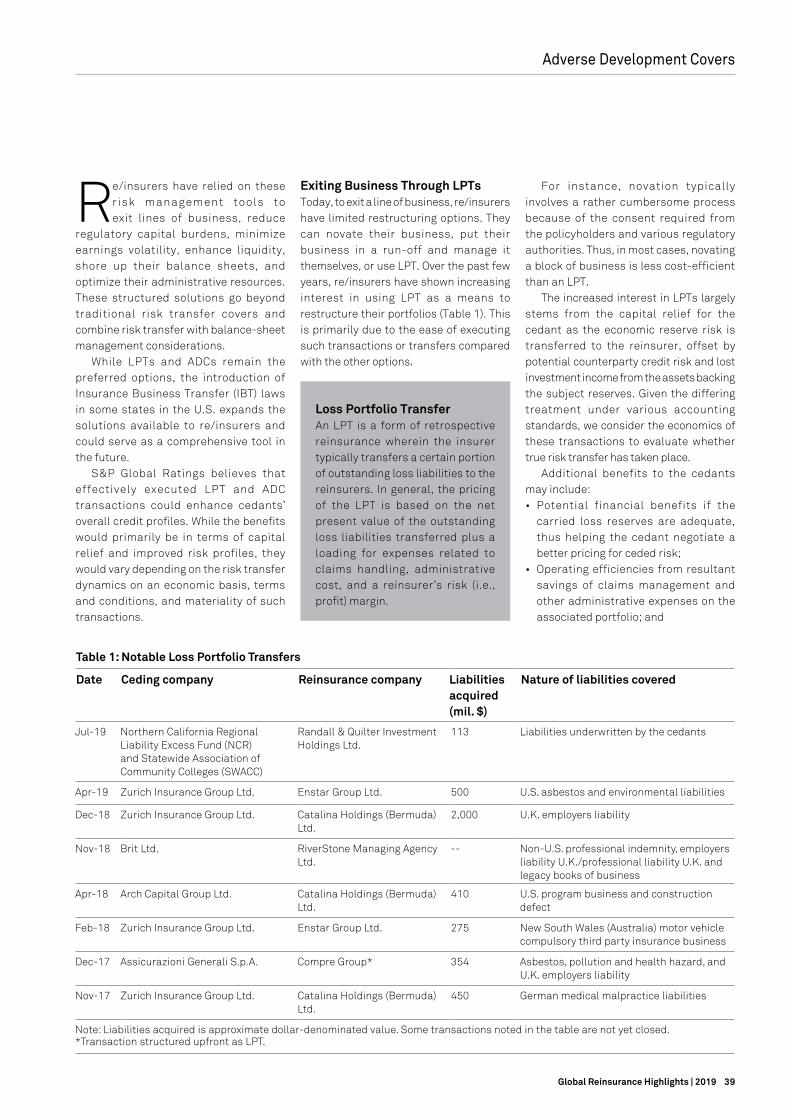
39Global Reinsurance Highlights | 2019
Adverse Development Covers
Exiting Business Through LPTsToday, to exit a line of business, re/insurers have limited restructuring options. They can novate their business, put their business in a run-off and manage it themselves, or use LPT. Over the past few years, re/insurers have shown increasing interest in using LPT as a means to restructure their portfolios (Table 1). This is primarily due to the ease of executing such transactions or transfers compared with the other options.
For instance, novation typically involves a rather cumbersome process because of the consent required from the policyholders and various regulatory authorities. Thus, in most cases, novating a block of business is less cost-efficient than an LPT.
The increased interest in LPTs largely stems from the capital relief for the cedant as the economic reserve risk is transferred to the reinsurer, offset by potential counterparty credit risk and lost investment income from the assets backing the subject reserves. Given the differing treatment under various accounting standards, we consider the economics of these transactions to evaluate whether true risk transfer has taken place.
Additional benefits to the cedants may include:• Potential financial benefits if the
carried loss reserves are adequate, thus helping the cedant negotiate a better pricing for ceded risk;
• Operating efficiencies from resultant savings of claims management and other administrative expenses on the associated portfolio; and
Re/insurers have relied on these r isk management tools to exit lines of business, reduce
regulatory capital burdens, minimize earnings volatility, enhance liquidity, shore up their balance sheets, and optimize their administrative resources. These structured solutions go beyond traditional risk transfer covers and combine risk transfer with balance-sheet management considerations.
While LPTs and ADCs remain the preferred options, the introduction of Insurance Business Transfer (IBT) laws in some states in the U.S. expands the solutions available to re/insurers and could serve as a comprehensive tool in the future.
S&P Global Ratings believes that effectively executed LPT and ADC transactions could enhance cedants’ overall credit profiles. While the benefits would primarily be in terms of capital relief and improved risk profiles, they would vary depending on the risk transfer dynamics on an economic basis, terms and conditions, and materiality of such transactions.
Loss Portfolio Transfer An LPT is a form of retrospective reinsurance wherein the insurer typically transfers a certain portion of outstanding loss liabilities to the reinsurers. In general, the pricing of the LPT is based on the net present value of the outstanding loss liabilities transferred plus a loading for expenses related to claims handling, administrative cost, and a reinsurer’s risk (i.e., profit) margin.
Table 1: Notable Loss Portfolio Transfers
Date Ceding company Reinsurance company Liabilities acquired(mil. $)
Nature of liabilities covered
Jul-19 Northern California Regional Liability Excess Fund (NCR) and Statewide Association of Community Colleges (SWACC)
Randall & Quilter Investment Holdings Ltd.
113 Liabilities underwritten by the cedants
Apr-19 Zurich Insurance Group Ltd. Enstar Group Ltd. 500 U.S. asbestos and environmental liabilities
Dec-18 Zurich Insurance Group Ltd. Catalina Holdings (Bermuda) Ltd.
2,000 U.K. employers liability
Nov-18 Brit Ltd. RiverStone Managing Agency Ltd.
-- Non-U.S. professional indemnity, employers liability U.K./professional liability U.K. and legacy books of business
Apr-18 Arch Capital Group Ltd. Catalina Holdings (Bermuda) Ltd.
410 U.S. program business and construction defect
Feb-18 Zurich Insurance Group Ltd. Enstar Group Ltd. 275 New South Wales (Australia) motor vehicle compulsory third party insurance business
Dec-17 Assicurazioni Generali S.p.A. Compre Group* 354 Asbestos, pollution and health hazard, and U.K. employers liability
Nov-17 Zurich Insurance Group Ltd. Catalina Holdings (Bermuda) Ltd.
450 German medical malpractice liabilities
Note: Liabilities acquired is approximate dollar-denominated value. Some transactions noted in the table are not yet closed. *Transaction structured upfront as LPT.

40 Global Reinsurance Highlights | 2019
• The potential for better capital a l l o c a t i o n a n d r e d e p l o y m e n t opportunities.
In most cases, we have observed that LPTs involve long-tail commercial liability lines such as asbestos and environmental, workers’ compensation, and professional liability. The higher uncertainty around the actual amount and the timing of claim payments prompts cedants to undertake LPTs. Reinsurers typically underwrite such covers on these long-tail liabilities as they price these LPT contracts on a discounted cash flow basis. So, the longer the duration of the contract, the more opportunities reinsurers have to generate investment income from the assets received under the transaction. In addition, reinsurers leverage their expertise in claims handling to enhance the positive payoffs from such transactions.
On the flipside, cedants could face credit and reputational risks in the event of non-payment or inadequate claims handling by the reinsurers. Also, differences in the actuarial opinion on the transferred loss liabilities between the cedant and the reinsurer may increase reinsurance costs for the cedants. Similarly, reinsurers failing to price the transactions adequately may face negative returns from larger-than-
expected claim payments. They could also face lower investment income from shortened reserve duration due to faster-than-expected claim payouts.
In our assessment of the reinsurers underwriting such transactions, we also factor in management’s expertise and experience in handling LPTs, adequacy of reserves assumed, and claims management, among other things. We also consider the potential risks from the concentration or diversification benefits of long-tail liabilities in the reinsurers’ overall underwriting portfolio.
Mitigating Earnings And Capital Volatility Through ADCsIn light of challenging market conditions, g e n e r a t i n g u n d e r w r i t i n g p r o f i t s while maintaining rate adequacy and minimizing earnings volatility remains a key focus for re/insurers. As such, re/insurers have increasingly used ADCs to mitigate earnings volatility (Table 2).
Over the past few years, we have seen re/insurers purchase ADCs, particularly for some of their commercial liability lines. The landmark ADC bought by American International Group Inc. (AIG) from National Indemnity Co. (NICO, a subsidiary of Berkshire Hathaway Inc.) provides 80% coverage of $25 billion in excess of the first $25 billion of subject reserves (U.S. casualty reserves for accident years 2015 and prior). Underpinning AIG’s, as well as most of the other re/insurers’, purchase of ADC is the intention of curtailing earnings and capital volatility amid weakened operating results.
Apart from stabilizing earnings, ADCs also help facilitate smoother mergers and acquisitions, wherein the acquirer is less concerned about potential volatility from reserve adequacy of the target company’s legacy portfolio. This reduces the need for in-depth actuarial due diligence or additional capital infusion requirements.
As an example, in May 2019, The Hartford Financial Services Group Inc. purchased a $300 million ADC from NICO during its acquisition of Navigators Group Inc. As part of the ADC, NICO covers any adverse reserve developments in excess of $100 million above Navigators’ loss reserves as of Dec. 31, 2018.
ADCs rel ieve cedants of the
Adverse Development Covers
Adverse Development Cover An ADC is similar to a limited stop loss reinsurance treaty providing coverage against adverse reserve development over and above the loss reserves agreed in the contract.
Table 2: Notable Adverse Development Covers
Year Ceding company Reinsurance company
Liabilities covered (mil. $)
Nature of liabilities covered
Aug-19 Maiden Holdings Ltd. Enstar Group Ltd. 600 Losses incurred on or prior to Dec. 31, 2018, in excess of retention
May-19 The Hartford Financial Services Group Inc. National Indemnity Co. 300 The Navigators Group Inc. reserves as of Dec. 31, 2018, in excess of retention
Jul-17 AmTrust Financial Services Inc. Premia Holdings Ltd. 1,025 All liabilities underwritten by cedant
Jan-17 American International Group Inc. National Indemnity Co. 20,000 U.S. commercial long-tail exposures
Jan-17 The Hartford Financial Services Group Inc. National Indemnity Co. 1,500 Asbestos and environmental reserves
Jul-14 Liberty Mutual Group Inc. National Indemnity Co. 6,500 U.S. asbestos and environmental liabilities and workers’ compensation
Note: Liabilities covered is approximate dollar-denominated value. Some transactions noted in the table are not yet closed. Transactions include liabilities ceded under retroactive reinsurance agreement.
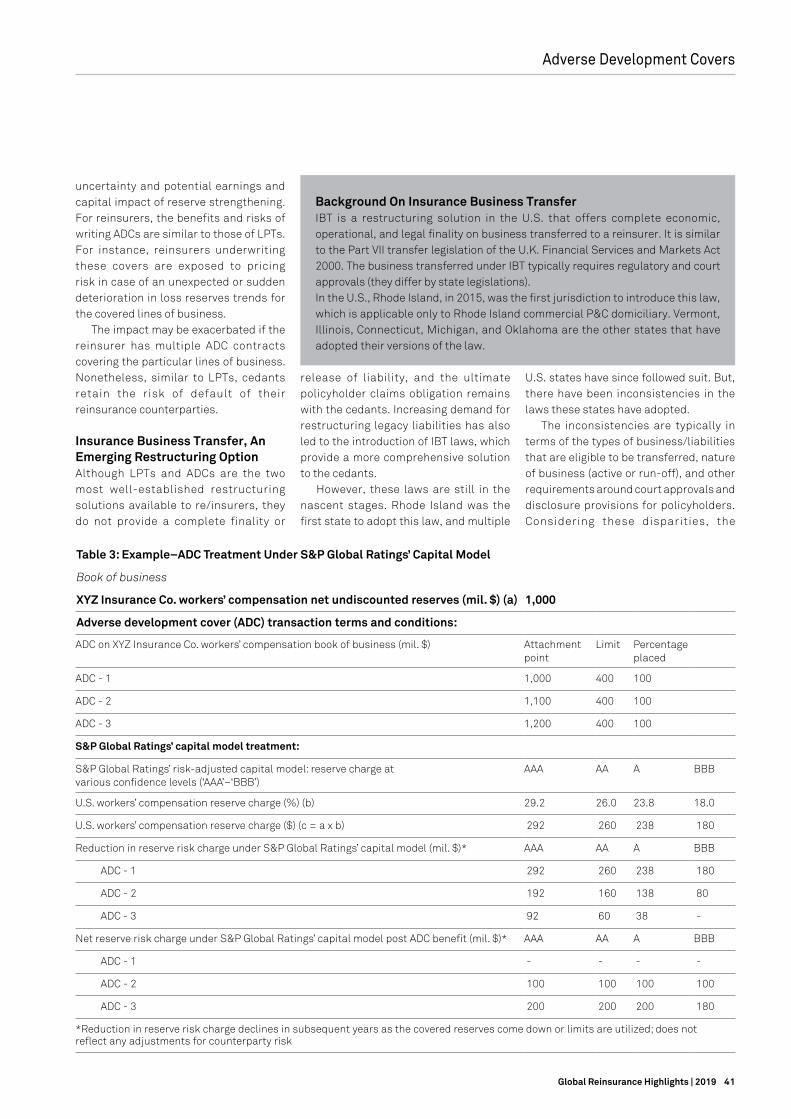
41Global Reinsurance Highlights | 2019
uncertainty and potential earnings and capital impact of reserve strengthening. For reinsurers, the benefits and risks of writing ADCs are similar to those of LPTs. For instance, reinsurers underwriting these covers are exposed to pricing risk in case of an unexpected or sudden deterioration in loss reserves trends for the covered lines of business.
The impact may be exacerbated if the reinsurer has multiple ADC contracts covering the particular lines of business. Nonetheless, similar to LPTs, cedants retain the risk of default of their reinsurance counterparties.
Insurance Business Transfer, An Emerging Restructuring Option Although LPTs and ADCs are the two most well-established restructuring solutions available to re/insurers, they do not provide a complete finality or
release of liability, and the ultimate policyholder claims obligation remains with the cedants. Increasing demand for restructuring legacy liabilities has also led to the introduction of IBT laws, which provide a more comprehensive solution to the cedants.
However, these laws are still in the nascent stages. Rhode Island was the first state to adopt this law, and multiple
U.S. states have since followed suit. But, there have been inconsistencies in the laws these states have adopted.
The inconsistencies are typically in terms of the types of business/liabilities that are eligible to be transferred, nature of business (active or run-off), and other requirements around court approvals and disclosure provisions for policyholders. Considering these disparities, the
Adverse Development Covers
Background On Insurance Business Transfer IBT is a restructuring solution in the U.S. that offers complete economic, operational, and legal finality on business transferred to a reinsurer. It is similar to the Part VII transfer legislation of the U.K. Financial Services and Markets Act 2000. The business transferred under IBT typically requires regulatory and court approvals (they differ by state legislations). In the U.S., Rhode Island, in 2015, was the first jurisdiction to introduce this law, which is applicable only to Rhode Island commercial P&C domiciliary. Vermont, Illinois, Connecticut, Michigan, and Oklahoma are the other states that have adopted their versions of the law.
Table 2: Notable Adverse Development Covers
Year Ceding company Reinsurance company
Liabilities covered (mil. $)
Nature of liabilities covered
Aug-19 Maiden Holdings Ltd. Enstar Group Ltd. 600 Losses incurred on or prior to Dec. 31, 2018, in excess of retention
May-19 The Hartford Financial Services Group Inc. National Indemnity Co. 300 The Navigators Group Inc. reserves as of Dec. 31, 2018, in excess of retention
Jul-17 AmTrust Financial Services Inc. Premia Holdings Ltd. 1,025 All liabilities underwritten by cedant
Jan-17 American International Group Inc. National Indemnity Co. 20,000 U.S. commercial long-tail exposures
Jan-17 The Hartford Financial Services Group Inc. National Indemnity Co. 1,500 Asbestos and environmental reserves
Jul-14 Liberty Mutual Group Inc. National Indemnity Co. 6,500 U.S. asbestos and environmental liabilities and workers’ compensation
Note: Liabilities covered is approximate dollar-denominated value. Some transactions noted in the table are not yet closed. Transactions include liabilities ceded under retroactive reinsurance agreement.
Table 3: Example–ADC Treatment Under S&P Global Ratings’ Capital Model
Book of business
XYZ Insurance Co. workers’ compensation net undiscounted reserves (mil. $) (a) 1,000
Adverse development cover (ADC) transaction terms and conditions:
ADC on XYZ Insurance Co. workers’ compensation book of business (mil. $) Attachment point
Limit Percentage placed
ADC - 1 1,000 400 100
ADC - 2 1,100 400 100
ADC - 3 1,200 400 100
S&P Global Ratings’ capital model treatment:
S&P Global Ratings’ risk-adjusted capital model: reserve charge at various confidence levels (‘AAA’–‘BBB’)
AAA AA A BBB
U.S. workers’ compensation reserve charge (%) (b) 29.2 26.0 23.8 18.0
U.S. workers’ compensation reserve charge ($) (c = a x b) 292 260 238 180
Reduction in reserve risk charge under S&P Global Ratings’ capital model (mil. $)* AAA AA A BBB
ADC - 1 292 260 238 180
ADC - 2 192 160 138 80
ADC - 3 92 60 38 -
Net reserve risk charge under S&P Global Ratings’ capital model post ADC benefit (mil. $)* AAA AA A BBB
ADC - 1 - - - -
ADC - 2 100 100 100 100
ADC - 3 200 200 200 180
*Reduction in reserve risk charge declines in subsequent years as the covered reserves come down or limits are utilized; does not reflect any adjustments for counterparty risk
42 Global Reinsurance Highlights | 2019
National Association of Insurance Commissioners (NAIC) has formed a Restructuring Mechanisms Working Group and a Restructuring Mechanisms Subgroup to oversee various legal and financial issues related to IBT and district laws.
So far, we have not seen any re/insurer undertake an IBT transaction. We believe that a wider and more consistent adoption of IBT law across all states in the U.S. will take a while. Nevertheless, if adopted, IBT could act as a comprehensive restructuring tool for re/insurers in the U.S. and can be a successful equivalent to the Part VII transfers in the U.K.
LPTs And ADCs Could Be Credit-Positive For CedantsWe believe that effectively executed LPT and ADC transactions could enhance cedants’ financial risk profiles and overall creditworthiness. For this to be the case, the transaction has to be a true risk transfer, with explicit attachment or trigger points (the point at which reinsurance limits apply) and clear terms and conditions.
As a result, the capital requirements on the subject reserves could be reduced. Thus, our quantitative capital and earnings assessment of a cedant could improve, depending on the structure of the transaction and remoteness of the attachment point being triggered. (The associated increase in counterparty risk slightly offsets these benefits.)
Furthermore, these transactions could enhance our view of overall risk exposure, to the extent they mitigate prospective reserves and earnings volatility.
An Example Of Potential ADC Treatment Under Our Capital ModelHere we provide an example of the potential quantitative benefits of an ADC transaction to the cedants under our risk-adjusted capital adequacy model (Table 3). Given that each ADC transaction is unique and the terms and conditions may vary, our assessment may differ on a case-by-case basis, so this example should not be viewed as guidance.
We assume that XYZ Insurance Co. has purchased a $400 million ADC above its current loss reserves for its U.S. workers’ compensation line of business. Under the three scenarios, we have assumed different attachment points. As the attachment points are further away from the covered reserves, the probability of them triggering becomes remote.
Thus, the quantitative benefits under our capital model (relief on reserve risk charge) are lower. This is reflected in our example. ADC-1 gets full capital relief of $292 million of reserve charge, while ADC-3 gets only up to $92 million. This is because the ADC-1 attachment is “at the money”, while ADC-3 attachment is “out of the money”. Offsetting reserve capital relief is an increase in counterparty risk.
Substantial Opportunities Lie AheadWe believe re/insurers will continue to strive to achieve better risk-adjusted returns by redeploying capital to focus on their bread-and-butter business. As re/insurers contemplate mergers and acquisitions, management teams could seek structured solutions to mitigate their exposure to legacy business. In addition, re/insurers may need to prune unprofitable non-core products as the sector is coming out of a soft pricing cycle. As a result, we expect re/insurers to increasingly use LPTs and ADCs.
In our view, by offering structured solutions, reinsurers have the potential to form long-term partnerships with cedants with more tailor-made pricing, compared with traditional risk transfer products. But they also require intense underwriting and claim expertise for the acquired lines of business, and scale depending on the size of the transaction—for example, the ADC bought by AIG from NICO. However, if these structured solutions aren’t properly managed, they can weaken reinsurers’ creditworthiness.
We could assess ADCs and LPTs as a credit-positive for cedants if they are well executed and we view them as true risk transfers. However, these may not be comprehensive solutions, and the ultimate risk of claim payment would still lie with the cedants. A promising
prospect is the IBT laws introduced in some states in the U.S., but a consistent application of the laws across states could take a while, so we may have to wait to see a more widespread use of IBT as a strategic tool. n
This report does not constitute a rating action.
Saurabh KhasnisCentennial, (1) [email protected]
Taoufik GharibNew York, (1) [email protected]
Hardeep MankuToronto, (1) [email protected]
David MastersLondon, (44) [email protected]

43Global Reinsurance Highlights | 2019
2019 European Insurance Conference: Will Insurers Survive the Low Rate False Dawn?
S&P Global Ratings and S&P Global Market Intelligence are looking forward to hosting their 2019 European Insurance Conference. Following recent dovish tones and accommodative actions from major global central banks, the industry’s familiar foe - low, or even negative interest rates - looks to have regained the top spot as a key concern for insurers’ earnings and balance sheets in the coming years. The industry is on the cusp of a fundamental change to the insurance business model as technology and evolving consumer behaviours demand a re-think of the insurance value proposition, whilst the evolution of accounting and regulation add further demand on the industry.
Join us in London as insurance thought leaders and industry executives discuss these trends and their implications for the future of the sector, and network with industry peers and S&P Global representatives.
2019 European Insurance Conference November 6, 2019
Leonardo Royal Hotel London Tower Bridge 45 Prescot Street London E1 8GP
Visit spratings.com/events to register, view the agenda and get up-to-date information. For questions, email: [email protected]

44 Global Reinsurance Highlights | 2019
Reinsurance M&A
More Consolidation To Come For Global Reinsurers
By Ali Karakuyu, Johannes Bender, David Masters, Taoufik Gharib, and Hardeep Manku
The global reinsurance sector continues to face challenging business conditions, although the sector managed to benefit from modest rate increases in 2018 and in the first half of 2019, after record back-to-back catastrophe losses in 2017 and 2018. However, pressure on the sector’s earnings continues, with plentiful traditional and alternative capacity, changing cedants’ demand, and the commoditization of property risks.
Shu
tter
stoc
k /
NE
SP
IX
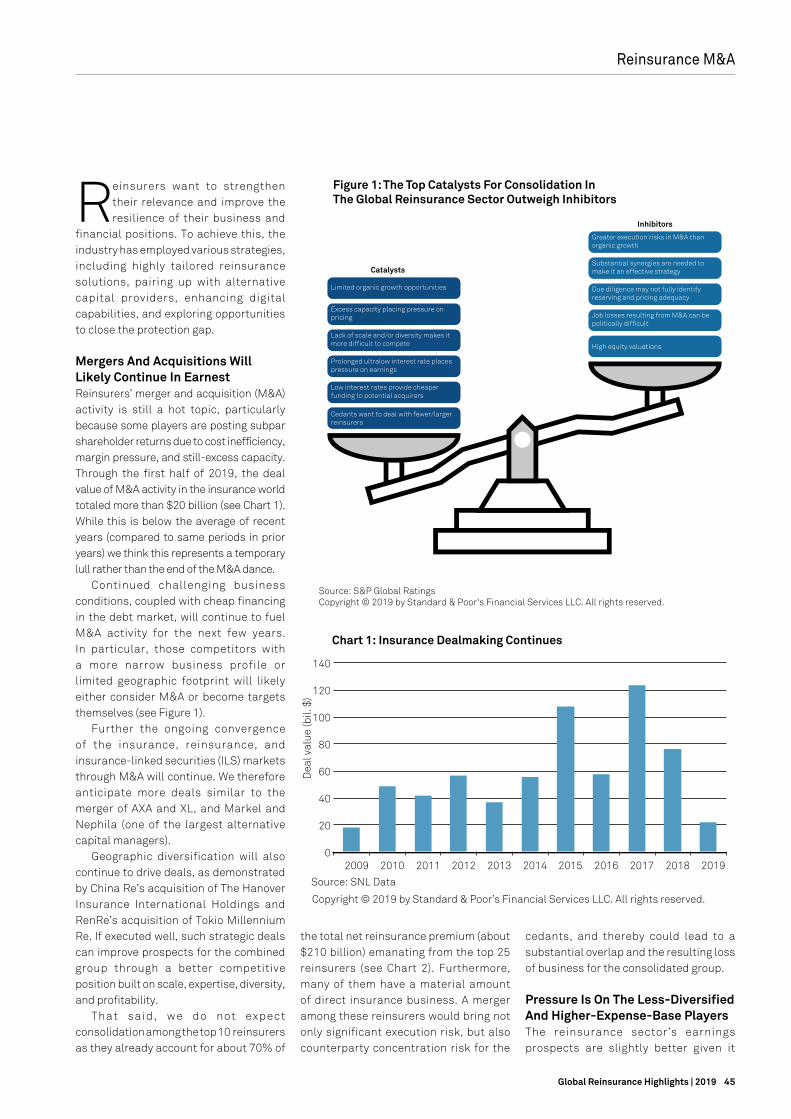
45Global Reinsurance Highlights | 2019
Reinsurance M&A
the total net reinsurance premium (about $210 billion) emanating from the top 25 reinsurers (see Chart 2). Furthermore, many of them have a material amount of direct insurance business. A merger among these reinsurers would bring not only significant execution risk, but also counterparty concentration risk for the
Reinsurers want to strengthen their relevance and improve the resilience of their business and
financial positions. To achieve this, the industry has employed various strategies, including highly tailored reinsurance solutions, pairing up with alternative capital providers, enhancing digital capabilities, and exploring opportunities to close the protection gap.
Mergers And Acquisitions Will Likely Continue In EarnestReinsurers’ merger and acquisition (M&A) activity is still a hot topic, particularly because some players are posting subpar shareholder returns due to cost inefficiency, margin pressure, and still-excess capacity. Through the first half of 2019, the deal value of M&A activity in the insurance world totaled more than $20 billion (see Chart 1). While this is below the average of recent years (compared to same periods in prior years) we think this represents a temporary lull rather than the end of the M&A dance.
Continued challenging business conditions, coupled with cheap financing in the debt market, will continue to fuel M&A activity for the next few years. In particular, those competitors with a more narrow business profile or limited geographic footprint will likely either consider M&A or become targets themselves (see Figure 1).
Further the ongoing convergence of the insurance, reinsurance, and insurance-linked securities (ILS) markets through M&A will continue. We therefore anticipate more deals similar to the merger of AXA and XL, and Markel and Nephila (one of the largest alternative capital managers).
Geographic diversification will also continue to drive deals, as demonstrated by China Re’s acquisition of The Hanover Insurance International Holdings and RenRe’s acquisition of Tokio Millennium Re. If executed well, such strategic deals can improve prospects for the combined group through a better competitive position built on scale, expertise, diversity, and profitability.
That said, we do not expect consolidation among the top 10 reinsurers as they already account for about 70% of
0
20
40
60
80
100
120
140
2019 2018 2017 2016 2015 2014 2013 2012 2011 2010 2009
Chart 1: Insurance Dealmaking Continues
Source: SNL Data
Copyright © 2019 by Standard & Poor’s Financial Services LLC. All rights reserved.
0
18
16
14
12
10
8
6
4
2
0
1.6
1.4
1.2
1.0
0.8
0.6
0.4
0.2
0.0
5,000
10,000
15,000
20,000
25,000
30,000
35,000
Mil. $
Net reinsurance premium written
Chart 2: Top 25 Reinsurers In 2018
*Figures represent the group as a whole,including primary business.
Copyright © 2019 by Standard & Poor's Financial Services LLC. All rights reserved.
2005
2006
2007
2008
2009
2010
2011
2012
2013
2014
2015
2016
2017
2018
(X)
(%)
Chart 3: Global Reinsurers’ Return On Capital And Price To Book Value
Return on capital (left scale) Price to book ratio (right scale)
Copyright © 2019 by Standard & Poor’s Financial Services LLC. All rights reserved.
Source: S&P Global Ratings.
0.0
0.5
1.0
1.5
2.0
2.5
3.0
2009
2010
2011
2012
2013
2014
2015
2016
2017
2018
(x)
Chart 4: Global Equity Valuations Trend–Insurers Trade At Lower Multiples
MSCI World Insurance Index (MXWO0IS): price to book ratio
MSCI World Index (MXWO): price to book ratio
Copyright © 2019 by Standard & Poor’s Financial Services LLC. All rights reserved.
Source: Bloomberg.
63%
27%
7%3%
Chart 5: Outlook On AcquirersUpon Announcement Of Acquisition
Source: S&P Global Ratings.
Copyright © 2019 by Standard & Poor’s Financial Services LLC.All rights reserved.
32%
23%
18%
14%
9%
4%
Chart 6: Outlook On Acquirees UponAnnouncement Of Acquisition
Stable Negative
Watch Neg Watch Pos
Positive Developing
Stable Negative
Positive Watch Neg
Source: S&P Global Ratings.
Copyright © 2019 by Standard & Poor’s Financial Services LLC.All rights reserved.
Dea
l val
ue (b
il. $
)
Swiss Reinsurance Co.*Munich Reinsurance Co.
Hannover Rück SEBerkshire Hathaway Re
SCOR SEChina Reinsurance (Group) Corp
Reinsurance Group of America, Inc. Lloyd’s
Everest Re Group Ltd.PartnerRe Ltd.
General Insurance Corporation of IndiaMS&AD Insurance Group Holdings, Inc.
Korean Reinsurance Co.Transatlantic Holdings Inc
Sompo Holdings, Inc.Mapfre Re
R+V Versicherung AGFairfax Financial Holdings Ltd.
Tokio Marine & Nichido Fire Insurance Co. Ltd.AXIS Capital Holdings Ltd.
Toa Re Co Ltd.RenaissanceRe Holdings Ltd.
Validus Reinsurance Ltd.Caisse Centrale de Reassurance
Arch Capital Group Ltd.
Figure 1: The Top Catalysts For Consolidation In The Global Reinsurance Sector Outweigh Inhibitors
Source: S&P Global RatingsCopyright © 2019 by Standard & Poor's Financial Services LLC. All rights reserved.
cedants, and thereby could lead to a substantial overlap and the resulting loss of business for the consolidated group.
Pressure Is On The Less-Diversified And Higher-Expense-Base PlayersThe reinsurance sector’s earnings prospects are slightly better given it

46 Global Reinsurance Highlights | 2019
managed to stop the pricing decline in 2018 and achieved a slight increase in 2019 after heavy catastrophe losses in 2018 and 2017. However, conditions remain somewhat difficult. We do not foresee a significant change in these underlying conditions because there is enough capital on the sidelines waiting to join the sector.
Competitive pressure, in our view, is more intense for reinsurers that are less diversified or suffer from higher expense ratios relative to peers. Many of the reinsurers continue to focus on cost efficiencies to mitigate margin pressure. This is not a surprise, bearing in mind that the average expense ratio for the top 20 rated reinsurers is about 36% (and the average acquisition ratio at about 23%), with a few above 40%.
While we recognize that part of the high expense ratio is due to offering value-added services, expense management is on the agenda for most reinsurers in order to stay competitive. For example, Lloyd’s expense ratio is significantly higher than that of peers (39.2% in 2018). This is due, in part, to high acquisition costs, but also to Lloyd’s dependence on coverholders who produce close to 30% of its premium. Lloyd’s management is working to change its operating model to address this issue by introducing initiatives such as electronic placement and simplifying claims handling.
Diversified players with scale, breadth, and depth of products, sophisticated underwriting capabilities, and the ability to build long-term partnerships with cedants are better positioned, in our view, to navigate the difficult business conditions. These factors provide reinsurers with greater flexibility to change the portfolio mix by dynamically increasing or decreasing the line size across products and markets as pricing/conditions change.
Further, cedants’ expectations have evolved. In recognition, some global reinsurers have upped their game by offering tailored reinsurance and capital market solutions that help with the risk management and capital strategies of clients. Such product offerings mitigate the risk of being marginalized because clients are more likely to stick to reinsurers that offer long-term partnerships.
Good targets are increasingly harder to findSmall-to-midsize specialty reinsurers or insurers with a niche sector focus that have good underwriting books are appealing targets for players that seek growth and
diversification. However, the number of potential targets within this space has shrunk, reflecting the significant number of M&A deals over the past decade.
Despite lower returns on capital in recent years, price-to-book valuations
Reinsurance M&A0
20
40
60
80
100
120
140
2019 2018 2017 2016 2015 2014 2013 2012 2011 2010 2009
Chart 1: Insurance Dealmaking Continues
Source: SNL Data
Copyright © 2019 by Standard & Poor’s Financial Services LLC. All rights reserved.
0
18
16
14
12
10
8
6
4
2
0
1.6
1.4
1.2
1.0
0.8
0.6
0.4
0.2
0.0
5,000
10,000
15,000
20,000
25,000
30,000
35,000
Mil. $
Net reinsurance premium written
Chart 2: Top 25 Reinsurers In 2018
*Figures represent the group as a whole,including primary business.
Copyright © 2019 by Standard & Poor's Financial Services LLC. All rights reserved.
2005
2006
2007
2008
2009
2010
2011
2012
2013
2014
2015
2016
2017
2018
(X)
(%)
Chart 3: Global Reinsurers’ Return On Capital And Price To Book Value
Return on capital (left scale) Price to book ratio (right scale)
Copyright © 2019 by Standard & Poor’s Financial Services LLC. All rights reserved.
Source: S&P Global Ratings.
0.0
0.5
1.0
1.5
2.0
2.5
3.0
2009
2010
2011
2012
2013
2014
2015
2016
2017
2018
(x)
Chart 4: Global Equity Valuations Trend–Insurers Trade At Lower Multiples
MSCI World Insurance Index (MXWO0IS): price to book ratio
MSCI World Index (MXWO): price to book ratio
Copyright © 2019 by Standard & Poor’s Financial Services LLC. All rights reserved.
Source: Bloomberg.
63%
27%
7%3%
Chart 5: Outlook On AcquirersUpon Announcement Of Acquisition
Source: S&P Global Ratings.
Copyright © 2019 by Standard & Poor’s Financial Services LLC.All rights reserved.
32%
23%
18%
14%
9%
4%
Chart 6: Outlook On Acquirees UponAnnouncement Of Acquisition
Stable Negative
Watch Neg Watch Pos
Positive Developing
Stable Negative
Positive Watch Neg
Source: S&P Global Ratings.
Copyright © 2019 by Standard & Poor’s Financial Services LLC.All rights reserved.
Dea
l val
ue (b
il. $
)
Swiss Reinsurance Co.*Munich Reinsurance Co.
Hannover Rück SEBerkshire Hathaway Re
SCOR SEChina Reinsurance (Group) Corp
Reinsurance Group of America, Inc. Lloyd’s
Everest Re Group Ltd.PartnerRe Ltd.
General Insurance Corporation of IndiaMS&AD Insurance Group Holdings, Inc.
Korean Reinsurance Co.Transatlantic Holdings Inc
Sompo Holdings, Inc.Mapfre Re
R+V Versicherung AGFairfax Financial Holdings Ltd.
Tokio Marine & Nichido Fire Insurance Co. Ltd.AXIS Capital Holdings Ltd.
Toa Re Co Ltd.RenaissanceRe Holdings Ltd.
Validus Reinsurance Ltd.Caisse Centrale de Reassurance
Arch Capital Group Ltd.
0
20
40
60
80
100
120
140
2019 2018 2017 2016 2015 2014 2013 2012 2011 2010 2009
Chart 1: Insurance Dealmaking Continues
Source: SNL Data
Copyright © 2019 by Standard & Poor’s Financial Services LLC. All rights reserved.
0
18
16
14
12
10
8
6
4
2
0
1.6
1.4
1.2
1.0
0.8
0.6
0.4
0.2
0.0
5,000
10,000
15,000
20,000
25,000
30,000
35,000
Mil. $
Net reinsurance premium written
Chart 2: Top 25 Reinsurers In 2018
*Figures represent the group as a whole,including primary business.
Copyright © 2019 by Standard & Poor's Financial Services LLC. All rights reserved.
2005
2006
2007
2008
2009
2010
2011
2012
2013
2014
2015
2016
2017
2018
(X)
(%)
Chart 3: Global Reinsurers’ Return On Capital And Price To Book Value
Return on capital (left scale) Price to book ratio (right scale)
Copyright © 2019 by Standard & Poor’s Financial Services LLC. All rights reserved.
Source: S&P Global Ratings.
0.0
0.5
1.0
1.5
2.0
2.5
3.0
2009
2010
2011
2012
2013
2014
2015
2016
2017
2018
(x)
Chart 4: Global Equity Valuations Trend–Insurers Trade At Lower Multiples
MSCI World Insurance Index (MXWO0IS): price to book ratio
MSCI World Index (MXWO): price to book ratio
Copyright © 2019 by Standard & Poor’s Financial Services LLC. All rights reserved.
Source: Bloomberg.
63%
27%
7%3%
Chart 5: Outlook On AcquirersUpon Announcement Of Acquisition
Source: S&P Global Ratings.
Copyright © 2019 by Standard & Poor’s Financial Services LLC.All rights reserved.
32%
23%
18%
14%
9%
4%
Chart 6: Outlook On Acquirees UponAnnouncement Of Acquisition
Stable Negative
Watch Neg Watch Pos
Positive Developing
Stable Negative
Positive Watch Neg
Source: S&P Global Ratings.
Copyright © 2019 by Standard & Poor’s Financial Services LLC.All rights reserved.
Dea
l val
ue (b
il. $
)
Swiss Reinsurance Co.*Munich Reinsurance Co.
Hannover Rück SEBerkshire Hathaway Re
SCOR SEChina Reinsurance (Group) Corp
Reinsurance Group of America, Inc. Lloyd’s
Everest Re Group Ltd.PartnerRe Ltd.
General Insurance Corporation of IndiaMS&AD Insurance Group Holdings, Inc.
Korean Reinsurance Co.Transatlantic Holdings Inc
Sompo Holdings, Inc.Mapfre Re
R+V Versicherung AGFairfax Financial Holdings Ltd.
Tokio Marine & Nichido Fire Insurance Co. Ltd.AXIS Capital Holdings Ltd.
Toa Re Co Ltd.RenaissanceRe Holdings Ltd.
Validus Reinsurance Ltd.Caisse Centrale de Reassurance
Arch Capital Group Ltd.

47Global Reinsurance Highlights | 2019
have steadily increased (see Chart 3). Equity valuation multiples, however, are lower when compared to all corporations (see Chart 4), mostly because of the capital intensity of the insurance sector (some of the M&A deals or divestments in the insurance sector have been driven by increasing capital demands from regulators). These multiples would be even lower if off-balance soft forms capital (i.e., present value of future
profit on the life insurance side) were included. Nonetheless, with the increased valuations, the argument for acquisition is harder to justify to shareholders as the sector continues to struggle to meet its cost of capital.
Ultimately, the attractiveness of the target’s business model and its ability to generate acceptable returns relative to yields available elsewhere continue to motivate the deals.
Reinsurance M&A
“Competitive pressure is more intense for reinsurers that are less diversified or suffer from higher expense ratios relative to peers.”
Recent M&A highlights in the reinsurance space include the following:• Apollo Global Management’s new private
equity fund completed its acquisition of Aspen, with a view toward strengthening the majority of its existing business, jettisoning unprofitable business, and building on the operational efficiency program that Aspen had launched.
• RenRe acquired Tokio Millennium Re. The transaction is sizable, providing RenRe with greater access to risk, increasing its scale, raising its relative importance to its clients and brokers, and broadening its footprint geographically and in the casualty business, which it has been ramping up.
• China Re acquired The Hanover Insurance International Holdings Ltd., including its flagship Lloyd’s Syndicate 1084. We expect this acquisition to help strengthen China Re’s existing presence (including Syndicate 2088) within the Lloyd’s market and to further geographical diversification outside the domestic Chinese market.
Acquisitions of alternative capital managers is also heating upAlternative capital has grown in importance (making up 15% of total reinsurance capital, which stood at $605 billion at the end of March 2019 according to Aon). In recognition, reinsurers and some insurers continue to build their strategies around alternative capital to harness the opportunities pertaining to this area.
In 2018, Markel Corp. acquired Nephila Holdings Ltd. (with assets under management over $10 billion), specializing in reinsurance product offering a broad range of reinsurance products, including ILS and catastrophe bonds. SCOR is acquiring Coriolis Capital (about $800 million of assets) to boost its alternative asset management
0
20
40
60
80
100
120
140
2019 2018 2017 2016 2015 2014 2013 2012 2011 2010 2009
Chart 1: Insurance Dealmaking Continues
Source: SNL Data
Copyright © 2019 by Standard & Poor’s Financial Services LLC. All rights reserved.
0
18
16
14
12
10
8
6
4
2
0
1.6
1.4
1.2
1.0
0.8
0.6
0.4
0.2
0.0
5,000
10,000
15,000
20,000
25,000
30,000
35,000
Mil. $
Net reinsurance premium written
Chart 2: Top 25 Reinsurers In 2018
*Figures represent the group as a whole,including primary business.
Copyright © 2019 by Standard & Poor's Financial Services LLC. All rights reserved.
2005
2006
2007
2008
2009
2010
2011
2012
2013
2014
2015
2016
2017
2018
(X)
(%)
Chart 3: Global Reinsurers’ Return On Capital And Price To Book Value
Return on capital (left scale) Price to book ratio (right scale)
Copyright © 2019 by Standard & Poor’s Financial Services LLC. All rights reserved.
Source: S&P Global Ratings.
0.0
0.5
1.0
1.5
2.0
2.5
3.0
2009
2010
2011
2012
2013
2014
2015
2016
2017
2018
(x)
Chart 4: Global Equity Valuations Trend–Insurers Trade At Lower Multiples
MSCI World Insurance Index (MXWO0IS): price to book ratio
MSCI World Index (MXWO): price to book ratio
Copyright © 2019 by Standard & Poor’s Financial Services LLC. All rights reserved.
Source: Bloomberg.
63%
27%
7%3%
Chart 5: Outlook On AcquirersUpon Announcement Of Acquisition
Source: S&P Global Ratings.
Copyright © 2019 by Standard & Poor’s Financial Services LLC.All rights reserved.
32%
23%
18%
14%
9%
4%
Chart 6: Outlook On Acquirees UponAnnouncement Of Acquisition
Stable Negative
Watch Neg Watch Pos
Positive Developing
Stable Negative
Positive Watch Neg
Source: S&P Global Ratings.
Copyright © 2019 by Standard & Poor’s Financial Services LLC.All rights reserved.
Dea
l val
ue (b
il. $
)
Swiss Reinsurance Co.*Munich Reinsurance Co.
Hannover Rück SEBerkshire Hathaway Re
SCOR SEChina Reinsurance (Group) Corp
Reinsurance Group of America, Inc. Lloyd’s
Everest Re Group Ltd.PartnerRe Ltd.
General Insurance Corporation of IndiaMS&AD Insurance Group Holdings, Inc.
Korean Reinsurance Co.Transatlantic Holdings Inc
Sompo Holdings, Inc.Mapfre Re
R+V Versicherung AGFairfax Financial Holdings Ltd.
Tokio Marine & Nichido Fire Insurance Co. Ltd.AXIS Capital Holdings Ltd.
Toa Re Co Ltd.RenaissanceRe Holdings Ltd.
Validus Reinsurance Ltd.Caisse Centrale de Reassurance
Arch Capital Group Ltd.
0
20
40
60
80
100
120
140
2019 2018 2017 2016 2015 2014 2013 2012 2011 2010 2009
Chart 1: Insurance Dealmaking Continues
Source: SNL Data
Copyright © 2019 by Standard & Poor’s Financial Services LLC. All rights reserved.
0
18
16
14
12
10
8
6
4
2
0
1.6
1.4
1.2
1.0
0.8
0.6
0.4
0.2
0.0
5,000
10,000
15,000
20,000
25,000
30,000
35,000
Mil. $
Net reinsurance premium written
Chart 2: Top 25 Reinsurers In 2018
*Figures represent the group as a whole,including primary business.
Copyright © 2019 by Standard & Poor's Financial Services LLC. All rights reserved.
2005
2006
2007
2008
2009
2010
2011
2012
2013
2014
2015
2016
2017
2018
(X)
(%)
Chart 3: Global Reinsurers’ Return On Capital And Price To Book Value
Return on capital (left scale) Price to book ratio (right scale)
Copyright © 2019 by Standard & Poor’s Financial Services LLC. All rights reserved.
Source: S&P Global Ratings.
0.0
0.5
1.0
1.5
2.0
2.5
3.0
2009
2010
2011
2012
2013
2014
2015
2016
2017
2018
(x)
Chart 4: Global Equity Valuations Trend–Insurers Trade At Lower Multiples
MSCI World Insurance Index (MXWO0IS): price to book ratio
MSCI World Index (MXWO): price to book ratio
Copyright © 2019 by Standard & Poor’s Financial Services LLC. All rights reserved.
Source: Bloomberg.
63%
27%
7%3%
Chart 5: Outlook On AcquirersUpon Announcement Of Acquisition
Source: S&P Global Ratings.
Copyright © 2019 by Standard & Poor’s Financial Services LLC.All rights reserved.
32%
23%
18%
14%
9%
4%
Chart 6: Outlook On Acquirees UponAnnouncement Of Acquisition
Stable Negative
Watch Neg Watch Pos
Positive Developing
Stable Negative
Positive Watch Neg
Source: S&P Global Ratings.
Copyright © 2019 by Standard & Poor’s Financial Services LLC.All rights reserved.
Dea
l val
ue (b
il. $
)
Swiss Reinsurance Co.*Munich Reinsurance Co.
Hannover Rück SEBerkshire Hathaway Re
SCOR SEChina Reinsurance (Group) Corp
Reinsurance Group of America, Inc. Lloyd’s
Everest Re Group Ltd.PartnerRe Ltd.
General Insurance Corporation of IndiaMS&AD Insurance Group Holdings, Inc.
Korean Reinsurance Co.Transatlantic Holdings Inc
Sompo Holdings, Inc.Mapfre Re
R+V Versicherung AGFairfax Financial Holdings Ltd.
Tokio Marine & Nichido Fire Insurance Co. Ltd.AXIS Capital Holdings Ltd.
Toa Re Co Ltd.RenaissanceRe Holdings Ltd.
Validus Reinsurance Ltd.Caisse Centrale de Reassurance
Arch Capital Group Ltd.

48 Global Reinsurance Highlights | 2019
Table 1: Major Merger And Acquisition Deals In ReinsuranceAnnounced Closed Acquirer Acquiree Purchase
price (bil. $)Terms of the transaction Deal price to
book value (x)
Aug-13 Nov-13 Lancashire Holdings Limited Cathedral Capital Limited 0.41 All cash N.A.
Feb-14 Jun-14 Qatar Insurance Company S.A.Q. Antares Holdings Limited 0.30 N.A. N.A.
Nov-14 Mar-15 RenaissanceRe Holdings Ltd. Platinum Underwriters Holdings Ltd. 1.90 Cash and stock 1.13
Jan-15 May-15 XL Group Ltd. Catlin Group Ltd. 4.10 Cash, stock, and debt 1.21
Feb-15 Jul-15 Fairfax Financial Holdings Ltd. Brit Insurance Holdings PLC 1.88 All cash 1.63
Mar-15 Jul-15 Endurance Specialty Holdings Ltd. Montpelier Re Holdings Ltd. 1.83 Cash and stock 1.21
May-15 Nov-15 Fosun International Ltd. Ironshore Inc. 2.30 All cash 1.12
Jun-15 Oct-15 Tokio Marine & Nichido Fire Insurance Co. Ltd. HCC Insurance Holdings Inc. 7.53 Cash and debt 1.9
Jul-15 Jan-16 ACE Ltd. Chubb Corp. 28.30 Cash, stock, and debt 1.7
Jul-15 Mar-16 Meiji Yasuda Life Insurance Co. StanCorp Financial Group Inc. 4.95 All cash 2.21
Jul-15 Apr-16 China Minsheng Banking Corp. Ltd. Sirius International Insurance Group 2.60 All cash 1.43
Aug-15 Mar-16 EXOR SpA PartnerRe Ltd. 6.90 All cash 1.11
Aug-15 Jan-16 Sumitomo Life Insurance Co. Symetra Financial Corp. 3.80 All cash 1.2
Sep-15 Feb-16 Mitsui Sumitomo Insurance Co. Ltd. Amlin plc 5.30 All cash 1.93
Apr-16 Nov-16 AmTrust Financial Services Inc. ANV Holdings B.V. 0.20 All cash N.M.
Aug-16 Jan-17 Arch Capital Group Ltd. United Guaranty Corp. 3.40 Cash and stock 1.01
Sep-16 Dec-16 Canada Pension Plan Investment Board Ascot Underwriting Ltd. 1.10 All cash N.M.
Oct-16 Mar-17 Sompo Holdings Inc. Endurance Specialty Holdings Ltd. 6.30 All cash 1.36
Oct-16 Apr-17 PartnerRe Ltd. Aurigen Capital Ltd. 0.29 All cash N.A.
Nov-16 Feb-17 Argo Group US Inc. Ariel Re Holdings Ltd. 0.24 Cash and debt 1.45
Nov-16 Apr-17 AXIS Capital Holdings Ltd. Aviabel Cie. Belge d'Assurances Aviation S.A. N.A. N.A. N.A.
Dec-16 May-17 Liberty Mutual Group Inc. Ironshore Inc. 2.94 All cash 1.45
Dec-16 Jul-17 Fairfax Financial Holdings Ltd. Allied World Assurance Co. Holdings AG 4.90 Stock and cash 1.36
May-17 Sep-17 Intact Financial Corp. OneBeacon Insurance Group Ltd. 1.70 All cash 1.66
Jul-17 Oct-17 AXIS Capital Holdings Ltd. Novae Group plc 0.60 All cash 1.53
Feb-18 May-18 Enstar Group Limited KaylaRe Ltd. 0.40 Stock exchange N.A.
Jan-18 Jul-18 American International Group, Inc. Validus Holdings, Ltd. 5.56 All Cash 1.53
Mar-18 Sep-18 AXA Insurance Group XL Group Ltd 15.35 Cash 1.5
Jun-18 Ongoing Reliance Life Limited Equitable Life Assurance Society 2.41 Unclassified N.A.
Aug-18 Ongoing Cinven Limited AXA Life Europe DAC 1.08 Cash 1
Aug-18 Dec-18 Group of Investors esure Group Plc 1.51 Cash 4.07
Aug-18 Ongoing Group of Investors Star Health and Allied Insurance Company Limited 0.92 Cash N.A.
Aug-18 Feb-19 Apollo Global Management, LLC Aspen Insurance Holdings Limited 2.60 Cash 1.1
Aug-18 Apr-19 China Reinsurance (Group) Corporation Chaucer Holdings 0.95 Cash 1.66
Aug-18 Dec-18 Enstar Holdings (US) LLC Maiden Reinsurance North America, Inc. 0.32 Cash N.A.
Oct-18 Ongoing Life Resolutions Australia Pty Ltd. Australian and New Zealand wealth protection and mature businesses 2.34 Cash, Common Stock, Unclassified N.A.
Oct-18 Mar-19 RenaissanceRe Specialty Holdings (UK) Limited Tokio Millennium Re AG/Tokio Millennium Re (UK) Ltd. 1.47 Cash, Common Stock, Dividend to Seller 1.02
Dec-18 Ongoing Earning Star Limited FTLife Insurance Company Ltd. 2.75 Cash 1.4
Apr-19 Ongoing American Family Insurance Mutual Holding Company IDS Property Casualty Insurance Company 1.05 Cash 1.25
May-19 Ongoing Allianz (UK) Ltd. Liverpool Victoria General Insurance Group Ltd. 0.73 Unclassified N.A.
Total 133.20 Median 1.415
N.A.: Not available N.M.: Not meaningful
Reinsurance M&A

49Global Reinsurance Highlights | 2019
Table 1: Major Merger And Acquisition Deals In ReinsuranceAnnounced Closed Acquirer Acquiree Purchase
price (bil. $)Terms of the transaction Deal price to
book value (x)
Aug-13 Nov-13 Lancashire Holdings Limited Cathedral Capital Limited 0.41 All cash N.A.
Feb-14 Jun-14 Qatar Insurance Company S.A.Q. Antares Holdings Limited 0.30 N.A. N.A.
Nov-14 Mar-15 RenaissanceRe Holdings Ltd. Platinum Underwriters Holdings Ltd. 1.90 Cash and stock 1.13
Jan-15 May-15 XL Group Ltd. Catlin Group Ltd. 4.10 Cash, stock, and debt 1.21
Feb-15 Jul-15 Fairfax Financial Holdings Ltd. Brit Insurance Holdings PLC 1.88 All cash 1.63
Mar-15 Jul-15 Endurance Specialty Holdings Ltd. Montpelier Re Holdings Ltd. 1.83 Cash and stock 1.21
May-15 Nov-15 Fosun International Ltd. Ironshore Inc. 2.30 All cash 1.12
Jun-15 Oct-15 Tokio Marine & Nichido Fire Insurance Co. Ltd. HCC Insurance Holdings Inc. 7.53 Cash and debt 1.9
Jul-15 Jan-16 ACE Ltd. Chubb Corp. 28.30 Cash, stock, and debt 1.7
Jul-15 Mar-16 Meiji Yasuda Life Insurance Co. StanCorp Financial Group Inc. 4.95 All cash 2.21
Jul-15 Apr-16 China Minsheng Banking Corp. Ltd. Sirius International Insurance Group 2.60 All cash 1.43
Aug-15 Mar-16 EXOR SpA PartnerRe Ltd. 6.90 All cash 1.11
Aug-15 Jan-16 Sumitomo Life Insurance Co. Symetra Financial Corp. 3.80 All cash 1.2
Sep-15 Feb-16 Mitsui Sumitomo Insurance Co. Ltd. Amlin plc 5.30 All cash 1.93
Apr-16 Nov-16 AmTrust Financial Services Inc. ANV Holdings B.V. 0.20 All cash N.M.
Aug-16 Jan-17 Arch Capital Group Ltd. United Guaranty Corp. 3.40 Cash and stock 1.01
Sep-16 Dec-16 Canada Pension Plan Investment Board Ascot Underwriting Ltd. 1.10 All cash N.M.
Oct-16 Mar-17 Sompo Holdings Inc. Endurance Specialty Holdings Ltd. 6.30 All cash 1.36
Oct-16 Apr-17 PartnerRe Ltd. Aurigen Capital Ltd. 0.29 All cash N.A.
Nov-16 Feb-17 Argo Group US Inc. Ariel Re Holdings Ltd. 0.24 Cash and debt 1.45
Nov-16 Apr-17 AXIS Capital Holdings Ltd. Aviabel Cie. Belge d'Assurances Aviation S.A. N.A. N.A. N.A.
Dec-16 May-17 Liberty Mutual Group Inc. Ironshore Inc. 2.94 All cash 1.45
Dec-16 Jul-17 Fairfax Financial Holdings Ltd. Allied World Assurance Co. Holdings AG 4.90 Stock and cash 1.36
May-17 Sep-17 Intact Financial Corp. OneBeacon Insurance Group Ltd. 1.70 All cash 1.66
Jul-17 Oct-17 AXIS Capital Holdings Ltd. Novae Group plc 0.60 All cash 1.53
Feb-18 May-18 Enstar Group Limited KaylaRe Ltd. 0.40 Stock exchange N.A.
Jan-18 Jul-18 American International Group, Inc. Validus Holdings, Ltd. 5.56 All Cash 1.53
Mar-18 Sep-18 AXA Insurance Group XL Group Ltd 15.35 Cash 1.5
Jun-18 Ongoing Reliance Life Limited Equitable Life Assurance Society 2.41 Unclassified N.A.
Aug-18 Ongoing Cinven Limited AXA Life Europe DAC 1.08 Cash 1
Aug-18 Dec-18 Group of Investors esure Group Plc 1.51 Cash 4.07
Aug-18 Ongoing Group of Investors Star Health and Allied Insurance Company Limited 0.92 Cash N.A.
Aug-18 Feb-19 Apollo Global Management, LLC Aspen Insurance Holdings Limited 2.60 Cash 1.1
Aug-18 Apr-19 China Reinsurance (Group) Corporation Chaucer Holdings 0.95 Cash 1.66
Aug-18 Dec-18 Enstar Holdings (US) LLC Maiden Reinsurance North America, Inc. 0.32 Cash N.A.
Oct-18 Ongoing Life Resolutions Australia Pty Ltd. Australian and New Zealand wealth protection and mature businesses 2.34 Cash, Common Stock, Unclassified N.A.
Oct-18 Mar-19 RenaissanceRe Specialty Holdings (UK) Limited Tokio Millennium Re AG/Tokio Millennium Re (UK) Ltd. 1.47 Cash, Common Stock, Dividend to Seller 1.02
Dec-18 Ongoing Earning Star Limited FTLife Insurance Company Ltd. 2.75 Cash 1.4
Apr-19 Ongoing American Family Insurance Mutual Holding Company IDS Property Casualty Insurance Company 1.05 Cash 1.25
May-19 Ongoing Allianz (UK) Ltd. Liverpool Victoria General Insurance Group Ltd. 0.73 Unclassified N.A.
Total 133.20 Median 1.415
N.A.: Not available N.M.: Not meaningful
capabilities. White Mountains is buying a 30% stake in Elementum Advisors (with over $4 billion of assets).
We foresee further convergence in the insurance, reinsurance, and ILS markets in the next few years as structural changes in the industry continue to place pressure on reinsurers, especially considering that capital is still relatively cheap. A mega deal involving large players that shakes up the market order would be a surprise, but is not totally out of the question.
For example, towards the end of 2018, we saw primary insurer Covea’s unsuccessful bid for SCOR. Other examples include Japan-based Softbank’s failed plan to buy a minority stake in Swiss Re. Such a move could have potentially accelerated the role of technology in the reinsurance space, bearing in mind SoftBank’s domestic and overseas technology companies, such as its e-commerce platform in China and its telecommunications businesses in Japan and the U.S., not to mention its large balance sheet, with assets exceeding $260 billion.
M&A Is Typically Ratings-Neutral At BestMultiple forces drive consolidation and, therefore, the establishment of a clear objective is vital for a successful M&A transaction. Consolidation could be used to create growth opportunities through combined platforms, a stronger position in chosen products and regions, increased diversification, and potential expense synergies that could improve the earnings profile. A well-executed deal can protect creditworthiness and improve shareholder value. However, M&A deals come with inherent execution risks and, in particular, can dilute capital adequacy, depending on the chosen financing structure.
From a credit perspective, M&A transactions are usually slightly negative when first completed in view of the execution risk and given that stronger players often take over weaker rivals, except if it’s a merger of equals with minimal overlap. Furthermore, private equity or investment holding companies generally acquire re/insurers to enhance returns through transformational changes
Reinsurance M&A
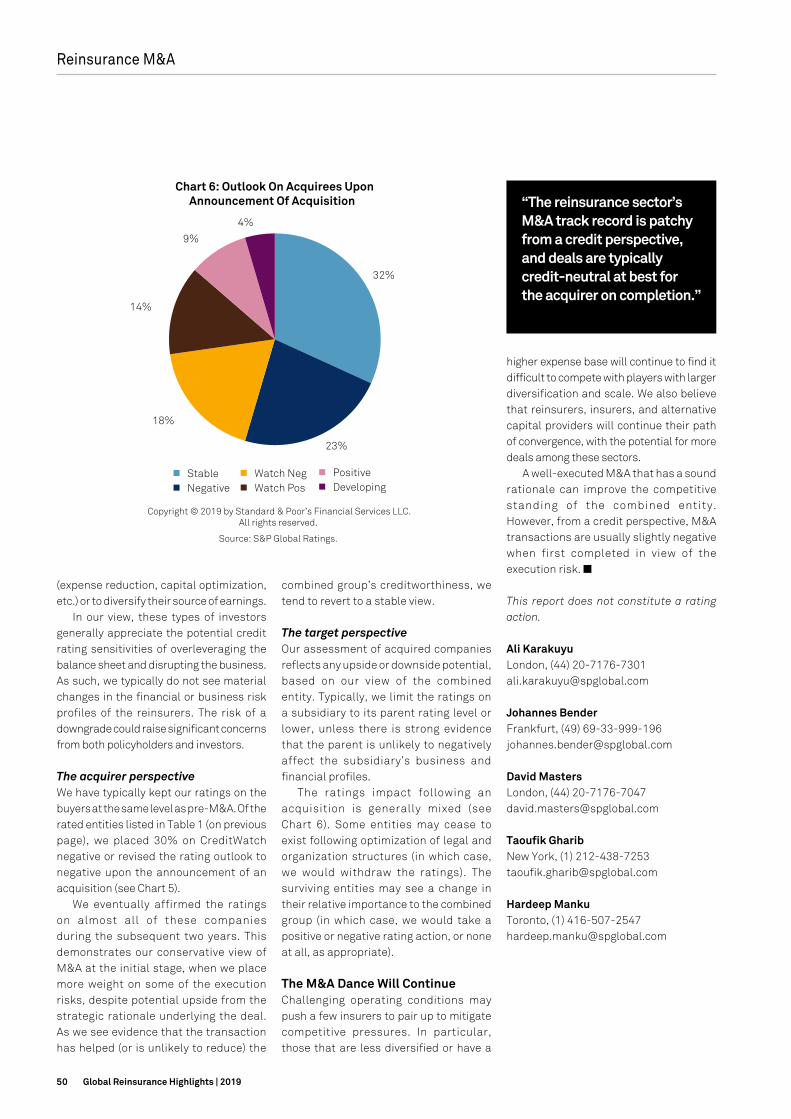
50 Global Reinsurance Highlights | 2019
(expense reduction, capital optimization, etc.) or to diversify their source of earnings.
In our view, these types of investors generally appreciate the potential credit rating sensitivities of overleveraging the balance sheet and disrupting the business. As such, we typically do not see material changes in the financial or business risk profiles of the reinsurers. The risk of a downgrade could raise significant concerns from both policyholders and investors.
The acquirer perspectiveWe have typically kept our ratings on the buyers at the same level as pre-M&A. Of the rated entities listed in Table 1 (on previous page), we placed 30% on CreditWatch negative or revised the rating outlook to negative upon the announcement of an acquisition (see Chart 5).
We eventually affirmed the ratings on almost all of these companies during the subsequent two years. This demonstrates our conservative view of M&A at the initial stage, when we place more weight on some of the execution risks, despite potential upside from the strategic rationale underlying the deal. As we see evidence that the transaction has helped (or is unlikely to reduce) the
combined group’s creditworthiness, we tend to revert to a stable view.
The target perspectiveOur assessment of acquired companies reflects any upside or downside potential, based on our view of the combined entity. Typically, we limit the ratings on a subsidiary to its parent rating level or lower, unless there is strong evidence that the parent is unlikely to negatively affect the subsidiary’s business and financial profiles.
The ratings impact following an acquisition is generally mixed (see Chart 6). Some entities may cease to exist following optimization of legal and organization structures (in which case, we would withdraw the ratings). The surviving entities may see a change in their relative importance to the combined group (in which case, we would take a positive or negative rating action, or none at all, as appropriate).
The M&A Dance Will Continue Challenging operating conditions may push a few insurers to pair up to mitigate competitive pressures. In particular, those that are less diversified or have a
higher expense base will continue to find it difficult to compete with players with larger diversification and scale. We also believe that reinsurers, insurers, and alternative capital providers will continue their path of convergence, with the potential for more deals among these sectors.
A well-executed M&A that has a sound rationale can improve the competitive standing of the combined entity. However, from a credit perspective, M&A transactions are usually slightly negative when first completed in view of the execution risk. n
This report does not constitute a rating action.
Ali KarakuyuLondon, (44) [email protected]
Johannes BenderFrankfurt, (49) [email protected]
David MastersLondon, (44) [email protected]
Taoufik GharibNew York, (1) [email protected]
Hardeep MankuToronto, (1) [email protected]
Reinsurance M&A
“The reinsurance sector’s M&A track record is patchy from a credit perspective, and deals are typically credit-neutral at best for the acquirer on completion.”
0
20
40
60
80
100
120
140
2019 2018 2017 2016 2015 2014 2013 2012 2011 2010 2009
Chart 1: Insurance Dealmaking Continues
Source: SNL Data
Copyright © 2019 by Standard & Poor’s Financial Services LLC. All rights reserved.
0
18
16
14
12
10
8
6
4
2
0
1.6
1.4
1.2
1.0
0.8
0.6
0.4
0.2
0.0
5,000
10,000
15,000
20,000
25,000
30,000
35,000
Mil. $
Net reinsurance premium written
Chart 2: Top 25 Reinsurers In 2018
*Figures represent the group as a whole,including primary business.
Copyright © 2019 by Standard & Poor's Financial Services LLC. All rights reserved.
2005
2006
2007
2008
2009
2010
2011
2012
2013
2014
2015
2016
2017
2018
(X)
(%)
Chart 3: Global Reinsurers’ Return On Capital And Price To Book Value
Return on capital (left scale) Price to book ratio (right scale)
Copyright © 2019 by Standard & Poor’s Financial Services LLC. All rights reserved.
Source: S&P Global Ratings.
0.0
0.5
1.0
1.5
2.0
2.5
3.0
2009
2010
2011
2012
2013
2014
2015
2016
2017
2018
(x)
Chart 4: Global Equity Valuations Trend–Insurers Trade At Lower Multiples
MSCI World Insurance Index (MXWO0IS): price to book ratio
MSCI World Index (MXWO): price to book ratio
Copyright © 2019 by Standard & Poor’s Financial Services LLC. All rights reserved.
Source: Bloomberg.
63%
27%
7%3%
Chart 5: Outlook On AcquirersUpon Announcement Of Acquisition
Source: S&P Global Ratings.
Copyright © 2019 by Standard & Poor’s Financial Services LLC.All rights reserved.
32%
23%
18%
14%
9%
4%
Chart 6: Outlook On Acquirees UponAnnouncement Of Acquisition
Stable Negative
Watch Neg Watch Pos
Positive Developing
Stable Negative
Positive Watch Neg
Source: S&P Global Ratings.
Copyright © 2019 by Standard & Poor’s Financial Services LLC.All rights reserved.
Dea
l val
ue (b
il. $
)
Swiss Reinsurance Co.*Munich Reinsurance Co.
Hannover Rück SEBerkshire Hathaway Re
SCOR SEChina Reinsurance (Group) Corp
Reinsurance Group of America, Inc. Lloyd’s
Everest Re Group Ltd.PartnerRe Ltd.
General Insurance Corporation of IndiaMS&AD Insurance Group Holdings, Inc.
Korean Reinsurance Co.Transatlantic Holdings Inc
Sompo Holdings, Inc.Mapfre Re
R+V Versicherung AGFairfax Financial Holdings Ltd.
Tokio Marine & Nichido Fire Insurance Co. Ltd.AXIS Capital Holdings Ltd.
Toa Re Co Ltd.RenaissanceRe Holdings Ltd.
Validus Reinsurance Ltd.Caisse Centrale de Reassurance
Arch Capital Group Ltd.
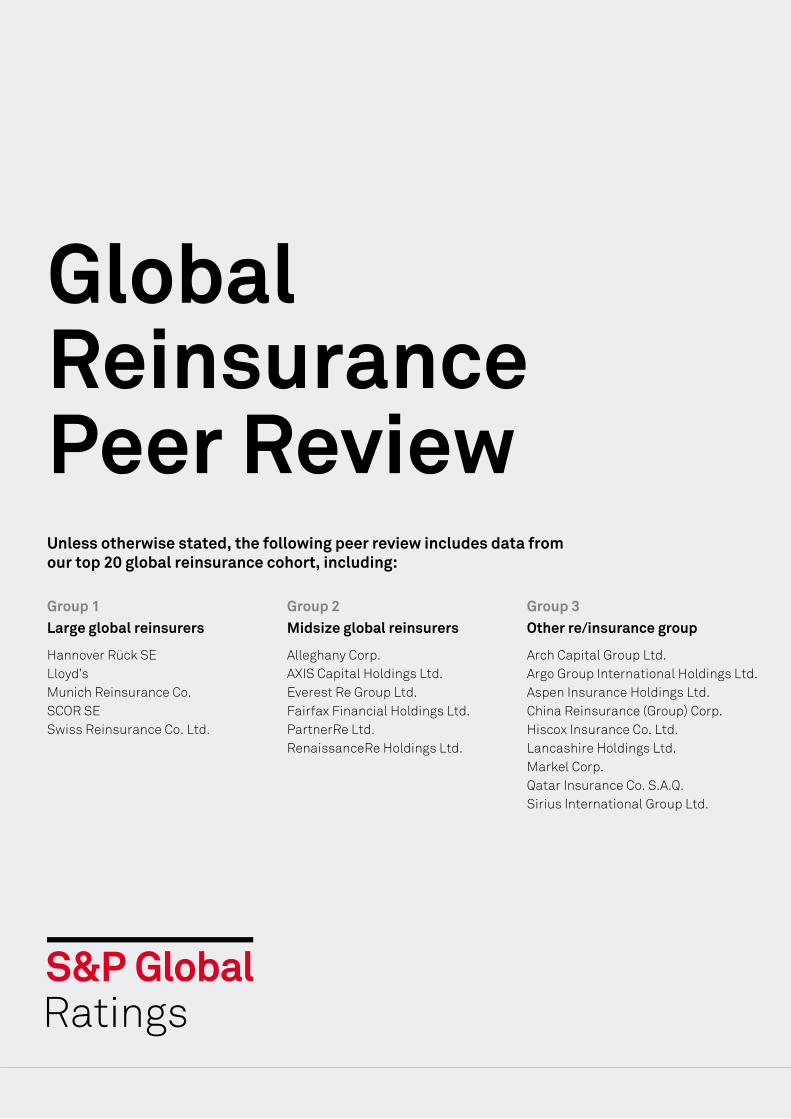
Global Reinsurance Peer Review
Global Reinsurance Peer Review Unless otherwise stated, the following peer review includes data from our top 20 global reinsurance cohort, including:
Group 1 Large global reinsurers
Hannover Rück SE Lloyd’s Munich Reinsurance Co. SCOR SE Swiss Reinsurance Co. Ltd.
Group 2 Midsize global reinsurers
Alleghany Corp. AXIS Capital Holdings Ltd. Everest Re Group Ltd. Fairfax Financial Holdings Ltd. PartnerRe Ltd. RenaissanceRe Holdings Ltd.
Group 3 Other re/insurance group
Arch Capital Group Ltd. Argo Group International Holdings Ltd. Aspen Insurance Holdings Ltd. China Reinsurance (Group) Corp. Hiscox Insurance Co. Ltd. Lancashire Holdings Ltd. Markel Corp. Qatar Insurance Co. S.A.Q. Sirius International Group Ltd.
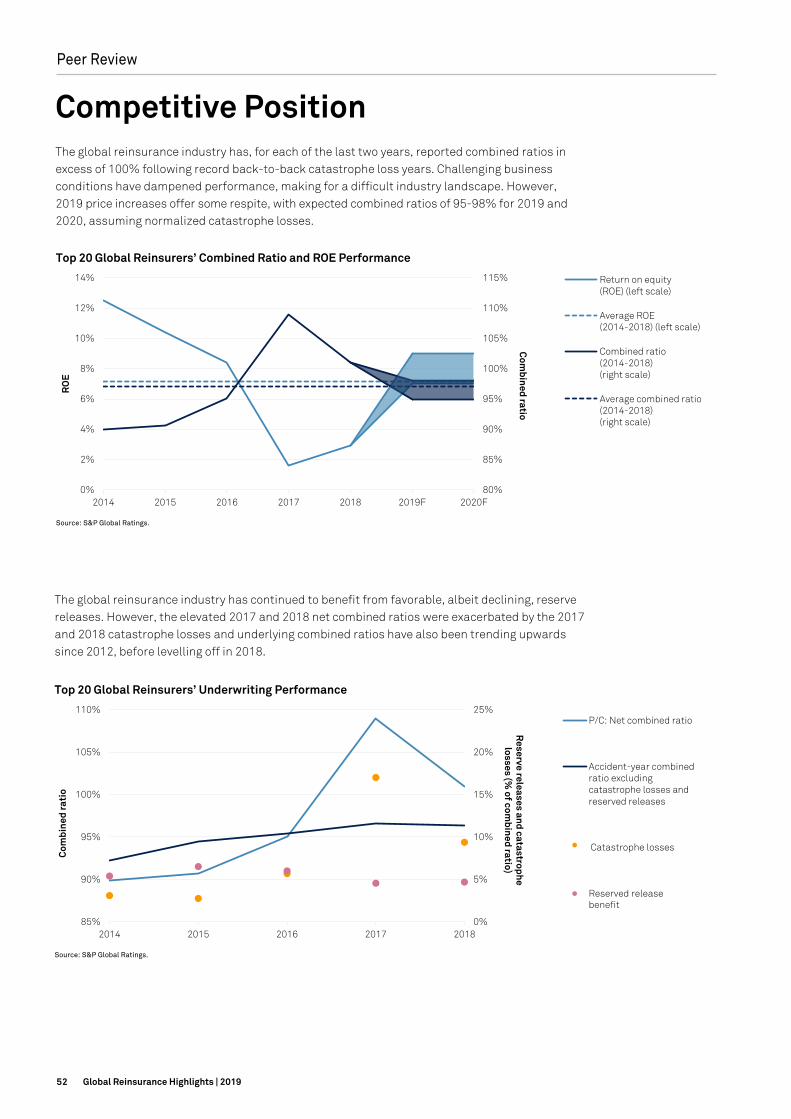
52 Global Reinsurance Highlights | 2019
Global Reinsurance Peer Review 2
Competitive Position The global reinsurance industry has, for each of the last two years, reported combined ratios in excess of 100% following record back-to-back catastrophe loss years. Challenging business conditions have dampened performance, making for a difficult industry landscape. However, 2019 price increases offer some respite, with expected combined ratios of 95-98% for 2019 and 2020, assuming normalized catastrophe losses.
Top 20 Global Reinsurers’ Combined Ratio and ROE Performance
Source: S&P Global Ratings.
The global reinsurance industry has continued to benefit from favorable, albeit declining, reserve releases. However, the elevated 2017 and 2018 net combined ratios were exacerbated by the 2017 and 2018 catastrophe losses and underlying combined ratios have also been trending upwards since 2012, before levelling off in 2018.
Top 20 Global Reinsurers’ Underwriting Performance
Source: S&P Global Ratings.
80%
85%
90%
95%
100%
105%
110%
115%
0%
2%
4%
6%
8%
10%
12%
14%
2014 2015 2016 2017 2018 2019F 2020F
Com
bined ratio
RO
E
Return on equity (ROE) (left scale)
Average ROE (2014-2018) (left scale)
Combined ratio (2014-2018) (right scale)
Average combined ratio (2014-2018)(right scale)
0%
5%
10%
15%
20%
25%
85%
90%
95%
100%
105%
110%
2014 2015 2016 2017 2018
Reserve releases and catastrophe
losses (% of com
bined ratio)
Com
bine
d ra
tio
P/C: Net combined ratio
Accident-year combined ratio excluding catastrophe losses and reserved releases
Catastrophe losses
Reserved release benefit
Peer Review

53Global Reinsurance Highlights | 2019
Global Reinsurance Peer Review 2
Competitive Position The global reinsurance industry has, for each of the last two years, reported combined ratios in excess of 100% following record back-to-back catastrophe loss years. Challenging business conditions have dampened performance, making for a difficult industry landscape. However, 2019 price increases offer some respite, with expected combined ratios of 95-98% for 2019 and 2020, assuming normalized catastrophe losses.
Top 20 Global Reinsurers’ Combined Ratio and ROE Performance
Source: S&P Global Ratings.
The global reinsurance industry has continued to benefit from favorable, albeit declining, reserve releases. However, the elevated 2017 and 2018 net combined ratios were exacerbated by the 2017 and 2018 catastrophe losses and underlying combined ratios have also been trending upwards since 2012, before levelling off in 2018.
Top 20 Global Reinsurers’ Underwriting Performance
Source: S&P Global Ratings.
80%
85%
90%
95%
100%
105%
110%
115%
0%
2%
4%
6%
8%
10%
12%
14%
2014 2015 2016 2017 2018 2019F 2020F
Com
bined ratio
RO
E
Return on equity (ROE) (left scale)
Average ROE (2014-2018) (left scale)
Combined ratio (2014-2018) (right scale)
Average combined ratio (2014-2018)(right scale)
0%
5%
10%
15%
20%
25%
85%
90%
95%
100%
105%
110%
2014 2015 2016 2017 2018
Reserve releases and catastrophe
losses (% of com
bined ratio)
Com
bine
d ra
tio
P/C: Net combined ratio
Accident-year combined ratio excluding catastrophe losses and reserved releases
Catastrophe losses
Reserved release benefit
Global Reinsurance Peer Review 3
Capital Adequacy Capital adequacy strength has been reducing but the sector remains capitalized above the ‘AA’ confidence level. At the ‘AA’ level, we estimate that capital redundancies of the Top 20 global reinsurers at the end of 2018 were about 5%, down from 6% as of the end of 2017, and as high as 25% in 2014. The recent drop in capital adequacy is mostly due to the 2017 catastrophe losses, adjustments to the large global reinsurers’ asset liability management and/or longevity risk capital charges, and continued buybacks and special dividends. For both 2017 and 2018, the Top 20 global reinsurers have been deficient at the ‘AAA’ level.
Capital Adequacy Of The Top 20 Global Reinsurers Over Time By Confidence Level
Source: S&P Global Ratings.
In addition to year-on-year reductions in capital adequacy, all of our reinsurer cohort groups were deficient at the ‘AAA’ level at the end of 2018, whereas all remained redundant at the ‘A’ level. Within Group 1 reinsurers, the average deficiency at the ‘AAA’ level was just over 1%, compared to a 21% deficiency amongst the Group 3 cohort.
2018 Average Capital Adequacy By Peer Group
Source: S&P Global Ratings.
-20%
-10%
0%
10%
20%
30%
40%
50%
60%
70%
80%
AAA AA A BBB
2014
2015
2016
2017
2018
-30%
-20%
-10%
0%
10%
20%
30%
40%
50%
60%
AAA AA A BBB
Group 1
Group 2
Group 3
Global
Peer Review

54 Global Reinsurance Highlights | 2019
Global Reinsurance Peer Review 4
− After a 1-in-50 year catastrophe event, capital adequacy would deteriorate into the ‘BBB’range.
− If the sector’s total return on capital is one percentage point below its cost of capital for 12months, capital adequacy would remain in the ‘AA’ range.
2018 Global Reinsurance Capital Stress Test
Source: S&P Global Ratings.
Catastrophe Risk In 2019, most of the top 20 reinsurers chose to increase their exposure relative to capital, to benefit from the slightly improved conditions. A few stuck with defensive measures, allowing their exposure to contract further, as they had in 2018. On average, reinsurers’ property-catastrophe risk appetite at a 1-in-250-year return period rose to 29% of shareholder equity, but some reinsurers saw reductions of more than five percentage points.
This chart provides a ranking of reinsurers’ relative exposure to catastrophe risk against one another. It is based on blended ranking of cat risk metrics developed by S&P (some of the risk metrics used include earnings at risk, capital at risk, post events capital adequacy and historical experience).
Catastrophe Exposure: Cumulative Riskiness Scoring As Of Jan. 1, 2019
Source: S&P Global Ratings.
71.6
30.0
11.4 0
20
40
60
80
100
120
35%
rese
rve
stre
ngth
enin
g
2002
U.S
. r/i
rese
rve
stre
ngth
enin
g
1/25
0 yr
cat
1/10
0 yr
cat
1/50
yr c
at
10%
rese
rve
stre
ngth
enin
g
Dou
ble
equi
tyex
posu
re (s
ellin
g…
Bon
d ra
ting
s do
wn
1ca
tego
ry
1/10
yr c
at
30%
equ
ity
shoc
k
5% p
rice
dec
lines
Cas
h di
vide
nds
paid
for
indu
stry
Dou
ble
BB
B (s
ellin
gA
AA
)
Roc
<coc
for 1
2m(1
%)
Bil.
$
‘BBB’ excess capital
‘A’ excess capital
‘AA’ excess capital
0
10
20
30
40
50
60
70
80
Peer Review
Ren
Re
Lanc
ashi
re
Lloy
d’s
Sir
ius
Eve
rest
Re
Asp
en
SC
OR
Mun
ich
Re
Sw
iss
Re
Par
tner
Re
AXI
S
Han
nove
r R
e
Alle
ghan
y
His
cox
Arg
o
Fair
fax
Qat
ar R
e
Mar
kel
Chi
na R
e
Arc
h

55Global Reinsurance Highlights | 2019
Global Reinsurance Peer Review 4
− After a 1-in-50 year catastrophe event, capital adequacy would deteriorate into the ‘BBB’range.
− If the sector’s total return on capital is one percentage point below its cost of capital for 12months, capital adequacy would remain in the ‘AA’ range.
2018 Global Reinsurance Capital Stress Test
Source: S&P Global Ratings.
Catastrophe Risk In 2019, most of the top 20 reinsurers chose to increase their exposure relative to capital, to benefit from the slightly improved conditions. A few stuck with defensive measures, allowing their exposure to contract further, as they had in 2018. On average, reinsurers’ property-catastrophe risk appetite at a 1-in-250-year return period rose to 29% of shareholder equity, but some reinsurers saw reductions of more than five percentage points.
This chart provides a ranking of reinsurers’ relative exposure to catastrophe risk against one another. It is based on blended ranking of cat risk metrics developed by S&P (some of the risk metrics used include earnings at risk, capital at risk, post events capital adequacy and historical experience).
Catastrophe Exposure: Cumulative Riskiness Scoring As Of Jan. 1, 2019
Source: S&P Global Ratings.
71.6
30.0
11.4 0
20
40
60
80
100
120
35%
rese
rve
stre
ngth
enin
g
2002
U.S
. r/i
rese
rve
stre
ngth
enin
g
1/25
0 yr
cat
1/10
0 yr
cat
1/50
yr c
at
10%
rese
rve
stre
ngth
enin
g
Dou
ble
equi
tyex
posu
re (s
ellin
g…
Bon
d ra
ting
s do
wn
1ca
tego
ry
1/10
yr c
at
30%
equ
ity
shoc
k
5% p
rice
dec
lines
Cas
h di
vide
nds
paid
for
indu
stry
Dou
ble
BB
B (s
ellin
gA
AA
)
Roc
<coc
for 1
2m(1
%)
Bil.
$
‘BBB’ excess capital
‘A’ excess capital
‘AA’ excess capital
0
10
20
30
40
50
60
70
80
Global Reinsurance Peer Review 5
An aggregated 1-in-10-year loss experience, which we assume to be about $20 billion, would exceed the annual natural catastrophe budget and hit the sector’s earnings, but would not hit its capital in aggregate. This chart takes into account the natural catastrophe budget the sector incorporates in a normalized year and the projected earnings that may be achieved in a normalized year.
Top 20 Global Reinsurers’ Aggregate Capital Surplus Resilience To Stress At Year-End 2018
Source: S&P Global Ratings.
Whilst 2018 natural catastrophe losses were less severe than in 2017, nat cat losses still wiped out earnings for five of the top 20 reinsurers last year. Industrywide, 2018 losses averaged about 0.8x of the annual normalized earnings and affected about 7% of shareholders’ equity at year-end 2017. Reinsurers’ individual experiences align well with our expectations, which we derive from our annually updated catastrophe exposure metrics. The most-exposed reinsurers in 2018, in terms of both earnings and capital, appear on the right hand side of this chart.
S&P Global Ratings’ Relative Catastrophe Benchmark Performed Well In 2018
Bubble size shows 2018 annual net catastrophe loss against 2018 actual profit before tax (excluding cat). Source: S&P Global Ratings.
71.6
30.011.4
(16.2) 22.0
11.3 (19.7)(35.7) (44.1)
(58.1)
0
20
40
60
80
100
120
Bil.
$
Aspen
Lloyd’s
PartnerRe
Everest Re
AXIS
Alleghany
Sirius
Lancashire
Swiss ReSCOR
HiscoxRenaissanceRe
FairfaxMunich Re
Argo
Hannover Re
Markel
Arch
Qatar Re0%
2%
4%
6%
8%
10%
12%
14%
16%
18%
0 1 2 3 4 5 6 7 8 9 10 11 12 13 14 15 16 17 18 19 20 21 22
2018
ann
ual n
et c
atas
trop
he lo
ss a
gain
st y
ear-
end
2017
tota
l rep
orte
d sh
areh
olde
rs’ e
quit
y
S&P Global Ratings relative catastrophe benchmark (ranking from least to most exposed left to right)
Peer Review
Capital buffers
Capital deficit
Expected profit and cat budget Cat losses
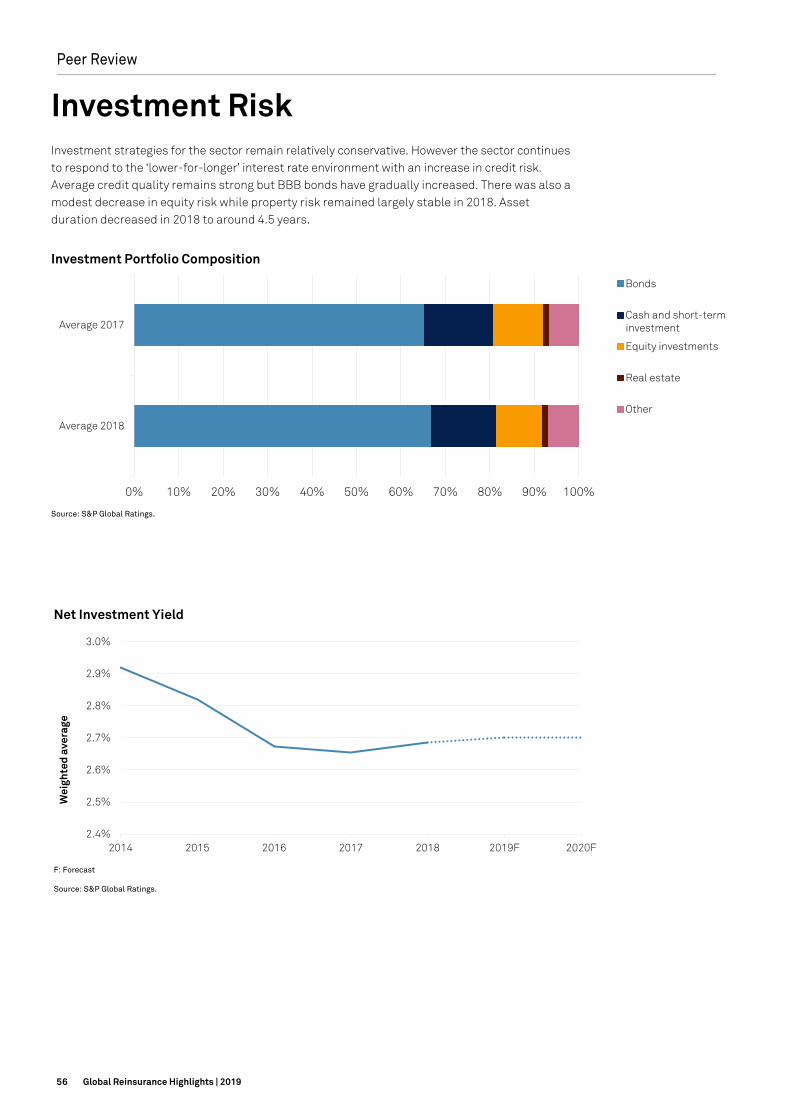
56 Global Reinsurance Highlights | 2019
Global Reinsurance Peer Review 6
Investment Risk Investment strategies for the sector remain relatively conservative. However the sector continues to respond to the ‘lower-for-longer’ interest rate environment with an increase in credit risk. Average credit quality remains strong but BBB bonds have gradually increased. There was also a modest decrease in equity risk while property risk remained largely stable in 2018. Asset duration decreased in 2018 to around 4.5 years.
Investment Portfolio Composition
Source: S&P Global Ratings.
Net Investment Yield
F: Forecast
Source: S&P Global Ratings.
0% 10% 20% 30% 40% 50% 60% 70% 80% 90% 100%
Average 2018
Average 2017
Bonds
Cash and short-terminvestment
Equity investments
Real estate
Other
2.4%
2.5%
2.6%
2.7%
2.8%
2.9%
3.0%
2014 2015 2016 2017 2018 2019F 2020F
Wei
ghte
d av
erag
e
Global Reinsurance Peer Review 6
Investment Risk Investment strategies for the sector remain relatively conservative. However the sector continues to respond to the ‘lower-for-longer’ interest rate environment with an increase in credit risk. Average credit quality remains strong but BBB bonds have gradually increased. There was also a modest decrease in equity risk while property risk remained largely stable in 2018. Asset duration decreased in 2018 to around 4.5 years.
Investment Portfolio Composition
Source: S&P Global Ratings.
Net Investment Yield
F: Forecast
Source: S&P Global Ratings.
0% 10% 20% 30% 40% 50% 60% 70% 80% 90% 100%
Average 2018
Average 2017
Bonds
Cash and short-terminvestment
Equity investments
Real estate
Other
2.4%
2.5%
2.6%
2.7%
2.8%
2.9%
3.0%
2014 2015 2016 2017 2018 2019F 2020F
Wei
ghte
d av
erag
ePeer Review

57Global Reinsurance Highlights | 2019
Global Reinsurance Peer Review 7
Economic Forecasts S&P Global Ratings’ GDP, Inflation and Interest Rate Forecasts
2018 2019F 2020F 2022F
Real GDP (YOY % change)
Eurozone 1.9 1.1 1.3 1.3 1.3
U.K. 1.4 1.2 1.4 1.3 1.8
Asia Pacific 5.5 5.1 5.3 5.2 5.3
U.S. 2.9 2.5 1.8 1.9 1.7
CPI inflation (year-on-year % change)
Eurozone 1.8 1.2 1.3 1.4 1.6
U.K. 2.5 1.8 1.7 2.4 1.8
Asia Pacific 2.1 2.0 2.4 2.4 2.3
U.S. 2.4 1.8 2.4 2.2 2.2
Long-Term (10-Year) Interest Rates (%)
Eurozone 1.1 0.8 1.2 1.5 1.9
U.K. 1.5 1.2 1.6 1.9 2.3
Asia Pacific 3.2 2.8 2.9 3.0 3.1
U.S. 2.9 2.4 2.6 2.6 2.7
Data as of June 2019. F: Forecast Source: S&P Global Ratings.
2021F
Peer Review

58 Global Reinsurance Highlights | 2019
Top 40 Global Reinsurance Groups Ranked By Net Reinsurance Premiums Written
Net Reinsurance Premiums Written (Mil. $)
Pre-tax Operating Income (Mil. $) Combined Ratio (%) Total Adjusted Shareholders’ Funds (Mil. $)
Return on Revenue (%)
Ranking Company Country Rating Outlook Footnote 2018 2017 2018 2017 2018 2017 2018 2017 2018 2017
1 Swiss Reinsurance Co. Switzerland AA- Stable 1 34,042.0 32,316.0 356.0 -1,202.0 106.6 115.4 28,153.0 34,428.0 0.9 -3.2
2 Munich Reinsurance Co. Germany AA- Stable 2 33,685.6 36,454.4 3,548.5 -650.7 99.4 114.0 35,397.9 37,585.3 9.0 -1.5
3 Hannover Rück SE Germany AA- Stable 19,953.2 19,321.4 1,559.3 1,052.8 96.9 100.0 10,477.7 10,803.2 7.3 5.2
4 Berkshire Hathaway Re United States AA+ Stable 16,532.0 24,212.0 N.A. N.A. 110.4 116.0 162,000.0 170,000.0 N.A. N.A.
5 SCOR SE France AA- Stable 15,803.1 16,163.5 638.8 328.9 99.3 103.7 6,652.0 7,437.1 4.0 2.0
6 China Reinsurance (Group) Corp China A Stable 10,677.8 9,970.3 1,097.7 696.8 98.8 103.9 12,685.0 11,573.9 9.4 6.1
7 Reinsurance Group of America, Inc. United States AA- Stable 10,543.8 9,841.1 1,017.9 1,038.5 N.M. N.M. 8,450.6 9,569.5 7.9 8.4
8 Lloyd’s United Kingdom A+ Stable 3 9,969.4 10,746.5 -581.9 -1,798.3 106.0 117.2 34,998.1 36,191.7 N.A. N.A.
9 Everest Re Group Ltd. Bermuda A+ Stable 4 7,414.4 6,244.7 -117.4 277.5 108.8 103.5 8,201.2 8,139.6 -1.6 4.3
10 PartnerRe Ltd. Bermuda A+ Stable 5,803.0 5,120.0 N.A. N.A. 101.8 102.3 6,516.0 6,745.0 N.A. N.A.
11 General Insurance Corporation of India India NR - 5,678.2 5,796.3 555.6 557.7 105.3 103.8 3,674.7 3,711.4 8.6 8.3
12 MS&AD Insurance Group Holdings, Inc. Japan A+ Stable 5,080.1 5,427.0 N.A. N.A. N.A. N.A. 35,576.0 38,769.9 N.A. N.A.
13 Korean Reinsurance Co. South Korea A Stable 4,772.3 4,705.9 16.2 180.9 101.6 96.5 2,030.0 2,047.6 0.3 3.9
14 Transatlantic Holdings Inc. United States A+ Stable 3,969.1 3,810.1 64.0 -13.7 105.4 106.9 4,723.5 5,217.9 1.5 -0.3
15 Sompo Holdings, Inc. Japan A+ Stable 3,900.3 3,893.0 N.A. N.A. N.A. N.A. 19,158.7 21,589.7 N.A. N.A.
16 Mapfre Re Spain A Positive 3,497.2 3,388.8 247.2 265.6 95.4 94.9 1,913.6 1,562.4 6.2 7.0
17 R+V Versicherung AG Germany AA- Stable 3,169.7 3,017.4 399.9 246.9 100.8 106.1 7,777.3 7,508.5 10.8 7.2
18 Fairfax Financial Holdings Ltd. Canada A- Positive 5 2,790.2 2,576.8 395.0 57.3 94.2 106.6 11,779.3 12,475.6 13.1 2.1
19 Tokio Marine & Nichido Fire Insurance Co. Ltd. Japan A+ Positive 6 2,692.6 2,728.8 2,845.0 3,065.9 N.A. N.A. 26,062.1 28,561.5 N.A. N.A.
20 AXIS Capital Holdings Ltd. Bermuda A+ Stable 2,334.2 1,939.4 N.A. N.A. 98.4 108.8 5,030.1 5,341.3 N.A. N.A.
21 Toa Re Co Ltd. Japan A+ Stable 2,239.8 2,238.5 -119.6 146.8 109.5 96.5 2,729.0 3,074.6 -5.2 6.3
22 RenaissanceRe Holdings Ltd. Bermuda A+ Stable 2,131.9 1,871.3 N.A. N.A. 89.3 137.9 5,045.1 4,391.4 N.A. N.A.
23 Validus Reinsurance Ltd. Bermuda A Stable 7 1,700.5 2,044.5 -91.0 54.0 108.1 99.7 3,259.0 4,248.6 -4.9 2.4
24 Caisse Centrale de Reassurance France AA Stable 1,439.3 1,416.5 133.2 -1,101.3 100.7 197.4 5,882.9 6,267.8 8.7 -72.4
25 Arch Capital Group Ltd. Bermuda A+ Stable 1,372.6 1,174.5 519.5 203.4 94.5 99.9 6,032.7 6,148.8 33.9 14.7
26 Sirius Group Bermuda A- Stable 1,357.1 1,090.2 21.8 -68.1 103.1 107.6 1,706.2 1,917.2 1.5 -5.9
27 IRB-Brasil Resseguros S.A. Brazil NR - 1,312.2 1,223.0 376.6 399.6 69.5 81.5 1,030.6 1,081.2 26.9 28.2
28 Taiping Reinsurance Co., Ltd. Hong Kong A Stable 1,257.2 1,501.4 37.0 11.0 98.6 96.4 1,032.0 1,049.8 3.4 0.8
29 Aspen Insurance Holdings Ltd. Bermuda A Negative 8 1,182.9 1,250.0 61.3 -203.3 104.0 125.1 2,656.0 2,928.5 4.5 -15.6
30 Peak Reinsurance Co. Ltd. Hong Kong NR - 1,056.5 928.8 17.2 35.3 98.3 105.1 965.5 911.6 1.7 3.9
31 Qatar Reinsurance Co. Ltd. Bermuda A Stable 971.0 712.6 21.2 -66.8 103.9 122.0 1,109.7 1,148.7 2.0 -11.1
32 Allianz SE Germany AA Stable 9 931.9 788.8 27.0 72.7 99.8 92.6 N.A. N.A. 3.0 9.9
33 QBE Insurance Group Ltd. Australia A+ Stable 920.0 837.3 123.0 73.7 62.2 108.4 8,400.0 8,901.0 13.2 8.4
34 Markel Corporation United States A Stable 882.3 978.2 -118.3 -299.2 112.7 132.0 N.A. N.A. -12.7 -32.0
35 Chubb Tempest Reinsurance Ltd. Bermuda AA Stable 857.9 880.2 294.3 222.3 101.8 111.2 N.A. N.A. 24.5 18.0
36 Deutsche Rückversicherung AG Germany A+ Stable 841.3 851.2 70.0 54.8 95.2 98.0 917.9 881.1 8.0 6.2
37 African Reinsurance Corp. Nigeria A- Stable 681.3 625.7 30.6 87.4 97.9 95.9 917.1 902.0 4.4 13.0
38 PICC Reinsurance Co. Ltd. China NR - 634.2 482.5 -34.6 -37.5 106.5 114.7 394.6 426.5 -5.3 -13.5
39 Nacional de Reaseguros S.A. Spain A Stable 516.5 532.6 50.4 33.9 92.9 96.1 423.0 466.2 9.6 5.8
40 Atradius Reinsurance DAC Ireland NR - 502.9 507.4 24.9 53.9 95.7 89.3 727.5 752.7 4.9 10.5
Total: 225,097.8 229,608.1 13,486.3 3,776.6 102.0 109.9 474,485.4 504,756.5 5.7 1.3
Rating = Financial strength ratings of core operating entities of the groups as of 02.08.2019N.A. = Not availableN.M. = Not meaningfulNR = Not ratedNote: Exchange rates may slightly differ from previous years’ GRH data due to alignment of foreign exchange rates with other S&P Global surveys1. Swiss Reinsurance Co.: Figures represent the group as a whole including primary business. 2. Munich Reinsurance Co.: Total Adjusted Shareholders’ Funds for the group includes ERGO. 3. Lloyd’s: The figures in the Pretax Operating Income column reflect the underwriting result. Net Premium Written, underwriting result and the
combined ratio relate to reinsurance business only; all other items include direct business. The data presented is based on the published pro forma accounts for the Market, which represents an aggregation of all syndicates participating at Lloyd’s. As such, some premium included for Lloyd’s may also be included by other groups that consolidate their Lloyd’s operations. Adjusted Shareholders’ Funds are members’ funds for the Market as a whole.
4. Everest Re Group Ltd.: 2017 Adjusted Shareholders’ Funds have been restated to reflect Average Adjusted Shareholders’ Equity. 5. Fairfax Financial Holdings Ltd.: Pretax Operating Income is from reinsurance operations only. Total Adjusted Shareholders’ Funds are the totals
from all operations; as reported.6. Tokio Marine & Nichido Fire Insurance Co. Ltd.: Figures represent Tokio Marine & Nichido Fire Insurance Co.,Ltd. and exclude the group’s other
reinsurance subsidiaries.7. Validus Reinsurance Ltd.: Information provided previously came from the reinsurance segment of the former Validus Holdings, Ltd. Balances
above are taken from the GAAP financial statements for Validus Reinsurance, Ltd. 8. Aspen Insurance Holdings Ltd.: 2018 and 2017 numbers have been reported as a mixture of the reinsurance segment and whole company.
Where available numbers relate to reinsurance segment, and where unavailable the group results are shown. 9. Allianz SE: Figures are based on IFRS results (only external business). Pretax Operating Income excludes administrative expenses
Top 40 By Company

59Global Reinsurance Highlights | 2019
Top 40 Global Reinsurance Groups Ranked By Net Reinsurance Premiums Written
Net Reinsurance Premiums Written (Mil. $)
Pre-tax Operating Income (Mil. $) Combined Ratio (%) Total Adjusted Shareholders’ Funds (Mil. $)
Return on Revenue (%)
Ranking Company Country Rating Outlook Footnote 2018 2017 2018 2017 2018 2017 2018 2017 2018 2017
1 Swiss Reinsurance Co. Switzerland AA- Stable 1 34,042.0 32,316.0 356.0 -1,202.0 106.6 115.4 28,153.0 34,428.0 0.9 -3.2
2 Munich Reinsurance Co. Germany AA- Stable 2 33,685.6 36,454.4 3,548.5 -650.7 99.4 114.0 35,397.9 37,585.3 9.0 -1.5
3 Hannover Rück SE Germany AA- Stable 19,953.2 19,321.4 1,559.3 1,052.8 96.9 100.0 10,477.7 10,803.2 7.3 5.2
4 Berkshire Hathaway Re United States AA+ Stable 16,532.0 24,212.0 N.A. N.A. 110.4 116.0 162,000.0 170,000.0 N.A. N.A.
5 SCOR SE France AA- Stable 15,803.1 16,163.5 638.8 328.9 99.3 103.7 6,652.0 7,437.1 4.0 2.0
6 China Reinsurance (Group) Corp China A Stable 10,677.8 9,970.3 1,097.7 696.8 98.8 103.9 12,685.0 11,573.9 9.4 6.1
7 Reinsurance Group of America, Inc. United States AA- Stable 10,543.8 9,841.1 1,017.9 1,038.5 N.M. N.M. 8,450.6 9,569.5 7.9 8.4
8 Lloyd’s United Kingdom A+ Stable 3 9,969.4 10,746.5 -581.9 -1,798.3 106.0 117.2 34,998.1 36,191.7 N.A. N.A.
9 Everest Re Group Ltd. Bermuda A+ Stable 4 7,414.4 6,244.7 -117.4 277.5 108.8 103.5 8,201.2 8,139.6 -1.6 4.3
10 PartnerRe Ltd. Bermuda A+ Stable 5,803.0 5,120.0 N.A. N.A. 101.8 102.3 6,516.0 6,745.0 N.A. N.A.
11 General Insurance Corporation of India India NR - 5,678.2 5,796.3 555.6 557.7 105.3 103.8 3,674.7 3,711.4 8.6 8.3
12 MS&AD Insurance Group Holdings, Inc. Japan A+ Stable 5,080.1 5,427.0 N.A. N.A. N.A. N.A. 35,576.0 38,769.9 N.A. N.A.
13 Korean Reinsurance Co. South Korea A Stable 4,772.3 4,705.9 16.2 180.9 101.6 96.5 2,030.0 2,047.6 0.3 3.9
14 Transatlantic Holdings Inc. United States A+ Stable 3,969.1 3,810.1 64.0 -13.7 105.4 106.9 4,723.5 5,217.9 1.5 -0.3
15 Sompo Holdings, Inc. Japan A+ Stable 3,900.3 3,893.0 N.A. N.A. N.A. N.A. 19,158.7 21,589.7 N.A. N.A.
16 Mapfre Re Spain A Positive 3,497.2 3,388.8 247.2 265.6 95.4 94.9 1,913.6 1,562.4 6.2 7.0
17 R+V Versicherung AG Germany AA- Stable 3,169.7 3,017.4 399.9 246.9 100.8 106.1 7,777.3 7,508.5 10.8 7.2
18 Fairfax Financial Holdings Ltd. Canada A- Positive 5 2,790.2 2,576.8 395.0 57.3 94.2 106.6 11,779.3 12,475.6 13.1 2.1
19 Tokio Marine & Nichido Fire Insurance Co. Ltd. Japan A+ Positive 6 2,692.6 2,728.8 2,845.0 3,065.9 N.A. N.A. 26,062.1 28,561.5 N.A. N.A.
20 AXIS Capital Holdings Ltd. Bermuda A+ Stable 2,334.2 1,939.4 N.A. N.A. 98.4 108.8 5,030.1 5,341.3 N.A. N.A.
21 Toa Re Co Ltd. Japan A+ Stable 2,239.8 2,238.5 -119.6 146.8 109.5 96.5 2,729.0 3,074.6 -5.2 6.3
22 RenaissanceRe Holdings Ltd. Bermuda A+ Stable 2,131.9 1,871.3 N.A. N.A. 89.3 137.9 5,045.1 4,391.4 N.A. N.A.
23 Validus Reinsurance Ltd. Bermuda A Stable 7 1,700.5 2,044.5 -91.0 54.0 108.1 99.7 3,259.0 4,248.6 -4.9 2.4
24 Caisse Centrale de Reassurance France AA Stable 1,439.3 1,416.5 133.2 -1,101.3 100.7 197.4 5,882.9 6,267.8 8.7 -72.4
25 Arch Capital Group Ltd. Bermuda A+ Stable 1,372.6 1,174.5 519.5 203.4 94.5 99.9 6,032.7 6,148.8 33.9 14.7
26 Sirius Group Bermuda A- Stable 1,357.1 1,090.2 21.8 -68.1 103.1 107.6 1,706.2 1,917.2 1.5 -5.9
27 IRB-Brasil Resseguros S.A. Brazil NR - 1,312.2 1,223.0 376.6 399.6 69.5 81.5 1,030.6 1,081.2 26.9 28.2
28 Taiping Reinsurance Co., Ltd. Hong Kong A Stable 1,257.2 1,501.4 37.0 11.0 98.6 96.4 1,032.0 1,049.8 3.4 0.8
29 Aspen Insurance Holdings Ltd. Bermuda A Negative 8 1,182.9 1,250.0 61.3 -203.3 104.0 125.1 2,656.0 2,928.5 4.5 -15.6
30 Peak Reinsurance Co. Ltd. Hong Kong NR - 1,056.5 928.8 17.2 35.3 98.3 105.1 965.5 911.6 1.7 3.9
31 Qatar Reinsurance Co. Ltd. Bermuda A Stable 971.0 712.6 21.2 -66.8 103.9 122.0 1,109.7 1,148.7 2.0 -11.1
32 Allianz SE Germany AA Stable 9 931.9 788.8 27.0 72.7 99.8 92.6 N.A. N.A. 3.0 9.9
33 QBE Insurance Group Ltd. Australia A+ Stable 920.0 837.3 123.0 73.7 62.2 108.4 8,400.0 8,901.0 13.2 8.4
34 Markel Corporation United States A Stable 882.3 978.2 -118.3 -299.2 112.7 132.0 N.A. N.A. -12.7 -32.0
35 Chubb Tempest Reinsurance Ltd. Bermuda AA Stable 857.9 880.2 294.3 222.3 101.8 111.2 N.A. N.A. 24.5 18.0
36 Deutsche Rückversicherung AG Germany A+ Stable 841.3 851.2 70.0 54.8 95.2 98.0 917.9 881.1 8.0 6.2
37 African Reinsurance Corp. Nigeria A- Stable 681.3 625.7 30.6 87.4 97.9 95.9 917.1 902.0 4.4 13.0
38 PICC Reinsurance Co. Ltd. China NR - 634.2 482.5 -34.6 -37.5 106.5 114.7 394.6 426.5 -5.3 -13.5
39 Nacional de Reaseguros S.A. Spain A Stable 516.5 532.6 50.4 33.9 92.9 96.1 423.0 466.2 9.6 5.8
40 Atradius Reinsurance DAC Ireland NR - 502.9 507.4 24.9 53.9 95.7 89.3 727.5 752.7 4.9 10.5
Total: 225,097.8 229,608.1 13,486.3 3,776.6 102.0 109.9 474,485.4 504,756.5 5.7 1.3
Rating = Financial strength ratings of core operating entities of the groups as of 02.08.2019N.A. = Not availableN.M. = Not meaningfulNR = Not ratedNote: Exchange rates may slightly differ from previous years’ GRH data due to alignment of foreign exchange rates with other S&P Global surveys1. Swiss Reinsurance Co.: Figures represent the group as a whole including primary business. 2. Munich Reinsurance Co.: Total Adjusted Shareholders’ Funds for the group includes ERGO. 3. Lloyd’s: The figures in the Pretax Operating Income column reflect the underwriting result. Net Premium Written, underwriting result and the
combined ratio relate to reinsurance business only; all other items include direct business. The data presented is based on the published pro forma accounts for the Market, which represents an aggregation of all syndicates participating at Lloyd’s. As such, some premium included for Lloyd’s may also be included by other groups that consolidate their Lloyd’s operations. Adjusted Shareholders’ Funds are members’ funds for the Market as a whole.
4. Everest Re Group Ltd.: 2017 Adjusted Shareholders’ Funds have been restated to reflect Average Adjusted Shareholders’ Equity. 5. Fairfax Financial Holdings Ltd.: Pretax Operating Income is from reinsurance operations only. Total Adjusted Shareholders’ Funds are the totals
from all operations; as reported.6. Tokio Marine & Nichido Fire Insurance Co. Ltd.: Figures represent Tokio Marine & Nichido Fire Insurance Co.,Ltd. and exclude the group’s other
reinsurance subsidiaries.7. Validus Reinsurance Ltd.: Information provided previously came from the reinsurance segment of the former Validus Holdings, Ltd. Balances
above are taken from the GAAP financial statements for Validus Reinsurance, Ltd. 8. Aspen Insurance Holdings Ltd.: 2018 and 2017 numbers have been reported as a mixture of the reinsurance segment and whole company.
Where available numbers relate to reinsurance segment, and where unavailable the group results are shown. 9. Allianz SE: Figures are based on IFRS results (only external business). Pretax Operating Income excludes administrative expenses
Top 40 By Company
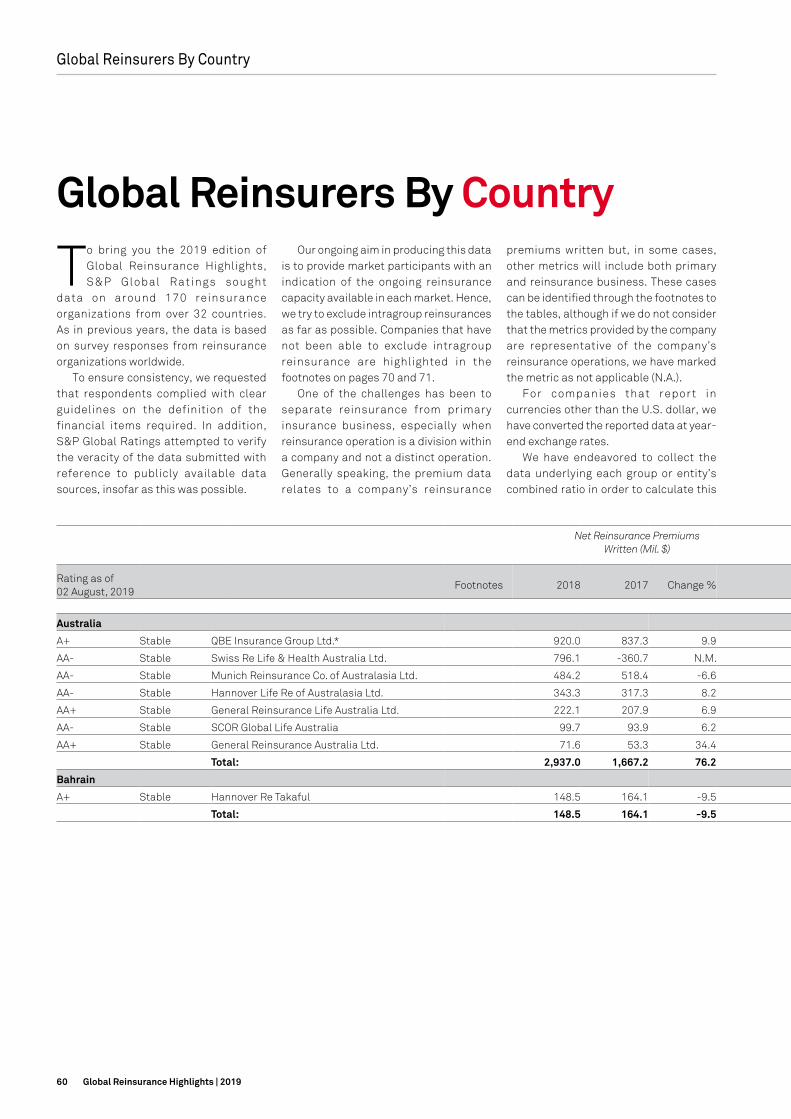
60 Global Reinsurance Highlights | 2019
Australia
A+ Stable QBE Insurance Group Ltd.* 920.0 837.3 9.9 123.0 73.7 62.2 108.4 8,400.0 8,901.0 -5.6 13.2 8.4
AA- Stable Swiss Re Life & Health Australia Ltd. 796.1 -360.7 N.M. 34.6 233.0 N.M. N.M. 909.4 1,251.5 -27.3 2.0 -73.1
AA- Stable Munich Reinsurance Co. of Australasia Ltd. 484.2 518.4 -6.6 -150.0 -31.7 N.M. N.M. 854.2 1,020.6 -16.3 -27.1 -5.3
AA- Stable Hannover Life Re of Australasia Ltd. 343.3 317.3 8.2 -11.7 16.0 N.M. N.M. 331.4 387.6 -14.5 -2.9 4.2
AA+ Stable General Reinsurance Life Australia Ltd. 222.1 207.9 6.9 -148.8 23.3 N.M. N.M. 59.1 131.7 -55.1 -331.2 4.0
AA- Stable SCOR Global Life Australia 99.7 93.9 6.2 0.9 5.3 N.M. N.M. 102.2 113.0 -9.5 0.9 5.2
AA+ Stable General Reinsurance Australia Ltd. 71.6 53.3 34.4 0.2 20.6 120.6 72.4 242.0 319.8 -24.3 0.3 38.6
Total: 2,937.0 1,667.2 76.2 -151.7 340.3 66.0 106.7 10,898.4 12,125.2 -10.1 -4.0 15.0
Bahrain
A+ Stable Hannover Re Takaful 148.5 164.1 -9.5 3.4 19.6 89.0 95.4 167.5 169.9 -1.4 2.2 10.3
Total: 148.5 164.1 -9.5 3.4 19.6 89.0 95.4 167.5 169.9 -1.4 2.2 10.3
Net Reinsurance Premiums Written (Mil. $)
Pretax Operating Income (Mil. $)
Combined Ratio (%)
Total Adjusted Shareholders’ Funds (Mil. $)
Return on Revenue (%)
Rating as of 02 August, 2019
Footnotes 2018 2017 Change % 2018 2017 2018 2017 2018 2017 Change % 2018 2017
Global Reinsurers By Country
To bring you the 2019 edition of Global Reinsurance Highlights, S&P Global Ratings sought
data on around 170 reinsurance organizations from over 32 countries. As in previous years, the data is based on survey responses from reinsurance organizations worldwide.
To ensure consistency, we requested that respondents complied with clear guidelines on the definition of the financial items required. In addition, S&P Global Ratings attempted to verify the veracity of the data submitted with reference to publicly available data sources, insofar as this was possible.
Our ongoing aim in producing this data is to provide market participants with an indication of the ongoing reinsurance capacity available in each market. Hence, we try to exclude intragroup reinsurances as far as possible. Companies that have not been able to exclude intragroup reinsurance are highlighted in the footnotes on pages 70 and 71.
One of the challenges has been to separate reinsurance from primary insurance business, especially when reinsurance operation is a division within a company and not a distinct operation. Generally speaking, the premium data relates to a company’s reinsurance
premiums written but, in some cases, other metrics will include both primary and reinsurance business. These cases can be identified through the footnotes to the tables, although if we do not consider that the metrics provided by the company are representative of the company’s reinsurance operations, we have marked the metric as not applicable (N.A.).
For companies that report in currencies other than the U.S. dollar, we have converted the reported data at year-end exchange rates.
We have endeavored to collect the data underlying each group or entity’s combined ratio in order to calculate this
Global Reinsurers By Country

61Global Reinsurance Highlights | 2019
Australia
A+ Stable QBE Insurance Group Ltd.* 920.0 837.3 9.9 123.0 73.7 62.2 108.4 8,400.0 8,901.0 -5.6 13.2 8.4
AA- Stable Swiss Re Life & Health Australia Ltd. 796.1 -360.7 N.M. 34.6 233.0 N.M. N.M. 909.4 1,251.5 -27.3 2.0 -73.1
AA- Stable Munich Reinsurance Co. of Australasia Ltd. 484.2 518.4 -6.6 -150.0 -31.7 N.M. N.M. 854.2 1,020.6 -16.3 -27.1 -5.3
AA- Stable Hannover Life Re of Australasia Ltd. 343.3 317.3 8.2 -11.7 16.0 N.M. N.M. 331.4 387.6 -14.5 -2.9 4.2
AA+ Stable General Reinsurance Life Australia Ltd. 222.1 207.9 6.9 -148.8 23.3 N.M. N.M. 59.1 131.7 -55.1 -331.2 4.0
AA- Stable SCOR Global Life Australia 99.7 93.9 6.2 0.9 5.3 N.M. N.M. 102.2 113.0 -9.5 0.9 5.2
AA+ Stable General Reinsurance Australia Ltd. 71.6 53.3 34.4 0.2 20.6 120.6 72.4 242.0 319.8 -24.3 0.3 38.6
Total: 2,937.0 1,667.2 76.2 -151.7 340.3 66.0 106.7 10,898.4 12,125.2 -10.1 -4.0 15.0
Bahrain
A+ Stable Hannover Re Takaful 148.5 164.1 -9.5 3.4 19.6 89.0 95.4 167.5 169.9 -1.4 2.2 10.3
Total: 148.5 164.1 -9.5 3.4 19.6 89.0 95.4 167.5 169.9 -1.4 2.2 10.3
Global Reinsurers By Country
Net Reinsurance Premiums Written (Mil. $)
Pretax Operating Income (Mil. $)
Combined Ratio (%)
Total Adjusted Shareholders’ Funds (Mil. $)
Return on Revenue (%)
Rating as of 02 August, 2019
Footnotes 2018 2017 Change % 2018 2017 2018 2017 2018 2017 Change % 2018 2017
metric in a comparable manner. The combined ratios presented in our Global Reinsurance Highlights report have been calculated as: (net losses incurred + net underwriting expenses)/net premiums earned. The combined (loss and expense) ratio of any entity that writes purely life reinsurance has been marked as not meaningful (NM), as we do not consider this to be an accurate measure of a life reinsurer’s profitability. For these groups or entities writing both non-life and life reinsurance business, the combined ratio reflects non-life business only.
The main group and country listing for each entity surveyed is representative of
that group or company’s total reinsurance business written, whether it be life, non-life, or a combination of both. n
Samantha ByrneLondon, (+44) [email protected]
Antun ZvonarNew York, (1) [email protected]
Johannes BenderFrankfurt, (+49) [email protected]
Jean Paul Huby KleinFrankfurt, (+49) [email protected]
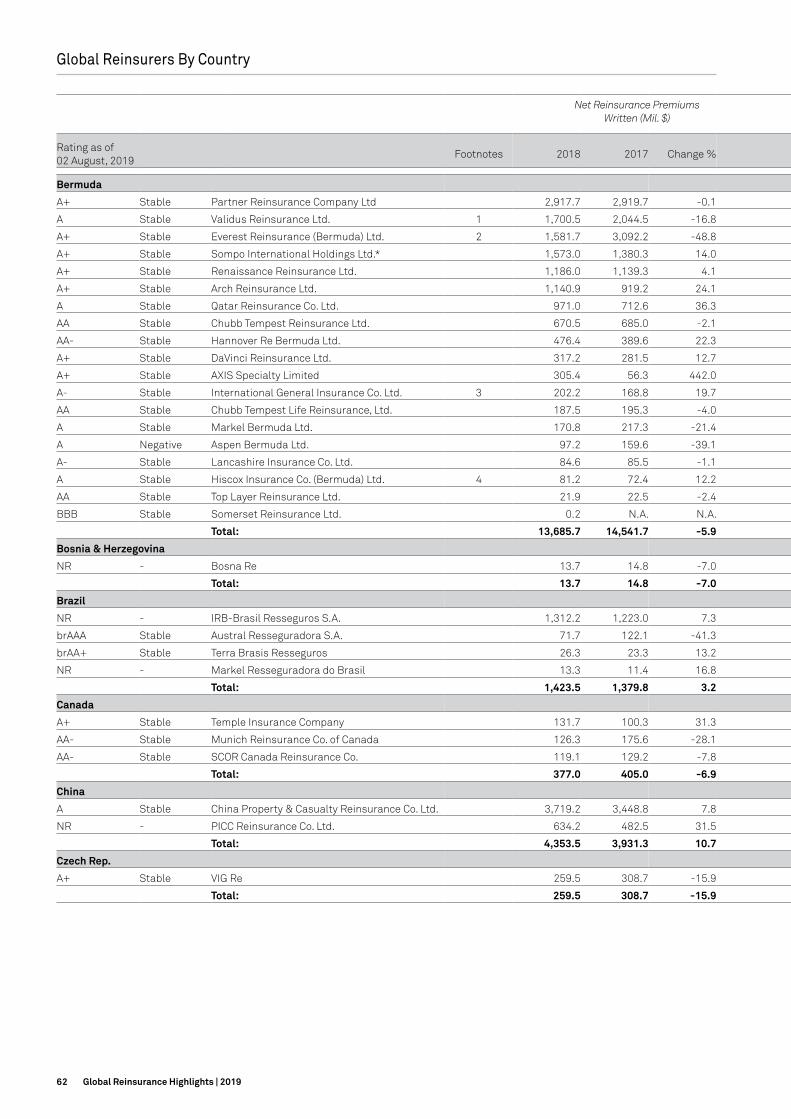
62 Global Reinsurance Highlights | 2019
Bermuda
A+ Stable Partner Reinsurance Company Ltd 2,917.7 2,919.7 -0.1 101.9 -81.4 103.8 107.6 3,319.6 3,319.6 0.0 3.4 -2.7
A Stable Validus Reinsurance Ltd. 1 1,700.5 2,044.5 -16.8 -91.0 54.0 108.1 99.7 3,259.0 4,248.6 -23.3 -4.9 2.4
A+ Stable Everest Reinsurance (Bermuda) Ltd. 2 1,581.7 3,092.2 -48.8 907.0 563.8 49.0 89.2 3,146.5 2,991.3 5.2 53.8 15.0
A+ Stable Sompo International Holdings Ltd.* 1,573.0 1,380.3 14.0 N.A. N.A. N.A. N.A. 6,846.9 7,036.3 -2.7 N.A. N.A.
A+ Stable Renaissance Reinsurance Ltd. 1,186.0 1,139.3 4.1 N.A. N.A. 77.0 134.4 2,000.0 2,000.0 0.0 N.A. N.A.
A+ Stable Arch Reinsurance Ltd. 1,140.9 919.2 24.1 499.9 189.0 96.1 101.8 4,478.1 4,677.3 -4.3 36.2 17.0
A Stable Qatar Reinsurance Co. Ltd. 971.0 712.6 36.3 21.2 -66.8 103.9 122.0 1,109.7 1,148.7 -3.4 2.0 -11.1
AA Stable Chubb Tempest Reinsurance Ltd. 670.5 685.0 -2.1 247.1 179.6 101.8 111.2 N.A. N.A. N.A. 25.8 18.3
AA- Stable Hannover Re Bermuda Ltd. 476.4 389.6 22.3 168.3 125.2 75.6 81.8 1,234.9 1,210.7 2.0 33.2 28.9
A+ Stable DaVinci Reinsurance Ltd. 317.2 281.5 12.7 N.A. N.A. 92.7 169.9 1,477.4 1,447.7 2.0 N.A. N.A.
A+ Stable AXIS Specialty Limited 305.4 56.3 442.0 N.A. N.A. 137.9 282.4 3,470.8 3,762.4 -7.8 N.A. N.A.
A- Stable International General Insurance Co. Ltd. 3 202.2 168.8 19.7 22.7 -3.3 87.3 101.2 331.0 316.1 4.7 12.1 -2.0
AA Stable Chubb Tempest Life Reinsurance, Ltd. 187.5 195.3 -4.0 47.2 42.7 N.M. N.M. N.A. N.A. N.A. 19.5 16.6
A Stable Markel Bermuda Ltd. 170.8 217.3 -21.4 -46.5 -68.7 127.0 136.0 N.A. N.A. N.A. -27.0 -36.0
A Negative Aspen Bermuda Ltd. 97.2 159.6 -39.1 -44.6 -122.1 136.5 175.3 1,565.5 1,857.8 -15.7 -18.8 -43.3
A- Stable Lancashire Insurance Co. Ltd. 84.6 85.5 -1.1 79.1 -56.9 69.2 169.0 869.5 931.3 -6.6 34.0 -24.3
A Stable Hiscox Insurance Co. (Bermuda) Ltd. 4 81.2 72.4 12.2 -16.6 9.2 116.9 88.3 613.8 864.8 -29.0 -17.1 8.5
AA Stable Top Layer Reinsurance Ltd. 21.9 22.5 -2.4 N.A. N.A. N.A. N.A. 93.1 100.4 -7.3 N.A. N.A.
BBB Stable Somerset Reinsurance Ltd. 0.2 N.A. N.A. 24.3 N.A. N.A. N.A. 415.0 N.A. N.A. 60.4 N.A.
Total: 13,685.7 14,541.7 -5.9 1,919.9 764.2 93.3 107.2 34,230.9 35,913.0 -4.7 16.5 5.7
Bosnia & Herzegovina
NR - Bosna Re 13.7 14.8 -7.0 1.1 8.4 84.5 90.2 19.7 23.7 -17.0 7.5 35.8
Total: 13.7 14.8 -7.0 1.1 8.4 84.5 90.2 19.7 23.7 -17.0 7.5 35.8
Brazil
NR - IRB-Brasil Resseguros S.A. 1,312.2 1,223.0 7.3 376.6 399.6 69.5 81.5 1,030.6 1,081.2 -4.7 26.9 28.2
brAAA Stable Austral Resseguradora S.A. 71.7 122.1 -41.3 0.1 10.8 87.9 98.5 73.0 85.1 -14.2 0.1 8.7
brAA+ Stable Terra Brasis Resseguros 26.3 23.3 13.2 -0.9 -3.6 N.A. N.A. 26.9 31.4 -14.3 -3.3 -12.2
NR - Markel Resseguradora do Brasil 13.3 11.4 16.8 3.7 -2.8 69.7 119.5 N.A. N.A. N.A. 30.3 -19.5
Total: 1,423.5 1,379.8 3.2 379.5 404.0 70.5 83.4 1,130.5 1,197.7 -5.6 25.0 25.5
Canada
A+ Stable Temple Insurance Company 131.7 100.3 31.3 -4.1 4.9 115.1 103.9 153.8 147.1 4.6 -3.6 4.1
AA- Stable Munich Reinsurance Co. of Canada 126.3 175.6 -28.1 37.2 54.8 84.4 76.6 192.0 226.7 -15.3 23.6 29.8
AA- Stable SCOR Canada Reinsurance Co. 119.1 129.2 -7.8 5.2 14.8 101.2 93.8 104.6 113.3 -7.7 4.0 11.4
Total: 377.0 405.0 -6.9 38.4 74.6 98.6 89.4 450.4 487.1 -7.5 9.5 17.2
China
A Stable China Property & Casualty Reinsurance Co. Ltd. 3,719.2 3,448.8 7.8 158.4 121.8 100.3 103.6 2,714.0 2,768.9 -2.0 4.3 3.4
NR - PICC Reinsurance Co. Ltd. 634.2 482.5 31.5 -34.6 -37.5 106.5 114.7 394.6 426.5 -7.5 -5.3 -13.5
Total: 4,353.5 3,931.3 10.7 123.9 84.3 101.2 104.4 3,108.6 3,195.4 -2.7 2.9 2.2
Czech Rep.
A+ Stable VIG Re 259.5 308.7 -15.9 17.2 12.0 90.3 93.1 194.4 204.2 -4.8 6.2 3.7
Total: 259.5 308.7 -15.9 17.2 12.0 90.3 93.1 194.4 204.2 -4.8 6.2 3.7
Global Reinsurers By Country
Net Reinsurance Premiums Written (Mil. $)
Pretax Operating Income (Mil. $)
Combined Ratio (%)
Total Adjusted Shareholders’ Funds (Mil. $)
Return on Revenue (%)
Rating as of 02 August, 2019
Footnotes 2018 2017 Change % 2018 2017 2018 2017 2018 2017 Change % 2018 2017
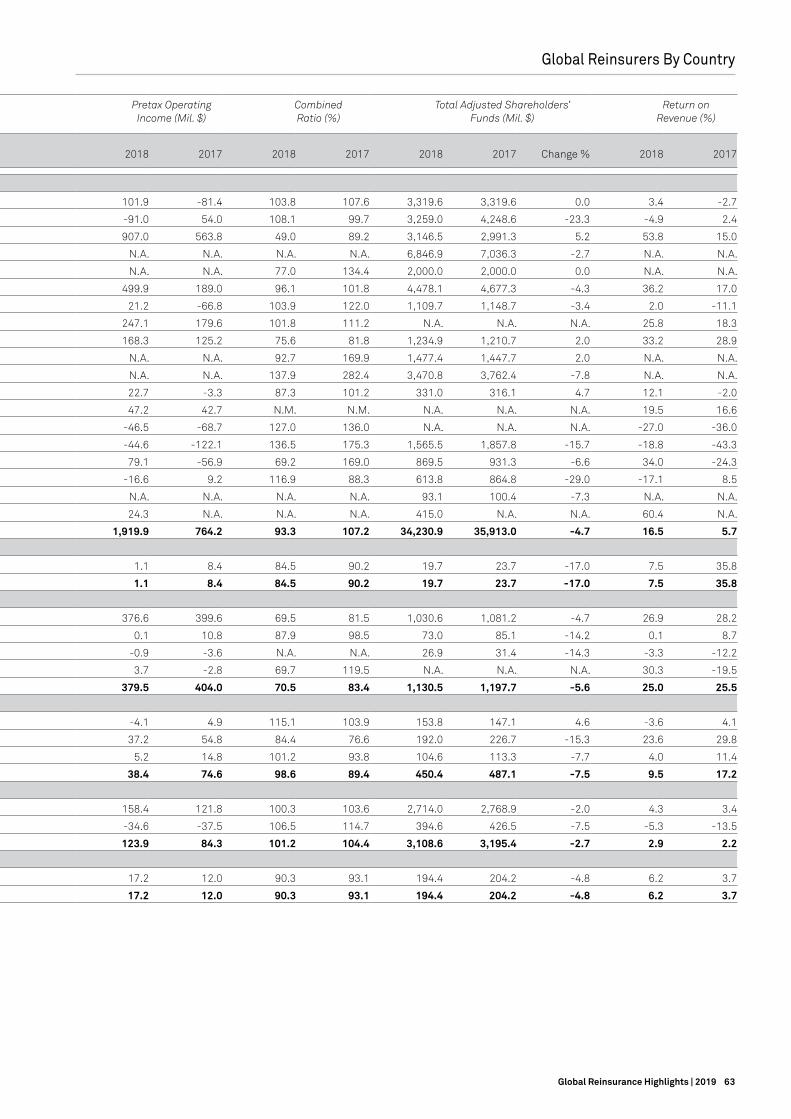
63Global Reinsurance Highlights | 2019
Global Reinsurers By Country
Bermuda
A+ Stable Partner Reinsurance Company Ltd 2,917.7 2,919.7 -0.1 101.9 -81.4 103.8 107.6 3,319.6 3,319.6 0.0 3.4 -2.7
A Stable Validus Reinsurance Ltd. 1 1,700.5 2,044.5 -16.8 -91.0 54.0 108.1 99.7 3,259.0 4,248.6 -23.3 -4.9 2.4
A+ Stable Everest Reinsurance (Bermuda) Ltd. 2 1,581.7 3,092.2 -48.8 907.0 563.8 49.0 89.2 3,146.5 2,991.3 5.2 53.8 15.0
A+ Stable Sompo International Holdings Ltd.* 1,573.0 1,380.3 14.0 N.A. N.A. N.A. N.A. 6,846.9 7,036.3 -2.7 N.A. N.A.
A+ Stable Renaissance Reinsurance Ltd. 1,186.0 1,139.3 4.1 N.A. N.A. 77.0 134.4 2,000.0 2,000.0 0.0 N.A. N.A.
A+ Stable Arch Reinsurance Ltd. 1,140.9 919.2 24.1 499.9 189.0 96.1 101.8 4,478.1 4,677.3 -4.3 36.2 17.0
A Stable Qatar Reinsurance Co. Ltd. 971.0 712.6 36.3 21.2 -66.8 103.9 122.0 1,109.7 1,148.7 -3.4 2.0 -11.1
AA Stable Chubb Tempest Reinsurance Ltd. 670.5 685.0 -2.1 247.1 179.6 101.8 111.2 N.A. N.A. N.A. 25.8 18.3
AA- Stable Hannover Re Bermuda Ltd. 476.4 389.6 22.3 168.3 125.2 75.6 81.8 1,234.9 1,210.7 2.0 33.2 28.9
A+ Stable DaVinci Reinsurance Ltd. 317.2 281.5 12.7 N.A. N.A. 92.7 169.9 1,477.4 1,447.7 2.0 N.A. N.A.
A+ Stable AXIS Specialty Limited 305.4 56.3 442.0 N.A. N.A. 137.9 282.4 3,470.8 3,762.4 -7.8 N.A. N.A.
A- Stable International General Insurance Co. Ltd. 3 202.2 168.8 19.7 22.7 -3.3 87.3 101.2 331.0 316.1 4.7 12.1 -2.0
AA Stable Chubb Tempest Life Reinsurance, Ltd. 187.5 195.3 -4.0 47.2 42.7 N.M. N.M. N.A. N.A. N.A. 19.5 16.6
A Stable Markel Bermuda Ltd. 170.8 217.3 -21.4 -46.5 -68.7 127.0 136.0 N.A. N.A. N.A. -27.0 -36.0
A Negative Aspen Bermuda Ltd. 97.2 159.6 -39.1 -44.6 -122.1 136.5 175.3 1,565.5 1,857.8 -15.7 -18.8 -43.3
A- Stable Lancashire Insurance Co. Ltd. 84.6 85.5 -1.1 79.1 -56.9 69.2 169.0 869.5 931.3 -6.6 34.0 -24.3
A Stable Hiscox Insurance Co. (Bermuda) Ltd. 4 81.2 72.4 12.2 -16.6 9.2 116.9 88.3 613.8 864.8 -29.0 -17.1 8.5
AA Stable Top Layer Reinsurance Ltd. 21.9 22.5 -2.4 N.A. N.A. N.A. N.A. 93.1 100.4 -7.3 N.A. N.A.
BBB Stable Somerset Reinsurance Ltd. 0.2 N.A. N.A. 24.3 N.A. N.A. N.A. 415.0 N.A. N.A. 60.4 N.A.
Total: 13,685.7 14,541.7 -5.9 1,919.9 764.2 93.3 107.2 34,230.9 35,913.0 -4.7 16.5 5.7
Bosnia & Herzegovina
NR - Bosna Re 13.7 14.8 -7.0 1.1 8.4 84.5 90.2 19.7 23.7 -17.0 7.5 35.8
Total: 13.7 14.8 -7.0 1.1 8.4 84.5 90.2 19.7 23.7 -17.0 7.5 35.8
Brazil
NR - IRB-Brasil Resseguros S.A. 1,312.2 1,223.0 7.3 376.6 399.6 69.5 81.5 1,030.6 1,081.2 -4.7 26.9 28.2
brAAA Stable Austral Resseguradora S.A. 71.7 122.1 -41.3 0.1 10.8 87.9 98.5 73.0 85.1 -14.2 0.1 8.7
brAA+ Stable Terra Brasis Resseguros 26.3 23.3 13.2 -0.9 -3.6 N.A. N.A. 26.9 31.4 -14.3 -3.3 -12.2
NR - Markel Resseguradora do Brasil 13.3 11.4 16.8 3.7 -2.8 69.7 119.5 N.A. N.A. N.A. 30.3 -19.5
Total: 1,423.5 1,379.8 3.2 379.5 404.0 70.5 83.4 1,130.5 1,197.7 -5.6 25.0 25.5
Canada
A+ Stable Temple Insurance Company 131.7 100.3 31.3 -4.1 4.9 115.1 103.9 153.8 147.1 4.6 -3.6 4.1
AA- Stable Munich Reinsurance Co. of Canada 126.3 175.6 -28.1 37.2 54.8 84.4 76.6 192.0 226.7 -15.3 23.6 29.8
AA- Stable SCOR Canada Reinsurance Co. 119.1 129.2 -7.8 5.2 14.8 101.2 93.8 104.6 113.3 -7.7 4.0 11.4
Total: 377.0 405.0 -6.9 38.4 74.6 98.6 89.4 450.4 487.1 -7.5 9.5 17.2
China
A Stable China Property & Casualty Reinsurance Co. Ltd. 3,719.2 3,448.8 7.8 158.4 121.8 100.3 103.6 2,714.0 2,768.9 -2.0 4.3 3.4
NR - PICC Reinsurance Co. Ltd. 634.2 482.5 31.5 -34.6 -37.5 106.5 114.7 394.6 426.5 -7.5 -5.3 -13.5
Total: 4,353.5 3,931.3 10.7 123.9 84.3 101.2 104.4 3,108.6 3,195.4 -2.7 2.9 2.2
Czech Rep.
A+ Stable VIG Re 259.5 308.7 -15.9 17.2 12.0 90.3 93.1 194.4 204.2 -4.8 6.2 3.7
Total: 259.5 308.7 -15.9 17.2 12.0 90.3 93.1 194.4 204.2 -4.8 6.2 3.7
Net Reinsurance Premiums Written (Mil. $)
Pretax Operating Income (Mil. $)
Combined Ratio (%)
Total Adjusted Shareholders’ Funds (Mil. $)
Return on Revenue (%)
Rating as of 02 August, 2019
Footnotes 2018 2017 Change % 2018 2017 2018 2017 2018 2017 Change % 2018 2017

64 Global Reinsurance Highlights | 2019
France
AA- Stable SCOR Global Life SE 3,140.2 2,835.6 10.7 141.1 96.0 106.6 101.7 976.0 990.4 -1.5 4.3 3.2
AA- Stable SCOR SE 2,126.4 2,141.7 -0.7 649.1 -61.2 119.1 119.9 4,128.8 4,128.5 0.0 23.3 -2.8
AA- Stable SCOR Global P&C SE 1,445.1 1,467.0 -1.5 367.0 162.1 96.4 105.0 2,675.7 2,721.5 -1.7 22.4 9.6
AA Stable Caisse Centrale de Reassurance 931.2 963.9 -3.4 89.6 -1,104.1 101.3 227.1 5,510.2 5,740.0 -4.0 8.8 -104.2
A- Positive CCR RE 508.1 452.6 12.3 29.7 4.6 96.2 105.4 697.4 780.3 -10.6 5.9 1.0
Total: 8,150.9 7,860.8 3.7 1,276.5 -902.5 106.7 122.8 13,988.2 14,360.8 -2.6 13.8 -10.7
Germany
AA- Stable Munich Reinsurance Co. 19,769.1 24,489.0 -19.3 2,226.1 182.5 95.5 113.7 37,806.4 35,336.7 7.0 10.6 0.6
AA- Stable Hannover Rück SE 12,058.7 12,507.9 -3.6 906.9 693.3 100.6 100.2 9,199.8 9,596.9 -4.1 6.8 5.2
AA+ Stable General Reinsurance AG 3,565.6 2,973.2 19.9 565.6 404.8 80.8 94.6 4,263.2 5,183.6 -17.8 16.2 13.1
AA- Stable R+V Versicherung AG 3,169.7 3,017.4 5.0 399.9 246.9 100.8 106.1 7,777.3 7,508.5 3.6 10.8 7.2
AA- Stable E+S Rückversicherung AG 2,095.2 2,264.3 -7.5 128.8 279.8 103.7 95.8 2,411.5 2,715.9 -11.2 5.5 11.4
AA Stable Allianz SE 5 931.9 788.8 18.1 27.0 72.7 99.8 92.6 N.A. N.A. N.A. 3.0 9.9
A+ Stable Deutsche Rückversicherung AG 551.8 564.0 -2.2 46.5 63.5 94.4 91.1 793.8 793.9 0.0 8.1 11.2
A+ Stable DEVK Re 486.3 448.6 8.4 148.1 114.2 95.1 96.7 1,374.1 1,403.5 -2.1 21.6 17.6
Total: 42,628.2 47,053.3 -9.4 4,448.9 2,057.7 96.7 106.8 63,626.0 62,539.0 1.7 9.7 3.9
Hong Kong
A Stable Taiping Reinsurance Co., Ltd. 1,257.2 1,501.4 -16.3 37.0 11.0 98.6 96.4 1,032.0 1,049.8 -1.7 3.4 0.8
NR - Peak Reinsurance Co. Ltd. 1,056.5 928.8 13.8 17.2 35.3 98.3 105.1 965.5 911.6 5.9 1.7 3.9
AA- Stable SCOR Reinsurance Company (Asia) Limited 146.1 118.7 23.0 -16.6 18.9 105.6 73.8 213.3 247.3 -13.7 -11.2 15.7
Total: 2,459.8 2,548.8 -3.5 37.7 65.2 98.9 98.4 2,210.8 2,208.7 0.1 1.7 2.8
India
NR - General Insurance Corporation of India 5,678.2 5,796.3 -2.0 555.6 557.7 105.3 103.8 3,674.7 3,711.4 -1.0 8.6 8.3
Total: 5,678.2 5,796.3 -2.0 555.6 557.7 105.3 103.8 3,674.7 3,711.4 -1.0 8.6 8.3
Iran
NR - Iranian Reinsurance Company 16.7 18.2 -8.1 32.7 17.4 100.9 96.7 88.9 97.1 -8.5 64.3 51.9
Total: 16.7 18.2 -8.1 32.7 17.4 100.9 96.7 88.9 97.1 -8.5 64.3 51.9
Ireland
AA- Stable SCOR Life Ireland DAC. 2,947.0 N.A. N.A. 215.7 N.A. N.M. N.M. 2,335.0 N.A. N.A. 7.2 N.A.
AA- Stable Hannover Reinsurance (Ireland) DAC 2,909.1 2,878.1 1.1 90.5 -320.9 102.0 99.5 857.3 1,479.9 -42.1 2.9 -10.0
A+ Stable Partner Reinsurance Europe SE 2,148.1 1,926.2 11.5 130.6 81.4 68.8 71.2 2,657.5 2,603.3 2.1 11.7 6.9
AA- Stable SCOR Global Life Reinsurance Ireland DAC 1,442.7 4,388.1 -67.1 830.2 463.8 N.M. N.M. 1,611.9 911.2 76.9 54.7 10.4
A+ Stable AXIS Re SE 764.9 839.8 -8.9 N.A. N.A. 91.6 96.5 1,439.2 736.0 95.5 N.A. N.A.
NR - Atradius Reinsurance DAC 502.9 507.4 -0.9 24.9 53.9 95.7 89.3 727.5 752.7 -3.3 4.9 10.5
A+ Stable Arch Re Europe 64.6 64.5 0.2 N.A. N.A. 60.0 73.6 N.A. N.A. N.A. N.A. N.A.
Total: 10,779.2 10,604.0 1.7 1,291.9 278.1 93.1 92.3 9,628.3 6,483.1 48.5 14.0 3.0
Japan
A+ Positive Tokio Marine & Nichido Fire Insurance Co. Ltd. 6 2,692.6 2,728.8 -1.3 2,845.0 3,065.9 N.A. N.A. 26,062.1 28,561.5 -8.8 N.A. N.A.
A+ Stable Sompo Japan Nipponkoa Insurance Inc. 2,259.1 2,356.3 -4.1 N.A. N.A. N.A. N.A. 16,992.9 19,040.9 -10.8 N.A. N.A.
A+ Stable Aioi Nissay Dowa Insurance Co. Ltd. 1,957.0 2,038.2 -4.0 N.A. N.A. N.A. N.A. 9,326.1 10,587.4 -11.9 N.A. N.A.
A+ Stable Toa Reinsurance Co. 1,758.7 1,746.0 0.7 9.9 125.8 102.2 95.0 2,256.6 2,400.8 -6.0 0.6 7.0
A+ Stable Mitsui Sumitomo Insurance Co. Ltd. 1,677.5 1,793.9 -6.5 N.A. N.A. N.A. N.A. 21,931.2 N.A. N.A. N.A. N.A.
Total: 10,344.9 10,663.2 -3.0 2,854.9 3,191.7 102.2 95.0 76,568.9 60,590.5 26.4 0.6 7.0
Kazakhstan
BBB- Stable Eurasia Insurance Co. 64.9 67.3 -3.6 -14.5 -15.9 124.2 126.6 367.3 328.3 11.9 -10.3 -16.5
Total: 64.9 67.3 -3.6 -14.5 -15.9 124.2 126.6 367.3 328.3 11.9 -10.3 -16.5
Global Reinsurers By Country
Net Reinsurance Premiums Written (Mil. $)
Pretax Operating Income (Mil. $)
Combined Ratio (%)
Total Adjusted Shareholders’ Funds (Mil. $)
Return on Revenue (%)
Rating as of 02 August, 2019
Footnotes 2018 2017 Change % 2018 2017 2018 2017 2018 2017 Change % 2018 2017
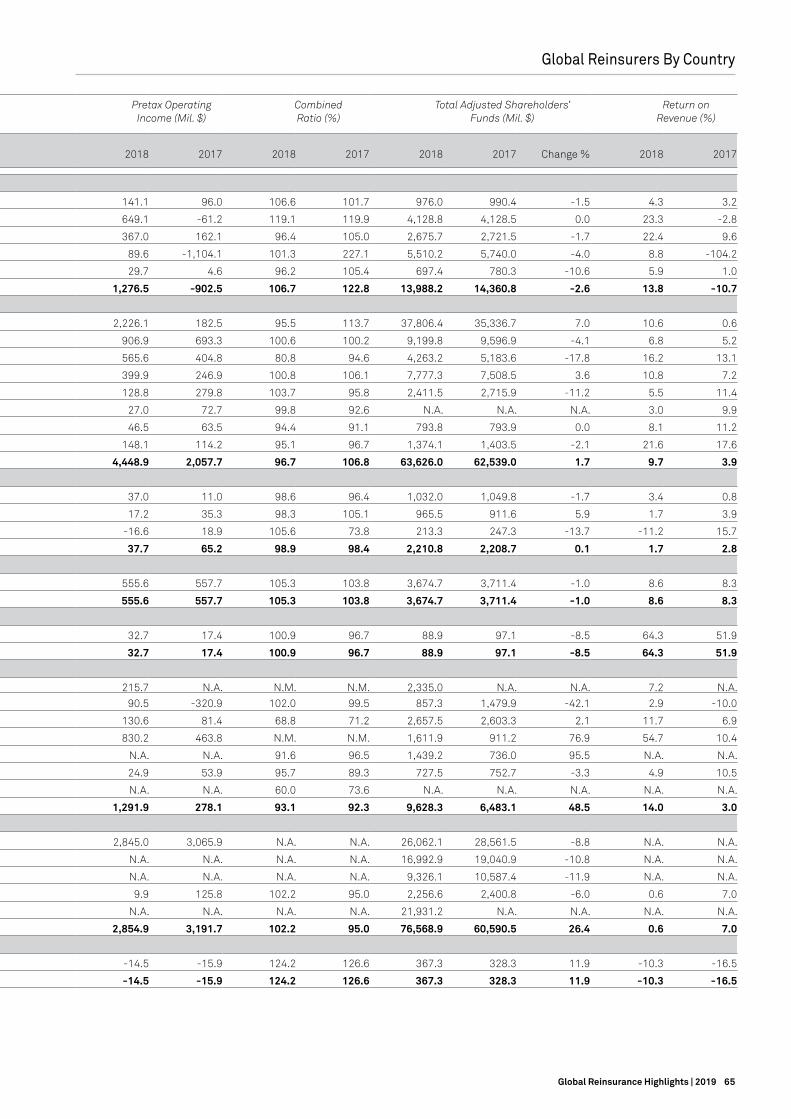
65Global Reinsurance Highlights | 2019
Global Reinsurers By Country
France
AA- Stable SCOR Global Life SE 3,140.2 2,835.6 10.7 141.1 96.0 106.6 101.7 976.0 990.4 -1.5 4.3 3.2
AA- Stable SCOR SE 2,126.4 2,141.7 -0.7 649.1 -61.2 119.1 119.9 4,128.8 4,128.5 0.0 23.3 -2.8
AA- Stable SCOR Global P&C SE 1,445.1 1,467.0 -1.5 367.0 162.1 96.4 105.0 2,675.7 2,721.5 -1.7 22.4 9.6
AA Stable Caisse Centrale de Reassurance 931.2 963.9 -3.4 89.6 -1,104.1 101.3 227.1 5,510.2 5,740.0 -4.0 8.8 -104.2
A- Positive CCR RE 508.1 452.6 12.3 29.7 4.6 96.2 105.4 697.4 780.3 -10.6 5.9 1.0
Total: 8,150.9 7,860.8 3.7 1,276.5 -902.5 106.7 122.8 13,988.2 14,360.8 -2.6 13.8 -10.7
Germany
AA- Stable Munich Reinsurance Co. 19,769.1 24,489.0 -19.3 2,226.1 182.5 95.5 113.7 37,806.4 35,336.7 7.0 10.6 0.6
AA- Stable Hannover Rück SE 12,058.7 12,507.9 -3.6 906.9 693.3 100.6 100.2 9,199.8 9,596.9 -4.1 6.8 5.2
AA+ Stable General Reinsurance AG 3,565.6 2,973.2 19.9 565.6 404.8 80.8 94.6 4,263.2 5,183.6 -17.8 16.2 13.1
AA- Stable R+V Versicherung AG 3,169.7 3,017.4 5.0 399.9 246.9 100.8 106.1 7,777.3 7,508.5 3.6 10.8 7.2
AA- Stable E+S Rückversicherung AG 2,095.2 2,264.3 -7.5 128.8 279.8 103.7 95.8 2,411.5 2,715.9 -11.2 5.5 11.4
AA Stable Allianz SE 5 931.9 788.8 18.1 27.0 72.7 99.8 92.6 N.A. N.A. N.A. 3.0 9.9
A+ Stable Deutsche Rückversicherung AG 551.8 564.0 -2.2 46.5 63.5 94.4 91.1 793.8 793.9 0.0 8.1 11.2
A+ Stable DEVK Re 486.3 448.6 8.4 148.1 114.2 95.1 96.7 1,374.1 1,403.5 -2.1 21.6 17.6
Total: 42,628.2 47,053.3 -9.4 4,448.9 2,057.7 96.7 106.8 63,626.0 62,539.0 1.7 9.7 3.9
Hong Kong
A Stable Taiping Reinsurance Co., Ltd. 1,257.2 1,501.4 -16.3 37.0 11.0 98.6 96.4 1,032.0 1,049.8 -1.7 3.4 0.8
NR - Peak Reinsurance Co. Ltd. 1,056.5 928.8 13.8 17.2 35.3 98.3 105.1 965.5 911.6 5.9 1.7 3.9
AA- Stable SCOR Reinsurance Company (Asia) Limited 146.1 118.7 23.0 -16.6 18.9 105.6 73.8 213.3 247.3 -13.7 -11.2 15.7
Total: 2,459.8 2,548.8 -3.5 37.7 65.2 98.9 98.4 2,210.8 2,208.7 0.1 1.7 2.8
India
NR - General Insurance Corporation of India 5,678.2 5,796.3 -2.0 555.6 557.7 105.3 103.8 3,674.7 3,711.4 -1.0 8.6 8.3
Total: 5,678.2 5,796.3 -2.0 555.6 557.7 105.3 103.8 3,674.7 3,711.4 -1.0 8.6 8.3
Iran
NR - Iranian Reinsurance Company 16.7 18.2 -8.1 32.7 17.4 100.9 96.7 88.9 97.1 -8.5 64.3 51.9
Total: 16.7 18.2 -8.1 32.7 17.4 100.9 96.7 88.9 97.1 -8.5 64.3 51.9
Ireland
AA- Stable SCOR Life Ireland DAC. 2,947.0 N.A. N.A. 215.7 N.A. N.M. N.M. 2,335.0 N.A. N.A. 7.2 N.A.
AA- Stable Hannover Reinsurance (Ireland) DAC 2,909.1 2,878.1 1.1 90.5 -320.9 102.0 99.5 857.3 1,479.9 -42.1 2.9 -10.0
A+ Stable Partner Reinsurance Europe SE 2,148.1 1,926.2 11.5 130.6 81.4 68.8 71.2 2,657.5 2,603.3 2.1 11.7 6.9
AA- Stable SCOR Global Life Reinsurance Ireland DAC 1,442.7 4,388.1 -67.1 830.2 463.8 N.M. N.M. 1,611.9 911.2 76.9 54.7 10.4
A+ Stable AXIS Re SE 764.9 839.8 -8.9 N.A. N.A. 91.6 96.5 1,439.2 736.0 95.5 N.A. N.A.
NR - Atradius Reinsurance DAC 502.9 507.4 -0.9 24.9 53.9 95.7 89.3 727.5 752.7 -3.3 4.9 10.5
A+ Stable Arch Re Europe 64.6 64.5 0.2 N.A. N.A. 60.0 73.6 N.A. N.A. N.A. N.A. N.A.
Total: 10,779.2 10,604.0 1.7 1,291.9 278.1 93.1 92.3 9,628.3 6,483.1 48.5 14.0 3.0
Japan
A+ Positive Tokio Marine & Nichido Fire Insurance Co. Ltd. 6 2,692.6 2,728.8 -1.3 2,845.0 3,065.9 N.A. N.A. 26,062.1 28,561.5 -8.8 N.A. N.A.
A+ Stable Sompo Japan Nipponkoa Insurance Inc. 2,259.1 2,356.3 -4.1 N.A. N.A. N.A. N.A. 16,992.9 19,040.9 -10.8 N.A. N.A.
A+ Stable Aioi Nissay Dowa Insurance Co. Ltd. 1,957.0 2,038.2 -4.0 N.A. N.A. N.A. N.A. 9,326.1 10,587.4 -11.9 N.A. N.A.
A+ Stable Toa Reinsurance Co. 1,758.7 1,746.0 0.7 9.9 125.8 102.2 95.0 2,256.6 2,400.8 -6.0 0.6 7.0
A+ Stable Mitsui Sumitomo Insurance Co. Ltd. 1,677.5 1,793.9 -6.5 N.A. N.A. N.A. N.A. 21,931.2 N.A. N.A. N.A. N.A.
Total: 10,344.9 10,663.2 -3.0 2,854.9 3,191.7 102.2 95.0 76,568.9 60,590.5 26.4 0.6 7.0
Kazakhstan
BBB- Stable Eurasia Insurance Co. 64.9 67.3 -3.6 -14.5 -15.9 124.2 126.6 367.3 328.3 11.9 -10.3 -16.5
Total: 64.9 67.3 -3.6 -14.5 -15.9 124.2 126.6 367.3 328.3 11.9 -10.3 -16.5
Net Reinsurance Premiums Written (Mil. $)
Pretax Operating Income (Mil. $)
Combined Ratio (%)
Total Adjusted Shareholders’ Funds (Mil. $)
Return on Revenue (%)
Rating as of 02 August, 2019
Footnotes 2018 2017 Change % 2018 2017 2018 2017 2018 2017 Change % 2018 2017

66 Global Reinsurance Highlights | 2019
Kuwait
NR - Kuwait Reinsurance Co. K.S.C.P 143.9 114.2 26.0 12.2 11.1 92.1 95.1 160.5 151.5 5.9 9.0 10.6
Total: 143.9 114.2 26.0 12.2 11.1 92.1 95.1 160.5 151.5 5.9 9.0 10.6
Luxembourg
AA- Stable Swiss Re Europe S.A. 6,947.8 7,385.3 -5.9 492.9 358.3 82.0 94.8 1,174.5 1,272.1 -7.7 17.1 11.7
Total: 6,947.8 7,385.3 -5.9 492.9 358.3 82.0 94.8 1,174.5 1,272.1 -7.7 17.1 11.7
Nigeria
A- Stable African Reinsurance Corp. 468.9 425.9 10.1 34.3 85.9 87.9 79.6 875.9 840.2 4.3 7.1 18.9
Total: 468.9 425.9 10.1 34.3 85.9 87.9 79.6 875.9 840.2 4.3 7.1 18.9
Poland
NR - Polskie Towarzystwo Reasekuracji S.A. 63.2 60.6 4.3 2.1 4.0 98.2 91.8 72.5 74.7 -3.0 2.8 6.3
Total: 63.2 60.6 4.3 2.1 4.0 98.2 91.8 72.5 74.7 -3.0 2.8 6.3
Russia
NR - Russian National Reinsurance Company 175.9 133.6 31.6 -11.6 -36.0 107.2 152.5 336.2 381.7 -11.9 -5.7 -34.5
BBB Stable SOGAZ 102.2 99.3 2.9 15.9 61.0 82.3 41.7 2,194.3 1,900.1 15.5 4.7 15.8
BBB- Stable Ingosstrakh Insurance Co. 48.5 53.2 -8.7 12.1 31.0 71.9 40.3 989.5 1,075.1 -8.0 28.0 54.6
NR - Russian Re Co. Ltd. 13.4 12.8 4.4 1.6 1.2 87.7 88.6 13.8 13.1 5.6 10.4 10.1
Total: 340.0 298.9 13.7 18.1 57.2 94.1 75.7 3,533.8 3,370.0 4.9 3.0 10.2
Singapore
A- Stable Asia Capital Reinsurance Group Pte Ltd. 478.9 446.0 7.4 -17.6 39.3 112.9 107.1 763.2 811.4 -5.9 -3.7 8.3
AA- Stable SCOR Reinsurance Asia-Pacific 442.2 399.9 10.6 35.6 10.8 92.4 100.9 165.6 145.5 13.8 8.0 2.3
NR - Singapore Reinsurance Corporation Ltd. 37.4 38.1 -1.9 -3.7 0.7 N.A. N.A. 193.0 193.7 -0.4 -7.4 1.6
Total: 958.5 884.0 8.4 14.4 50.9 102.8 103.7 1,121.7 1,150.6 -2.5 1.5 5.1
Slovenia
A Stable Pozavarovalnica Sava, d.d. 98.1 111.1 -11.7 51.6 41.7 91.0 91.5 366.3 349.3 4.9 27.2 22.3
A Stable Triglav Re 92.4 89.2 3.5 3.5 5.4 97.5 93.8 91.7 99.3 -7.6 3.7 6.1
Total: 190.5 200.3 -4.9 55.1 47.2 93.4 92.3 458.0 448.6 2.1 19.4 17.0
South Africa
AA- Stable Munich Reinsurance Co. of Africa Ltd. 321.1 319.0 0.7 18.0 -1.0 100.6 115.9 221.7 232.5 -4.7 3.8 -0.2
AA- Stable Swiss Re Africa Ltd. 214.8 203.2 5.7 5.2 -2.7 110.0 115.4 51.1 48.9 4.4 2.3 -1.2
A- Stable General Reinsurance Africa Ltd. 211.2 184.2 14.6 35.9 13.7 N.M. N.M. 151.5 123.8 22.4 14.7 6.4
AA- Stable Hannover Life Reassurance Africa Ltd. 139.6 152.6 -8.5 2.6 4.3 N.M. N.M. 39.4 43.2 -8.8 1.7 2.6
AA- Stable Hannover Reinsurance Africa Ltd. 62.9 58.3 7.9 7.4 2.3 91.0 93.9 61.5 61.8 -0.4 8.4 3.6
A- Stable African Re Corp. (South Africa) Ltd. 58.4 60.9 -4.0 -3.8 1.5 78.1 122.7 41.4 61.9 -33.2 -6.3 1.9
BB+ Stable GIC Re South Africa Ltd. 56.2 31.5 78.3 21.3 -6.4 84.6 127.5 9.0 N.A. N.A. 31.8 -29.7
AA- Stable SCOR Africa Ltd. 31.1 49.7 -37.4 4.8 -10.1 78.3 130.0 23.8 20.5 16.0 14.3 -21.2
Total: 1,095.3 1,059.4 3.4 91.6 1.6 98.2 115.8 599.3 592.6 1.1 6.8 0.1
South Korea
A Stable Korean Reinsurance Co. 4,769.1 4,687.0 1.8 13.1 182.6 101.6 96.5 2,011.1 2,030.8 -1.0 0.3 3.9
Total: 4,769.1 4,687.0 1.8 13.1 182.6 101.6 96.5 2,011.1 2,030.8 -1.0 0.3 3.9
Spain
A Positive Mapfre Re, Compania de Reaseguros, S.A. 3,435.2 3,310.4 3.8 245.0 255.8 95.7 94.2 1,834.9 1,499.3 22.4 6.2 6.9
A Stable Nacional de Reaseguros S.A. 516.5 532.6 -3.0 50.4 33.9 92.9 96.1 423.0 466.2 -9.3 9.6 5.8
Total: 3,951.7 3,843.0 2.8 295.3 289.7 95.3 94.5 2,257.9 1,965.5 14.9 6.6 6.7
Global Reinsurers By Country
Net Reinsurance Premiums Written (Mil. $)
Pretax Operating Income (Mil. $)
Combined Ratio (%)
Total Adjusted Shareholders’ Funds (Mil. $)
Return on Revenue (%)
Rating as of 02 August, 2019
Footnotes 2018 2017 Change % 2018 2017 2018 2017 2018 2017 Change % 2018 2017

67Global Reinsurance Highlights | 2019
Global Reinsurers By Country
Kuwait
NR - Kuwait Reinsurance Co. K.S.C.P 143.9 114.2 26.0 12.2 11.1 92.1 95.1 160.5 151.5 5.9 9.0 10.6
Total: 143.9 114.2 26.0 12.2 11.1 92.1 95.1 160.5 151.5 5.9 9.0 10.6
Luxembourg
AA- Stable Swiss Re Europe S.A. 6,947.8 7,385.3 -5.9 492.9 358.3 82.0 94.8 1,174.5 1,272.1 -7.7 17.1 11.7
Total: 6,947.8 7,385.3 -5.9 492.9 358.3 82.0 94.8 1,174.5 1,272.1 -7.7 17.1 11.7
Nigeria
A- Stable African Reinsurance Corp. 468.9 425.9 10.1 34.3 85.9 87.9 79.6 875.9 840.2 4.3 7.1 18.9
Total: 468.9 425.9 10.1 34.3 85.9 87.9 79.6 875.9 840.2 4.3 7.1 18.9
Poland
NR - Polskie Towarzystwo Reasekuracji S.A. 63.2 60.6 4.3 2.1 4.0 98.2 91.8 72.5 74.7 -3.0 2.8 6.3
Total: 63.2 60.6 4.3 2.1 4.0 98.2 91.8 72.5 74.7 -3.0 2.8 6.3
Russia
NR - Russian National Reinsurance Company 175.9 133.6 31.6 -11.6 -36.0 107.2 152.5 336.2 381.7 -11.9 -5.7 -34.5
BBB Stable SOGAZ 102.2 99.3 2.9 15.9 61.0 82.3 41.7 2,194.3 1,900.1 15.5 4.7 15.8
BBB- Stable Ingosstrakh Insurance Co. 48.5 53.2 -8.7 12.1 31.0 71.9 40.3 989.5 1,075.1 -8.0 28.0 54.6
NR - Russian Re Co. Ltd. 13.4 12.8 4.4 1.6 1.2 87.7 88.6 13.8 13.1 5.6 10.4 10.1
Total: 340.0 298.9 13.7 18.1 57.2 94.1 75.7 3,533.8 3,370.0 4.9 3.0 10.2
Singapore
A- Stable Asia Capital Reinsurance Group Pte Ltd. 478.9 446.0 7.4 -17.6 39.3 112.9 107.1 763.2 811.4 -5.9 -3.7 8.3
AA- Stable SCOR Reinsurance Asia-Pacific 442.2 399.9 10.6 35.6 10.8 92.4 100.9 165.6 145.5 13.8 8.0 2.3
NR - Singapore Reinsurance Corporation Ltd. 37.4 38.1 -1.9 -3.7 0.7 N.A. N.A. 193.0 193.7 -0.4 -7.4 1.6
Total: 958.5 884.0 8.4 14.4 50.9 102.8 103.7 1,121.7 1,150.6 -2.5 1.5 5.1
Slovenia
A Stable Pozavarovalnica Sava, d.d. 98.1 111.1 -11.7 51.6 41.7 91.0 91.5 366.3 349.3 4.9 27.2 22.3
A Stable Triglav Re 92.4 89.2 3.5 3.5 5.4 97.5 93.8 91.7 99.3 -7.6 3.7 6.1
Total: 190.5 200.3 -4.9 55.1 47.2 93.4 92.3 458.0 448.6 2.1 19.4 17.0
South Africa
AA- Stable Munich Reinsurance Co. of Africa Ltd. 321.1 319.0 0.7 18.0 -1.0 100.6 115.9 221.7 232.5 -4.7 3.8 -0.2
AA- Stable Swiss Re Africa Ltd. 214.8 203.2 5.7 5.2 -2.7 110.0 115.4 51.1 48.9 4.4 2.3 -1.2
A- Stable General Reinsurance Africa Ltd. 211.2 184.2 14.6 35.9 13.7 N.M. N.M. 151.5 123.8 22.4 14.7 6.4
AA- Stable Hannover Life Reassurance Africa Ltd. 139.6 152.6 -8.5 2.6 4.3 N.M. N.M. 39.4 43.2 -8.8 1.7 2.6
AA- Stable Hannover Reinsurance Africa Ltd. 62.9 58.3 7.9 7.4 2.3 91.0 93.9 61.5 61.8 -0.4 8.4 3.6
A- Stable African Re Corp. (South Africa) Ltd. 58.4 60.9 -4.0 -3.8 1.5 78.1 122.7 41.4 61.9 -33.2 -6.3 1.9
BB+ Stable GIC Re South Africa Ltd. 56.2 31.5 78.3 21.3 -6.4 84.6 127.5 9.0 N.A. N.A. 31.8 -29.7
AA- Stable SCOR Africa Ltd. 31.1 49.7 -37.4 4.8 -10.1 78.3 130.0 23.8 20.5 16.0 14.3 -21.2
Total: 1,095.3 1,059.4 3.4 91.6 1.6 98.2 115.8 599.3 592.6 1.1 6.8 0.1
South Korea
A Stable Korean Reinsurance Co. 4,769.1 4,687.0 1.8 13.1 182.6 101.6 96.5 2,011.1 2,030.8 -1.0 0.3 3.9
Total: 4,769.1 4,687.0 1.8 13.1 182.6 101.6 96.5 2,011.1 2,030.8 -1.0 0.3 3.9
Spain
A Positive Mapfre Re, Compania de Reaseguros, S.A. 3,435.2 3,310.4 3.8 245.0 255.8 95.7 94.2 1,834.9 1,499.3 22.4 6.2 6.9
A Stable Nacional de Reaseguros S.A. 516.5 532.6 -3.0 50.4 33.9 92.9 96.1 423.0 466.2 -9.3 9.6 5.8
Total: 3,951.7 3,843.0 2.8 295.3 289.7 95.3 94.5 2,257.9 1,965.5 14.9 6.6 6.7
Net Reinsurance Premiums Written (Mil. $)
Pretax Operating Income (Mil. $)
Combined Ratio (%)
Total Adjusted Shareholders’ Funds (Mil. $)
Return on Revenue (%)
Rating as of 02 August, 2019
Footnotes 2018 2017 Change % 2018 2017 2018 2017 2018 2017 Change % 2018 2017

68 Global Reinsurance Highlights | 2019
Switzerland
AA- Stable Swiss Reinsurance Co. Ltd. 11,851.5 11,875.1 -0.2 1,122.5 1,924.9 104.5 109.4 10,771.7 13,504.3 -20.2 8.8 14.0
AA- Stable New Reinsurance Co. 5,399.0 4,436.6 21.7 -118.5 67.1 93.4 100.7 1,507.4 1,320.9 14.1 -2.1 1.5
AA- Stable Swiss Re Asia Ltd (SRAL) 2,246.5 -2.8 N.M. -329.3 -19.5 181.0 152.0 1,368.7 1,420.8 -3.7 -17.0 -5.5
AA- Stable SCOR Switzerland AG 1,382.3 1,653.6 -16.4 127.2 -17.9 88.1 98.9 1,382.2 1,537.0 -10.1 9.4 -1.1
A+ Stable Tokio Millennium Re AG 1,179.3 1,301.6 -9.4 51.9 -217.7 95.9 116.2 1,257.2 1,190.6 5.6 3.8 -15.5
A Stable MS Amlin AG 1,129.2 1,322.4 -14.6 -100.1 -376.9 107.8 129.0 N.A. N.A. N.A. -8.5 -26.1
A- Positive Allied World Assurance Co. Ltd. 649.3 679.2 -4.4 87.4 -131.7 94.1 129.4 N.A. N.A. N.A. 12.1 -18.5
A+ Stable Deutsche Rückversicherung Schweiz AG 297.1 273.0 8.8 17.6 -12.8 98.0 107.8 203.5 215.3 -5.5 5.8 -4.5
NR - SIGNAL IDUNA Reinsurance Ltd. 159.5 162.9 -2.0 10.9 9.0 97.4 97.9 204.3 228.2 -10.5 6.3 5.1
A- Stable Echo Rückversicherungs-AG 123.2 115.2 7.0 -2.7 -5.8 97.0 101.2 93.8 97.4 -3.7 -2.3 -5.0
A+ Stable TransRe Zurich 97.0 89.9 7.8 -1.5 -3.3 104.5 104.7 274.5 271.0 1.3 -1.6 -3.2
Total: 24,513.9 21,906.7 11.9 865.3 1,215.4 106.4 108.8 17,063.4 19,785.5 -13.8 3.4 5.0
Taiwan
A Stable Central Reinsurance Corp. 468.8 460.3 1.8 39.9 49.5 95.9 91.2 495.5 519.1 -4.6 8.3 10.5
Total: 468.8 460.3 1.8 39.9 49.5 95.9 91.2 495.5 519.1 -4.6 8.3 10.5
Turkey
trA+ - Milli Reasurans T.A.S. 7 218.4 251.2 -13.1 19.0 16.6 136.1 113.6 328.3 417.1 -21.3 8.2 6.0
Total: 218.4 251.2 -13.1 19.0 16.6 136.1 113.6 328.3 417.1 -21.3 8.2 6.0
United Kingdom
A+ Stable Lloyd's 8 9,969.4 10,746.5 -7.2 -581.9 -1,798.3 106.0 117.2 34,998.1 36,191.7 -3.3 N.A. N.A.
NR - MS Amlin Plc 9 1,489.5 1,594.8 -6.6 -156.1 -523.0 111.7 133.9 N.A. N.A. N.A. -10.3 -29.7
A Negative Aspen Insurance U.K. Ltd. 1,052.0 1,043.7 0.8 2.1 -163.9 99.8 116.4 842.5 888.5 -5.2 0.2 -15.6
NR - Brit Limited 342.8 291.0 17.8 -30.0 49.6 111.8 86.9 N.A. N.A. N.A. -8.8 16.1
A+ Stable TransRe London Ltd. 219.4 220.8 -0.6 10.3 -5.6 101.2 111.3 520.6 519.1 0.3 4.5 -2.3
A Stable Markel International Insurance Co. Ltd. 152.0 65.6 131.8 -1.4 -65.6 100.9 212.4 N.A. N.A. N.A. -0.9 -112.4
AA- Stable SCOR U.K. Co. Ltd. 146.5 137.1 6.9 -1.2 -16.3 107.0 115.3 159.5 176.5 -9.7 -0.9 -11.4
NR - Cathedral Capital Holdings Ltd 72.1 69.8 3.3 -0.2 6.7 99.5 123.2 43.3 45.4 -4.6 -0.1 3.2
A- Stable Lancashire Insurance Co. (UK) Ltd. 7.6 20.1 -62.2 -5.9 1.2 63.2 74.1 170.0 176.2 -3.5 -22.3 2.9
NR - Korean Re Underwriting Ltd. 3.2 18.9 -82.8 3.2 -1.8 75.6 105.4 18.9 16.8 12.3 28.1 -10.2
Total: 13,454.5 14,208.1 -5.3 -761.1 -2,517.0 106.0 118.7 36,752.9 38,014.2 -3.3 -4.8 -18.8
Global Reinsurers By Country
Net Reinsurance Premiums Written (Mil. $)
Pretax Operating Income (Mil. $)
Combined Ratio (%)
Total Adjusted Shareholders’ Funds (Mil. $)
Return on Revenue (%)
Rating as of 02 August, 2019
Footnotes 2018 2017 Change % 2018 2017 2018 2017 2018 2017 Change % 2018 2017

69Global Reinsurance Highlights | 2019
Global Reinsurers By Country
Switzerland
AA- Stable Swiss Reinsurance Co. Ltd. 11,851.5 11,875.1 -0.2 1,122.5 1,924.9 104.5 109.4 10,771.7 13,504.3 -20.2 8.8 14.0
AA- Stable New Reinsurance Co. 5,399.0 4,436.6 21.7 -118.5 67.1 93.4 100.7 1,507.4 1,320.9 14.1 -2.1 1.5
AA- Stable Swiss Re Asia Ltd (SRAL) 2,246.5 -2.8 N.M. -329.3 -19.5 181.0 152.0 1,368.7 1,420.8 -3.7 -17.0 -5.5
AA- Stable SCOR Switzerland AG 1,382.3 1,653.6 -16.4 127.2 -17.9 88.1 98.9 1,382.2 1,537.0 -10.1 9.4 -1.1
A+ Stable Tokio Millennium Re AG 1,179.3 1,301.6 -9.4 51.9 -217.7 95.9 116.2 1,257.2 1,190.6 5.6 3.8 -15.5
A Stable MS Amlin AG 1,129.2 1,322.4 -14.6 -100.1 -376.9 107.8 129.0 N.A. N.A. N.A. -8.5 -26.1
A- Positive Allied World Assurance Co. Ltd. 649.3 679.2 -4.4 87.4 -131.7 94.1 129.4 N.A. N.A. N.A. 12.1 -18.5
A+ Stable Deutsche Rückversicherung Schweiz AG 297.1 273.0 8.8 17.6 -12.8 98.0 107.8 203.5 215.3 -5.5 5.8 -4.5
NR - SIGNAL IDUNA Reinsurance Ltd. 159.5 162.9 -2.0 10.9 9.0 97.4 97.9 204.3 228.2 -10.5 6.3 5.1
A- Stable Echo Rückversicherungs-AG 123.2 115.2 7.0 -2.7 -5.8 97.0 101.2 93.8 97.4 -3.7 -2.3 -5.0
A+ Stable TransRe Zurich 97.0 89.9 7.8 -1.5 -3.3 104.5 104.7 274.5 271.0 1.3 -1.6 -3.2
Total: 24,513.9 21,906.7 11.9 865.3 1,215.4 106.4 108.8 17,063.4 19,785.5 -13.8 3.4 5.0
Taiwan
A Stable Central Reinsurance Corp. 468.8 460.3 1.8 39.9 49.5 95.9 91.2 495.5 519.1 -4.6 8.3 10.5
Total: 468.8 460.3 1.8 39.9 49.5 95.9 91.2 495.5 519.1 -4.6 8.3 10.5
Turkey
trA+ - Milli Reasurans T.A.S. 7 218.4 251.2 -13.1 19.0 16.6 136.1 113.6 328.3 417.1 -21.3 8.2 6.0
Total: 218.4 251.2 -13.1 19.0 16.6 136.1 113.6 328.3 417.1 -21.3 8.2 6.0
United Kingdom
A+ Stable Lloyd's 8 9,969.4 10,746.5 -7.2 -581.9 -1,798.3 106.0 117.2 34,998.1 36,191.7 -3.3 N.A. N.A.
NR - MS Amlin Plc 9 1,489.5 1,594.8 -6.6 -156.1 -523.0 111.7 133.9 N.A. N.A. N.A. -10.3 -29.7
A Negative Aspen Insurance U.K. Ltd. 1,052.0 1,043.7 0.8 2.1 -163.9 99.8 116.4 842.5 888.5 -5.2 0.2 -15.6
NR - Brit Limited 342.8 291.0 17.8 -30.0 49.6 111.8 86.9 N.A. N.A. N.A. -8.8 16.1
A+ Stable TransRe London Ltd. 219.4 220.8 -0.6 10.3 -5.6 101.2 111.3 520.6 519.1 0.3 4.5 -2.3
A Stable Markel International Insurance Co. Ltd. 152.0 65.6 131.8 -1.4 -65.6 100.9 212.4 N.A. N.A. N.A. -0.9 -112.4
AA- Stable SCOR U.K. Co. Ltd. 146.5 137.1 6.9 -1.2 -16.3 107.0 115.3 159.5 176.5 -9.7 -0.9 -11.4
NR - Cathedral Capital Holdings Ltd 72.1 69.8 3.3 -0.2 6.7 99.5 123.2 43.3 45.4 -4.6 -0.1 3.2
A- Stable Lancashire Insurance Co. (UK) Ltd. 7.6 20.1 -62.2 -5.9 1.2 63.2 74.1 170.0 176.2 -3.5 -22.3 2.9
NR - Korean Re Underwriting Ltd. 3.2 18.9 -82.8 3.2 -1.8 75.6 105.4 18.9 16.8 12.3 28.1 -10.2
Total: 13,454.5 14,208.1 -5.3 -761.1 -2,517.0 106.0 118.7 36,752.9 38,014.2 -3.3 -4.8 -18.8
Net Reinsurance Premiums Written (Mil. $)
Pretax Operating Income (Mil. $)
Combined Ratio (%)
Total Adjusted Shareholders’ Funds (Mil. $)
Return on Revenue (%)
Rating as of 02 August, 2019
Footnotes 2018 2017 Change % 2018 2017 2018 2017 2018 2017 Change % 2018 2017
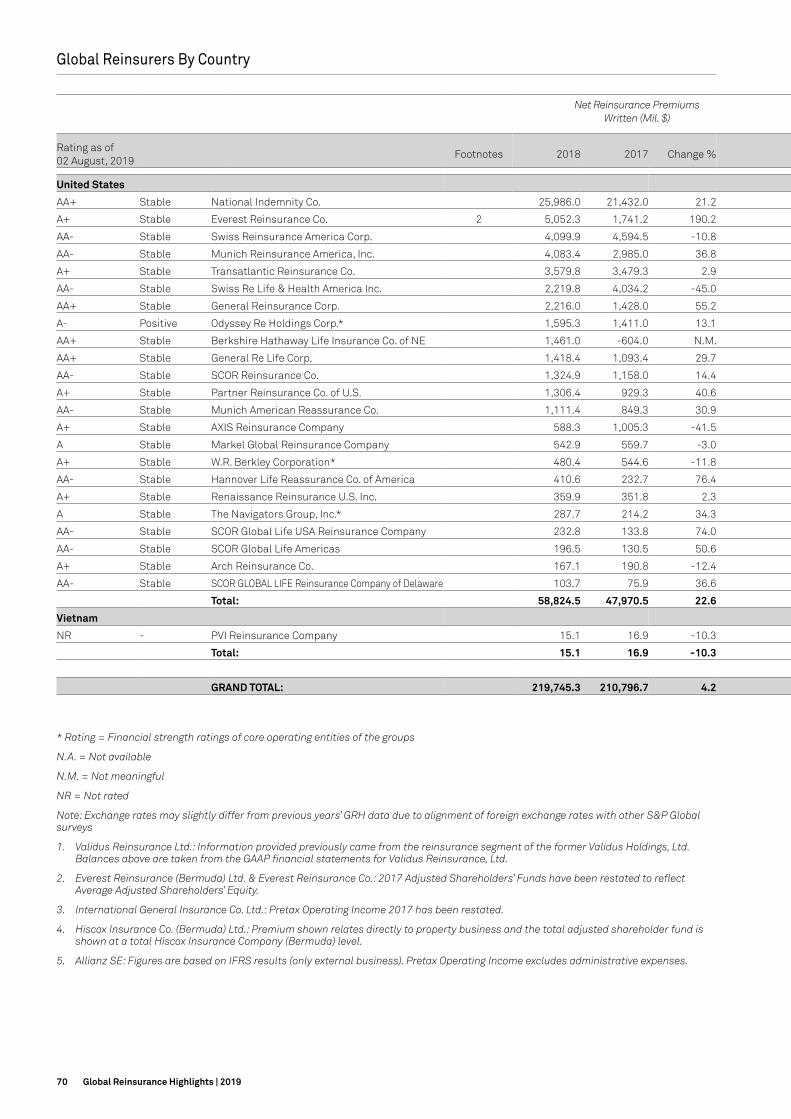
70 Global Reinsurance Highlights | 2019
United States
AA+ Stable National Indemnity Co. 25,986.0 21,432.0 21.2 682.0 -894.0 92.6 103.7 121,739.0 127,777.0 -4.7 2.0 -4.5
A+ Stable Everest Reinsurance Co. 2 5,052.3 1,741.2 190.2 -1,326.3 -577.8 130.4 183.6 3,468.2 3,486.8 -0.5 -26.5 -48.1
AA- Stable Swiss Reinsurance America Corp. 4,099.9 4,594.5 -10.8 -198.1 130.7 109.5 107.5 3,312.4 3,238.0 2.3 -4.7 6.1
AA- Stable Munich Reinsurance America, Inc. 4,083.4 2,985.0 36.8 -406.9 -663.0 113.9 124.7 3,718.7 4,019.2 -7.5 -7.6 -17.9
A+ Stable Transatlantic Reinsurance Co. 3,579.8 3,479.3 2.9 48.2 20.2 107.2 108.1 4,614.1 4,992.9 -7.6 1.2 0.5
AA- Stable Swiss Re Life & Health America Inc. 2,219.8 4,034.2 -45.0 -1,199.6 51.9 N.M. N.M. 2,035.8 1,157.4 75.9 -23.2 1.8
AA+ Stable General Reinsurance Corp. 2,216.0 1,428.0 55.2 241.0 -83.0 113.9 128.6 10,550.0 11,393.0 -7.4 8.5 -4.4
A- Positive Odyssey Re Holdings Corp.* 1,595.3 1,411.0 13.1 324.7 117.0 89.9 101.9 N.A. N.A. N.A. 18.9 7.9
AA+ Stable Berkshire Hathaway Life Insurance Co. of NE 1,461.0 -604.0 N.M. -386.0 126.0 N.M. N.M. 5,414.0 4,816.0 12.4 -18.9 -101.6
AA+ Stable General Re Life Corp. 1,418.4 1,093.4 29.7 35.3 -570.7 N.M. N.M. 972.4 746.8 30.2 2.3 -46.5
AA- Stable SCOR Reinsurance Co. 1,324.9 1,158.0 14.4 -158.7 -220.9 117.5 124.8 903.5 820.1 10.2 -12.0 -20.3
A+ Stable Partner Reinsurance Co. of U.S. 1,306.4 929.3 40.6 -161.3 7.2 122.8 107.3 1,094.3 1,335.7 -18.1 -14.0 0.7
AA- Stable Munich American Reassurance Co. 1,111.4 849.3 30.9 40.3 -77.5 N.M. N.M. 638.6 718.5 -11.1 2.9 -6.7
A+ Stable AXIS Reinsurance Company 588.3 1,005.3 -41.5 N.A. N.A. 92.4 103.5 987.3 966.8 2.1 N.A. N.A.
A Stable Markel Global Reinsurance Company 542.9 559.7 -3.0 -80.6 -103.0 113.8 119.3 N.A. N.A. N.A. -13.8 -19.3
A+ Stable W.R. Berkley Corporation* 480.4 544.6 -11.8 62.1 -15.3 106.4 117.6 N.A. N.A. N.A. 10.3 -2.2
AA- Stable Hannover Life Reassurance Co. of America 410.6 232.7 76.4 67.0 55.9 N.M. N.M. 349.9 211.2 65.7 17.0 23.5
A+ Stable Renaissance Reinsurance U.S. Inc. 359.9 351.8 2.3 N.A. N.A. 97.0 108.2 506.9 660.0 -23.2 N.A. N.A.
A Stable The Navigators Group, Inc.* 287.7 214.2 34.3 9.8 -14.8 96.1 108.6 1,186.9 1,226.0 -3.2 2.8 -5.5
AA- Stable SCOR Global Life USA Reinsurance Company 232.8 133.8 74.0 15.6 -31.8 N.M. N.M. 264.4 277.1 -4.6 6.1 -21.8
AA- Stable SCOR Global Life Americas 196.5 130.5 50.6 -57.6 9.4 N.M. N.M. 208.0 208.0 0.0 -26.9 6.2
A+ Stable Arch Reinsurance Co. 167.1 190.8 -12.4 19.6 14.4 99.8 99.3 1,554.6 1,471.5 5.6 22.3 6.7
AA- Stable SCOR GLOBAL LIFE Reinsurance Company of Delaware 103.7 75.9 36.6 45.3 -2.1 N.M. N.M. 127.1 97.3 30.6 41.0 -2.5
Total: 58,824.5 47,970.5 22.6 -2,384.3 -2,721.2 103.0 110.3 163,645.8 169,619.1 -3.5 -3.3 -6.2
Vietnam
NR - PVI Reinsurance Company 15.1 16.9 -10.3 2.4 3.4 82.1 76.4 36.3 33.8 7.5 11.9 17.1
Total: 15.1 16.9 -10.3 2.4 3.4 82.1 76.4 36.3 33.8 7.5 11.9 17.1
GRAND TOTAL: 219,745.3 210,796.7 4.2 11,625.7 4,092.0 100.4 107.5 450,940.7 443,920.4 1.6 4.3 1.5
Global Reinsurers By Country
* Rating = Financial strength ratings of core operating entities of the groups
N.A. = Not available
N.M. = Not meaningful
NR = Not rated
Note: Exchange rates may slightly differ from previous years’ GRH data due to alignment of foreign exchange rates with other S&P Global surveys
1. Validus Reinsurance Ltd.: Information provided previously came from the reinsurance segment of the former Validus Holdings, Ltd. Balances above are taken from the GAAP financial statements for Validus Reinsurance, Ltd.
2. Everest Reinsurance (Bermuda) Ltd. & Everest Reinsurance Co.: 2017 Adjusted Shareholders’ Funds have been restated to reflect Average Adjusted Shareholders’ Equity.
3. International General Insurance Co. Ltd.: Pretax Operating Income 2017 has been restated.
4. Hiscox Insurance Co. (Bermuda) Ltd.: Premium shown relates directly to property business and the total adjusted shareholder fund is shown at a total Hiscox Insurance Company (Bermuda) level.
5. Allianz SE: Figures are based on IFRS results (only external business). Pretax Operating Income excludes administrative expenses.
Net Reinsurance Premiums Written (Mil. $)
Pretax Operating Income (Mil. $)
Combined Ratio (%)
Total Adjusted Shareholders’ Funds (Mil. $)
Return on Revenue (%)
Rating as of 02 August, 2019
Footnotes 2018 2017 Change % 2018 2017 2018 2017 2018 2017 Change % 2018 2017
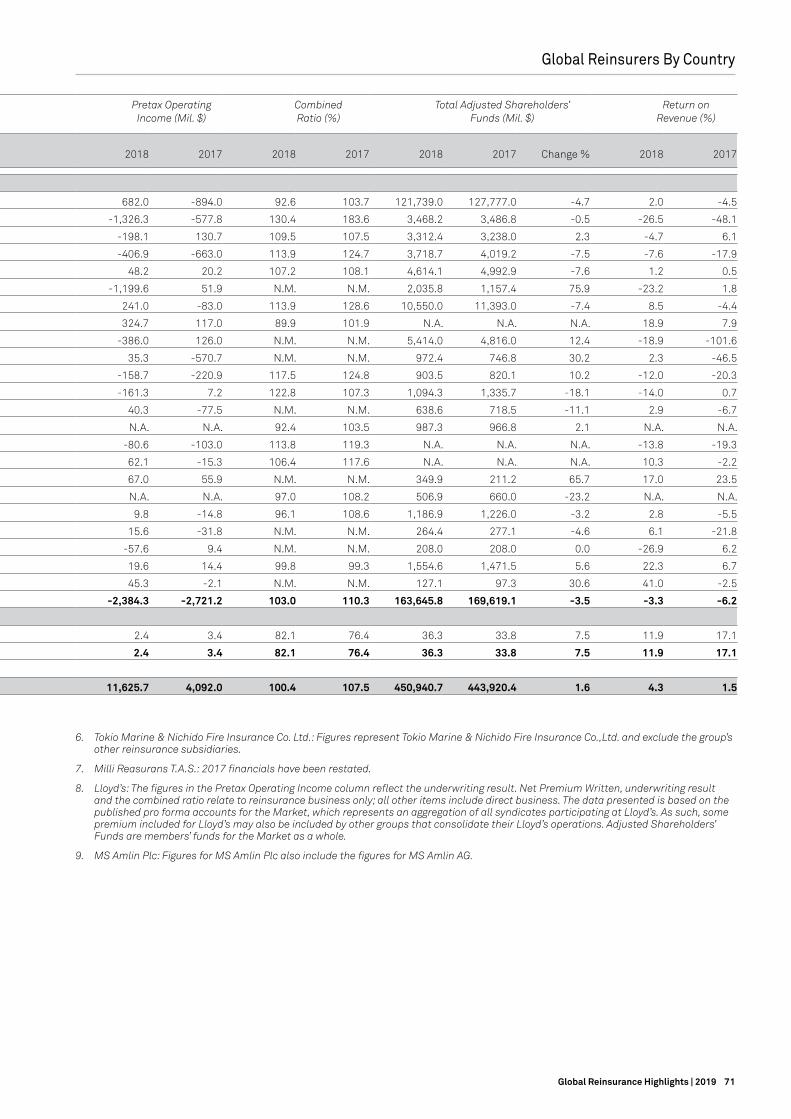
71Global Reinsurance Highlights | 2019
Global Reinsurers By Country
6. Tokio Marine & Nichido Fire Insurance Co. Ltd.: Figures represent Tokio Marine & Nichido Fire Insurance Co.,Ltd. and exclude the group’s other reinsurance subsidiaries.
7. Milli Reasurans T.A.S.: 2017 financials have been restated.
8. Lloyd’s: The figures in the Pretax Operating Income column reflect the underwriting result. Net Premium Written, underwriting result and the combined ratio relate to reinsurance business only; all other items include direct business. The data presented is based on the published pro forma accounts for the Market, which represents an aggregation of all syndicates participating at Lloyd’s. As such, some premium included for Lloyd’s may also be included by other groups that consolidate their Lloyd’s operations. Adjusted Shareholders’ Funds are members’ funds for the Market as a whole.
9. MS Amlin Plc: Figures for MS Amlin Plc also include the figures for MS Amlin AG.
United States
AA+ Stable National Indemnity Co. 25,986.0 21,432.0 21.2 682.0 -894.0 92.6 103.7 121,739.0 127,777.0 -4.7 2.0 -4.5
A+ Stable Everest Reinsurance Co. 2 5,052.3 1,741.2 190.2 -1,326.3 -577.8 130.4 183.6 3,468.2 3,486.8 -0.5 -26.5 -48.1
AA- Stable Swiss Reinsurance America Corp. 4,099.9 4,594.5 -10.8 -198.1 130.7 109.5 107.5 3,312.4 3,238.0 2.3 -4.7 6.1
AA- Stable Munich Reinsurance America, Inc. 4,083.4 2,985.0 36.8 -406.9 -663.0 113.9 124.7 3,718.7 4,019.2 -7.5 -7.6 -17.9
A+ Stable Transatlantic Reinsurance Co. 3,579.8 3,479.3 2.9 48.2 20.2 107.2 108.1 4,614.1 4,992.9 -7.6 1.2 0.5
AA- Stable Swiss Re Life & Health America Inc. 2,219.8 4,034.2 -45.0 -1,199.6 51.9 N.M. N.M. 2,035.8 1,157.4 75.9 -23.2 1.8
AA+ Stable General Reinsurance Corp. 2,216.0 1,428.0 55.2 241.0 -83.0 113.9 128.6 10,550.0 11,393.0 -7.4 8.5 -4.4
A- Positive Odyssey Re Holdings Corp.* 1,595.3 1,411.0 13.1 324.7 117.0 89.9 101.9 N.A. N.A. N.A. 18.9 7.9
AA+ Stable Berkshire Hathaway Life Insurance Co. of NE 1,461.0 -604.0 N.M. -386.0 126.0 N.M. N.M. 5,414.0 4,816.0 12.4 -18.9 -101.6
AA+ Stable General Re Life Corp. 1,418.4 1,093.4 29.7 35.3 -570.7 N.M. N.M. 972.4 746.8 30.2 2.3 -46.5
AA- Stable SCOR Reinsurance Co. 1,324.9 1,158.0 14.4 -158.7 -220.9 117.5 124.8 903.5 820.1 10.2 -12.0 -20.3
A+ Stable Partner Reinsurance Co. of U.S. 1,306.4 929.3 40.6 -161.3 7.2 122.8 107.3 1,094.3 1,335.7 -18.1 -14.0 0.7
AA- Stable Munich American Reassurance Co. 1,111.4 849.3 30.9 40.3 -77.5 N.M. N.M. 638.6 718.5 -11.1 2.9 -6.7
A+ Stable AXIS Reinsurance Company 588.3 1,005.3 -41.5 N.A. N.A. 92.4 103.5 987.3 966.8 2.1 N.A. N.A.
A Stable Markel Global Reinsurance Company 542.9 559.7 -3.0 -80.6 -103.0 113.8 119.3 N.A. N.A. N.A. -13.8 -19.3
A+ Stable W.R. Berkley Corporation* 480.4 544.6 -11.8 62.1 -15.3 106.4 117.6 N.A. N.A. N.A. 10.3 -2.2
AA- Stable Hannover Life Reassurance Co. of America 410.6 232.7 76.4 67.0 55.9 N.M. N.M. 349.9 211.2 65.7 17.0 23.5
A+ Stable Renaissance Reinsurance U.S. Inc. 359.9 351.8 2.3 N.A. N.A. 97.0 108.2 506.9 660.0 -23.2 N.A. N.A.
A Stable The Navigators Group, Inc.* 287.7 214.2 34.3 9.8 -14.8 96.1 108.6 1,186.9 1,226.0 -3.2 2.8 -5.5
AA- Stable SCOR Global Life USA Reinsurance Company 232.8 133.8 74.0 15.6 -31.8 N.M. N.M. 264.4 277.1 -4.6 6.1 -21.8
AA- Stable SCOR Global Life Americas 196.5 130.5 50.6 -57.6 9.4 N.M. N.M. 208.0 208.0 0.0 -26.9 6.2
A+ Stable Arch Reinsurance Co. 167.1 190.8 -12.4 19.6 14.4 99.8 99.3 1,554.6 1,471.5 5.6 22.3 6.7
AA- Stable SCOR GLOBAL LIFE Reinsurance Company of Delaware 103.7 75.9 36.6 45.3 -2.1 N.M. N.M. 127.1 97.3 30.6 41.0 -2.5
Total: 58,824.5 47,970.5 22.6 -2,384.3 -2,721.2 103.0 110.3 163,645.8 169,619.1 -3.5 -3.3 -6.2
Vietnam
NR - PVI Reinsurance Company 15.1 16.9 -10.3 2.4 3.4 82.1 76.4 36.3 33.8 7.5 11.9 17.1
Total: 15.1 16.9 -10.3 2.4 3.4 82.1 76.4 36.3 33.8 7.5 11.9 17.1
GRAND TOTAL: 219,745.3 210,796.7 4.2 11,625.7 4,092.0 100.4 107.5 450,940.7 443,920.4 1.6 4.3 1.5
Net Reinsurance Premiums Written (Mil. $)
Pretax Operating Income (Mil. $)
Combined Ratio (%)
Total Adjusted Shareholders’ Funds (Mil. $)
Return on Revenue (%)
Rating as of 02 August, 2019
Footnotes 2018 2017 Change % 2018 2017 2018 2017 2018 2017 Change % 2018 2017

72 Global Reinsurance Highlights | 2019
An S&P Global Ratings insurer financial strength rating is a forward-looking opinion about the financial security characterist ics of an insurance organization with respect to its ability to pay under its insurance policies and contracts in accordance with their terms. Insurer financial strength ratings are also assigned to health maintenance organizations and similar health plans with respect to their ability to pay under their policies and contracts in accordance with their terms.
Insurer Financial Strength Ratings
Ratings Definitions
This opinion is not specific to any particular policy or contract, nor does it address the suitability of a particular policy or contract for a specific purpose or purchaser. Furthermore, the opinion does not take into account deductibles, surrender or cancellation penalties, timeliness of payment, nor the likelihood of the use of a defense such as fraud to deny claims.Insurer financial strength ratings do not refer to an organization’s ability to meet nonpolicy (i.e., debt) obligations.
Assignment of ratings to debt issued by insurers or to debt issues that are fully or partially supported by insurance policies, contracts, or guarantees is a separate process from the determination of insurer financial strength ratings, and it follows procedures consistent with those used to assign an issue credit rating. An insurer financial strength rating is not a recommendation to purchase or discontinue any policy or contract issued by an insurer.
Category Definition*
AAA An insurer rated ‘AAA’ has extremely strong financial security characteristics. ‘AAA’ is the highest insurer financial strength rating assigned by S&P Global Ratings.
AA An insurer rated ‘AA’ has very strong financial security characteristics, differing only slightly from those rated higher.
A An insurer rated ‘A’ has strong financial security characteristics but is somewhat more likely to be affected by adverse business conditions than are insurers with higher ratings.
BBB An insurer rated ‘BBB’ has good financial security characteristics but is more likely to be affected by adverse business conditions than are higher-rated insurers.
BB, B, CCC, and CC An insurer rated ‘BB’ or lower is regarded as having vulnerable characteristics that may outweigh its strengths. ‘BB’ indicates the least degree of vulnerability within the range and ‘CC’ the highest.
BB An insurer rated ‘BB’ has marginal financial security characteristics. Positive attributes exist, but adverse business conditions could lead to insufficient ability to meet financial commitments.
B An insurer rated ‘B’ has weak financial security characteristics. Adverse business conditions will likely impair its ability to meet financial commitments.
CCC An insurer rated ‘CCC’ has very weak financial security characteristics and is dependent on favorable business conditions to meet financial commitments.
CC An insurer rated ‘CC’ has extremely weak financial security characteristics and is likely not to meet some of its financial commitments.
SD and D An insurer rated ‘SD’ (selective default) or ‘D’ is in default on one or more of its insurance policy obligations. The ‘D’ rating also will be used upon the filing of a bankruptcy petition or the taking of similar action if payments on a policy obligation are at risk. A ‘D’ rating is assigned when S&P Global Ratings believes that the default will be a general default and that the obligor will fail to pay substantially all of its obligations in full in accordance with the policy terms.
*Ratings from ‘AA’ to ‘CCC’ may be modified by the addition of a plus (+) or minus (-) sign to show relative standing within the rating categories.
73Global Reinsurance Highlights | 2019
An S&P Global Ratings insurer financial enhancement rating is a forward-looking opinion about the creditworthiness of an insurer with respect to insurance policies or other financial obligations that are predominantly used as credit enhancement and/or financial guarantees. When assigning an insurer financial enhancement rating, S&P Global Ratings’ analysis focuses on capital, liquidity, and company commitment necessary to support a credit enhancement or financial guaranty business.
Insurer financial enhancement ratings are based, in varying degrees, on S&P Global Ratings’ analysis of the following considerations:• The likelihood of payment: capacity
and willingness of the insurer to meet its financial commitments on an obligation in accordance with the terms of the obligation;
• The nature and provisions of the financial obligation; and
• The protection afforded by, and relative position of, the financial
obligation in the event of a bankruptcy, reorganization, or other arrangement under the laws of bankruptcy and other laws affecting creditors’ rights.
Insurer Financial Enhancement Ratings
Ratings Definitions
Category Definition*
AAAAn insurer rated ‘AAA’ has extremely strong capacity to meet its financial commitments. ‘AAA’ is the highest insurer financial enhancement rating assigned by S&P Global Ratings.
AAAn insurer rated ‘AA’ has very strong capacity to meet its financial commitments. It differs from the highest-rated insurers to only a small degree.
AAn insurer rated ‘A’ has strong capacity to meet its financial commitments but is somewhat more susceptible to the adverse effects of changes in circumstances and economic conditions than insurers in higher-rated categories.
BBBAn insurer rated ‘BBB’ has adequate capacity to meet its financial commitments. However, adverse economic conditions or changing circumstances are more likely to weaken the insurer’s capacity to meet its financial commitments.
BB, B, CCC, and CCInsurers rated ‘BB’, ‘B’, ‘CCC’, and ‘CC’ are regarded as having significant speculative characteristics. ‘BB’ indicates the least degree of speculation and ‘CC’ the highest. While such insurers will likely have some quality and protective characteristics, these may be outweighed by large uncertainties or major exposure to adverse conditions.
BBAn insurer rated ‘BB’ is less vulnerable in the near term than other lower-rated insurers. However, it faces major ongoing uncertainties and exposure to adverse business, financial, or economic conditions that could lead to the insurer’s inadequate capacity to meet its financial commitments.
BAn insurer rated ‘B’ is more vulnerable than the insurers rated ‘BB’, but the insurer currently has the capacity to meet its financial commitments. Adverse business, financial, or economic conditions will likely impair the insurer’s capacity or willingness to meet its financial commitments.
CCCAn insurer rated ‘CCC’ is currently vulnerable and is dependent upon favorable business, financial, and economic conditions to meet its financial commitments.
CC An insurer rated ‘CC’ is currently highly vulnerable.
SD and D
An insurer rated ‘SD’ (selective default) or ‘D’ has failed to pay one or more of its financial obligations when it came due. A ‘D’ rating is assigned when S&P Global Ratings believes that the default will be a general default and that the obligor will fail to pay all or substantially all of its obligations as they come due. An ‘SD’ rating is assigned when S&P Global Ratings believes that the obligor has selectively defaulted on a specific issue or class of obligations but it will continue to meet its payment obligations on other issues or classes of obligations. An ‘SD’ or ‘D’ rating can include the completion of a distressed exchange offer.
*Ratings from ‘AA’ to ‘CCC’ may be modified by the addition of a plus (+) or minus (-) sign to show relative standing within the rating categories.

74 Global Reinsurance Highlights | 2019
Addresses
S&P Global HQ - EMEA 20 Canada SquareCanary WharfLondon E14 5LH(+44) 20-7176-3800
S&P Global HQ – North America55 Water StreetNew York, NY 10041(+1) 212-438-1000
S&P Global HQ – Asia Pacific12 Marina Boulevard Marina Bay Financial Centre, Tower 3, L23 Singapore 018982 (+65) 6530-6447
For a complete list of all our office locations, please visit: https://www.spglobal.com/who-we-are/our-company/contact-us
Intelligent InsurerKingfisher House21-23 Elmfield RoadBromleyBR11LT United Kingdom Email: [email protected]


Millî Reasürans T.A.Ş.Head Office
Maçka Cad. No:35 Şişli 34367 İstanbul, TURKEYP: +90 (212) 231 47 30 / [email protected]
Singapore Branch4 Battery Road #20-01 Bank of China SINGAPORE 049908
P: +65 6499 9340 / [email protected]
www.millire.com
Thanks to years of commitment, hardwork and our valued clients, Milli Re remains a preferred business partner for 90 years.