global reinsurance guide 2015 - intelligent insurer · pdf filesenior director, insurance ......
TRANSCRIPT

Global Reinsurance Guide 2015

Global Reinsurance Guide 2015
Global Reinsurance Guide 2015
Contents
Overview 1
2015 Outlook: Global Reinsurance 2
Special Reports 8
Global Reinsurance’s Shifting Landscape 10
Alternative Reinsurance 2014 Market Update 16
Reinsurer Mergers and Acquisitions 24
Asian Reinsurance Markets 28
Latin American Reinsurance Markets 34
Global Reinsurers’ Mid-Year 2014 Financial Results 40
Summary of Company Reports 48
Alleghany Corporation 50
Arch Capital Group Ltd 51
AXIS Capital Holdings, Ltd 52
Berkshire Hathaway Inc. 53
Hannover Rueck SE 54
Lloyd’s of London 55
Munich Reinsurance Company 56
Reinsurance Group of America, Inc. 57
RenaissanceRe Holdings Ltd. 58
SCOR S.E. 59
Swiss Reinsurance Company Ltd 60
Validus Holdings, Ltd. 61
XL Group plc 62
Global Reinsurance Guide 2015
For information on Fitch’s rating process please contact:
Europe/Middle East
Lucinda Jeffrey + 44 20 3530 1350 [email protected]
David Turner + 44 20 3530 1442 [email protected]
North America/Bermuda
Brad Istwan +1 312 368 3197 [email protected]
Greg Hiltebrand +1 312 368 5448 [email protected]
Asia
Wayne Li + 852 2263 9915 [email protected]
Additional information on Fitch’s ratings and research is available atwww.fitchratings.com
Contributors
Martyn Street Senior Director, Insurance +44 20 3530 1211 [email protected]
Brian Schneider Senior Director, Insurance +1 312 606 2321 [email protected]
Siew Wai Wan Senior Director, Insurance +65 6796 7217 [email protected]
Chris Waterman Managing Director, Insurance +44 20 3530 1168 [email protected]
Harish Gohil Managing Director, Insurance +44 20 3530 1257 [email protected]
Global Reinsurance Guide 20151
The fifth edition of Fitch Ratings’ 2015 Global ReinsuranceGuide provides reinsurance brokers, security committees and reinsurance investors with the latest research on the global reinsurance sector and views on the ratings in the agency’s universe of reinsurance coverage.
The 2015 Outlook: Global Reinsurance report discusses the key drivers behind the negative sector outlook that Fitch maintains, as well as outlining the conditions that could lead the agency to revise its rating outlook to negative from stable. The report details three key issues that are expected to pose a challenge to reinsurers during 2015:
1. Deterioration of pricing adequacy and terms and conditions;
2. Search for higher yields increases risk as low investment returns persist;
3. Structural change threatens to weaken traditional reinsurers’ competitive position.
The Global Reinsurance’s Shifting Landscape report discusses how the prevailing adverse conditions in the reinsurance market go beyond a normal cycle. The paper sets out in detail the factors that Fitch considers when seeking to identify those reinsurers that could be most vulnerable to adverse shifts in the reinsurance landscape.
The Alternative Reinsurance 2014 Market Update discusses the continued convergence of the traditional and alternative reinsurance markets, examining some of the factors that continue to attract alternative forms of capital.
The Reinsurer Mergers and Acquisitions (M&A) report outlines the factors that support the agency’s expectations of greater M&A activity in the reinsurance market, including the increasing availability of alternative reinsurance, offset by continued dealimpediments.
The Asian Reinsurance Marketsexplorestheeffectsofsofteningpricing conditions across the region, as well as providing an update on how market growth is attracting foreign companies to establish operations within the region.
The Latin American Reinsurance Markets report discusses growth trends across the region, as well as reinsurers’ performance, catastrophes losses and the evolving regulatory framework.
The Global Reinsurers’ Midyear 2014 Financial Results reportprovidesareviewofthefinancialresultsandperformancehighlights released during the half-year 2014 reporting period by Fitch’s monitored universe of reinsurers.
Thefinalsectionofthereportcontainsthemostrecentresearchon a selected group of reinsurers that are rated by Fitch. The summary credit reports provide details on key rating drivers and rating sensitivities for each reinsurer.
Overview
Global Reinsurance Guide 2015 2
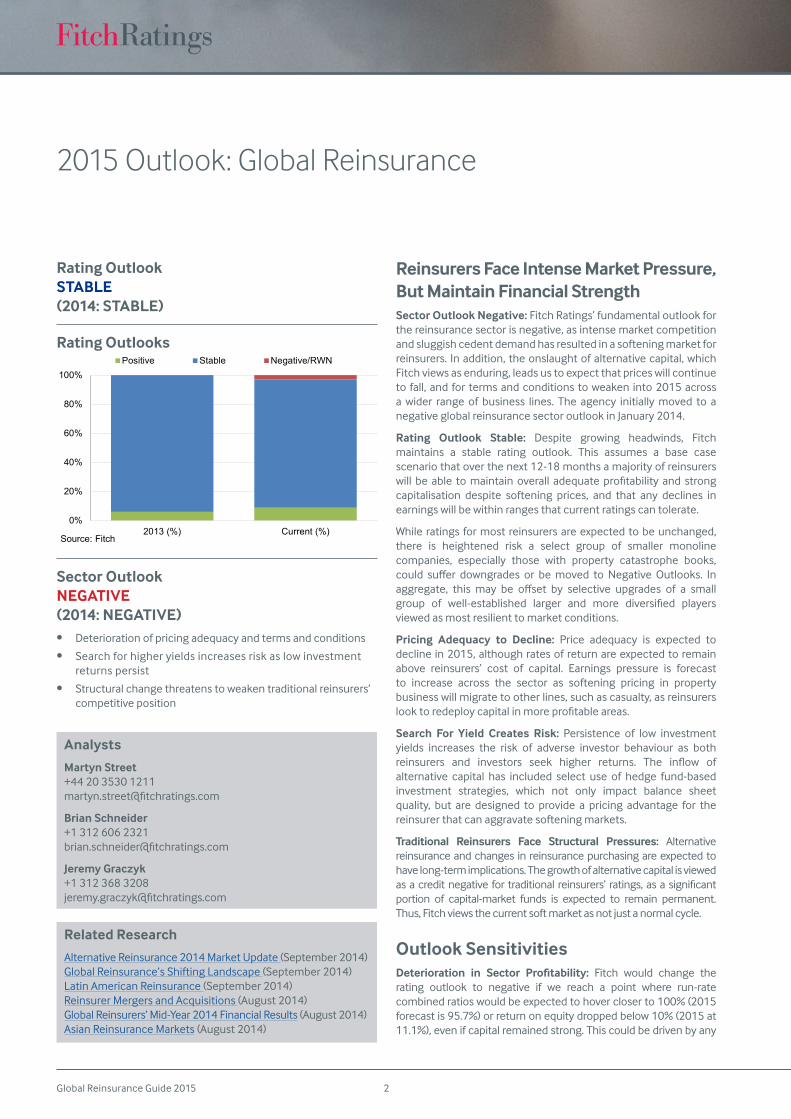
Reinsurers Face Intense Market Pressure, But Maintain Financial Strength Sector Outlook Negative: Fitch Ratings’ fundamental outlook for the reinsurance sector is negative, as intense market competition and sluggish cedent demand has resulted in a softening market for reinsurers. In addition, the onslaught of alternative capital, which Fitch views as enduring, leads us to expect that prices will continue to fall, and for terms and conditions to weaken into 2015 across a wider range of business lines. The agency initially moved to a negative global reinsurance sector outlook in January 2014.
Rating Outlook Stable: Despite growing headwinds, Fitch maintains a stable rating outlook. This assumes a base case scenario that over the next 12-18 months a majority of reinsurers will be able tomaintainoverall adequateprofitability and strongcapitalisation despite softening prices, and that any declines in earnings will be within ranges that current ratings can tolerate.
While ratings for most reinsurers are expected to be unchanged, there is heightened risk a select group of smaller monoline companies, especially those with property catastrophe books, could suffer downgrades or bemoved to Negative Outlooks. Inaggregate, this may be offset by selective upgrades of a smallgroup of well-established larger and more diversified playersviewed as most resilient to market conditions.
Pricing Adequacy to Decline: Price adequacy is expected to decline in 2015, although rates of return are expected to remain above reinsurers’ cost of capital. Earnings pressure is forecast to increase across the sector as softening pricing in property business will migrate to other lines, such as casualty, as reinsurers looktoredeploycapitalinmoreprofitableareas.
Search For Yield Creates Risk: Persistence of low investment yields increases the risk of adverse investor behaviour as both reinsurers and investors seek higher returns. The inflow ofalternative capital has included select use of hedge fund-based investment strategies, which not only impact balance sheet quality, but are designed to provide a pricing advantage for the reinsurer that can aggravate softening markets.
Traditional Reinsurers Face Structural Pressures: Alternative reinsurance and changes in reinsurance purchasing are expected to have long-term implications. The growth of alternative capital is viewed asacreditnegative for traditional reinsurers’ ratings,asasignificantportion of capital-market funds is expected to remain permanent. Thus, Fitch views the current soft market as not just a normal cycle.
Outlook SensitivitiesDeterioration in Sector Profitability: Fitch would change the rating outlook to negative if we reach a point where run-rate combined ratios would be expected to hover closer to 100% (2015 forecast is 95.7%) or return on equity dropped below 10% (2015 at 11.1%), even if capital remained strong. This could be driven by any
0%
20%
40%
60%
80%
100%
2013 (%) Current (%)
Positive Stable Negative/RWN
Source: Fitch
Rating Outlooks
Rating Outlook STABLE (2014: STABLE)
Sector Outlook NEGATIVE (2014: NEGATIVE)• Deterioration of pricing adequacy and terms and conditions
• Search for higher yields increases risk as low investment returns persist
• Structural change threatens to weaken traditional reinsurers’ competitive position
Analysts
Martyn Street +44 20 3530 1211 [email protected]
Brian Schneider +1 312 606 2321 [email protected]
Jeremy Graczyk +1 312 368 3208 [email protected]
2015 Outlook: Global Reinsurance
Related Research
Alternative Reinsurance 2014 Market Update (September 2014) Global Reinsurance’s Shifting Landscape (September 2014)Latin American Reinsurance (September 2014)Reinsurer Mergers and Acquisitions (August 2014)Global Reinsurers’ Mid-Year 2014 Financial Results (August 2014)Asian Reinsurance Markets (August 2014)
Global Reinsurance Guide 20153
combination of softening pricing, low investment yields, unexpected shiftsinlosscosts,reservedeficiencies,orafailureofmarketpricingto adequately respond to a sizable industry loss event(s).
Catastrophic Loss With Interest Spike: AsignificantcatastrophiclosseventofUSD70bnormore,coupledwithsignificantunrealisedinvestment losses from an abrupt jump in interest rates of 300bp or more also could threaten the sector’s stable rating outlook. Such a scenario would leave balance sheets temporarily more exposed to adverse events and is particularly concerning if reinsurers do not havesufficientliquiditytopayclaimsandneedtosellinvestmentsat a loss and/or raise new capital at a higher cost.
Key Issues
Sector Outlook Negative, Rating Outlook StableThe absence of large losses, intense market competition and sluggish demand from reinsurance buyers has resulted in a softening market for reinsurers, characterised by falling prices and, less visibly, weakening terms and conditions. The high level of surplus capital held by reinsurers within the sector leads Fitch to expect that soft market conditions will continue, although the rate and extent of further price deterioration is unclear. This expectation, coupled with previous pricing reductions, is the key factor that led the agency to assign a negative fundamental sector outlook in January 2014.
Fitch maintains a stable outlook for the ratings of the reinsurance sector. Fitch believes most reinsurers will maintain both profitability and balance sheet strength over the next 12-18 months commensurate with current ratings. There is an increasing risk, however, that a select group of smaller reinsurers, especially those with more heavily exposed property books, could experiencedowngradesand/ormovementstoNegativeOutlooks.Inaggregate,suchnegativeactionscouldbeoffsetbyupgradesofa select group of larger, more diverse players seen as most resilient to market conditions. Fitch’s recently upgraded reinsurers include Hannover Re, Lloyd’s and XL, with Swiss Re, SCOR and Arch Capital currently on a Positive Outlook.
The agency’s central scenario entails a further strengthening of thesector’scapital,drivenbysolid,althoughdeclining,profitabilityin 2014/2015, as softening pricing continues, but remains adequate overall and in line with loss cost trends. This follows favourable results in 2013, as catastrophe losses have been manageable. Throughout 2015, the agency anticipates low but stable investment yields and reduced contributions from prior-year reserve surpluses.
Ironically, the favourable underwriting results posted by the industry since the record catastrophe loss year in 2011 has fostered the current challenging reinsurance environment. Reinsurers’ profitableresultsareattractingmorecapitaltothesector,whichhas created excess reinsurance underwriting capacity, leading to price competition and falling reinsurance rates. However, recent performance reveals that pricing and competition need
to deteriorate significantly more before profit erosion becomesuntenable, as reinsurers in aggregate posted combined ratios below 90% and returns on equity (ROE) of around 12% in the last few years.
Rating Outlook Could Move Negative Under More Severe ConditionsIf a more stressed scenario emerged, Fitch would expect to move its rating outlook to negative. Such a scenario could involve either ashocktocapitaloranenduringdeclineinprofits,evenifbalancesheets stayed strong, or an unanticipated and severe shock to capital.
Profitability pressure would likely be driven by an accelerationof current competitive market conditions, with continued double-digit price softening in property lines and rate declines spreading wider across most casualty business. At the same time, extraordinary low investment yields continuing into the future would limit investment returns as a source of earnings. An unexpected jump in loss costs at a greater rate than earned premium increases would more quickly result in deteriorating underwritingprofitability,particularlyifitledtotheemergenceofreservedeficiencies.
Ashocktocapitalcouldcomefromasignificantcatastrophicordisaster loss event or series of events, either natural or man-made. This would be particularly problematic if it was a non-modelled risk or unexpected loss event, as it would not have been priced into currentbusiness.Totheextentthatloss-affectedpriceincreasesfailed to respond adequately to the event, capital would remain depressed and reinsurers would be forced to reduce expectations of future payback.
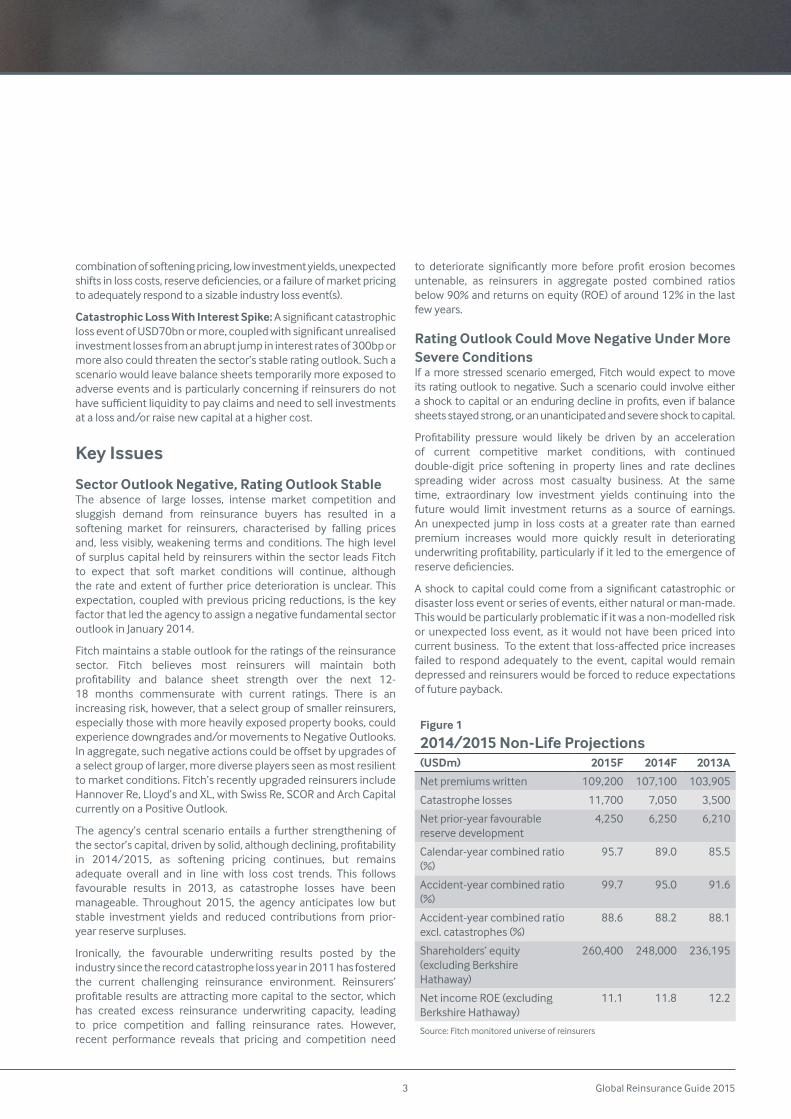
Figure 1
2014/2015 Non-Life Projections(USDm) 2015F 2014F 2013A
Netpremiumswritten 109,200 107,100 103,905
Catastrophe losses 11,700 7,050 3,500
Netprior-yearfavourablereserve development
4,250 6,250 6,210
Calendar-year combined ratio (%)
95.7 89.0 85.5
Accident-year combined ratio (%)
99.7 95.0 91.6
Accident-year combined ratio excl. catastrophes (%)
88.6 88.2 88.1
Shareholders’ equity (excluding Berkshire Hathaway)
260,400 248,000 236,195
NetincomeROE(excludingBerkshire Hathaway)
11.1 11.8 12.2
Source: Fitch monitored universe of reinsurers
Global Reinsurance Guide 2015 4
A near-term spike in interest rates could also result in a capital decline from sizable unrealised investment losses. This would reduce near-term financial flexibility and overall liquidity in theevent that reinsurers need to pay out an increased level of claims. Fitch calculates that each 100bp increase in interest rates would result in an approximate 5% decline in the reinsurance sector’s stated shareholders’ equity.
Deterioration of Pricing Adequacy and Terms and ConditionsThe majority of Fitch’s rated reinsurers demonstrate a reasonable levelofdiversificationwithintheirportfolios,whichaffordssomeresilience to market conditions. In contrast, smaller size and scale canreduceareinsurer’sabilitytoinfluencepricesandtermsandconditions compared with larger players. It can also prove harder for smaller players to withdraw capacity from unattractive market segments, or achieve meaningful diversification into new lines,should this be required. Accordingly, Fitch views small mono-line property catastrophe reinsurers as most vulnerable to a protracted period of market price softening (see Global Reinsurance’s Shifting Landscape, published 3 September 2014, for details).
In the absence of a major loss event, pricing and terms and conditions for the majority of business lines are expected to deteriorate during 2015, increasing earnings pressure across the sector. However, the price adequacy of written business, which usually considers a rate of return above a company’s cost of capital, is expected to remain positive for most classes.
The agency expects the sector to remain profitable in 2015,albeit at a reduced level compared with that forecast for 2014. A deterioration in the calendar-year combined ratio to 95.7% (2014F: 89%;2013A:85.5%)reflectsFitch’sexpectationthatcatastrophelosses will return to the long-term historical average (USD39bn), of which 30% would fall to reinsurers.
Fitch would consider any change in its expectations in which the calendar year combined ratio would move above 100% as a key driver of future, broad-based ratings downgrades, as such a fluctuation inperformanceonarun-ratebasiswouldfalloutsidecyclical norms embedded in most ratings.
Despite weakening earnings, industry capitalisation should remain strong. Given limited underwriting opportunities, Fitch expects annual shareholders’ equity growth of around 5% in the near term as reinsurers return the majority of earnings to shareholders through share repurchases and dividends. These overall results translate into a declining net income ROE of 11.1% in 2015, down from 11.8% forecast for 2014 and 12.2% actual in 2013, as both underwriting and investment results are expected to remain under pressure. Fitch would view an ROE below 10% as signaling broad-based downgrade pressure.
Fitch’s base case also assumes that reserve development will remain favourable in 2014 and 2015, although the level of surplus will deteriorate from 6% of earned premiums in 2014 to 4% in 2015. The agency believes that many property-focused reinsurers havebenefitted from2014 reserve releasesbeing supportedbyfavourable development on loss provisions related to Hurricane Sandy in 2012. The lower claims costs arising from major losses since that event narrows the possible sources for reinsurers to make future releases.
While the continued growth of alternative capital is increasingly seen as a structural change within the property catastrophe reinsurance sector (see Alternative Reinsurance 2014 Market Update, to be published 8 September 2014), the agency views the occurrence of major loss activity as the main determinant of cyclical pricing conditions. In contrast to 2013 and 2014, there is agrowinglikelihoodthatthemostsignificantpricedeclinesintheearly 2015 renewals will occur across loss-free European and Asian property classes.
Theultimateoutcomeofrenewalswillbepartlyinfluencedbythevolume of underwriting capacity that is redeployed by reinsurers as theyreduceexposuretocertainNorthAmericanclasses.Drivenbyan exceptional combination of cyclical soft market and structural change, US property catastrophe rates have experienced steep declines in the last 18 months to a point where expected returns have fallen into high-single digits. On a risk-adjusted basis, this level is considered as inadequate by some reinsurers.
Many loss-free casualty reinsurance rates have softened through 2014 and the agency believes that this could extend into 2015. This pressure is being driven in part by increased competiveness in the casualty market as more reinsurers look to non-catastrophe linesforprofit.Theprofitmarginsofcasualtyclassesareviewedasincreasingly attractive by many reinsurers, in contrast to property lines.Thefundamentaldifferencebetweenpropertyandcasualtyrisks, including longer-tail liabilities for the latter, are viewed as a hurdle for reinsurers that would otherwise be new entrants into the casualty market. The growth of alternative capital within the casualty sector is also expected to be slower than the property market, reflecting reduced investor appetite for longer durationrisks that are less easily modelled.
Figure 2
Recent Reinsurance Renewal Pricing TrendsRenewal season Developments
June/July 2014
U.S.PropertyLossAffected:Flattodown5%. U.S.PropertyNonlossAffected:Down5%to15%. FloridaPropertyNonlossAffected:Down15%to25%. CasualtyExcessofLossNoLossEmergence:Down5% to 20%.
January 2014
U.S.PropertyLossAffected:Down10%toup5%. U.S.NonlossAffected:Down10%to25%.InternationalPropertyLossAffected:FlattoUp10%. InternationalPropertyNonlossAffected:Down10%to 15%.
June/July 2013
U.S.PropertyLossAffected:Down5%toup5%. U.S.PropertyNonlossAffected:Down10%to20%. FloridaPropertyNonlossAffected:Down15%to25%. CasualtyNoLossEmergence:Flattodeclining.
January 2013
U.S.WindProgramsLossAffected:Up10%. U.S.NonlossAffected:Flattodown5%. Marine: Increases up to 30%. International Property: Flat to down 5%.
Source: Company and broker reports
Global Reinsurance Guide 20155
Search for Higher Yields Increases Risk as Low Returns Persist The persistence of low investment yields increases the risk of the reinsurance sector being exposed to adverse investor behaviour, driven by a search for higher yields. Increasing the risk weighting of assets held within an investment portfolio, in a search of higher yield, is an option available to all (re)insurers. Unique to the reinsurancesectoraretheadverseconsequencesofcapitalflowingin as external investors, including pension and hedge funds, search for yield by investing in alternative reinsurance products such as catastrophe bonds.
Fitch views the ingress of alternative capital as posing a greater long-term threat to the reinsurance sector because of the potentially permanent erosion of profit margins on historicallyprofitable products. The agency considers that a significantproportion of these funds will be a permanent presence within the reinsurance sector, due to the portfolio diversification thatcatastrophe risk provides for investors.
Fitch expects low interest rates to exert earnings pressure for all reinsurers during 2015. While long-term interest rates for several developed countries, including the US and UK, are forecast to rise next year, their absolute level is forecast to remain below the historical long-term average. Subsequently, reinvestment rates for reinsurerswithlongerdurationfixedincomeportfoliosarelikelytobe lower than for maturing instruments.
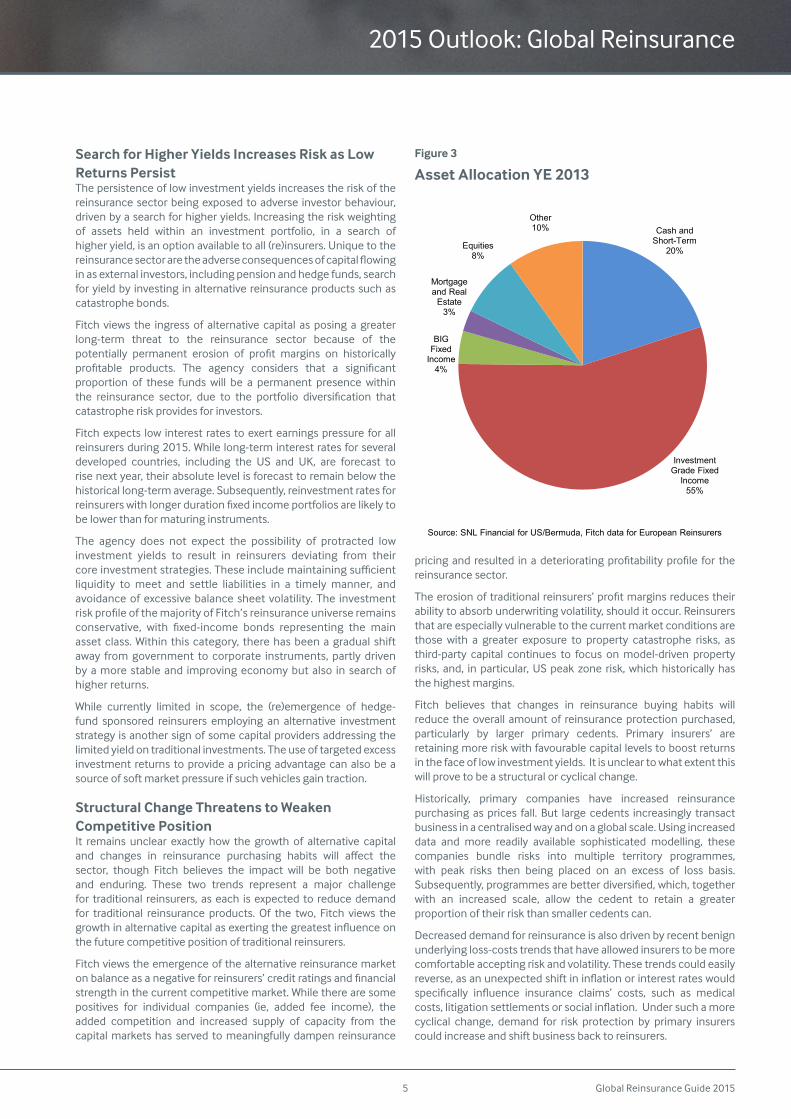
The agency does not expect the possibility of protracted low investment yields to result in reinsurers deviating from their coreinvestmentstrategies.Theseincludemaintainingsufficientliquidity to meet and settle liabilities in a timely manner, and avoidance of excessive balance sheet volatility. The investment riskprofileofthemajorityofFitch’sreinsuranceuniverseremainsconservative, with fixed-income bonds representing the mainasset class. Within this category, there has been a gradual shift away from government to corporate instruments, partly driven by a more stable and improving economy but also in search of higher returns.
While currently limited in scope, the (re)emergence of hedge-fund sponsored reinsurers employing an alternative investment strategy is another sign of some capital providers addressing the limited yield on traditional investments. The use of targeted excess investment returns to provide a pricing advantage can also be a source of soft market pressure if such vehicles gain traction.
Structural Change Threatens to Weaken Competitive PositionIt remains unclear exactly how the growth of alternative capital and changes in reinsurance purchasing habits will affect thesector, though Fitch believes the impact will be both negative and enduring. These two trends represent a major challenge for traditional reinsurers, as each is expected to reduce demand for traditional reinsurance products. Of the two, Fitch views the growthinalternativecapitalasexertingthegreatestinfluenceonthe future competitive position of traditional reinsurers.
Fitch views the emergence of the alternative reinsurance market onbalanceasanegativeforreinsurers’creditratingsandfinancialstrength in the current competitive market. While there are some positives for individual companies (ie, added fee income), the added competition and increased supply of capacity from the capital markets has served to meaningfully dampen reinsurance
pricingand resulted inadeterioratingprofitabilityprofile for thereinsurance sector.
Theerosionoftraditionalreinsurers’profitmarginsreducestheirability to absorb underwriting volatility, should it occur. Reinsurers that are especially vulnerable to the current market conditions are those with a greater exposure to property catastrophe risks, as third-party capital continues to focus on model-driven property risks, and, in particular, US peak zone risk, which historically has the highest margins.
Fitch believes that changes in reinsurance buying habits will reduce the overall amount of reinsurance protection purchased, particularly by larger primary cedents. Primary insurers’ are retaining more risk with favourable capital levels to boost returns in the face of low investment yields. It is unclear to what extent this will prove to be a structural or cyclical change.
Historically, primary companies have increased reinsurance purchasing as prices fall. But large cedents increasingly transact business in a centralised way and on a global scale. Using increased data and more readily available sophisticated modelling, these companies bundle risks into multiple territory programmes, with peak risks then being placed on an excess of loss basis. Subsequently,programmesarebetterdiversified,which,togetherwith an increased scale, allow the cedent to retain a greater proportion of their risk than smaller cedents can.
Decreased demand for reinsurance is also driven by recent benign underlying loss-costs trends that have allowed insurers to be more comfortable accepting risk and volatility. These trends could easily reverse,asanunexpectedshiftininflationorinterestrateswouldspecifically influence insurance claims’ costs, such as medicalcosts,litigationsettlementsorsocialinflation.Undersuchamorecyclical change, demand for risk protection by primary insurers could increase and shift business back to reinsurers.
Figure 3
Asset Allocation YE 2013
Other10%
Source: SNL Financial for US/Bermuda, Fitch data for European Reinsurers
Cash and Short-Term
20%
Mortgage and Real
Estate3%
Investment Grade Fixed
Income55%
BIG Fixed
Income4%
Equities8%
2015 Outlook: Global Reinsurance
Global Reinsurance Guide 2015 6
-4-202468
101214
Ren
Re
(A+)
XL
(A+)
Pla
tinum
(N/R
)
Mon
tpel
ier (
A)
Sw
iss
Re
(A+p
)
AX
IS (A
+)
Par
tner
Re
(AA
-)
SC
OR
(A+p
)
Val
idus
(A)
Alli
ed W
orld
(A+)
Whi
te M
ount
. (A
)
Eve
rest
(N/R
)
AC
E (A
A)
Ber
kshi
re (A
A+)
Mun
ich
Re
(AA
-)
Asp
en (N
/R)
Alle
ghan
y (A
+)
End
uran
ce (N
/R)
Han
nove
r Re
(AA
-)
Arc
h (A
+p)
Fairf
ax (N
/R)
(%)
IFS ratings in parentheses. N/R - Not rated. p - positive outlookSource: Fitch, company reports
2014 Review: Non-Life Performance Profitable But DeterioratingNon-life reinsurers’ underwriting results slightly deteriorated in1H14butremainedprofitableascatastrophelossescontinuedtorunbelowtheaveragetrend.Theweakerresultsreflectpressureon reinsurance margins with premium rate declines, an increase in non-catastrophe property losses that hit several reinsurers, and a higher expense ratio from increased ceding commissions.
The deterioration is also due to a reduction in excess of loss property catastrophe business written by traditional reinsurers and an increase in casualty reinsurance. With pressure on excess of loss premium rates pushing prices down to inadequate levels, reinsurers are shifting into quota share. Quota share reinsurance business carries a higher, but less volatile, average loss ratio than excess of loss and property catastrophe business.
The group of reinsurers that Fitch tracks generated a calendar-year reinsurance combined ratio of 87.4% in 1H14, up from 85.9% in 1H13 and 85.5% in 2013. The group’s 1H14 results included favourable prior-accident-year reserve development that providedasix-pointbenefittothecalendar-yearcombinedratio.Theprofitableunderwritingresultsreflectcontinuedunderwritingdiscipline in the sector, as loss-cost trends on most lines of business are about in line with earned pricing trends. This will be imperative given the current competition in pricing that will test reinsurers’ underwriting discipline.
Non-lifereinsurersinaggregateachievedmarginalreinsurancenetpremiums written growth of approximately 2.6% from 1H13 (after adjusting for foreign-currency translations). This is largely due to flatordecliningpricesinbothpropertyandcasualtyreinsurancelines. Expansion into various specialty lines was partly offset bydeclines in property catastrophe reinsurance business as prices continue to drop, with increased competition from the growing alternative reinsurance market.
Shareholders’ equity grew 5.2% in 1H14 from year-end 2013. Solid earnings and unrealised gains on fixed-income securities drovetheincrease,partiallyoffsetbycontinuedsharerepurchasesanddividends, albeit at a lower level than in 1H13.
2014 Review: Life Premiums Grow; Profits RecoverThe group of life reinsurance operations monitored by Fitch reported a moderate increase in net premiums earned in 1H14 from a year earlier mainly due to foreign-currency appreciation. In US dollar terms, net premiums earned increased by 3.2% from 1H13aftertheeffectsofforeign-currencytranslation,andby0.9%holding the exchange rate constant.
The 1H14 pre-tax income of the life reinsurance operations tracked by Fitch increased by 27% in US dollar terms compared with a year earlier after several reinsurers ran across problems in group risk business in the Australian market in 2013. The group’s shareholders’ equity increased by 5.0% from year-end 2013 as thesereinsurersbenefitedfromhigherearnings,unrealizedbondgains, and foreign-currency exchange gains.
Figure 4
1H14 Non-Life Reinsurance Results(USDm) 1H14 1H13
Netpremiumswritten 47,093 45,074
Combined ratio (%) 87.4 85.9
Shareholders’ equity (including Berkshire Hathaway)
442,126 388,013
Note:Theaboveresultsincludedataonlyforthosecompaniesthathadreportedboth 1H14 and 1H13 results on a comparable basis at this report’s publication date. shareholders’ equity is organisation-wide equity and includes equity that supports operations other than non-life reinsurance operations Source: Individual company data
Figure 6
1H14 Life Reinsurance Results(USDm) 1H14 1H13
Netpremiumsearned 27,009 26,171
Pre-tax operating income 1,850 1,457
Source: Individual company data
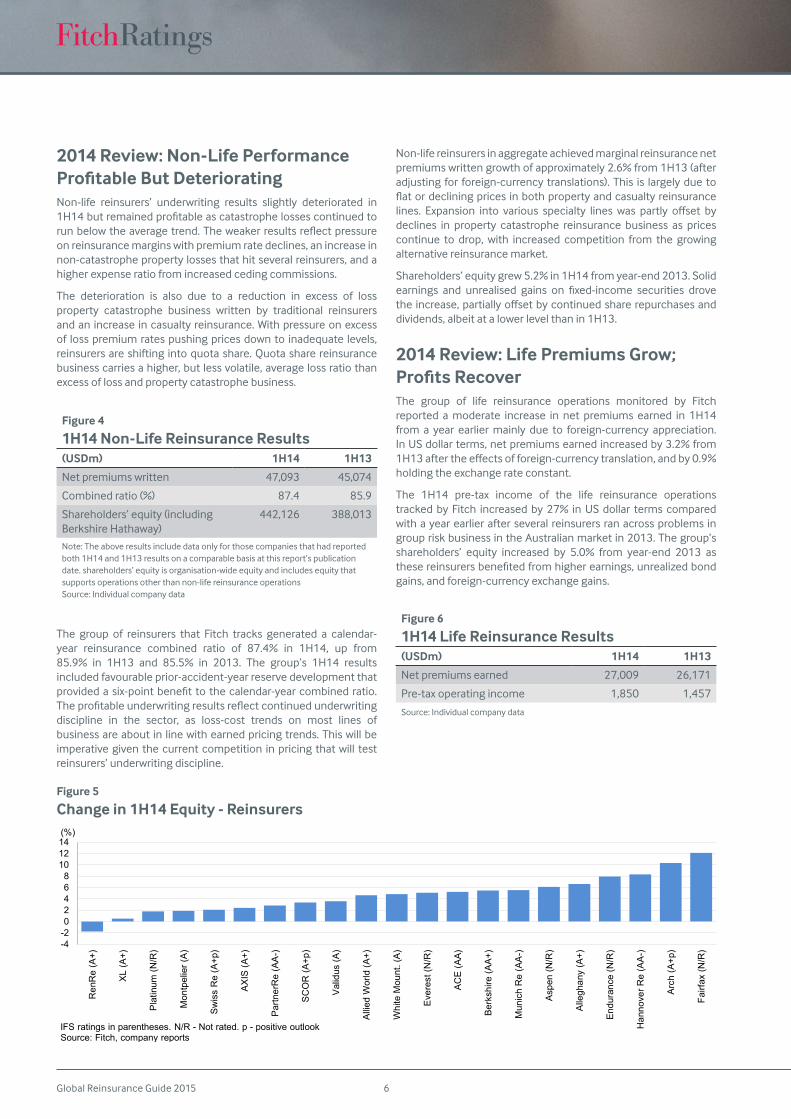
Figure 5
Change in 1H14 Equity - Reinsurers
Global Reinsurance Guide 20157
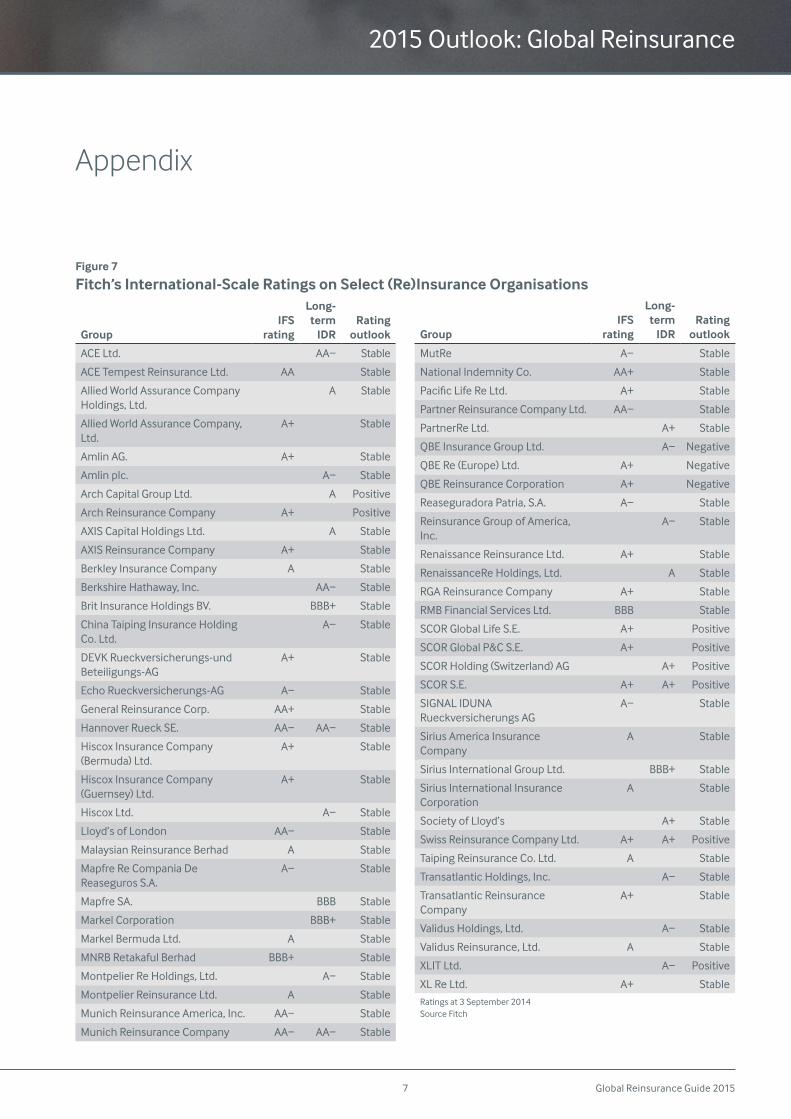
Figure 7
Fitch’s International-Scale Ratings on Select (Re)Insurance Organisations
GroupIFS
rating
Long-term
IDRRating
outlook
ACE Ltd. AA− Stable
ACE Tempest Reinsurance Ltd. AA Stable
Allied World Assurance Company Holdings, Ltd.
A Stable
Allied World Assurance Company, Ltd.
A+ Stable
Amlin AG. A+ Stable
Amlin plc. A− Stable
Arch Capital Group Ltd. A Positive
Arch Reinsurance Company A+ Positive
AXIS Capital Holdings Ltd. A Stable
AXIS Reinsurance Company A+ Stable
Berkley Insurance Company A Stable
Berkshire Hathaway, Inc. AA− Stable
Brit Insurance Holdings BV. BBB+ Stable
China Taiping Insurance Holding Co. Ltd.
A− Stable
DEVK Rueckversicherungs-und Beteiligungs-AG
A+ Stable
Echo Rueckversicherungs-AG A− Stable
General Reinsurance Corp. AA+ Stable
Hannover Rueck SE. AA− AA− Stable
Hiscox Insurance Company (Bermuda) Ltd.
A+ Stable
Hiscox Insurance Company (Guernsey) Ltd.
A+ Stable
Hiscox Ltd. A− Stable
Lloyd’s of London AA− Stable
Malaysian Reinsurance Berhad A Stable
Mapfre Re Compania De Reaseguros S.A.
A− Stable
Mapfre SA. BBB Stable
Markel Corporation BBB+ Stable
Markel Bermuda Ltd. A Stable
MNRBRetakafulBerhad BBB+ Stable
Montpelier Re Holdings, Ltd. A− Stable
Montpelier Reinsurance Ltd. A Stable
Munich Reinsurance America, Inc. AA− Stable
Munich Reinsurance Company AA− AA− Stable
GroupIFS
rating
Long-term
IDRRating
outlook
MutRe A− Stable
NationalIndemnityCo. AA+ Stable
PacificLifeReLtd. A+ Stable
Partner Reinsurance Company Ltd. AA− Stable
PartnerRe Ltd. A+ Stable
QBE Insurance Group Ltd. A− Negative
QBE Re (Europe) Ltd. A+ Negative
QBE Reinsurance Corporation A+ Negative
Reaseguradora Patria, S.A. A− Stable
Reinsurance Group of America, Inc.
A− Stable
Renaissance Reinsurance Ltd. A+ Stable
RenaissanceRe Holdings, Ltd. A Stable
RGA Reinsurance Company A+ Stable
RMB Financial Services Ltd. BBB Stable
SCOR Global Life S.E. A+ Positive
SCOR Global P&C S.E. A+ Positive
SCOR Holding (Switzerland) AG A+ Positive
SCOR S.E. A+ A+ Positive
SIGNALIDUNARueckversicherungs AG
A− Stable
Sirius America Insurance Company
A Stable
Sirius International Group Ltd. BBB+ Stable
Sirius International Insurance Corporation
A Stable
Society of Lloyd’s A+ Stable
Swiss Reinsurance Company Ltd. A+ A+ Positive
Taiping Reinsurance Co. Ltd. A Stable
Transatlantic Holdings, Inc. A− Stable
Transatlantic Reinsurance Company
A+ Stable
Validus Holdings, Ltd. A− Stable
Validus Reinsurance, Ltd. A Stable
XLIT Ltd. A− Positive
XL Re Ltd. A+ Stable
Ratings at 3 September 2014 Source Fitch
Appendix
2015 Outlook: Global Reinsurance

Global Reinsurance Guide 2015 8
Special Reports

Global Reinsurance Guide 20159
Global Reinsurance Guide 2015 10
Global Reinsurance’s Shifting Landscape
Making Sense of Soft Markets and Structural ChangeMoving Beyond a Normal Cycle: Fitch Ratings views the prevailing adverse reinsurance macro operating environment as extending beyond what would be considered a normal soft market cycle. This is due mainly to the growth in alternative capital. This report sets out in detail the factors that the agency considers when seeking to identify those reinsurers that could be most vulnerable to these adverse shifts in the reinsurance landscape. It also discusses what Fitch believes to be driving these changes.
Analysis Extends Beyond Reported Results: Despite industry difficulties, recently reported financial data still presents a solidfinancialpictureacrosstheglobalreinsurancesector,underscoredby strong capitalisation and near record profitability. This isinconsistent with market trends, and highlights a limitation of historical results. Thus, for our analysis to be predictive, it needs to be enhanced by a qualitative assessment to help determine an individual reinsurer’s vulnerability to changes in market conditions.
Qualitative Early Warning Indicators: Significantdiversificationor shifts into new business lines or geographic markets, and growth at a pace above market averages are among the factors that Fitch will monitor closely in the current market. These are typically a sign of aggressiveness through either a lack of discipline or lack of expertise.
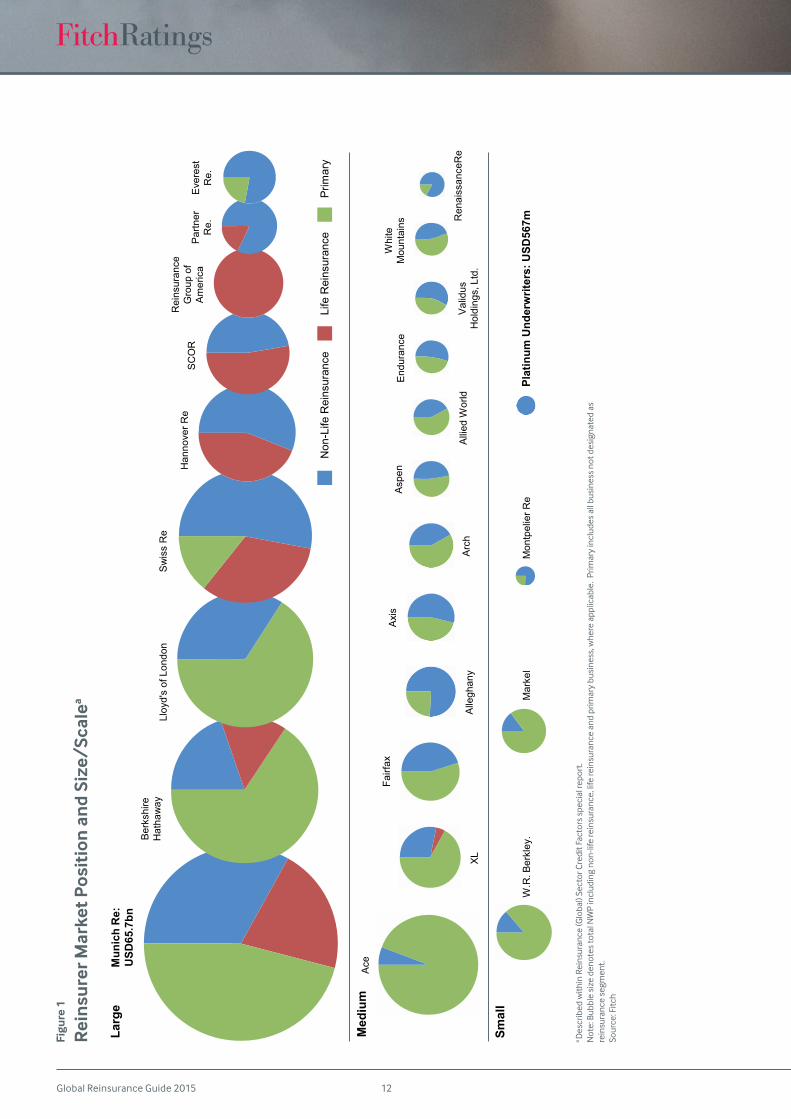
Franchise Value Aids Resilience: Strong market positioning, scale and diversity (see Figure 1), are viewed by Fitch as key qualities that can provide resilience against falling reinsurance prices and increased competition. This implies that larger and more diverse players will be best positioned in the changing landscape. However,
in select cases, true specialist product knowledge and technical expertiseareofferingsthatarelesssize-dependent,butarestronglysoughtbysomereinsurancebuyers,andcanalsoofferresilience.
Soft Market Versus Structural Change: An assessment of the impact of a changing reinsurance landscape needs to distinguish betweenshort-termcyclicalfluctuationsandlonger-termstructuraltrends. Cyclical price reductions will always be part of the natural underwriting cycle. However, the growth and convergence of alternative capital, coupled with changes in reinsurance purchasing habits, represent what Fitch views as a longer-term and more permanent change in reinsurance that will be difficult for somereinsurers to adapt to.
Perfect Storm for US Property Catastrophe: Current pricing deterioration is viewed as the combination of a cyclical soft market and structural change. A reduction in peak-zone windstorm activity has led to a build-up of underwriting capacity, resulting in a cyclical soft market. This has been exacerbated by the continued ingress of alternativecapital,whichhas intensifiedcompetitionbetweenand among alternative and traditional reinsurers. The growth of alternative capital represents a structural change to which reinsurers need to adapt.
Pace of Softness in Casualty Key: Fitch believes the pace at which softness in property lines bleeds into casualty lines will be a critical element in further shaping the reinsurance landscape. This will come as traditional capital diverts from soft property catastrophe lines into casualty lines, seeking higher returns. It will also be driven by market reactions to the perceived encroachment of alternate capital via new hedge fund sponsored vehicles like Watford Re.
Consequences for Reinsurers’ Ratings
Picking Market Survivors Is Not StraightforwardIdentifyingwinnersandlosersisnotstraightforwardastheeffectsof falling premium prices and weakening terms and conditions can take years rather than months to depress an individual company’s financialstrengthandbereflectedinreportedfinancialresults.Thispointisemphasisedbycurrentresultsthatpresentasolidfinancialpicture, underscored by strong capitalisation and near record profitability. Fitch views small mono-line property catastrophereinsurers, without other distinguishing attributes, as the most vulnerable to a protracted period of market price softening. This is because of a more limited ability to set and control contract terms andachievecontrolleddiversificationintolessexposedlines.
To enhance its predictive surveillance, the agency uses a qualitative assessment that seeks to determine an individual company’s vulnerability to continued price softening and the structural changes being observed (see Soft Market or Structural Change section). A good understanding of a company’s position within the wider market, as well as an assessment of its strategy, can provide a useful insight into how the fortunes of one may pan out versus a competitor.
Related Criteria
Insurance Rating Methodology (September 2014)
Related Research
2015 Outlook: Global Reinsurance (September 2014)Alternative Reinsurance 2014 Market Update (September 2014) Latin American Reinsurance (September 2014)Reinsurer Mergers and Acquisitions (August 2014)Global Reinsurers’ Mid-Year 2014 Financial Results (August 2014)Asian Reinsurance Markets (August 2014)
AnalystsMartyn Street +44 20 3530 1211 [email protected]
Brian Schneider +1 312 606-2321 [email protected]
Global Reinsurance Guide 201511
Qualitative early warning indicators that Fitch monitors include: significantdiversificationorshiftsintonewbusinessorgeographicmarkets, where the company may lack strong knowledge; and above market growth, which may increase a reinsurer’s exposure to under-priced business or indicate a lack of underwriting discipline. Fitch would also look for signs of a reinsurer writing business that falls significantly below the reinsurer’s technical price floor, tomaintainmarketshare,butthislastfactorisverydifficulttodetect.
Reinsurer Strategy: Mono-Line and Portfolio ReinsurersFitch’s monitored universe of global reinsurers is diverse, with companies varying in size, geographic scale, product diversity and risk appetite. Corporate strategy is key in determining each of these variables.
Fromthebiggestpictureperspective,Fitchidentifiestwoseparateand distinct groups.
Thefirstismono-linereinsurerswhosestrategyistowritebusinessthat is technical but analysable, usually through the use of models. Theprofitabilityofeachindividualtransactionisakeydeterminantto writing the business, meaning that hard market conditions favour this group. US catastrophe programmes represent one such area where companies of this type would focus and operate. During softmarketconditions,sustainingprofitscanbechallenging,witha company’s viability requiring a disciplined approach to cycle management, and an ability to vary the amount of capital within the company in tune with the cycle.
Amongst Fitch’s rated universe, Renaissance Re (A+ IFS) and Montpelier Re (A IFS) are viewed as falling within this broad category.
The second group comprises traditional portfolio reinsurers thatwriteamorediversifiedbookofbusinesswitha longer-termprofitability horizon. Profitability is assessed across a portfolio,wherea lowerreturnforonetransactionmaybeoffsetbyhigherprofitabilityfromanother.Companiestypicallyhavethescaleandscope to write globally placed premium, seeking to optimise capital allocationthroughdiversity.Incontrastwiththefirstgroup,thesereinsurers seek to prioritise portfolio management and can move in and out of lines of business. They also can accept some degree ofunder-pricingincertainlinesifoffsetbyprofitsinothers,aslongas not taken to an extreme. Nonetheless, these companies canstill face an erosion of earnings, if the soft cycle is prolonged and broadens into numerous lines.
The majority of Fitch’s rated reinsurers fall into this second category, though the strength of market positioning and diversity varies, both within non-life/life reinsurance lines and diversity outside of the reinsurance business. Those with less significantreinsurance positions include Markel (A IFS), W.R. Berkley (A IFS), White Mountains (A IFS), Allied World (A+ IFS) and ACE (AA IFS), while those with lesser levels of diversity include Validus (A IFS), Alleghany (A+IFS),PartnerRe(AA−IFS)andReinsuranceGroupofAmerica(A+IFS), as highlighted in the next section.
Scale and Diversity Suggest Greater Financial ResilienceThe concept of tiering, which places individual reinsurers in a specific tier based on one or severalmetrics, has been used bysome market commentators to support views on how the sector may evolve. Usually, those companies that appear in the top tier are the largestandarguablymostdiversifiedplayers,whoareviewedasbeing thebestplaced towithstandandpotentiallyprofit fromcurrent market forces.
Figure 1 provides an illustrative example of the tiering concept, in this case with reinsurers being placed into their respective Market Position and Size/Scale category, as assigned by Fitch. They are size-ranked based on total net written premiums (including primary premiums where applicable), given the current focus on declining premium prices. Comparing geographic and portfolio diversity is made more challenging given the lack of comparability between individual companies reporting.
Value Provision and Realisation Are Less Size-DependentFitch views scale and diversity as two factors that can allow a reinsurer to be resilient when market conditions grow more adverse. But the agency also considers the provision and realisation of value within the reinsurance purchasing chain as an important key determinant of an individual reinsurer’s continued success. Value can be derived from factors including specialist product knowledge and technical expertise, offerings that are less size-dependent but often are sought-after commodities for some reinsurance buyers, whether their requirements are for traditional or alternative reinsurance products.
While this list is not exhaustive, Fitch would consider Renaissance Re and White Mountains to be smaller rated reinsurers that appear tooffervaluewithinthepurchasingchainbeyondsizeandscale.
Soft Market or Structural Change?When making longer-term analytical assessments, it is important todistinguishbetweenshort-termcyclicalfluctuationsandlonger-term structural trends. Price reductions that are the result of lower loss experience or temporary, opportunistic swings in capacity are reflectiveoftheunderwritingcyclethatcompanieswouldmanagethrough as part of the normal course of business.
In contrast, the growth of alternative capital and changes in reinsurance purchasing habits are expected to have long-term implications for the sector. Fitch views the emergence of alternative capital as an enduring credit negative to traditional reinsurers’ ratings. It remains unclear whether changes in primary companies’ reinsurance purchasing habits are permanent or cyclical.
The growth and convergence of alternative capital, including catastrophe bonds, collateralised reinsurers and industry loss warranties, together with changes in reinsurance purchasing habits
Global Reinsurance Guide 2015 12
Non
-Life
Rei
nsur
ance
Life
Rei
nsur
ance
Prim
ary
Larg
e
Med
ium
Smal
l
Ber
kshi
re
Hat
haw
ayLl
oyd'
s of
Lon
don
Sw
iss
Re
Han
nove
r Re
SC
OR
Rei
nsur
ance
G
roup
of
Am
eric
aP
artn
erR
e.E
vere
st
Re.
Alli
ed W
orld
Ren
aiss
ance
Re
Ace
XL
Fairf
axA
xis
Asp
enE
ndur
ance
Whi
te
Mou
ntai
ns
Val
idus
Hol
ding
s, L
td.
Alle
ghan
y
Mon
tpel
ier R
eW
.R. B
erkl
ey.
Mar
kel
Plat
inum
Und
erw
riter
s: U
SD56
7m
Arc
h
Mun
ich
Re:
USD
65.7
bn
Figu
re 1
Rei
nsur
er M
arke
t Pos
itio
n a
nd
Size
/Sca
lea
a D
escr
ibed
with
in R
eins
uran
ce (G
loba
l) Se
ctor
Cre
dit F
acto
rs s
peci
al re
port
. Note:BubblesizedenotestotalNWPincludingnon-lifereinsurance,lifereinsuranceandprimarybusiness,whereapplicable.Primaryincludesallbusinessnotdesignatedas
rein
sura
nce
segm
ent.
Sour
ce: F
itch
Global Reinsurance Guide 201513
by primary players, potentially represents a greater and more permanent adjustment for traditional reinsurers. In the long-term, these two factors are expected to reduce demand for traditional reinsurance products, especially in established markets.
Traditional reinsurers will look for ways of offsetting reducedpremium income, through emerging market expansion, new business lines, or the development of new products, which could diversify earnings.
US Property Catastrophe Prices Hit by Perfect Storm
Fitch views the current pricing deterioration in the US property catastrophe market as a combination of a cyclical soft market and structural change, created by the perfect storm of low loss activity and intense supply-side competition. The cyclical soft market was preceded by a build-up of underwriting capacity in recent years, primarily due to a reduction in windstorm activity and associated insured losses across the peak-zones of the Gulf of Mexico and southern US states.
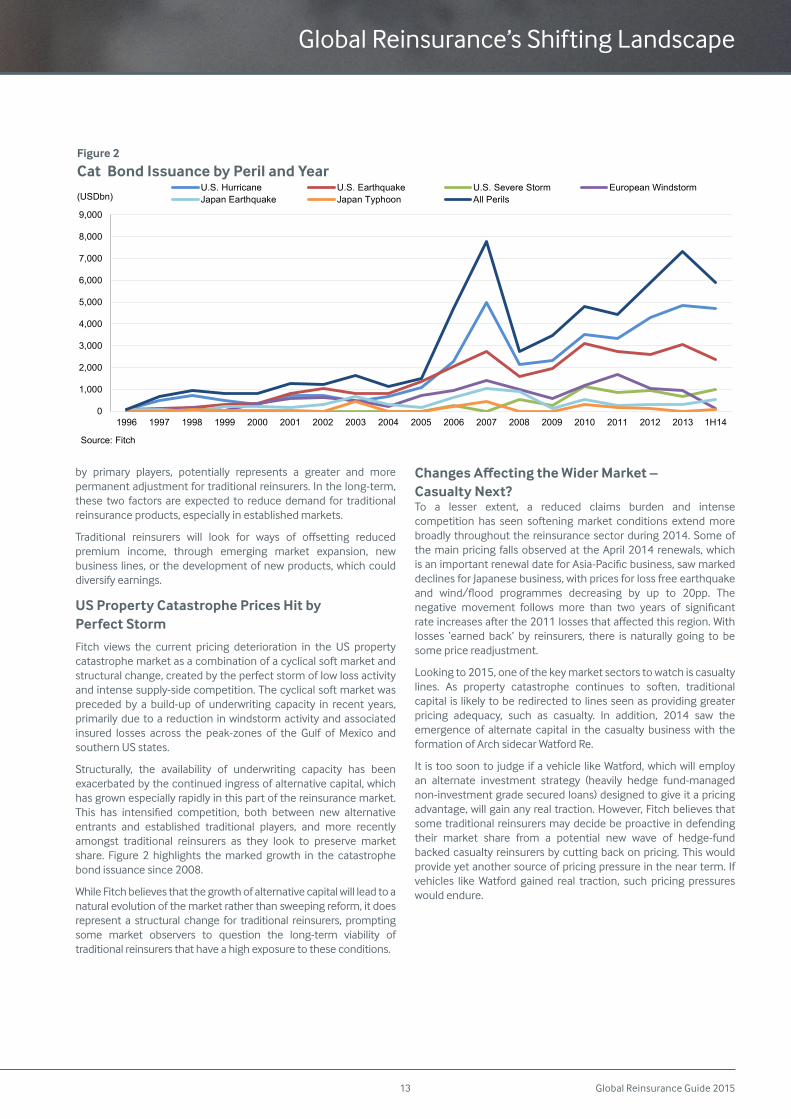
Structurally, the availability of underwriting capacity has been exacerbated by the continued ingress of alternative capital, which has grown especially rapidly in this part of the reinsurance market. This has intensified competition, both between new alternativeentrants and established traditional players, and more recently amongst traditional reinsurers as they look to preserve market share. Figure 2 highlights the marked growth in the catastrophe bond issuance since 2008.
While Fitch believes that the growth of alternative capital will lead to a natural evolution of the market rather than sweeping reform, it does represent a structural change for traditional reinsurers, prompting some market observers to question the long-term viability of traditional reinsurers that have a high exposure to these conditions.
Changes Affecting the Wider Market – Casualty Next?To a lesser extent, a reduced claims burden and intense competition has seen softening market conditions extend more broadly throughout the reinsurance sector during 2014. Some of the main pricing falls observed at the April 2014 renewals, which isanimportantrenewaldateforAsia-Pacificbusiness,sawmarkeddeclines for Japanese business, with prices for loss free earthquake and wind/flood programmes decreasing by up to 20pp. Thenegative movement follows more than two years of significantrateincreasesafterthe2011lossesthataffectedthisregion.Withlosses ‘earned back’ by reinsurers, there is naturally going to be some price readjustment.
Looking to 2015, one of the key market sectors to watch is casualty lines. As property catastrophe continues to soften, traditional capital is likely to be redirected to lines seen as providing greater pricing adequacy, such as casualty. In addition, 2014 saw the emergence of alternate capital in the casualty business with the formation of Arch sidecar Watford Re.
It is too soon to judge if a vehicle like Watford, which will employ an alternate investment strategy (heavily hedge fund-managed non-investment grade secured loans) designed to give it a pricing advantage, will gain any real traction. However, Fitch believes that some traditional reinsurers may decide be proactive in defending their market share from a potential new wave of hedge-fund backed casualty reinsurers by cutting back on pricing. This would provide yet another source of pricing pressure in the near term. If vehicles like Watford gained real traction, such pricing pressures would endure.
Global Reinsurance’s Shifting Landscape
0
1,000
2,000
3,000
4,000
5,000
6,000
7,000
8,000
9,000
1996 1997 1998 1999 2000 2001 2002 2003 2004 2005 2006 2007 2008 2009 2010 2011 2012 2013 1H14
U.S. Hurricane U.S. Earthquake U.S. Severe Storm European WindstormJapan Earthquake Japan Typhoon All Perils
Source: Fitch
(USDbn)
Figure 2
Cat Bond Issuance by Peril and Year
Global Reinsurance Guide 2015 14
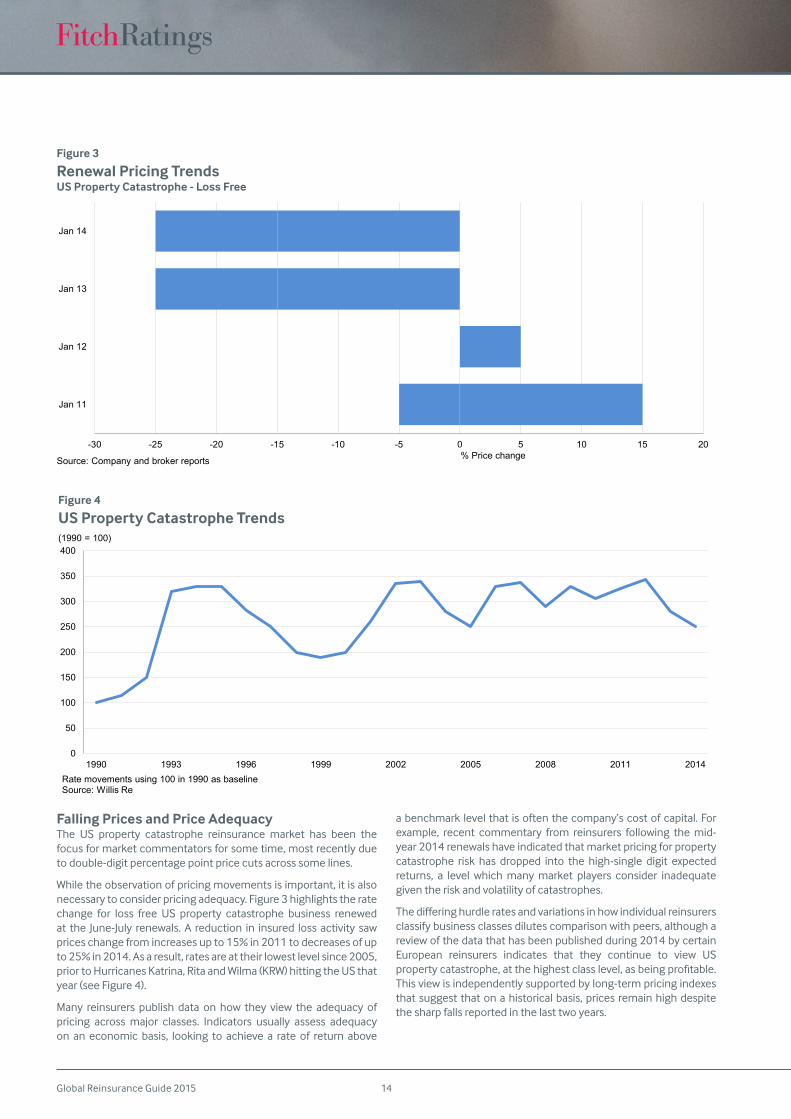
Falling Prices and Price AdequacyThe US property catastrophe reinsurance market has been the focus for market commentators for some time, most recently due to double-digit percentage point price cuts across some lines.
While the observation of pricing movements is important, it is also necessary to consider pricing adequacy. Figure 3 highlights the rate change for loss free US property catastrophe business renewed at the June-July renewals. A reduction in insured loss activity saw prices change from increases up to 15% in 2011 to decreases of up to 25% in 2014. As a result, rates are at their lowest level since 2005, prior to Hurricanes Katrina, Rita and Wilma (KRW) hitting the US that year (see Figure 4).
Many reinsurers publish data on how they view the adequacy of pricing across major classes. Indicators usually assess adequacy on an economic basis, looking to achieve a rate of return above
a benchmark level that is often the company’s cost of capital. For example, recent commentary from reinsurers following the mid-year 2014 renewals have indicated that market pricing for property catastrophe risk has dropped into the high-single digit expected returns, a level which many market players consider inadequate given the risk and volatility of catastrophes.
Thedifferinghurdleratesandvariationsinhowindividualreinsurersclassify business classes dilutes comparison with peers, although a review of the data that has been published during 2014 by certain European reinsurers indicates that they continue to view US propertycatastrophe,atthehighestclasslevel,asbeingprofitable.This view is independently supported by long-term pricing indexes that suggest that on a historical basis, prices remain high despite the sharp falls reported in the last two years.
-30 -25 -20 -15 -10 -5 0 5 10 15 20
Jan 11
Jan 12
Jan 13
Jan 14
% Price changeSource: Company and broker reports
0
50
100
150
200
250
300
350
400
1990 1993 1996 1999 2002 2005 2008 2011 2014Rate movements using 100 in 1990 as baselineSource: Willis Re
(1990 = 100)
Figure 4
US Property Catastrophe Trends
Figure 3
Renewal Pricing Trends US Property Catastrophe - Loss Free
Global Reinsurance Guide 201515
Forming a view on the overall adequacy of reinsurance pricing is hampered by the lack of comparability between published pricing data and the opaqueness created by the detail that is not. Broker reports that provide pricing detail at key renewals are widely used by marketobservers,includingFitch,astheyofferusefulinformationacross a broad range of lines and geographies. Given the high volume of catastrophe exposed business that is placed through the broker distribution channel, this information can be considered to give a fair representation of current market conditions.
A key shortcoming of broker data is that it does not capture price changes for non-renewed business, or business that is ceded directly with reinsurers, which is more applicable to specialised lines, and emerging markets. In these cases, the picture is less clear and relies on the reporting of individual companies. Detail concerning changesintermsandconditions,whichcanaltersignificantlya(re)insurers risk exposure are rarely reported in detail.
Changes in Purchasing HabitsFitch views the emergence of a few large players within the primary, reinsurance and broking communities as an important factor driving changes in purchasing habits of primary insurance companies. It is unclear whether these will prove to be cyclical or structural. Centralised buying often sees the bundling of reinsurance products into an individual programme, to better suit the requirements of the cedent. This can result in a reduced amount of reinsurance spend by the reinsurance buyer.
Ofgreatestsignificanceisthecentralisedpurchasingofreinsurancecover by larger global companies, as well as an increased retention of risk by primary insurance companies of all sizes, which has been assisted by apparently improved capital and risk modelling techniques. At the same time, centralised programmes are resulting in decision-making shifting from individuals to committees, which makes the reinsurance relationship more business-to-business. This potentially reduces the value that a reinsurer may place on a given relationship.
Global Reinsurance’s Shifting Landscape
Global Reinsurance Guide 2015 16
Structural Market Change Pressuring Traditional ReinsurersCapital Markets Are A Permanent Fixture: Alternative forms of risk transfer are here to stay, having gained acceptance by both cedents and most traditional reinsurance providers as a structural change to the reinsurance sector, principally in property catastrophe risk. These nontraditional forms include catastrophe bonds (cat bonds), collateralized quota-share reinsurance vehicles (sidecars), industry loss warranties (ILWs), hedge fund-supported reinsurers and asset managers investing in insurance-linked securities (ILS).
Net Negative Impact to Reinsurers: Fitch Ratings views the growth and acceptance of alternative reinsurance as a strain on the credit quality of reinsurers, particularly for smaller, stand-alone property catastrophe reinsurers. The benefit to traditionalreinsurers from added fee income and risk management tools is morethanoffsetbytheincreasedcompetitionfromcapitalmarketcapacity that, in conjunction with the strong overall capitalization of the reinsurance industry, are resulting in a deteriorating profitabilityprofileforthesector.
Primary Insurers Are Benefiting: The intense competition between traditional reinsurers and capital market providers has aided primary insurers through significant price reductions andmore favorable terms and conditions. These savings are being used by primary insurers to either purchase more reinsurance limit oraddtoearnings,improvingtheiroverallriskprofileandexpected
returns. However, it is also starting to increase competition in the primary market.
Property Catastrophe Under Most Pressure: The nature of property catastrophe risk as being highly modeled serves as an important force driving its transfer into the capital markets. The lower cost of capital for capital market providers that results from thenoncorrelatedportfoliobenefithaspushedexpectedreturnson property catastrophe business into the high single digits. This is below the 10%–15% level many traditional reinsurers consider adequate, but in line with the 6%–10% returns new capital market providersfindacceptable.
Casualty Risk Expands Presence: The entry of Watford Re Ltd. into the nontraditional reinsurance market is creating a stir, as its focus is on multi-line casualty risk, rather than the customary property risk. Fitch expects that the amount of alternative capital dedicated to casualty business will no doubt grow. However, the jury is still out as to its longer-term impact, and growth will certainly be constrained to a limited group of capital market participants that are willing to accept longer-tailed, generally unmodeled, risks in a more permanent vehicle.
Investors to Remain Long Term: One area of uncertainty is how investors would react to an environment of less favorable catastrophe risk spreads or a large unexpected catastrophe loss, either of which could cause capital to retreat. Fitch considers a significantportionof capitalmarket investor funds to remainaspermanent, given the nature of catastrophe risk as providing a very valuable portfolio diversification of investment market risk andinstitutional investors longer-term investment horizon, especially pension funds.
Cat Bond Issuance Grows in 2014: As investor demand remains strong for cat bond issuance, repeat sponsors have been able to replace maturing issues and take advantage of current favorable market conditions, although there have been signs that market pricingmay be reaching a floor. New sponsors have also had astrong presence in the cat bond market in 2014 as (re)insurers have become increasingly comfortable with the issuance process. As of midyear, 2014 is on track to produce a record amount of catastrophe bond issuance.
Alternative Reinsurance Is A Permanent FixtureCapital market alternatives to traditional reinsurance will continue to grow as alternative reinsurance products have reached a level of critical mass and acceptance by cedents that make them a more permanent fixture in the market, particularly forproperty catastrophe risk. Most reinsurers have accepted that the dynamics of the reinsurance marketplace have structurally changed and are looking for ways to match their client needs to the appropriate capital, be it traditional or nontraditional. This
Related Criteria
Insurance Rating Methodology (September 2014) Insurance-Linked Securities (August 2014)
Alternative Reinsurance 2014 Market Update
AnalystsBrian Schneider +1 312 606-2321 [email protected]
Martyn Street +44 20 3530 1211 [email protected]
Christopher Grimes +1 312 368-3263 [email protected]
Related Research
2015 Outlook: Global Reinsurance (September 2014)Global Reinsurance’s Shifting Landscape (September 2014)Latin American Reinsurance (September 2014)Reinsurer Mergers and Acquisitions (August 2014)Global Reinsurers’ Mid-Year 2014 Financial Results (August 2014)Asian Reinsurance Markets (August 2014)
Global Reinsurance Guide 201517
approach is necessary for reinsurers to remain relevant in the face of considerable reinsurance industry headwinds.
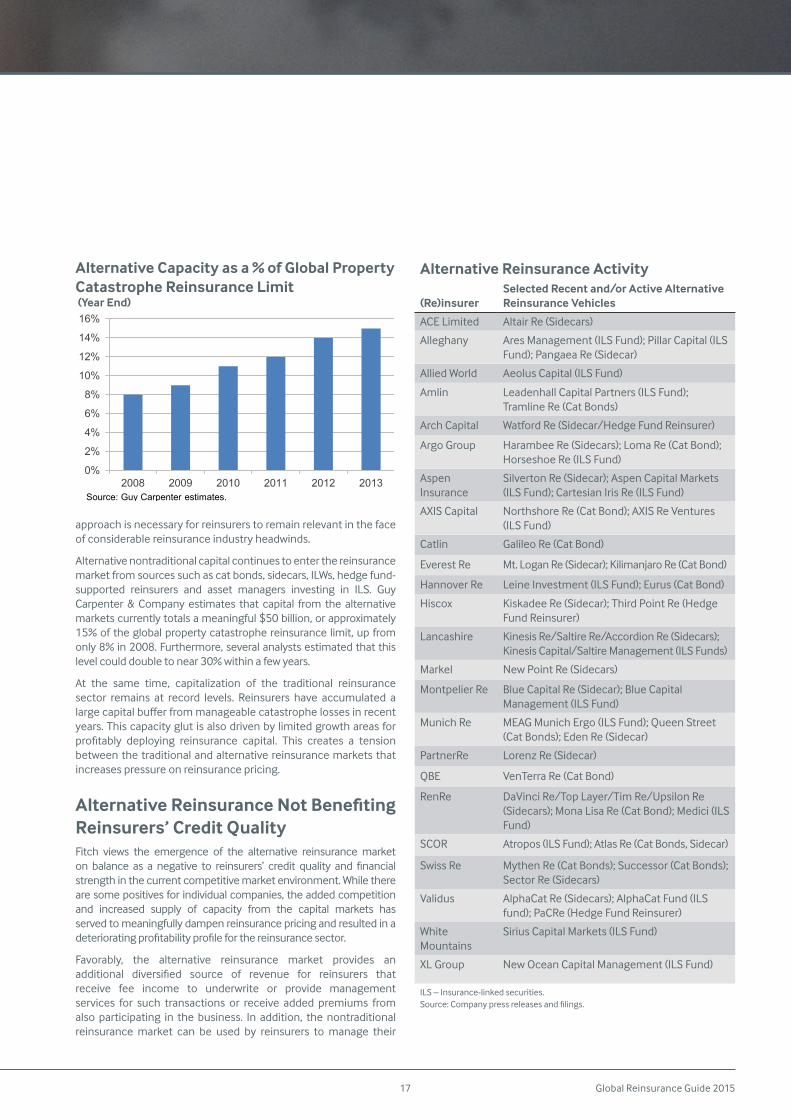
Alternative nontraditional capital continues to enter the reinsurance market from sources such as cat bonds, sidecars, ILWs, hedge fund-supported reinsurers and asset managers investing in ILS. Guy Carpenter & Company estimates that capital from the alternative markets currently totals a meaningful $50 billion, or approximately 15% of the global property catastrophe reinsurance limit, up from only 8% in 2008. Furthermore, several analysts estimated that this level could double to near 30% within a few years.
At the same time, capitalization of the traditional reinsurance sector remains at record levels. Reinsurers have accumulated a largecapitalbufferfrommanageablecatastrophelossesinrecentyears. This capacity glut is also driven by limited growth areas for profitably deploying reinsurance capital. This creates a tensionbetween the traditional and alternative reinsurance markets that increases pressure on reinsurance pricing.
Alternative Reinsurance Not Benefiting Reinsurers’ Credit QualityFitch views the emergence of the alternative reinsurance market on balance as a negative to reinsurers’ credit quality and financialstrength in the current competitive market environment. While there are some positives for individual companies, the added competition and increased supply of capacity from the capital markets has served to meaningfully dampen reinsurance pricing and resulted in a deterioratingprofitabilityprofileforthereinsurancesector.
Favorably, the alternative reinsurance market provides an additional diversified source of revenue for reinsurers thatreceive fee income to underwrite or provide management services for such transactions or receive added premiums from also participating in the business. In addition, the nontraditional reinsurance market can be used by reinsurers to manage their
0%
2%
4%
6%
8%
10%
12%
14%
16%
2008 2009 2010 2011 2012 2013Source: Guy Carpenter estimates.
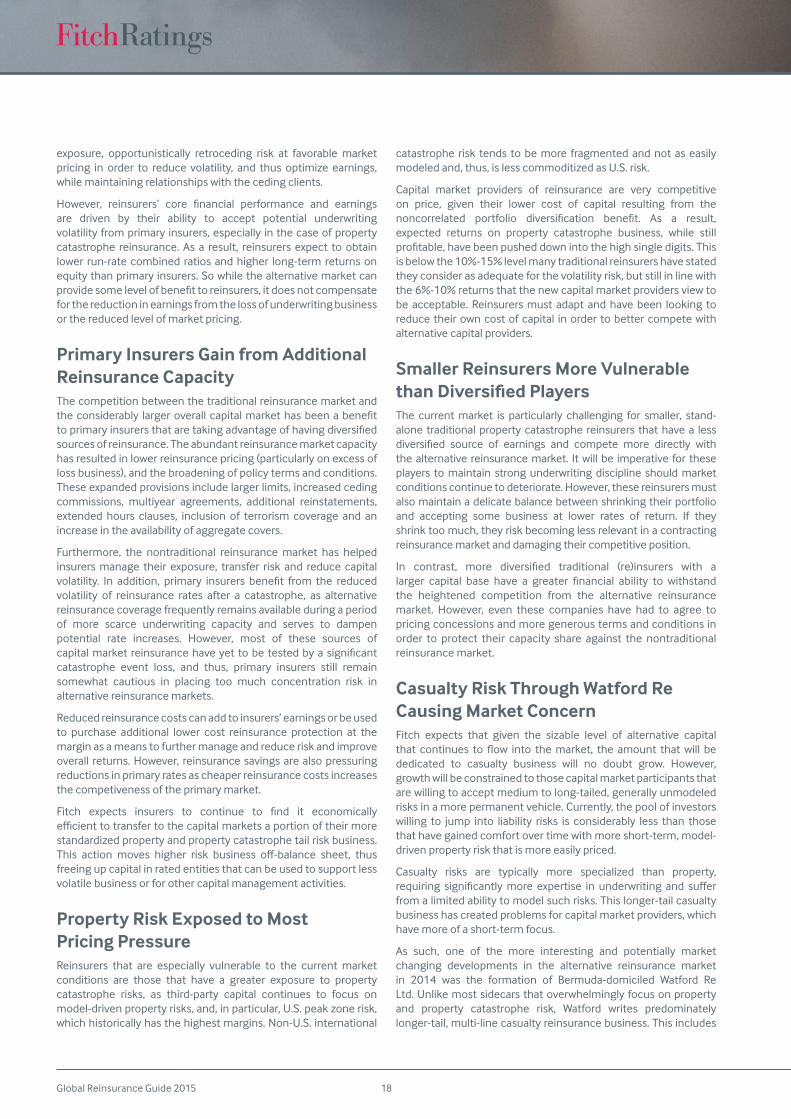
Alternative Reinsurance Activity
(Re)insurerSelected Recent and/or Active Alternative Reinsurance Vehicles
ACE Limited Altair Re (Sidecars)
Alleghany Ares Management (ILS Fund); Pillar Capital (ILS Fund); Pangaea Re (Sidecar)
Allied World Aeolus Capital (ILS Fund)
Amlin Leadenhall Capital Partners (ILS Fund); Tramline Re (Cat Bonds)
Arch Capital Watford Re (Sidecar/Hedge Fund Reinsurer)
Argo Group Harambee Re (Sidecars); Loma Re (Cat Bond); Horseshoe Re (ILS Fund)
Aspen Insurance
Silverton Re (Sidecar); Aspen Capital Markets (ILS Fund); Cartesian Iris Re (ILS Fund)
AXIS Capital NorthshoreRe(CatBond);AXISReVentures(ILS Fund)
Catlin Galileo Re (Cat Bond)
Everest Re Mt. Logan Re (Sidecar); Kilimanjaro Re (Cat Bond)
Hannover Re Leine Investment (ILS Fund); Eurus (Cat Bond)
Hiscox Kiskadee Re (Sidecar); Third Point Re (Hedge Fund Reinsurer)
Lancashire Kinesis Re/Saltire Re/Accordion Re (Sidecars); Kinesis Capital/Saltire Management (ILS Funds)
Markel NewPointRe(Sidecars)
Montpelier Re Blue Capital Re (Sidecar); Blue Capital Management (ILS Fund)
Munich Re MEAG Munich Ergo (ILS Fund); Queen Street (Cat Bonds); Eden Re (Sidecar)
PartnerRe Lorenz Re (Sidecar)
QBE VenTerra Re (Cat Bond)
RenRe DaVinci Re/Top Layer/Tim Re/Upsilon Re (Sidecars); Mona Lisa Re (Cat Bond); Medici (ILS Fund)
SCOR Atropos (ILS Fund); Atlas Re (Cat Bonds, Sidecar)
Swiss Re Mythen Re (Cat Bonds); Successor (Cat Bonds); Sector Re (Sidecars)
Validus AlphaCat Re (Sidecars); AlphaCat Fund (ILS fund); PaCRe (Hedge Fund Reinsurer)
White Mountains
Sirius Capital Markets (ILS Fund)
XL Group NewOceanCapitalManagement(ILSFund)
ILS – Insurance-linked securities. Source:Companypressreleasesandfilings.
Alternative Capacity as a % of Global Property Catastrophe Reinsurance Limit (Year End)
Global Reinsurance Guide 2015 18
exposure, opportunistically retroceding risk at favorable market pricing in order to reduce volatility, and thus optimize earnings, while maintaining relationships with the ceding clients.
However, reinsurers’ core financial performance and earningsare driven by their ability to accept potential underwriting volatility from primary insurers, especially in the case of property catastrophe reinsurance. As a result, reinsurers expect to obtain lower run-rate combined ratios and higher long-term returns on equity than primary insurers. So while the alternative market can providesomelevelofbenefittoreinsurers,itdoesnotcompensatefor the reduction in earnings from the loss of underwriting business or the reduced level of market pricing.
Primary Insurers Gain from Additional Reinsurance CapacityThe competition between the traditional reinsurance market and theconsiderably largeroverallcapitalmarkethasbeenabenefittoprimaryinsurersthataretakingadvantageofhavingdiversifiedsources of reinsurance. The abundant reinsurance market capacity has resulted in lower reinsurance pricing (particularly on excess of loss business), and the broadening of policy terms and conditions. These expanded provisions include larger limits, increased ceding commissions, multiyear agreements, additional reinstatements, extended hours clauses, inclusion of terrorism coverage and an increase in the availability of aggregate covers.
Furthermore, the nontraditional reinsurance market has helped insurers manage their exposure, transfer risk and reduce capital volatility. In addition, primary insurers benefit from the reducedvolatility of reinsurance rates after a catastrophe, as alternative reinsurance coverage frequently remains available during a period of more scarce underwriting capacity and serves to dampen potential rate increases. However, most of these sources of capitalmarketreinsurancehaveyettobetestedbyasignificantcatastrophe event loss, and thus, primary insurers still remain somewhat cautious in placing too much concentration risk in alternative reinsurance markets.
Reduced reinsurance costs can add to insurers’ earnings or be used to purchase additional lower cost reinsurance protection at the margin as a means to further manage and reduce risk and improve overall returns. However, reinsurance savings are also pressuring reductions in primary rates as cheaper reinsurance costs increases the competiveness of the primary market.
Fitch expects insurers to continue to find it economicallyefficienttotransfertothecapitalmarketsaportionoftheirmorestandardized property and property catastrophe tail risk business. This action moves higher risk business off-balance sheet, thusfreeing up capital in rated entities that can be used to support less volatile business or for other capital management activities.
Property Risk Exposed to Most Pricing Pressure Reinsurers that are especially vulnerable to the current market conditions are those that have a greater exposure to property catastrophe risks, as third-party capital continues to focus on model-driven property risks, and, in particular, U.S. peak zone risk, whichhistoricallyhasthehighestmargins.Non-U.S.international
catastrophe risk tends to be more fragmented and not as easily modeled and, thus, is less commoditized as U.S. risk.
Capital market providers of reinsurance are very competitive on price, given their lower cost of capital resulting from the noncorrelated portfolio diversification benefit. As a result,expected returns on property catastrophe business, while still profitable,havebeenpusheddownintothehighsingledigits.Thisis below the 10%-15% level many traditional reinsurers have stated they consider as adequate for the volatility risk, but still in line with the 6%-10% returns that the new capital market providers view to be acceptable. Reinsurers must adapt and have been looking to reduce their own cost of capital in order to better compete with alternative capital providers.
Smaller Reinsurers More Vulnerable than Diversified PlayersThe current market is particularly challenging for smaller, stand-alone traditional property catastrophe reinsurers that have a less diversified source of earnings and compete more directly withthe alternative reinsurance market. It will be imperative for these players to maintain strong underwriting discipline should market conditions continue to deteriorate. However, these reinsurers must also maintain a delicate balance between shrinking their portfolio and accepting some business at lower rates of return. If they shrink too much, they risk becoming less relevant in a contracting reinsurance market and damaging their competitive position.
In contrast, more diversified traditional (re)insurers with alarger capital base have a greater financial ability to withstandthe heightened competition from the alternative reinsurance market. However, even these companies have had to agree to pricing concessions and more generous terms and conditions in order to protect their capacity share against the nontraditional reinsurance market.
Casualty Risk Through Watford Re Causing Market ConcernFitch expects that given the sizable level of alternative capital that continues to flow into themarket, the amount thatwill bededicated to casualty business will no doubt grow. However, growth will be constrained to those capital market participants that are willing to accept medium to long-tailed, generally unmodeled risks in a more permanent vehicle. Currently, the pool of investors willing to jump into liability risks is considerably less than those that have gained comfort over time with more short-term, model-driven property risk that is more easily priced.
Casualty risks are typically more specialized than property, requiring significantlymore expertise in underwriting and sufferfrom a limited ability to model such risks. This longer-tail casualty business has created problems for capital market providers, which have more of a short-term focus.
As such, one of the more interesting and potentially market changing developments in the alternative reinsurance market in 2014 was the formation of Bermuda-domiciled Watford Re Ltd. Unlike most sidecars that overwhelmingly focus on property and property catastrophe risk, Watford writes predominately longer-tail, multi-line casualty reinsurance business. This includes
Global Reinsurance Guide 201519
general casualty, professional liability, workers’ compensation, nonstandard and standard auto lines.
Arch Capital Group Ltd. (ACGL), with an ownership interest of approximately 11%, performs the underwriting services for the reinsurance sidecar, utilizing the same proven underwriting standards as the business written on its own books. Highbridge Principal Strategies, L.L.C. (Highbridge; owned by JP MorganChase), a private equity and credit investment hedge fund company launched in 2007, manages the investments for Watford Re. The investment strategy seeks increased yields through higher risk, non-investment-grade fixed-income securities (mainly securedloans), as the longer-tail nature of the liabilities can be matched with longer duration invested assets.
If successful, companies like Watford could prove to be formidable. Given a hedge fund’s higher investment return expectations, Watford or reinsurers like it could strategically use its above-average expected investment results to price lower than competitors. Thiscouldallowsuchcompaniestoestablishafirmfootholdandcompete effectively with the traditional market at an enduringpricing advantage.
However, there are also notable risks associated with the strategy. It would be particularly concerning should the hedge fund push too hard for business to be written to add to the investment portfolio,resultinginthelatestversionofcashflowunderwriting.This would expose the company to not only direct heightened risks in the investment portfolio and losses to capital should defaults come in higher than expected, but also the risk of future reserve development risk. The worst-case scenario is the “double whammy” of reserves blowing up at the same time defaults on the investment portfolio rise.
Fitch’s broader concern is that a more widespread replication of structures similar to Watford Re could push the overall market to accept lower priced business in casualty lines, whereas to date, the significant reinsurance market pricing declines have been morelimited to property lines. Indeed, even the market fear of having more casualty-focused sidecars is affecting behavior with sometraditional reinsurers being more willing to accept lower rates in order to thwart the ability of Watford Re to establish a sustainable market position.
Fitch believes the next 12 month will be enlightening as to whether markets will accept vehicles with Watford’s profile, or if suchvehicles will be a passing phase that never gain real traction. In addition, beyond the impact of nontraditional capital from vehicles such as Watford, Fitch also believes there is an increasing risk that pricing softness will accelerate in casualty lines more generally. As property rates grow softer, traditional capital will increasingly be redirected to casualty lines, pressuring them as well.
Persistent Low Yields Drive Increased Investor DemandThe lack of correlation between catastrophe losses and returns on other major asset classes that are tied to more macroeconomic andfinancialmarketconditionshasalwaysbeenaprimarydriverfor investors to allocate funds to insurance risk. More recently, however, it has been quantitative easing (QE) and the resultant prolongedperiodoflowinterestratesavailableinthefixed-incomemarket that has pushed more and more investors to seek higher yielding asset classes.
In addition, insurance securitizations have grown to a level in which ILS funds have become an accepted asset class, attracting new investors. This has been driven in large part by the more favorable spreads available from catastrophe investments relative to the exceptionally low investment market yields, although this spread has diminished considerably due to the increased investor demand. The market has expanded to an extent that individual investors can invest in multiple transactions to create a more diversifiedportfolioofinsurancesecuritizations.
Investor Capital Has Permanency Even With Altering EventsFitch considers a significant portion of capital market investorfunds to remain as permanent, given the nature of catastrophe risk as providing a very valuable portfolio diversification ofinvestment market risk. However, the two events that would cause the most potential disruption to the market include an increase in investment market yields or a major catastrophe loss event.
How investors would ultimately react to an environment of significantly higher investment yields remains a source ofuncertainty, as it could potentially cause capital to retreat. If interest rates were to rise to higher levels as QE monetary policies begin to abate, other asset classes could become relatively more attractive to investors if catastrophe risk spreads became less favorable.
Fitch views hedge fund capital as opportunistic and thus more likely to pull out, as pension funds have a longer-term investment horizon and generally lower return expectations given their lower risk appetite. This is important given that pension funds provide a greater source of current and potential investable assets with total global pension fund assets estimated to be at least $20 trillion.
In addition, a major catastrophe loss event on a scale nearing $100 billion could result in third-party capital deciding not to replenish the market, based on a higher perceived level of risk. Fitch notes that individual pension funds that invest in ILS tend to have a more limited overall allocation of 5% or less to this asset class, and therefore,maynotbeaffectedasmuchafteralargelosseventashedge funds that generally have more concentrated risk exposure. However, pension funds facemore potential headline flight riskshouldtheysufferlossesfromasizablecatastropheevent.
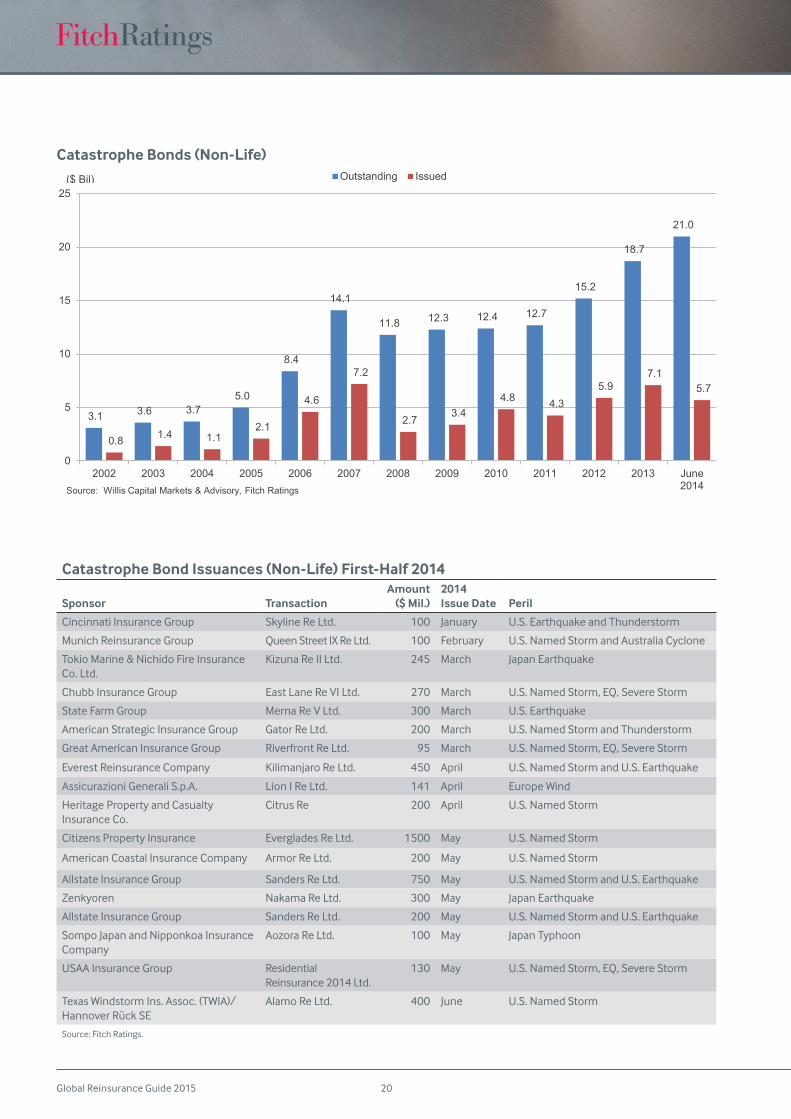
Catastrophe Bond Market at Record HeightsGrowth in the catastrophe bond market has been considerable in thefirsthalfof2014asthemarkethasproducedover$5.7billionof new issuance and reached a new high watermark for the amount of outstanding bonds at over $21 billion. Demand has remained very strong in the marketplace as repeat sponsors have been eager to replace maturing cat bond issues and take advantage of favorable market conditions to expand the alternative portion of their reinsurance protection program.
Repeat sponsors have represented approximately 71% of 2014 cat bond issuance with veteran sponsors Allstate Insurance Group, State Farm Mutual Group, Chubb Corp and USAA Insurance Group representing major U.S. primary insurers returning to utilize alternative capital. In some cases, the sponsors have been able toissuesignificantlylargerdealslikeCitizens’PropertyInsuranceCorporation’s new Everglades Re bond that doubled in size from
Alternative Reinsurance 2014 Market Update
Global Reinsurance Guide 2015 20
Catastrophe Bond Issuances (Non-Life) First-Half 2014
Sponsor TransactionAmount
($ Mil.)2014 Issue Date Peril
Cincinnati Insurance Group Skyline Re Ltd. 100 January U.S. Earthquake and Thunderstorm
Munich Reinsurance Group Queen Street IX Re Ltd. 100 February U.S.NamedStormandAustraliaCyclone
TokioMarine&NichidoFireInsuranceCo. Ltd.
Kizuna Re II Ltd. 245 March Japan Earthquake
Chubb Insurance Group East Lane Re VI Ltd. 270 March U.S.NamedStorm,EQ,SevereStorm
State Farm Group Merna Re V Ltd. 300 March U.S. Earthquake
American Strategic Insurance Group Gator Re Ltd. 200 March U.S.NamedStormandThunderstorm
Great American Insurance Group Riverfront Re Ltd. 95 March U.S.NamedStorm,EQ,SevereStorm
Everest Reinsurance Company Kilimanjaro Re Ltd. 450 April U.S.NamedStormandU.S.Earthquake
Assicurazioni Generali S.p.A. Lion I Re Ltd. 141 April Europe Wind
Heritage Property and Casualty Insurance Co.
Citrus Re 200 April U.S.NamedStorm
Citizens Property Insurance Everglades Re Ltd. 1500 May U.S.NamedStorm
American Coastal Insurance Company Armor Re Ltd. 200 May U.S.NamedStorm
Allstate Insurance Group Sanders Re Ltd. 750 May U.S.NamedStormandU.S.Earthquake
Zenkyoren NakamaReLtd. 300 May Japan Earthquake
Allstate Insurance Group Sanders Re Ltd. 200 May U.S.NamedStormandU.S.Earthquake
SompoJapanandNipponkoaInsuranceCompany
Aozora Re Ltd. 100 May Japan Typhoon
USAA Insurance Group Residential Reinsurance 2014 Ltd.
130 May U.S.NamedStorm,EQ,SevereStorm
Texas Windstorm Ins. Assoc. (TWIA)/Hannover Rück SE
Alamo Re Ltd. 400 June U.S.NamedStorm
Source: Fitch Ratings.
3.1 3.6 3.7 5.0
8.4
14.1
11.8 12.3 12.4 12.7
15.2
18.7
21.0
0.8 1.4 1.1 2.1
4.6
7.2
2.7 3.4
4.8 4.3 5.9
7.1 5.7
0
5
10
15
20
25
2002 2003 2004 2005 2006 2007 2008 2009 2010 2011 2012 2013 June2014
Outstanding Issued
Source: Willis Capital Markets & Advisory, Fitch Ratings
($ Bil)
Catastrophe Bonds (Non-Life)
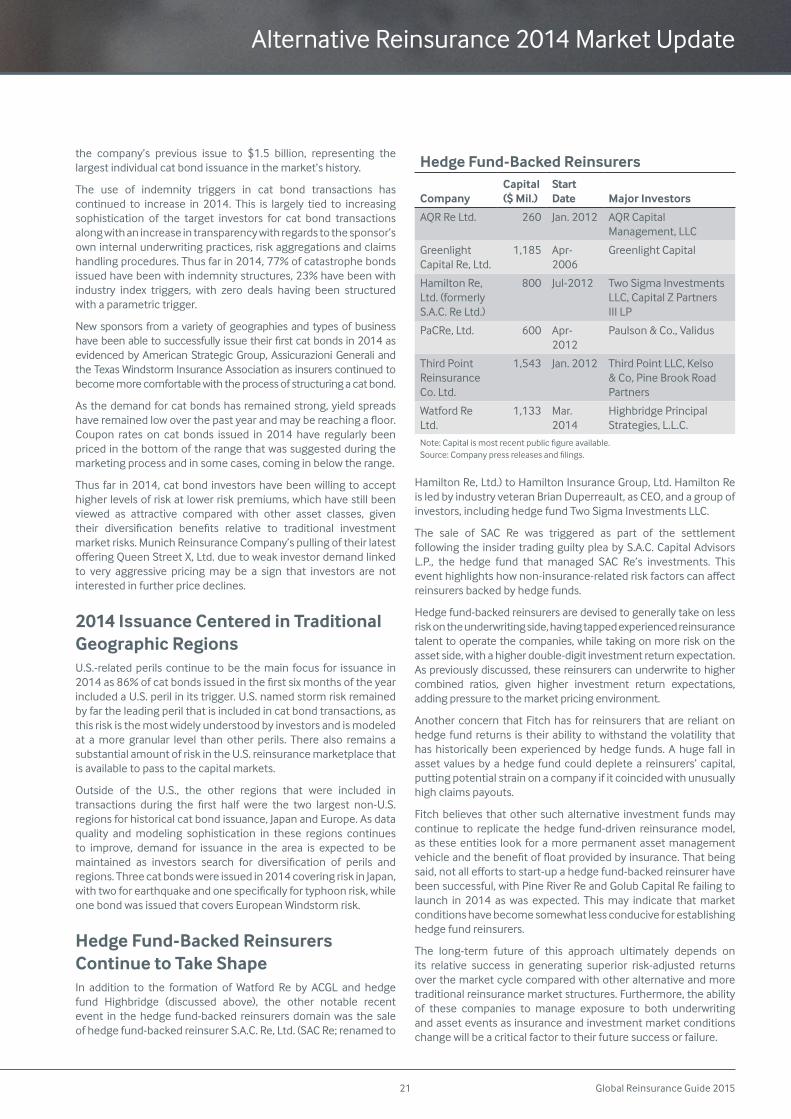
Global Reinsurance Guide 201521
the company’s previous issue to $1.5 billion, representing the largest individual cat bond issuance in the market’s history.
The use of indemnity triggers in cat bond transactions has continued to increase in 2014. This is largely tied to increasing sophistication of the target investors for cat bond transactions along with an increase in transparency with regards to the sponsor’s own internal underwriting practices, risk aggregations and claims handling procedures. Thus far in 2014, 77% of catastrophe bonds issued have been with indemnity structures, 23% have been with industry index triggers, with zero deals having been structured with a parametric trigger.
Newsponsors fromavarietyofgeographiesand typesofbusinesshavebeenabletosuccessfullyissuetheirfirstcatbondsin2014asevidenced by American Strategic Group, Assicurazioni Generali and the Texas Windstorm Insurance Association as insurers continued to become more comfortable with the process of structuring a cat bond.
As the demand for cat bonds has remained strong, yield spreads haveremainedlowoverthepastyearandmaybereachingafloor.Coupon rates on cat bonds issued in 2014 have regularly been priced in the bottom of the range that was suggested during the marketing process and in some cases, coming in below the range.
Thus far in 2014, cat bond investors have been willing to accept higher levels of risk at lower risk premiums, which have still been viewed as attractive compared with other asset classes, given their diversification benefits relative to traditional investmentmarket risks. Munich Reinsurance Company’s pulling of their latest offeringQueenStreetX,Ltd.duetoweakinvestordemandlinkedto very aggressive pricing may be a sign that investors are not interested in further price declines.
2014 Issuance Centered in Traditional Geographic RegionsU.S.-related perils continue to be the main focus for issuance in 2014as86%ofcatbondsissuedinthefirstsixmonthsoftheyearincluded a U.S. peril in its trigger. U.S. named storm risk remained by far the leading peril that is included in cat bond transactions, as this risk is the most widely understood by investors and is modeled at a more granular level than other perils. There also remains a substantial amount of risk in the U.S. reinsurance marketplace that is available to pass to the capital markets.
Outside of the U.S., the other regions that were included in transactions during the first half were the two largest non-U.S.regions for historical cat bond issuance, Japan and Europe. As data quality and modeling sophistication in these regions continues to improve, demand for issuance in the area is expected to be maintained as investors search for diversification of perils andregions. Three cat bonds were issued in 2014 covering risk in Japan, withtwoforearthquakeandonespecificallyfortyphoonrisk,whileone bond was issued that covers European Windstorm risk.
Hedge Fund-Backed Reinsurers Continue to Take ShapeIn addition to the formation of Watford Re by ACGL and hedge fund Highbridge (discussed above), the other notable recent event in the hedge fund-backed reinsurers domain was the sale of hedge fund-backed reinsurer S.A.C. Re, Ltd. (SAC Re; renamed to
Hamilton Re, Ltd.) to Hamilton Insurance Group, Ltd. Hamilton Re is led by industry veteran Brian Duperreault, as CEO, and a group of investors, including hedge fund Two Sigma Investments LLC.
The sale of SAC Re was triggered as part of the settlement following the insider trading guilty plea by S.A.C. Capital Advisors L.P., the hedge fund that managed SAC Re’s investments. This eventhighlightshownon-insurance-relatedriskfactorscanaffectreinsurers backed by hedge funds.
Hedge fund-backed reinsurers are devised to generally take on less risk on the underwriting side, having tapped experienced reinsurance talent to operate the companies, while taking on more risk on the asset side, with a higher double-digit investment return expectation. As previously discussed, these reinsurers can underwrite to higher combined ratios, given higher investment return expectations, adding pressure to the market pricing environment.
Another concern that Fitch has for reinsurers that are reliant on hedge fund returns is their ability to withstand the volatility that has historically been experienced by hedge funds. A huge fall in asset values by a hedge fund could deplete a reinsurers’ capital, putting potential strain on a company if it coincided with unusually high claims payouts.
Fitch believes that other such alternative investment funds may continue to replicate the hedge fund-driven reinsurance model, as these entities look for a more permanent asset management vehicleandthebenefitoffloatprovidedbyinsurance.Thatbeingsaid,notalleffortstostart-upahedgefund-backedreinsurerhavebeen successful, with Pine River Re and Golub Capital Re failing to launch in 2014 as was expected. This may indicate that market conditions have become somewhat less conducive for establishing hedge fund reinsurers.
The long-term future of this approach ultimately depends on its relative success in generating superior risk-adjusted returns over the market cycle compared with other alternative and more traditional reinsurance market structures. Furthermore, the ability of these companies to manage exposure to both underwriting and asset events as insurance and investment market conditions change will be a critical factor to their future success or failure.
Alternative Reinsurance 2014 Market Update
Hedge Fund-Backed Reinsurers
CompanyCapital ($ Mil.)
Start Date Major Investors
AQR Re Ltd. 260 Jan. 2012 AQR Capital Management, LLC
Greenlight Capital Re, Ltd.
1,185 Apr-2006
Greenlight Capital
Hamilton Re, Ltd. (formerly S.A.C. Re Ltd.)
800 Jul-2012 Two Sigma Investments LLC, Capital Z Partners III LP
PaCRe, Ltd. 600 Apr-2012
Paulson & Co., Validus
Third Point Reinsurance Co. Ltd.
1,543 Jan. 2012 Third Point LLC, Kelso & Co, Pine Brook Road Partners
Watford Re Ltd.
1,133 Mar. 2014
Highbridge Principal Strategies, L.L.C.
Note:Capitalismostrecentpublicfigureavailable. Source:Companypressreleasesandfilings.
Global Reinsurance Guide 2015 22
Alternative Reinsurance MarketAlternative reinsurance is effectively any form ofmanaging andtransferring (re)insurance risk through the use of the capital markets rather than the traditional reinsurance market. These nontraditional structures commonly include catastrophe bonds (cat bonds), collateralized quota-share reinsurance vehicles (sidecars) and industry loss warranties (ILWs).
Alternatives to traditional reinsurance essentially began following Hurricane Andrew, with the introduction of exchange traded insurance options in 1992, the first cat bond in 1994 and latersidecars in 2001, following the events of Sept. 11, 2001. However, the market began to grow significantly following HurricaneKatrina in 2005, as (re)insurers were essentially forced to increase issuances of catastrophe bonds and expand the use of sidecars in order to absorb underwriting capacity as retrocession availability became more scarce and expensive.
Catastrophe BondsCat bonds are bonds issued by an insurer with a condition that if the issuer suffersacatastrophe lossgreater thana specifiedamount,the obligation to pay interest/principal is deferred or forgiven, thuseffectivelypromptingadefaultonthebond.Catbondsallowsponsors, most often a (re)insurer, to transfer a portion of its catastrophe risk to the capital markets through securities purchased by investors and actively traded in the secondary market.
Favorablyforthesponsor,catbondsoffercollateralized(mostofteninvested in U.S. Treasury Money Market Funds) protection that is lockedinatafixedcostovermultipleyears(typicallytwotofouryears).This allows the (re)insurer to be less subject to changing reinsurance marketconditions.Fortheinvestor,catbondsofferacomparativelyhigh yield and an opportunity to diversify their portfolios.
SidecarsSidecars are special-purpose reinsurers that provide dedicated collateralized quota-share reinsurance, often for a single ceding company that transfers a portion of its underwriting risk (and related capital investment), and in turn receives a ceding commission. They also can be a source of fee income for the reinsurers that underwrite or provide management services to such third-party risk vehicles.
Sidecar vehicles are often established by traditional reinsurers as ameans to tap into the external capacity offered by the capitalmarkets from hedge funds, investment banks, private equity and other opportunistic investors and increase the efficiencyand diversification of the company’s reinsurance program. Theytypically have a limited life expectancy and are often wound up when market conditions deteriorate, after which any remaining capital funds are returned to investors and the sponsor.
Industry Loss WarrantiesILWs are a type of private reinsurance or derivative contract through which one party (often an insurer) will purchase protection based on the total loss arising from an event to the entire insurance industry rather than their own losses. The buyer pays a premium to the company that writes the ILW cover (often a reinsurer or hedge fund)andinreturnreceivescoverageforaspecifiedlimitifindustrylossesexceedthepredefinedamountundertheILWtrigger.
Appendix – Terminology

Global Reinsurance Guide 201523
Alternative Reinsurance 2014 Market Update
Global Reinsurance Guide 2015 24
Current Environment Favors Increased M&A Activity Reinsurance Ripe for Consolidation: The reinsurance market was presumed as a good merger and acquisition (M&A) candidate for the last several years due to the level of undeployed capital and the number of small and midsize companies with limited organic growth options. The increasing availability of alternative reinsurance could add to these trends by providing further sources of capital to the market while potentially reducing growth opportunities for traditional reinsurers in direct competition with the alternative providers.
Consolidation Viewed as Positive for Sector: Fitch Ratings views a certain amount of consolidation as a modest positive for the reinsurance sector, as a reduction in the number of (re)insurers and associated underwriting capacity would likely ease competitive pressures. However, cedents would be less able to diversify across reinsurers, with increased reinsurance concentration risk. For the acquirer, a consolidating transaction could be a credit positive or negative.
Aspen Bid Reflects Difficult Conditions: Endurance Specialty Holdings Ltd.’s (Endurance) failed bid to buy Aspen Insurance Holdings Ltd. (Aspen) reflects the difficult conditions in thereinsurance market. Softening reinsurance pricing and broadening of policy terms and conditions demonstrate deterioration in market underwriting discipline that, if unchecked, will result in profit erosion for reinsurers below adequate levels. Becoming a
larger and more diverse organization can increase the chances of surviving considerable industry headwinds.
Roadblocks Remain for Deals: The environment appears to support M&A activity, as valuation multiples have changed to be more in favor of deal-making. However, there are still impediments that may stand in the way of deals, primarily a lack of willing sellers. As such, Fitch expects very few transformational acquisitions.
Acquisition-Related Risks: Recognition of inherent uncertainty tied to any large acquisition also leads to fewer consummated deals. These risks include significant integration challenges;uncertainty in relation to regulatory initiatives, such as Solvency II,thatcouldaffectreinsurerearningsandcapitalstructures;andpotentially destroying shareholder value by overpaying for an acquisition, particularly with the heightened risk of acquiring a company with inadequate reserves.
Reinsurers Seek Diversifying Acquisitions: Several recent acquisitions by reinsurance companies of non-reinsurance businesses reflect a reaction to the lack of adequate returnson reinsurance capital in an attempt to improve overall future return prospects. These include Arch Capital Group Ltd.’s (ACGL) movement into the U.S. mortgage insurance market, Validus Holdings, Ltd.’s (Validus) pending acquisition of Western World Insurance Group Inc. (Western World), as well as several expansions into the alternative reinsurance market.
Diversifying M&A a Credit Negative: Fitch generally views diversifying transactions as a credit negative to the acquiring company in the near term. Execution risk is very high, as the acquiring company is entering into an area where it does not have expertise and the chance of making mistakes is high. Over the long term, a well-executed and well-priced acquisition that provides diversificationofearningsandbusinessprofilewouldbeacreditpositive to the company.
M&A Activity Could Increase Among ReinsurersThe reinsurance sector is likely to see increased M&A activity, as more stressful market conditions limit organic growth potential.Marketconsolidationwouldfostermoreefficientuseofunderwriting capacity and reduce undeployed capital. However, a meaningful decline in the number of reinsurance markets would reduce cedents’ ability to diversify risk exposures.
Market experts have speculated that the reinsurance market is a strong candidate for consolidation due to the abundant level of capital and the number of small and midsize companies with limited organic growth options. However, most recent deals have been small or involved sales of particular operations or business lines thatwerenolongerastrategicfit,inrunofforpartofadistressedsale. Fitch expects future M&A activity is likely to take the form of smaller bolt-on acquisitions rather than be transformational, given acquisition-related risks.
Reinsurer Mergers and Acquisitions
Related Criteria
Insurance Rating Methodology (September 2014)
AnalystsBrian Schneider +1 312 606-2321 [email protected]
Martyn Street +44 20 3530 1211 [email protected]
Jeremy Graczyk +1 312 368-3208 [email protected]
Related Research
2015 Outlook: Global Reinsurance (September 2014)Alternative Reinsurance 2014 Market Update (September 2014) Global Reinsurance’s Shifting Landscape (September 2014)Latin American Reinsurance (September 2014)Global Reinsurers’ Mid-Year 2014 Financial Results (August 2014)Asian Reinsurance Markets (August 2014)
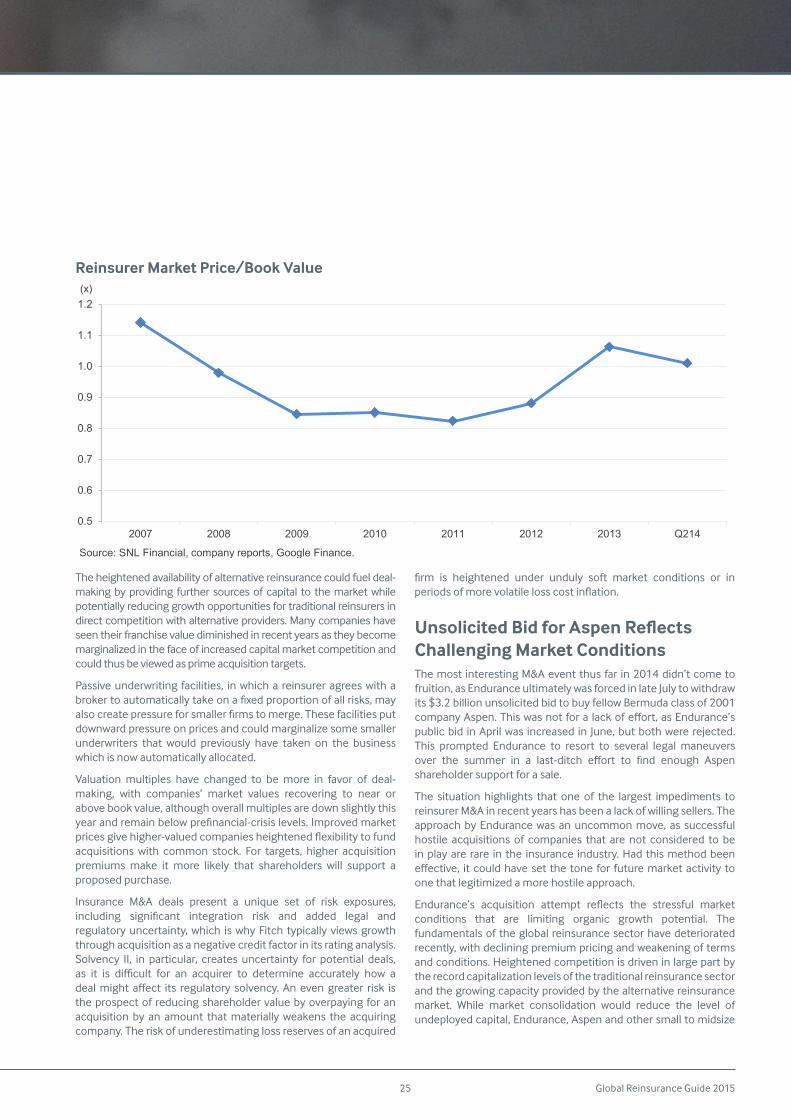
Global Reinsurance Guide 201525
The heightened availability of alternative reinsurance could fuel deal-making by providing further sources of capital to the market while potentially reducing growth opportunities for traditional reinsurers in direct competition with alternative providers. Many companies have seen their franchise value diminished in recent years as they become marginalized in the face of increased capital market competition and could thus be viewed as prime acquisition targets.
Passive underwriting facilities, in which a reinsurer agrees with a brokertoautomaticallytakeonafixedproportionofallrisks,mayalsocreatepressureforsmallerfirmstomerge.Thesefacilitiesputdownward pressure on prices and could marginalize some smaller underwriters that would previously have taken on the business which is now automatically allocated.
Valuation multiples have changed to be more in favor of deal-making, with companies’ market values recovering to near or above book value, although overall multiples are down slightly this yearandremainbelowprefinancial-crisislevels.Improvedmarketpricesgivehigher-valuedcompaniesheightenedflexibilitytofundacquisitions with common stock. For targets, higher acquisition premiums make it more likely that shareholders will support a proposed purchase.
Insurance M&A deals present a unique set of risk exposures, including significant integration risk and added legal andregulatory uncertainty, which is why Fitch typically views growth through acquisition as a negative credit factor in its rating analysis. Solvency II, in particular, creates uncertainty for potential deals, as it is difficult for an acquirer to determine accurately how adealmight affect its regulatory solvency.Anevengreater risk isthe prospect of reducing shareholder value by overpaying for an acquisition by an amount that materially weakens the acquiring company. The risk of underestimating loss reserves of an acquired
firm is heightened under unduly soft market conditions or inperiodsofmorevolatilelosscostinflation.
Unsolicited Bid for Aspen Reflects Challenging Market ConditionsThe most interesting M&A event thus far in 2014 didn’t come to fruition, as Endurance ultimately was forced in late July to withdraw its $3.2 billion unsolicited bid to buy fellow Bermuda class of 2001 companyAspen.Thiswasnotfora lackofeffort,asEndurance’spublic bid in April was increased in June, but both were rejected. This prompted Endurance to resort to several legal maneuvers over the summer in a last-ditch effort to find enough Aspenshareholder support for a sale.
The situation highlights that one of the largest impediments to reinsurer M&A in recent years has been a lack of willing sellers. The approach by Endurance was an uncommon move, as successful hostile acquisitions of companies that are not considered to be in play are rare in the insurance industry. Had this method been effective, itcouldhaveset the tone for futuremarketactivity toone that legitimized a more hostile approach.
Endurance’s acquisition attempt reflects the stressful marketconditions that are limiting organic growth potential. The fundamentals of the global reinsurance sector have deteriorated recently, with declining premium pricing and weakening of terms and conditions. Heightened competition is driven in large part by the record capitalization levels of the traditional reinsurance sector and the growing capacity provided by the alternative reinsurance market. While market consolidation would reduce the level of undeployed capital, Endurance, Aspen and other small to midsize
0.5
0.6
0.7
0.8
0.9
1.0
1.1
1.2
2007 2008 2009 2010 2011 2012 2013 Q214
(x)
Source: SNL Financial, company reports, Google Finance.
Reinsurer Market Price/Book Value
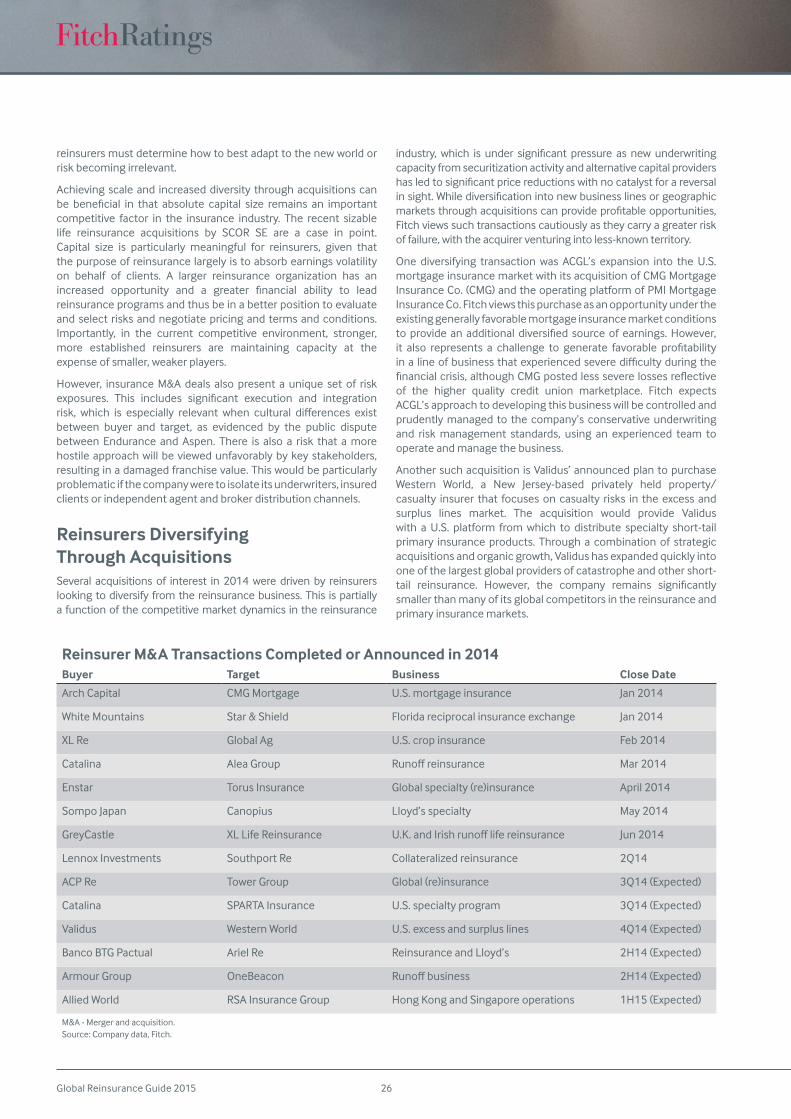
Global Reinsurance Guide 2015 26
reinsurers must determine how to best adapt to the new world or risk becoming irrelevant.
Achieving scale and increased diversity through acquisitions can be beneficial in that absolute capital size remains an importantcompetitive factor in the insurance industry. The recent sizable life reinsurance acquisitions by SCOR SE are a case in point. Capital size is particularly meaningful for reinsurers, given that the purpose of reinsurance largely is to absorb earnings volatility on behalf of clients. A larger reinsurance organization has an increased opportunity and a greater financial ability to leadreinsurance programs and thus be in a better position to evaluate and select risks and negotiate pricing and terms and conditions. Importantly, in the current competitive environment, stronger, more established reinsurers are maintaining capacity at the expense of smaller, weaker players.
However, insurance M&A deals also present a unique set of risk exposures. This includes significant execution and integrationrisk, which is especially relevant when cultural differences existbetween buyer and target, as evidenced by the public dispute between Endurance and Aspen. There is also a risk that a more hostile approach will be viewed unfavorably by key stakeholders, resulting in a damaged franchise value. This would be particularly problematic if the company were to isolate its underwriters, insured clients or independent agent and broker distribution channels.
Reinsurers Diversifying Through Acquisitions Several acquisitions of interest in 2014 were driven by reinsurers looking to diversify from the reinsurance business. This is partially a function of the competitive market dynamics in the reinsurance
industry, which is under significant pressure as new underwritingcapacity from securitization activity and alternative capital providers hasledtosignificantpricereductionswithnocatalystforareversalinsight.Whilediversificationintonewbusinesslinesorgeographicmarketsthroughacquisitionscanprovideprofitableopportunities,Fitch views such transactions cautiously as they carry a greater risk of failure, with the acquirer venturing into less-known territory.
One diversifying transaction was ACGL’s expansion into the U.S. mortgage insurance market with its acquisition of CMG Mortgage Insurance Co. (CMG) and the operating platform of PMI Mortgage Insurance Co. Fitch views this purchase as an opportunity under the existing generally favorable mortgage insurance market conditions toprovideanadditionaldiversified sourceofearnings.However,it also represents a challenge to generate favorable profitabilityinalineofbusinessthatexperiencedseveredifficultyduringthefinancialcrisis,althoughCMGpostedlessseverelossesreflectiveof the higher quality credit union marketplace. Fitch expects ACGL’s approach to developing this business will be controlled and prudently managed to the company’s conservative underwriting and risk management standards, using an experienced team to operate and manage the business.
Another such acquisition is Validus’ announced plan to purchase Western World, a New Jersey-based privately held property/casualty insurer that focuses on casualty risks in the excess and surplus lines market. The acquisition would provide Validus with a U.S. platform from which to distribute specialty short-tail primary insurance products. Through a combination of strategic acquisitions and organic growth, Validus has expanded quickly into one of the largest global providers of catastrophe and other short-tail reinsurance. However, the company remains significantlysmaller than many of its global competitors in the reinsurance and primary insurance markets.
Reinsurer M&A Transactions Completed or Announced in 2014Buyer Target Business Close Date
Arch Capital CMG Mortgage U.S. mortgage insurance Jan 2014
White Mountains Star & Shield Florida reciprocal insurance exchange Jan 2014
XL Re Global Ag U.S. crop insurance Feb 2014
Catalina Alea Group Runoffreinsurance Mar 2014
Enstar Torus Insurance Global specialty (re)insurance April 2014
Sompo Japan Canopius Lloyd’s specialty May 2014
GreyCastle XL Life Reinsurance U.K.andIrishrunofflifereinsurance Jun 2014
Lennox Investments Southport Re Collateralized reinsurance 2Q14
ACP Re Tower Group Global (re)insurance 3Q14 (Expected)
Catalina SPARTA Insurance U.S. specialty program 3Q14 (Expected)
Validus Western World U.S. excess and surplus lines 4Q14 (Expected)
Banco BTG Pactual Ariel Re Reinsurance and Lloyd’s 2H14 (Expected)
Armour Group OneBeacon Runoffbusiness 2H14 (Expected)
Allied World RSA Insurance Group Hong Kong and Singapore operations 1H15 (Expected)
M&A - Merger and acquisition. Source: Company data, Fitch.
Global Reinsurance Guide 201527
Enstar Group Ltd.’s acquisition of Torus Insurance Holdings Ltd. (Torus), an active global specialty (re)insurer formed in 2008, also was notable. Torus has been challenged to achieve profitabilitydue to an uncompetitively high operating expense structure, and Enstar is in the process of shifting Torus’ strategy to concentrate on profitablelines,reducecostsandimprovemanagement.EnstarisaBermuda-based company whose core business involves acquiring andmanaging runoff insuranceand reinsurancecompaniesandbusinesses. Recently, Enstar has added active entities, including Atrium Underwriting Group Ltd. late in 2013, that, in addition to Torus, the company anticipates will enhance opportunities available in its core legacy business.
Alternative Reinsurance Provides OpportunitiesAn area that has witnessed an uptick in M&A activity is the convergence between traditional reinsurers and capital markets. One notable example is ACGL’s recent cosponsor (11% ownership interest) of a new Bermuda-domiciled reinsurer, Watford Re Ltd., which is focused on longer-tail, multi-line casualty reinsurance business.Theseandotherstructuresallowforamoreefficientandflexiblemethod for reinsurers tomanagecapacity. Fitchexpectsthis trend to continue, as most reinsurers have accepted that the dynamics of the reinsurance marketplace have structurally changed and thus are looking for ways to match their client needs to the appropriate capital, be it traditional or nontraditional.
Further discussion of the alternative reinsurance market can be found in Fitch’s upcoming report, Alternative Reinsurance 2014 Market Update, to be published in early September and made availableatwww.fitchratings.com.
Reinsurer Mergers and Acquisitions
Global Reinsurance Guide 2015 28
Softening Premium Rates with Greater Foreign InterestSoft Rates Spur Demand: Premium rates for regional reinsurance policies renewed during 2014 have fallen to a plateau. The softening rates were largely attributable to a decrease in the frequency and severity of natural catastrophes in the region since 2011, and plentiful reinsurance capacity through new start-ups and Asian operations set up by global reinsurers. Several companies have taken advantage of the current market to expand their reinsurance coverage at a lower cost.
Growth Momentum Lures Interest: There is increasing foreign interest in setting up operations in the region. The growth momentum of the Asian reinsurance markets is strong, with increasing risk awareness and continued market demand by the cedants, spurred by frequent occurrences of natural catastrophes in the region. Many Asian markets offer vast growth potential,including the relatively untapped Chinese and Indonesian markets.
Emergence of Catastrophe Bonds: Thepotentialfinancialimpactcaused by natural catastrophes has led to a review of risk appetite and management strategy for both the insurers and reinsurers. Someoftheinsurersarelookingforalternativediversifiedsourcesof funding, to reduce their heavy dependence on reinsurers. During 1H14, several catastrophe bonds were issued in Japan. These cover various catastrophe risks such as earthquakes and typhoons.
Aviation Catastrophes Pose Risks: Aviation reinsurance rates look set to increase during the next renewal period, although the size of the increase is unclear. At least four plane mishaps have happened so far in 2014, two Malaysian Airlines planes, one
TransAsiaAirwaysplane,andoneAirAlgerieflight.Thelossesfromeach of these incidents are still being calculated but are likely to cost the (re)insurance industry of at least USD1bn in aggregate.
Positive Evolution of Regulations: The regulatory environment in the region has been gradually updated as regulators strive to improve the overall financial health and risk managementcapabilities of companies in the industry. Fitch Ratings believes that various regulatory initiatives could indirectly lead to an increase in demand for reinsurance in Asia as direct insurers review their risk management strategies and appetite, which could lead them to transfer more risk to reinsurers.
Data Limitations Pose Constraints: Fitch believes that reinsurers in Asia continue to face the problem of limited data availability to more accurately model and manage their catastrophe risks, while they grapple with the aftermath of the catastrophes. Compilation of more comprehensive statistics should improve as the markets evolve.
Solid Reinsurance Business Growth Opportunities
Fitch views the growth potential of the reinsurance market in Asia as enormous given the relatively low insurance penetration in Asian markets compared with the more established markets of the US and UK. There is increasing risk awareness and continued demand for reinsurance protection by the direct insurance companies in the region, especially in the wake of multiple natural catastrophes that have occurred in recent years The growing Asian economieswith increasing spending power/wealth affluence ofthe population fuels further demand for insurance protection.
Asian economies constituted an important component of the global economy (34.6% of global GDP), with 59.7% of the world’s total population in 2013. However, the total insurance penetration rate in Asia, at 5.4% in 2013, was well below that of the more established markets in the world (US: 7.5%; UK: 11.5%). Three of the most densely populated emerging markets in Asia, China, India, and Indonesia, had relatively low penetration rates (from 2.1%-3.9%). These markets, with rising household income and rapid industrialisation, contain 40.5% of the world’s population and 66.8% of Asia’s population.
Reinsurance coverage in Asia is insignificant compared withglobal reinsurance coverage. Asia and Australia are estimated to contribute about 10%-15% of global reinsurance premiums, according to industry estimates.
Analysts Siew Wai Wan, CFA+65 6796 [email protected]
Jeffrey Liew+852 2263 [email protected]
The vast growth potential for Asian reinsurance markets has attracted interest from foreign companies to broaden their operations in the region.
1Source:SwissReSigmaNo4/2013
Asian Reinsurance Markets
Related Criteria Insurance Rating Methodology (September 2014)
Related Research
2015 Outlook: Global Reinsurance (September 2014)Alternative Reinsurance 2014 Market Update (September 2014) Global Reinsurance’s Shifting Landscape (September 2014)Latin American Reinsurance (September 2014)Reinsurer Mergers and Acquisitions (August 2014)Global Reinsurers’ Mid-Year 2014 Financial Results (August 2014)
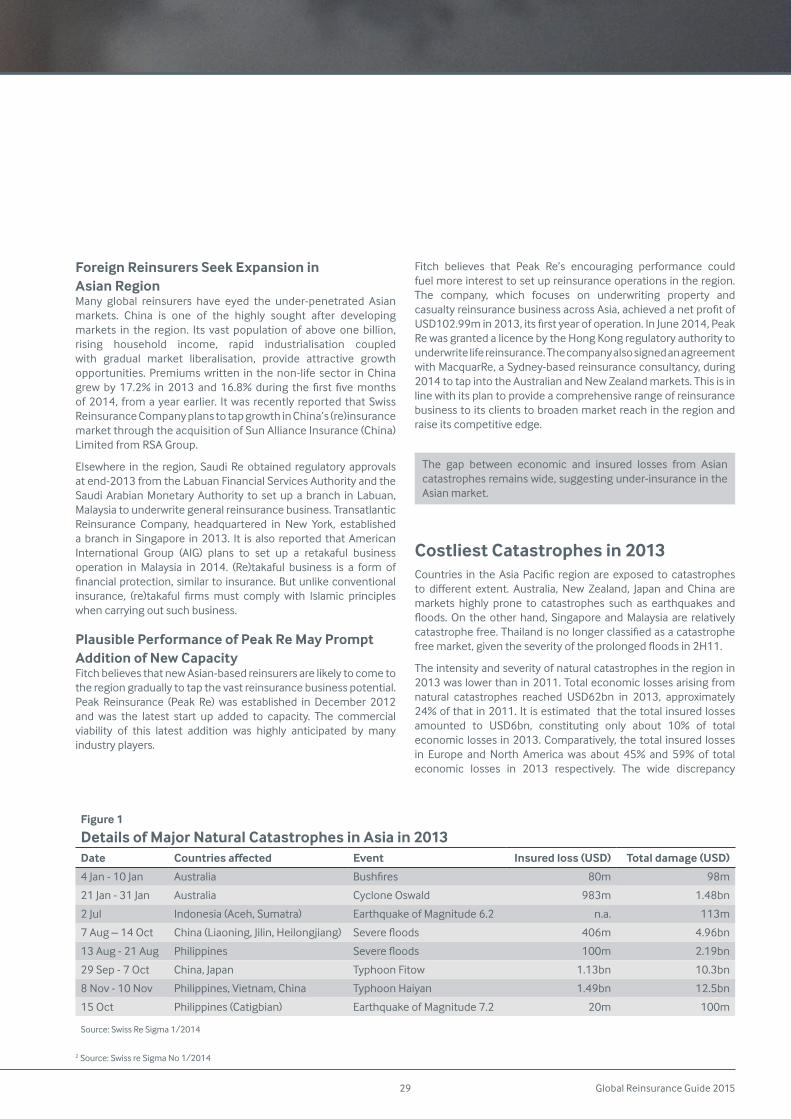
Global Reinsurance Guide 201529
Foreign Reinsurers Seek Expansion in Asian RegionMany global reinsurers have eyed the under-penetrated Asian markets. China is one of the highly sought after developing markets in the region. Its vast population of above one billion, rising household income, rapid industrialisation coupled with gradual market liberalisation, provide attractive growth opportunities. Premiums written in the non-life sector in China grewby17.2% in2013and16.8%during the first fivemonthsof 2014, from a year earlier. It was recently reported that Swiss Reinsurance Company plans to tap growth in China’s (re)insurance market through the acquisition of Sun Alliance Insurance (China) Limited from RSA Group.
Elsewhere in the region, Saudi Re obtained regulatory approvals at end-2013 from the Labuan Financial Services Authority and the Saudi Arabian Monetary Authority to set up a branch in Labuan, Malaysia to underwrite general reinsurance business. Transatlantic Reinsurance Company, headquartered in New York, establisheda branch in Singapore in 2013. It is also reported that American International Group (AIG) plans to set up a retakaful business operation in Malaysia in 2014. (Re)takaful business is a form of financialprotection,similartoinsurance.Butunlikeconventionalinsurance, (re)takaful firms must comply with Islamic principleswhen carrying out such business.
Plausible Performance of Peak Re May Prompt Addition of New Capacity Fitch believes that new Asian-based reinsurers are likely to come to the region gradually to tap the vast reinsurance business potential. Peak Reinsurance (Peak Re) was established in December 2012 and was the latest start up added to capacity. The commercial viability of this latest addition was highly anticipated by many industry players.
Fitch believes that Peak Re’s encouraging performance could fuel more interest to set up reinsurance operations in the region. The company, which focuses on underwriting property and casualtyreinsurancebusinessacrossAsia,achievedanetprofitofUSD102.99min2013,itsfirstyearofoperation.InJune2014,PeakRe was granted a licence by the Hong Kong regulatory authority to underwrite life reinsurance. The company also signed an agreement with MacquarRe, a Sydney-based reinsurance consultancy, during 2014totapintotheAustralianandNewZealandmarkets.Thisisinline with its plan to provide a comprehensive range of reinsurance business to its clients to broaden market reach in the region and raise its competitive edge.
Costliest Catastrophes in 2013 Countries in theAsiaPacific regionareexposed tocatastrophesto different extent. Australia, New Zealand, Japan and China aremarkets highly prone to catastrophes such as earthquakes and floods.On theotherhand, SingaporeandMalaysia are relativelycatastrophefree.Thailandisnolongerclassifiedasacatastrophefreemarket,giventheseverityoftheprolongedfloodsin2H11.
The intensity and severity of natural catastrophes in the region in 2013 was lower than in 2011. Total economic losses arising from natural catastrophes reached USD62bn in 2013, approximately 24% of that in 2011. It is estimated that the total insured losses amounted to USD6bn, constituting only about 10% of total economic losses in 2013. Comparatively, the total insured losses in Europe and North America was about 45% and 59% of totaleconomic losses in 2013 respectively. The wide discrepancy
The gap between economic and insured losses from Asian catastrophes remains wide, suggesting under-insurance in the Asian market.
2Source:SwissreSigmaNo1/2014
Figure 1
Details of Major Natural Catastrophes in Asia in 2013Date Countries affected Event Insured loss (USD) Total damage (USD)
4 Jan - 10 Jan Australia Bushfires 80m 98m
21 Jan - 31 Jan Australia Cyclone Oswald 983m 1.48bn
2 Jul Indonesia (Aceh, Sumatra) Earthquake of Magnitude 6.2 n.a. 113m
7 Aug – 14 Oct China (Liaoning, Jilin, Heilongjiang) Severefloods 406m 4.96bn
13 Aug - 21 Aug Philippines Severefloods 100m 2.19bn
29 Sep - 7 Oct China, Japan Typhoon Fitow 1.13bn 10.3bn
8Nov-10Nov Philippines, Vietnam, China Typhoon Haiyan 1.49bn 12.5bn
15 Oct Philippines (Catigbian) Earthquake of Magnitude 7.2 20m 100m
Source: Swiss Re Sigma 1/2014
Global Reinsurance Guide 2015 30
between the insured and economic losses in Asia indicates that the region has a lot of catching up in terms of insurance penetration.
Fitch believes that the continued occurrence of natural catastrophes and vast disparity of the insured losses and total economic losses heightens the awareness of the importance of (re)insurance protection and risk management. This will prompt direct insurers to work more closely with the reinsurers to adopt appropriate risk transfer and capital preservation strategies. This will act as catalyst for the growth of direct insurance and reinsurance businesses, supported by the increasing affluenceand stable economic conditions in Asian markets.
Insurers Pick Up Additional Coverage Amid Soft Premium Rates
The agency expects premium pricing rates in the region to remain flat or soften slightly in 2014 in the absence of severe naturalcatastrophes in 2012/2013. In Japan, the earthquake and wind/floodpolicieswererenewedinApril2014at10%-20%discountsinpremiumrates,reflectingthebenigncatastropheenvironmentin2013, and healthy reinsurance capacity. In Australia the renewals of main property catastrophe policies took place in July 2014. Those policies renewed in January 2014were generally offered at 5%-10% discounts. The full impact of the premium price negotiations for the July renewals is not yet known, but Fitch expects some rate declines, as the reinsurance pricing cycle stays at the trough.
The cheaper reinsurance rates are welcomed by the direct insurers and, some took the opportunity to purchase additional reinsurance covers to better equip themselves for the next Asian natural calamity. For instance, it was reported that Insurance Australia Group (IAG) added an extra AUD600m to its reinsurance protection, from AUD5bn to AUD5.6bn in 2014. New Zealand’sgovernment-owned Earthquake Commission raised its reinsurance capacityinJune2014byabout38%toNZD4.5bn(USD3.9bn)fromNZD3.25bntotakeadvantageofthesofterpremiumrates.
Fitch observes that reinsurers are gradually reducing their participation in proportional reinsurance, while increasing their non-proportional business. Under the latter, reinsurers would only be affected should the direct cedants or insurance companies’insured losses exceed a certain predetermined level, as opposed to taking a proportional share of the losses incurred by the cedants.
Expectation of Aviation Rate Increase Following Recent Plane MishapsFitch believes that aviation reinsurance rates are likely to harden during the next renewal period although the extent of the likely increases is still unclear. This mainly results from several back-to-back plane mishaps in 2014. However, it is unlikely that this series of incidents would rattle the reinsurance sector. Based on industry practice, the aviation risks are typically spread out among a consortium of players, with none of them taking an excessive share in a single risk.
A Malaysian Airlines aircraft, MH370, which disappeared in the Indian Ocean in March 2014, is likely to incur insurance claims of USD400m-USD500m based on industry estimates. Another
Malaysian Airlines aircraft, MH17, which was shot down by a missileinJuly2014whileflyingoverUkraine,couldregistersimilarlosses. In the same month, there were two other plane crashes, a TransAsiaAirwaysplaneGE222andAirAlgerieflightAH5017.Thelosses of the latter two are still being tabulated.
Interest in Alternative Sources of Capital Igniting in Catastrophe Prone MarketsFitch observes an emerging trend for insurers to issue catastrophe bonds, notably in Japan, as an alternative source of direct funding. While this helps to reduce reliance on the reinsurers, the agency thinks that the reinsurers still play a critical role in the insurance risk transfer mechanism and they are unlikely to be eliminated. The expertise and technical know-how of reinsurers are especially needed to structure risks that are more complex in nature.
During 1H14, three catastrophe bonds were issued in Japan: from Zenkyoren, the largest Japanese Cooperative (USD300m of bonds forJapaneseearthquakerisks);SompoJapanNipponKoa(USD100mof bonds for Typhoon risks), and Tokio Marine (USD245m of bonds for Japanese earthquake risks). These bonds were fully taken up by the market. If no catastrophe occurs during the duration of the bonds, the insurer would pay a pre-determined coupon to the bond holders. However, in the event of a catastrophe, all or part of the principal amount would be forsaken by the bondholders for the insurer to pay the catastrophe related claims.
Update on Thai Reinsurance Market After 2011 Thai FloodsThailand experienced one of the most severe and prolonged floods, which affected the country’s 65 provinces in 2H11.Insured losses and economic losses are estimated at USD16.2bn and USD49.6bn respectively, resulting in the largest flood lossevent since 1970. The majority of the insured losses were paid in 2012/2013.AccordingtothelatestinformationfromtheOfficeofInsurance Commission (OIC), 93.4% of the total claims have been paid to date.
Premium rates on natural catastrophe policies in Thailand rose in 2012/2013followingthe2011floods.Eventlimitswereimposed,withreinsurersgenerallylimitingtheleveloffloodcoveragetolessthan 100% of total loss. The premium rates have since fallen close topre-floodlevelsgiventhelackofseverefloodsin2012/2013,as well as the availability of reinsurance capacity in the region. However, event limits remain as an underwriting term/condition as a consequence of enhanced risk management by the reinsurers.
Heat is on Political Violence Cover
Fitch thinks that an emerging key growth driver for the Thai (re)insurance market is political violence cover. The prolonged anti-government protest from late 2013, which led to the introduction of martial law and the coup in May 2014, has resulted in a number of deaths and over a hundred injured. The financial impact from the protest is estimated by the TourismAuthority of Thailand to exceed USD1bn. GDP contracted by 0.6% in 1H14 from a year earlier.
Premium rates on political violence policies remain high as a result of the political instability in Thailand. According to Muang Thai Insurance,oneof themajor insurers inThailandwhooffersthis type of insurance, demand for political violence insurance
The premium rates of reinsurance policies renewed in 2014 wereflat/fellslightlycomparedtotheprioryear.
Global Reinsurance Guide 201531
has increased substantially in the past three years. The company’s premium income from political violence insurance is expected at THB300m (USD9.25m) in 2013, up from THB200m and THB140m in 2012 and 2011 respectively.
Implementation of Regulatory Initiatives a Credit Positive
Fitch views positively the various regulatory initiatives that have been implemented to boost the overall financial health andtransparency of (re)insurance markets. These regulations are likely to propel the demand for technical expertise, risk transfer, and reinsurance capacity by direct insurers to meet the higher regulatory requirements.
Raising the Regulatory Capital StandardsIn Indonesia, reinsurers will be required to meet the minimum regulatory capital requirement of IDR200bn by end-2014, from IDR150bn in 2012 and IDR100bn in 2010. Fitch does not envisage the rated reinsurers in Indonesia having problems meeting the higher regulatory capital requirement by the stipulated deadline.
In China, the insurance regulator is planning to introduce a risk-based capital framework (RBC), China Risk-Oriented Solvency System(C-ROSS),in2014.Whilethenewcapitalregimewillaffectindividual insurers’ capital adequacy, its impact on the capital requirement for the market as a whole is uncertain.
Fitch believes that as property lines will attract higher risk charges under the proposed framework, direct insurers will employ reinsurance as a means to transfer their underwriting risk for property business and reduce the strain on the capital requirements. This implies that the demand for property reinsurance will remain strong. Based on the proposed risk charge for motor insurance, the required capital for underwriting motor business is likely to decrease. Consequently, the agency believes that the demand for motor reinsurance is likely to fall.
Since 2013, the Australian Prudential Regulation Authority’s RBC regime has required each insurer to set aside a certain amount of capital to adequately cover its net retention based on a single large 1-in-200-year catastrophic event, or accumulated from a series of smaller loss events. This additional capital component introduced by the regulator highlights the critical need for insurers to set asidesufficientcapitalresourcestomitigatethefinancial impactof unexpected catastrophes.
Formulation of Catastrophe Funds and Policy In Thailand the government set up the National CatastropheInsuranceFund(NCIF)in2012toimprovetheindustry’sfinancialbuffer to better cope with future catastrophes. The fund actsas a reinsurer, offering coverage for damages caused by threenatural disasters: floods, earthquakes, and damaging winds, forhouseholds, SMEs, and industry sectors. The objective is to provide sufficientreinsurancecapacityataffordablepremiumrates,andtoprovide easy access to catastrophe insurance to households and businesses. NCIF had a sum insured of THB81.3bn as of 9 April2013.FitchthinkstheamountofsuminsuredviaNCIFislikelyto
fall with softening premium rates in the market, as policyholders haveeasieraccesstoaffordablepoliciesoutsideNCIF.
In China, the China Insurance Regulatory Commission is keen to establish natural catastrophe insurance schemes that cover specificregionswithintheChinamarket. In July2014,Shenzhenrolled out a government-funded catastrophe insurance policy with PICC Property and Casualty Co Ltd to cover the claims of all citizens in the region resulting from various catastrophes such as earthquakes, typhoons, and tsunamis. The government will also set up a catastrophe fund in Shenzhen to supplement the insurance policy.
Regulatory initiatives lead to a rethink of risk management/appetite and could possibly spur demand for reinsurance.
Asian Reinsurance Markets
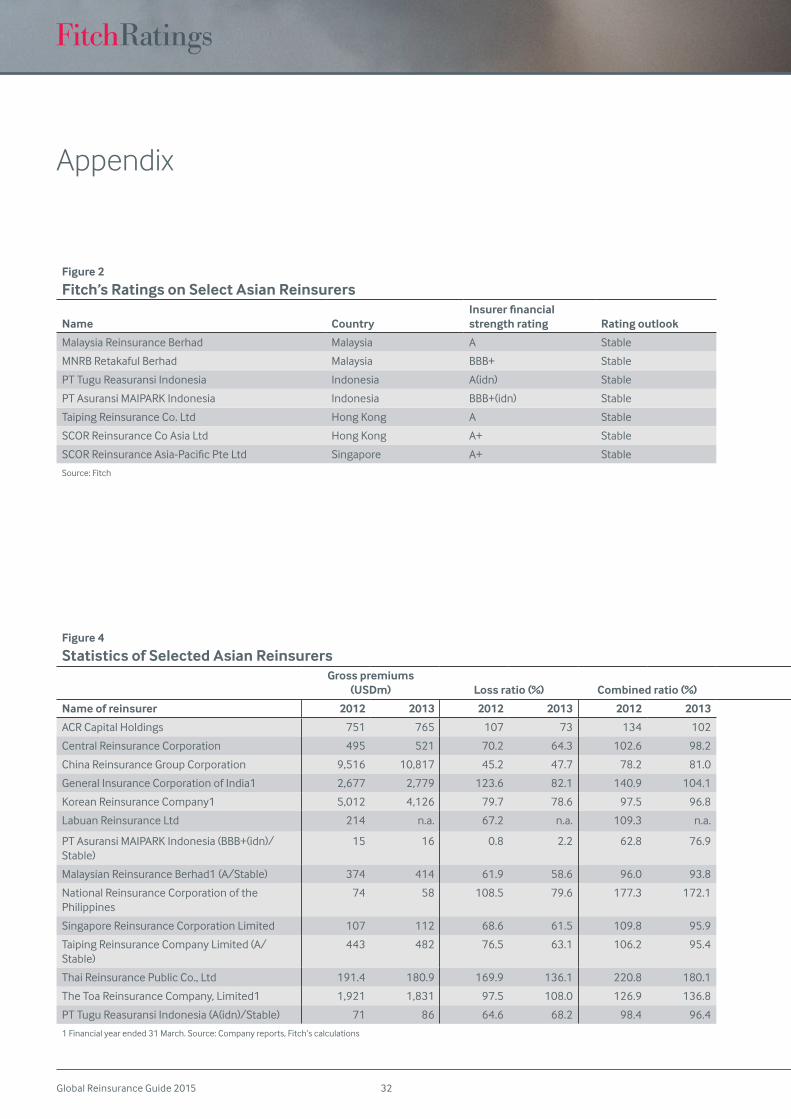
Global Reinsurance Guide 2015 32
Figure 4
Statistics of Selected Asian ReinsurersGross premiums
(USDm) Loss ratio (%) Combined ratio (%)NPW/SH equity
(%)NPW/GPW
(retention ratio) (%)ROE (ie. net income/
SH equity) (%)SH equity/
total asset (%)
Name of reinsurer 2012 2013 2012 2013 2012 2013 Name of reinsurer 2012 2013 2012 2013 2012 2013 2012 2013
ACR Capital Holdings 751 765 107 73 134 102 ACR Capital Holdings 92 49 67 51 -25.0 7.0 23.5 31.3
Central Reinsurance Corporation 495 521 70.2 64.3 102.6 98.2 Central Reinsurance Corporation 167.7 163.2 93.3 94.2 8.5 8.1 24.9 27.4
China Reinsurance Group Corporation 9,516 10,817 45.2 47.7 78.2 81.0 China Reinsurance Group Corporation 128.5 139.1 95.9 94.7 5.2 7.4 29.9 29.7
General Insurance Corporation of India1 2,677 2,779 123.6 82.1 140.9 104.1 General Insurance Corporation of India1 163.4 142.6 92.2 91.3 -32.1 24.3 14.3 16.1
Korean Reinsurance Company1 5,012 4,126 79.7 78.6 97.5 96.8 Korean Reinsurance Company1 265.0 199.7 66.3 63.4 3.0 2.9 19.3 19.0
Labuan Reinsurance Ltd 214 n.a. 67.2 n.a. 109.3 n.a. Labuan Reinsurance Ltd 127.1 n.a. 83.2 n.a. 0.4 n.a. 22.4 n.a.
PT Asuransi MAIPARK Indonesia (BBB+(idn)/Stable)
15 16 0.8 2.2 62.8 76.9 PT Asuransi MAIPARK Indonesia (BBB+(idn)/Stable)
56.3 46.8 68.1 52.5 19.8 19.5 62.2 64.1
Malaysian Reinsurance Berhad1 (A/Stable) 374 414 61.9 58.6 96.0 93.8 Malaysian Reinsurance Berhad1 (A/Stable) 99.1 104.2 83.5 85.5 11.7 11.8 41.4 40.5
NationalReinsuranceCorporationofthePhilippines
74 58 108.5 79.6 177.3 172.1 NationalReinsuranceCorporationofthePhilippines
13.1 14.4 25.7 32.0 0.6 0.3 38.0 39.0
Singapore Reinsurance Corporation Limited 107 112 68.6 61.5 109.8 95.9 Singapore Reinsurance Corporation Limited 23.1 23.4 37.1 37.3 5.4 9.2 30.3 31.2
Taiping Reinsurance Company Limited (A/Stable)
443 482 76.5 63.1 106.2 95.4 Taiping Reinsurance Company Limited (A/Stable)
100.5 87.0 89.5 90.7 3.7 10.4 34.1 38.5
Thai Reinsurance Public Co., Ltd 191.4 180.9 169.9 136.1 220.8 180.1 Thai Reinsurance Public Co., Ltd 153.5 196.2 85.6 93.8 -124.4 -99.0 10.4 10.1
The Toa Reinsurance Company, Limited1 1,921 1,831 97.5 108.0 126.9 136.8 The Toa Reinsurance Company, Limited1 79.1 74.3 84.2 76.0 -7.1 2.5 34.1 37.2
PT Tugu Reasuransi Indonesia (A(idn)/Stable) 71 86 64.6 68.2 98.4 96.4 PT Tugu Reasuransi Indonesia (A(idn)/Stable) 239.4 342.8 82.2 83.5 19.2 25.6 23.1 16.9
1 Financial year ended 31 March. Source: Company reports, Fitch’s calculations
Appendix
Figure 2
Fitch’s Ratings on Select Asian Reinsurers
Name CountryInsurer financial strength rating Rating outlook
Malaysia Reinsurance Berhad Malaysia A Stable
MNRBRetakafulBerhad Malaysia BBB+ Stable
PT Tugu Reasuransi Indonesia Indonesia A(idn) Stable
PT Asuransi MAIPARK Indonesia Indonesia BBB+(idn) Stable
Taiping Reinsurance Co. Ltd Hong Kong A Stable
SCOR Reinsurance Co Asia Ltd Hong Kong A+ Stable
SCORReinsuranceAsia-PacificPteLtd Singapore A+ Stable
Source: Fitch
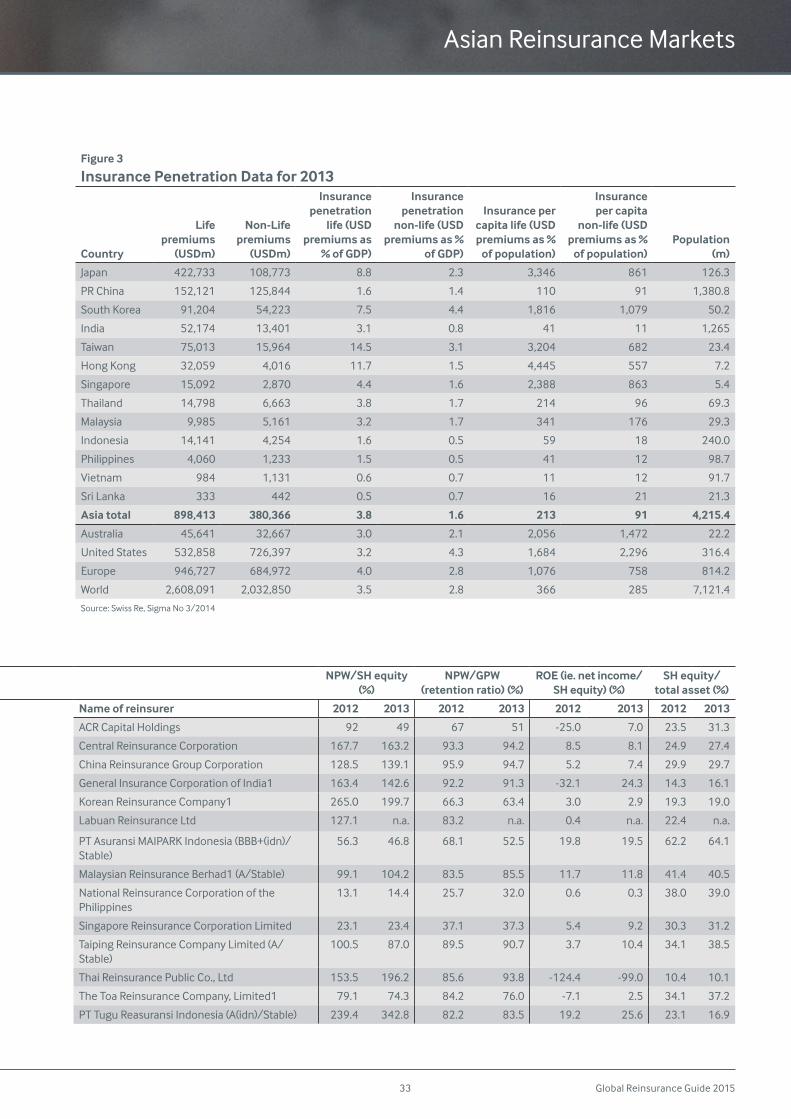
Global Reinsurance Guide 201533
Figure 4
Statistics of Selected Asian ReinsurersGross premiums
(USDm) Loss ratio (%) Combined ratio (%)NPW/SH equity
(%)NPW/GPW
(retention ratio) (%)ROE (ie. net income/
SH equity) (%)SH equity/
total asset (%)
Name of reinsurer 2012 2013 2012 2013 2012 2013 Name of reinsurer 2012 2013 2012 2013 2012 2013 2012 2013
ACR Capital Holdings 751 765 107 73 134 102 ACR Capital Holdings 92 49 67 51 -25.0 7.0 23.5 31.3
Central Reinsurance Corporation 495 521 70.2 64.3 102.6 98.2 Central Reinsurance Corporation 167.7 163.2 93.3 94.2 8.5 8.1 24.9 27.4
China Reinsurance Group Corporation 9,516 10,817 45.2 47.7 78.2 81.0 China Reinsurance Group Corporation 128.5 139.1 95.9 94.7 5.2 7.4 29.9 29.7
General Insurance Corporation of India1 2,677 2,779 123.6 82.1 140.9 104.1 General Insurance Corporation of India1 163.4 142.6 92.2 91.3 -32.1 24.3 14.3 16.1
Korean Reinsurance Company1 5,012 4,126 79.7 78.6 97.5 96.8 Korean Reinsurance Company1 265.0 199.7 66.3 63.4 3.0 2.9 19.3 19.0
Labuan Reinsurance Ltd 214 n.a. 67.2 n.a. 109.3 n.a. Labuan Reinsurance Ltd 127.1 n.a. 83.2 n.a. 0.4 n.a. 22.4 n.a.
PT Asuransi MAIPARK Indonesia (BBB+(idn)/Stable)
15 16 0.8 2.2 62.8 76.9 PT Asuransi MAIPARK Indonesia (BBB+(idn)/Stable)
56.3 46.8 68.1 52.5 19.8 19.5 62.2 64.1
Malaysian Reinsurance Berhad1 (A/Stable) 374 414 61.9 58.6 96.0 93.8 Malaysian Reinsurance Berhad1 (A/Stable) 99.1 104.2 83.5 85.5 11.7 11.8 41.4 40.5
NationalReinsuranceCorporationofthePhilippines
74 58 108.5 79.6 177.3 172.1 NationalReinsuranceCorporationofthePhilippines
13.1 14.4 25.7 32.0 0.6 0.3 38.0 39.0
Singapore Reinsurance Corporation Limited 107 112 68.6 61.5 109.8 95.9 Singapore Reinsurance Corporation Limited 23.1 23.4 37.1 37.3 5.4 9.2 30.3 31.2
Taiping Reinsurance Company Limited (A/Stable)
443 482 76.5 63.1 106.2 95.4 Taiping Reinsurance Company Limited (A/Stable)
100.5 87.0 89.5 90.7 3.7 10.4 34.1 38.5
Thai Reinsurance Public Co., Ltd 191.4 180.9 169.9 136.1 220.8 180.1 Thai Reinsurance Public Co., Ltd 153.5 196.2 85.6 93.8 -124.4 -99.0 10.4 10.1
The Toa Reinsurance Company, Limited1 1,921 1,831 97.5 108.0 126.9 136.8 The Toa Reinsurance Company, Limited1 79.1 74.3 84.2 76.0 -7.1 2.5 34.1 37.2
PT Tugu Reasuransi Indonesia (A(idn)/Stable) 71 86 64.6 68.2 98.4 96.4 PT Tugu Reasuransi Indonesia (A(idn)/Stable) 239.4 342.8 82.2 83.5 19.2 25.6 23.1 16.9
1 Financial year ended 31 March. Source: Company reports, Fitch’s calculations
Asian Reinsurance Markets
Figure 3
Insurance Penetration Data for 2013
Country
Life premiums
(USDm)
Non-Life premiums
(USDm)
Insurance penetration
life (USD premiums as
% of GDP)
Insurance penetration
non-life (USD premiums as %
of GDP)
Insurance per capita life (USD premiums as %
of population)
Insurance per capita
non-life (USD premiums as %
of population)Population
(m)
Japan 422,733 108,773 8.8 2.3 3,346 861 126.3
PR China 152,121 125,844 1.6 1.4 110 91 1,380.8
South Korea 91,204 54,223 7.5 4.4 1,816 1,079 50.2
India 52,174 13,401 3.1 0.8 41 11 1,265
Taiwan 75,013 15,964 14.5 3.1 3,204 682 23.4
Hong Kong 32,059 4,016 11.7 1.5 4,445 557 7.2
Singapore 15,092 2,870 4.4 1.6 2,388 863 5.4
Thailand 14,798 6,663 3.8 1.7 214 96 69.3
Malaysia 9,985 5,161 3.2 1.7 341 176 29.3
Indonesia 14,141 4,254 1.6 0.5 59 18 240.0
Philippines 4,060 1,233 1.5 0.5 41 12 98.7
Vietnam 984 1,131 0.6 0.7 11 12 91.7
Sri Lanka 333 442 0.5 0.7 16 21 21.3
Asia total 898,413 380,366 3.8 1.6 213 91 4,215.4
Australia 45,641 32,667 3.0 2.1 2,056 1,472 22.2
United States 532,858 726,397 3.2 4.3 1,684 2,296 316.4
Europe 946,727 684,972 4.0 2.8 1,076 758 814.2
World 2,608,091 2,032,850 3.5 2.8 366 285 7,121.4
Source:SwissRe,SigmaNo3/2014
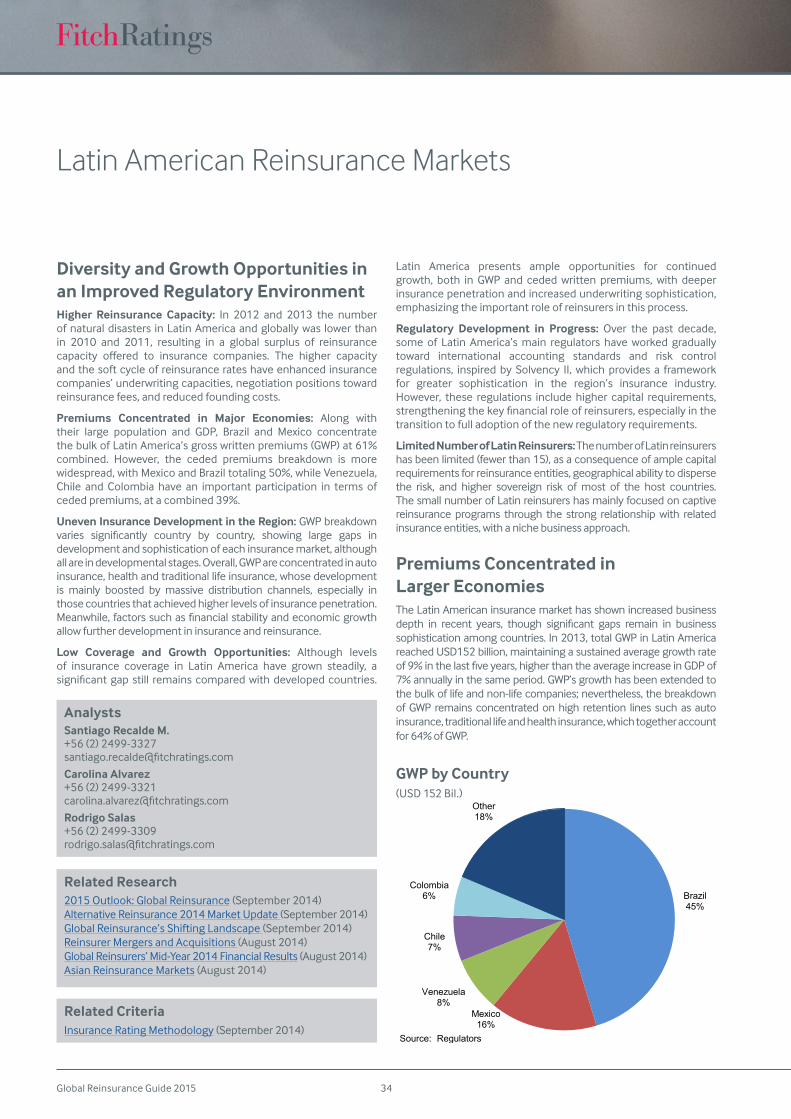
Global Reinsurance Guide 2015 34
Latin American Reinsurance Markets
Diversity and Growth Opportunities in an Improved Regulatory EnvironmentHigher Reinsurance Capacity: In 2012 and 2013 the number of natural disasters in Latin America and globally was lower than in 2010 and 2011, resulting in a global surplus of reinsurance capacity offered to insurance companies. The higher capacityand the soft cycle of reinsurance rates have enhanced insurance companies’ underwriting capacities, negotiation positions toward reinsurance fees, and reduced founding costs.
Premiums Concentrated in Major Economies: Along with their large population and GDP, Brazil and Mexico concentrate the bulk of Latin America’s gross written premiums (GWP) at 61% combined. However, the ceded premiums breakdown is more widespread, with Mexico and Brazil totaling 50%, while Venezuela, Chile and Colombia have an important participation in terms of ceded premiums, at a combined 39%.
Uneven Insurance Development in the Region: GWP breakdown varies significantly country by country, showing large gaps indevelopment and sophistication of each insurance market, although all are in developmental stages. Overall, GWP are concentrated in auto insurance, health and traditional life insurance, whose development is mainly boosted by massive distribution channels, especially in those countries that achieved higher levels of insurance penetration. Meanwhile,factorssuchasfinancialstabilityandeconomicgrowthallow further development in insurance and reinsurance.
Low Coverage and Growth Opportunities: Although levels of insurance coverage in Latin America have grown steadily, a significantgapstill remainscomparedwithdevelopedcountries.
Latin America presents ample opportunities for continued growth, both in GWP and ceded written premiums, with deeper insurance penetration and increased underwriting sophistication, emphasizing the important role of reinsurers in this process.
Regulatory Development in Progress: Over the past decade, some of Latin America’s main regulators have worked gradually toward international accounting standards and risk control regulations, inspired by Solvency II, which provides a framework for greater sophistication in the region’s insurance industry. However, these regulations include higher capital requirements, strengtheningthekeyfinancialroleofreinsurers,especiallyinthetransition to full adoption of the new regulatory requirements.
Limited Number of Latin Reinsurers: The number of Latin reinsurers has been limited (fewer than 15), as a consequence of ample capital requirements for reinsurance entities, geographical ability to disperse the risk, and higher sovereign risk of most of the host countries. The small number of Latin reinsurers has mainly focused on captive reinsurance programs through the strong relationship with related insurance entities, with a niche business approach.
Premiums Concentrated in Larger EconomiesThe Latin American insurance market has shown increased business depth in recent years, though significant gaps remain in businesssophistication among countries. In 2013, total GWP in Latin America reached USD152 billion, maintaining a sustained average growth rate of9%inthelastfiveyears,higherthantheaverageincreaseinGDPof7% annually in the same period. GWP’s growth has been extended to the bulk of life and non-life companies; nevertheless, the breakdown of GWP remains concentrated on high retention lines such as auto insurance, traditional life and health insurance, which together account for 64% of GWP.
AnalystsSantiago Recalde M.+56 (2) 2499-3327 [email protected]
Carolina Alvarez +56 (2) 2499-3321 [email protected]
Rodrigo Salas +56 (2) 2499-3309 [email protected]
Brazil45%
Mexico16%
Venezuela8%
Chile7%
Colombia6%
Other18%
Source: Regulators
GWP by Country (USD 152 Bil.)
Related Research2015 Outlook: Global Reinsurance (September 2014)Alternative Reinsurance 2014 Market Update (September 2014) Global Reinsurance’s Shifting Landscape (September 2014)Reinsurer Mergers and Acquisitions (August 2014)Global Reinsurers’ Mid-Year 2014 Financial Results (August 2014)Asian Reinsurance Markets (August 2014)
Related CriteriaInsurance Rating Methodology (September 2014)
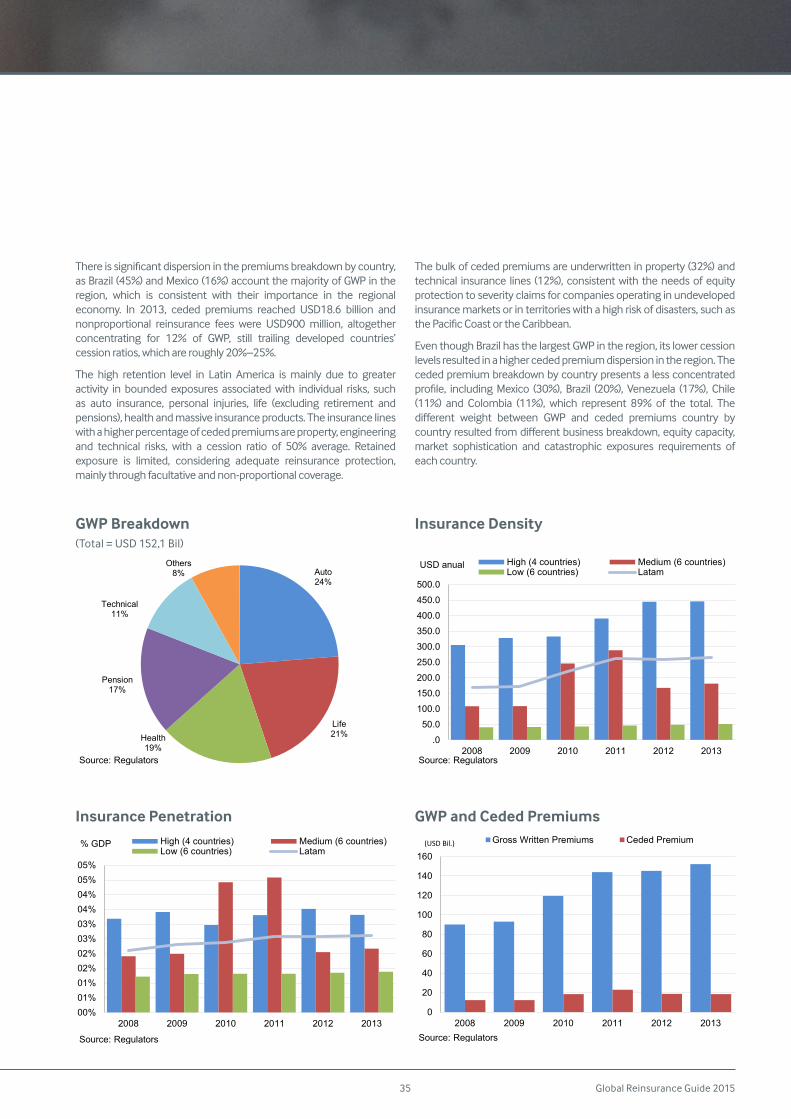
Global Reinsurance Guide 201535
Thereissignificantdispersioninthepremiumsbreakdownbycountry,as Brazil (45%) and Mexico (16%) account the majority of GWP in the region, which is consistent with their importance in the regional economy. In 2013, ceded premiums reached USD18.6 billion and nonproportional reinsurance fees were USD900 million, altogether concentrating for 12% of GWP, still trailing developed countries’ cession ratios, which are roughly 20%–25%.
The high retention level in Latin America is mainly due to greater activity in bounded exposures associated with individual risks, such as auto insurance, personal injuries, life (excluding retirement and pensions), health and massive insurance products. The insurance lines with a higher percentage of ceded premiums are property, engineering and technical risks, with a cession ratio of 50% average. Retained exposure is limited, considering adequate reinsurance protection, mainly through facultative and non-proportional coverage.
The bulk of ceded premiums are underwritten in property (32%) and technical insurance lines (12%), consistent with the needs of equity protection to severity claims for companies operating in undeveloped insurance markets or in territories with a high risk of disasters, such as thePacificCoastortheCaribbean.
Even though Brazil has the largest GWP in the region, its lower cession levels resulted in a higher ceded premium dispersion in the region. The ceded premium breakdown by country presents a less concentrated profile, includingMexico (30%), Brazil (20%), Venezuela (17%), Chile(11%) and Colombia (11%), which represent 89% of the total. The different weight between GWP and ceded premiums country bycountryresultedfromdifferentbusinessbreakdown,equitycapacity,market sophistication and catastrophic exposures requirements of each country.
00%01%01%02%02%03%03%04%04%05%05%
2008 2009 2010 2011 2012 2013
% GDP High (4 countries) Medium (6 countries)Low (6 countries) Latam
Source: Regulators
0
20
40
60
80
100
120
140
160
2008 2009 2010 2011 2012 2013
Mill
ions
Gross Written Premiums Ceded Premium
Source: Regulators
(USD Bil.)
.0
50.0
100.0
150.0
200.0
250.0
300.0
350.0
400.0
450.0
500.0
2008 2009 2010 2011 2012 2013
USD anual High (4 countries) Medium (6 countries)Low (6 countries) Latam
Source: Regulators
Auto24%
Life21%Health
19%
Pension17%
Technical11%
Others8%
Source: Regulators
GWP Breakdown (Total = USD 152,1 Bil)
Insurance Density
Insurance Penetration GWP and Ceded Premiums
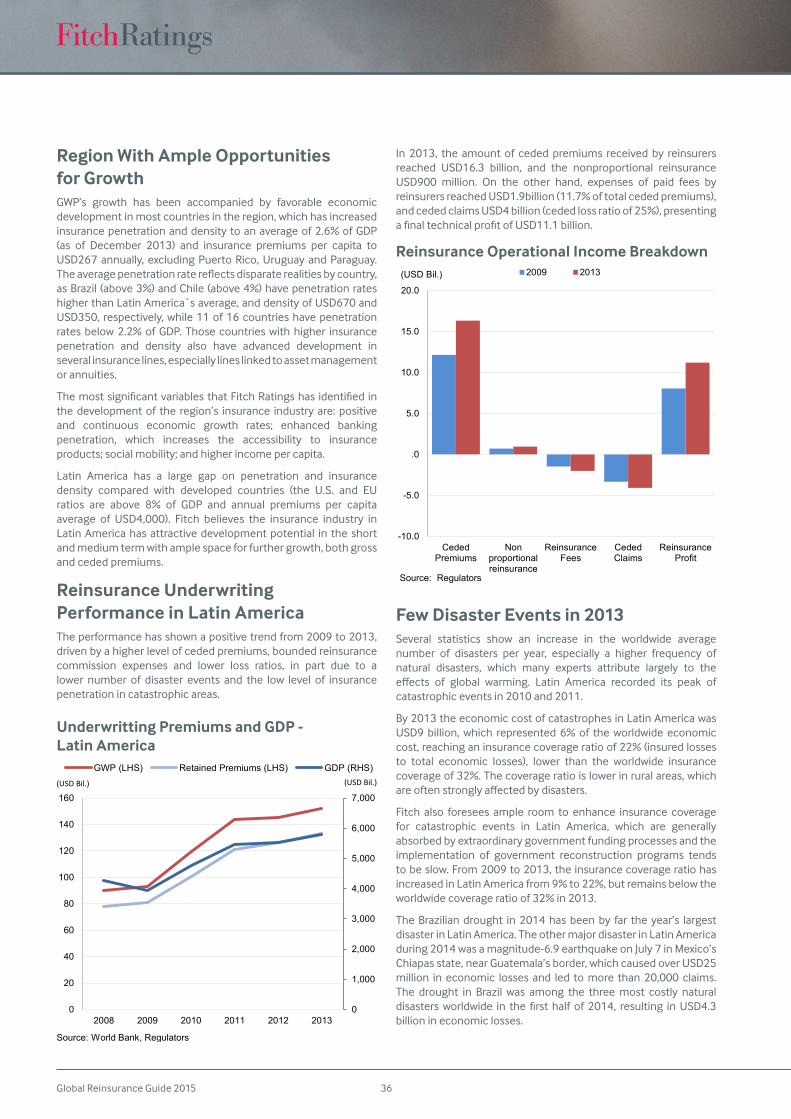
Global Reinsurance Guide 2015 36
Region With Ample Opportunities for GrowthGWP’s growth has been accompanied by favorable economic development in most countries in the region, which has increased insurance penetration and density to an average of 2.6% of GDP (as of December 2013) and insurance premiums per capita to USD267 annually, excluding Puerto Rico, Uruguay and Paraguay. Theaveragepenetrationratereflectsdisparaterealitiesbycountry,as Brazil (above 3%) and Chile (above 4%) have penetration rates higher than Latin America`s average, and density of USD670 and USD350, respectively, while 11 of 16 countries have penetration rates below 2.2% of GDP. Those countries with higher insurance penetration and density also have advanced development in several insurance lines, especially lines linked to asset management or annuities.
ThemostsignificantvariablesthatFitchRatingshas identified inthe development of the region’s insurance industry are: positive and continuous economic growth rates; enhanced banking penetration, which increases the accessibility to insurance products; social mobility; and higher income per capita.
Latin America has a large gap on penetration and insurance density compared with developed countries (the U.S. and EU ratios are above 8% of GDP and annual premiums per capita average of USD4,000). Fitch believes the insurance industry in Latin America has attractive development potential in the short and medium term with ample space for further growth, both gross and ceded premiums.
Reinsurance Underwriting Performance in Latin AmericaThe performance has shown a positive trend from 2009 to 2013, driven by a higher level of ceded premiums, bounded reinsurance commission expenses and lower loss ratios, in part due to a lower number of disaster events and the low level of insurance penetration in catastrophic areas.
In 2013, the amount of ceded premiums received by reinsurers reached USD16.3 billion, and the nonproportional reinsurance USD900 million. On the other hand, expenses of paid fees by reinsurers reached USD1.9billion (11.7% of total ceded premiums), and ceded claims USD4 billion (ceded loss ratio of 25%), presenting afinaltechnicalprofitofUSD11.1billion.
Few Disaster Events in 2013Several statistics show an increase in the worldwide average number of disasters per year, especially a higher frequency of natural disasters, which many experts attribute largely to the effects of global warming. Latin America recorded its peak ofcatastrophic events in 2010 and 2011.
By 2013 the economic cost of catastrophes in Latin America was USD9 billion, which represented 6% of the worldwide economic cost, reaching an insurance coverage ratio of 22% (insured losses to total economic losses), lower than the worldwide insurance coverage of 32%. The coverage ratio is lower in rural areas, which areoftenstronglyaffectedbydisasters.
Fitch also foresees ample room to enhance insurance coverage for catastrophic events in Latin America, which are generally absorbed by extraordinary government funding processes and the implementation of government reconstruction programs tends to be slow. From 2009 to 2013, the insurance coverage ratio has increased in Latin America from 9% to 22%, but remains below the worldwide coverage ratio of 32% in 2013.
The Brazilian drought in 2014 has been by far the year’s largest disaster in Latin America. The other major disaster in Latin America during 2014 was a magnitude-6.9 earthquake on July 7 in Mexico’s Chiapas state, near Guatemala’s border, which caused over USD25 million in economic losses and led to more than 20,000 claims. The drought in Brazil was among the three most costly natural disastersworldwide in thefirsthalf of 2014, resulting inUSD4.3billion in economic losses.
0
1,000
2,000
3,000
4,000
5,000
6,000
7,000
0
20
40
60
80
100
120
140
160
2008 2009 2010 2011 2012 2013
Thou
sand
s
GWP (LHS) Retained Premiums (LHS) GDP (RHS)
Source: World Bank, Regulators
(USD Bil.) (USD Bil.)
-10.0
-5.0
.0
5.0
10.0
15.0
20.0
CededPremiums
Nonproportionalreinsurance
ReinsuranceFees
CededClaims
ReinsuranceProfit
(USD Bil.) 2009 2013
Source: Regulators
Underwritting Premiums and GDP - Latin America
Reinsurance Operational Income Breakdown
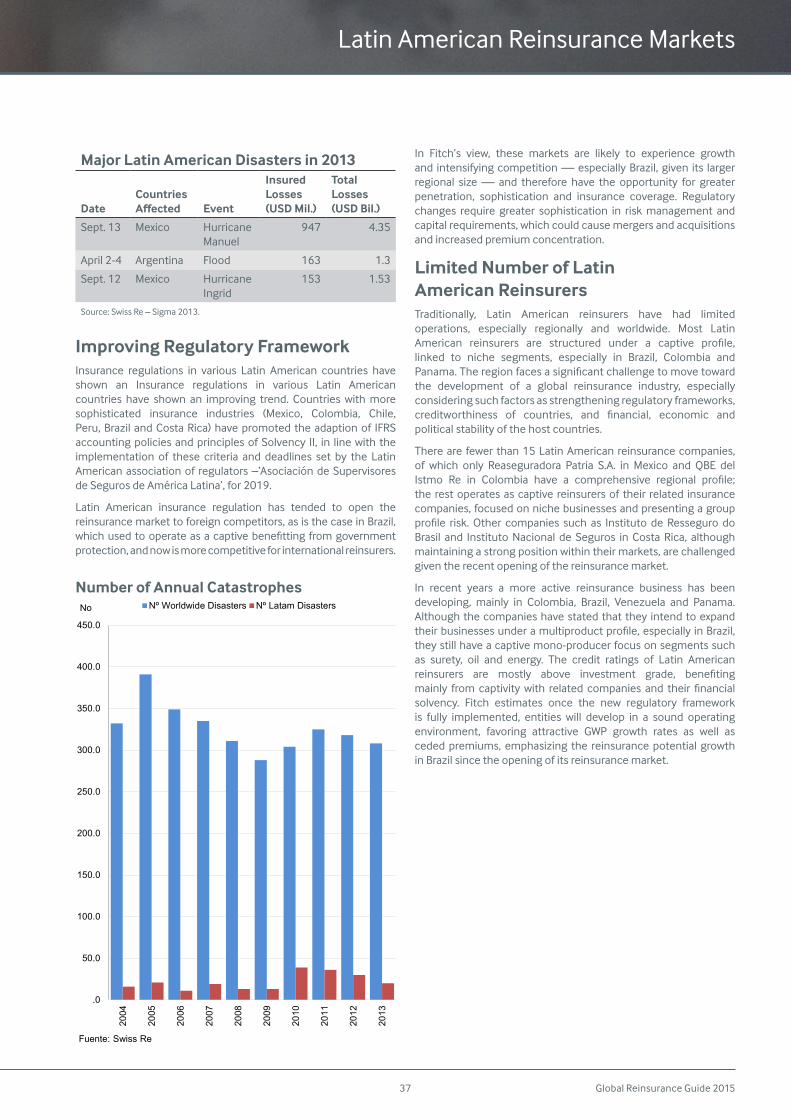
Global Reinsurance Guide 201537
Improving Regulatory Framework Insurance regulations in various Latin American countries have shown an Insurance regulations in various Latin American countries have shown an improving trend. Countries with more sophisticated insurance industries (Mexico, Colombia, Chile, Peru, Brazil and Costa Rica) have promoted the adaption of IFRS accounting policies and principles of Solvency II, in line with the implementation of these criteria and deadlines set by the Latin American association of regulators –‘Asociación de Supervisores de Seguros de América Latina’, for 2019.
Latin American insurance regulation has tended to open the reinsurance market to foreign competitors, as is the case in Brazil, whichusedtooperateasacaptivebenefitting fromgovernmentprotection, and now is more competitive for international reinsurers.
In Fitch’s view, these markets are likely to experience growth and intensifyingcompetition—especiallyBrazil,given its largerregional size— and therefore have the opportunity for greaterpenetration, sophistication and insurance coverage. Regulatory changes require greater sophistication in risk management and capital requirements, which could cause mergers and acquisitions and increased premium concentration.
Limited Number of Latin American ReinsurersTraditionally, Latin American reinsurers have had limited operations, especially regionally and worldwide. Most Latin American reinsurers are structured under a captive profile,linked to niche segments, especially in Brazil, Colombia and Panama.Theregionfacesasignificantchallengetomovetowardthe development of a global reinsurance industry, especially considering such factors as strengthening regulatory frameworks, creditworthiness of countries, and financial, economic andpolitical stability of the host countries.
There are fewer than 15 Latin American reinsurance companies, of which only Reaseguradora Patria S.A. in Mexico and QBE del Istmo Re in Colombia have a comprehensive regional profile;the rest operates as captive reinsurers of their related insurance companies, focused on niche businesses and presenting a group profile risk.Other companies such as Instituto de Resseguro doBrasil and InstitutoNacional de Seguros in Costa Rica, althoughmaintaining a strong position within their markets, are challenged given the recent opening of the reinsurance market.
In recent years a more active reinsurance business has been developing, mainly in Colombia, Brazil, Venezuela and Panama. Although the companies have stated that they intend to expand theirbusinessesunderamultiproductprofile,especiallyinBrazil,they still have a captive mono-producer focus on segments such as surety, oil and energy. The credit ratings of Latin American reinsurers are mostly above investment grade, benefitingmainly fromcaptivitywith related companies and their financialsolvency. Fitch estimates once the new regulatory framework is fully implemented, entities will develop in a sound operating environment, favoring attractive GWP growth rates as well as ceded premiums, emphasizing the reinsurance potential growth in Brazil since the opening of its reinsurance market.
Latin American Reinsurance Markets
.0
50.0
100.0
150.0
200.0
250.0
300.0
350.0
400.0
450.0
2004
2005
2006
2007
2008
2009
2010
2011
2012
2013
No Nº Worldwide Disasters Nº Latam Disasters
Fuente: Swiss Re
Major Latin American Disasters in 2013
DateCountries Affected Event
Insured Losses (USD Mil.)
Total Losses (USD Bil.)
Sept. 13 Mexico Hurricane Manuel
947 4.35
April 2-4 Argentina Flood 163 1.3
Sept. 12 Mexico Hurricane Ingrid
153 1.53
Source: Swiss Re – Sigma 2013.
Number of Annual Catastrophes
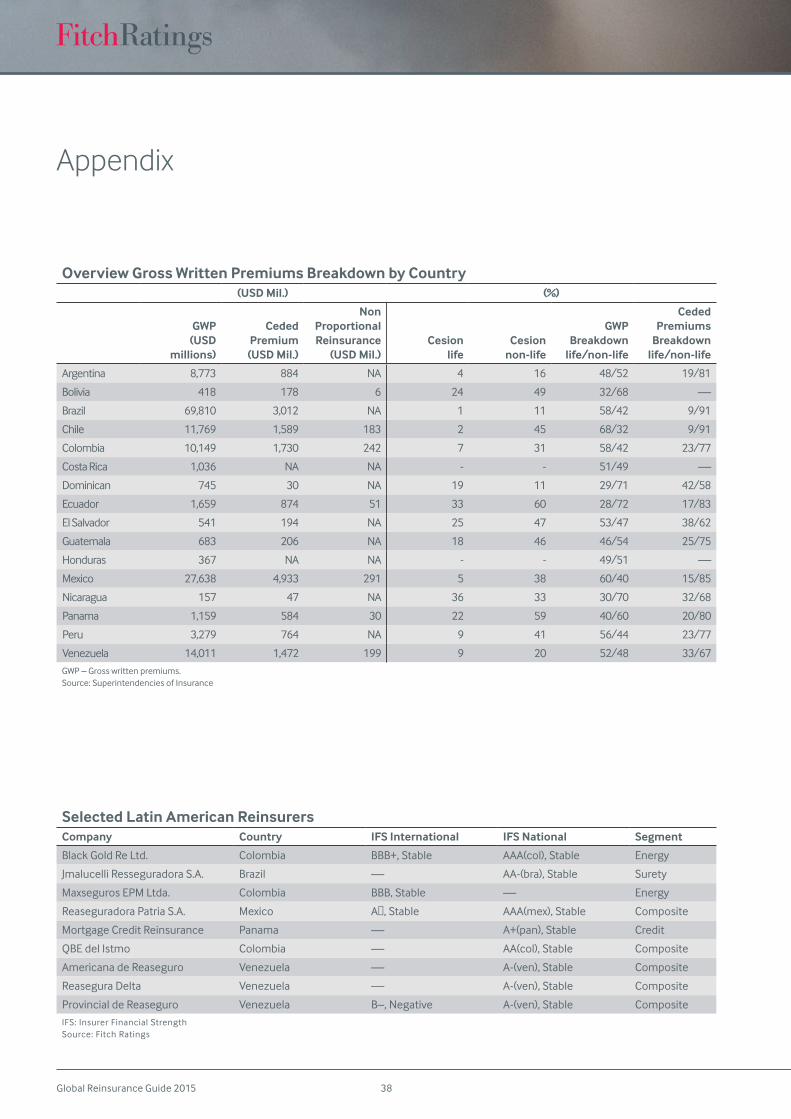
Global Reinsurance Guide 2015 38
Selected Latin American ReinsurersCompany Country IFS International IFS National Segment
Black Gold Re Ltd. Colombia BBB+, Stable AAA(col), Stable Energy
Jmalucelli Resseguradora S.A. Brazil — AA-(bra), Stable Surety
Maxseguros EPM Ltda. Colombia BBB, Stable — Energy
Reaseguradora Patria S.A. Mexico A‒,Stable AAA(mex), Stable Composite
Mortgage Credit Reinsurance Panama — A+(pan), Stable Credit
QBE del Istmo Colombia — AA(col), Stable Composite
Americana de Reaseguro Venezuela — A-(ven), Stable Composite
Reasegura Delta Venezuela — A-(ven), Stable Composite
Provincial de Reaseguro Venezuela B–,Negative A-(ven), Stable Composite
IFS: Insurer Financial Strength Source: Fitch Ratings
Overview Gross Written Premiums Breakdown by Country(USD Mil.) (%)
GWP (USD
millions)
Ceded Premium (USD Mil.)
Non Proportional Reinsurance
(USD Mil.)Cesion
lifeCesion
non-life
GWP Breakdown
life/non-life
Ceded Premiums
Breakdown life/non-life
Argentina 8,773 884 NA 4 16 48/52 19/81
Bolivia 418 178 6 24 49 32/68 —
Brazil 69,810 3,012 NA 1 11 58/42 9/91
Chile 11,769 1,589 183 2 45 68/32 9/91
Colombia 10,149 1,730 242 7 31 58/42 23/77
Costa Rica 1,036 NA NA - - 51/49 —
Dominican 745 30 NA 19 11 29/71 42/58
Ecuador 1,659 874 51 33 60 28/72 17/83
El Salvador 541 194 NA 25 47 53/47 38/62
Guatemala 683 206 NA 18 46 46/54 25/75
Honduras 367 NA NA - - 49/51 —
Mexico 27,638 4,933 291 5 38 60/40 15/85
Nicaragua 157 47 NA 36 33 30/70 32/68
Panama 1,159 584 30 22 59 40/60 20/80
Peru 3,279 764 NA 9 41 56/44 23/77
Venezuela 14,011 1,472 199 9 20 52/48 33/67
GWP – Gross written premiums. Source: Superintendencies of Insurance
Appendix

Global Reinsurance Guide 201539
Latin American Reinsurance Markets
Global Reinsurance Guide 2015 40
Related Research
2015 Outlook: Global Reinsurance (September 2014)Alternative Reinsurance 2014 Market Update (September 2014) Global Reinsurance’s Shifting Landscape (September 2014)Latin American Reinsurance (September 2014)Reinsurer Mergers and Acquisitions (August 2014)Asian Reinsurance Markets (August 2014)
Underwriting Results Profitable, but Pressured as Capital Remains StrongNon-Life Results Deteriorate:Non-lifereinsurers’underwritingprofitswerelowerin1H14becauseofincreasednon-catastropheproperty losses and a higher underlying run-rate loss ratio. Results were still profitable though because of continuedmanageablecatastrophe-related losses and sustained favourable loss reserve development. The non-life global reinsurers that Fitch Ratings tracks achieved a reinsurance underwriting combined ratio of 87.4% in 1H14, a deterioration from 85.9% in 1H13 and 85.5% in 2013.
Capital Growth Improves: Shareholders’ equity showed a solid 13.9% increase over 1H13 and growth of 5.2% since year-end 2013. The adverse changes in the unrealised investment gain/loss positiononfixedmaturitiesduring2013havelargelyreversedorturned favourable for non-life reinsurers in 1H14, relieving some of the pressure from anaemic premium growth.
Life Reinsurers’ Income Rebounds: Life reinsurance operations monitored by Fitch experienced a 27.0% jump in pre-tax income, even as growth in net premiums earned declined from 5.8% in 2013 to 3.2% year-on-year in 1H14. Though individual results were mixed, a confluence of factors including lower claim costs andhigher realized and unrealized returns contributed to the rebound from year-end.
Catastrophes Losses Manageable: The (re)insurance industry experienced manageable and below-average natural catastrophe losses of USD17bn in 1H14, down from USD21bn in 1H13, and belowthe10-yearaverage(2004-2013)forthefirsthalf-yearofUSD25bn in insured losses. The majority of losses in 1H14, listed in Figure 1, were from winter storms in Japan and the US, severe thunderstorms and hail in Western Europe, as well as from US severethunderstormactivityandfloodingandwinterstorms inthe UK.
Favourable Reserve Development Persists: Reserve releases remainedalmostconstantfromyear-end2013to1H14,benefitingthe combined ratio by 6.1% for each period. Although Fitch believes that the surplus held within non-life reinsurance industry loss reserves remains adequate, releases are expected to decline. Continued dwindling in the release of excess reserves from prior favourablepricingcycleswillputpressureonfutureprofitability.
Reinsurance Sector Outlook Negative: Fitch’s global reinsurance sector outlook is negative, as the fundamentals of the reinsurance sector have deteriorated with declining premium pricing and weakening of terms and conditions across a wide range of lines. Fitch views current market conditions as unlikely to improve in the near term given the competition in the reinsurance market.
1H14 Financial Results
Non-Life Underwriting Performance FavourableNon-life reinsurers’ underwriting results slightly deteriorated in1H14butremainedprofitableascatastrophelossescontinuedtorunbelowtheaveragetrend.Theweaker resultspartly reflected
Figure 1
Largest Insured Natural Catastrophe Events, H114
Date Event Location
Economic loss (USDbn)
Insured loss (USDbn)
Feb Winter damage
Japan 5.0 >2.5
June Storms, hail
Western Europe
3.1 2.5
Jan Winter damage
US 2.5 1.7
May Severe storm
US 2.0 1.6
Apr/May Severe storm
US 1.7 1.1
Jan/Feb Storms, floods
UK 1.3 1.1
Source:MunichReNatCatService
Global Reinsurers’ Mid-Year 2014 Financial Results
AnalystsBrian Schneider +1 312 606-2321 [email protected]
Martyn Street +44 20 3530 1211 [email protected]
Jeremy Graczyk +1 312 368-3208 [email protected]
Related Criteria Insurance Rating Methodology (September 2014)
Global Reinsurance Guide 201541
an increase in non-catastrophe property losses that hit several reinsurers.Theyalsoreflectedareductioninpropertycatastrophebusiness written by traditional reinsurers and a shift by reinsurers from excess of loss business into quota share because of the pressure on excess of loss premium rates pushing prices down to inadequate levels. Quota share reinsurance business carries a higher, but less volatile, average loss ratio than excess of loss and property catastrophe business.
Ironically, the favourable underwriting results posted by the industry since the record catastrophe loss year in 2011 has fostered the current challenging reinsurance environment. Reinsurers’ profitable results are promoting product innovationand attracting more capital to the sector from new sources, including private equity firms, hedge funds and pension plans.This increased supply of capital has created excess underwriting capacity in the reinsurance market, leading to price competition and falling reinsurance rates.
The group of reinsurers that Fitch tracks generated a calendar-year reinsurance combined ratio of 87.4% in 1H14, up from 85.9% a year earlier and 85.5% at year-end. Fifteen of the 22 reinsurers in the group reported a higher reinsurance combined ratio in 1H14 than in 2013, though all but one of them came in below 100%.
The group’s 1H14 results included a modest 0.3% reduction in prior-accident-year reserve development from a year earlier and this was unchanged since year-end, with favourable reserves providingamid-single-digitbenefittothecalendar-yearcombinedratio. The profitable underwriting results reflect continuedunderwriting discipline in the sector, as loss cost trends on most lines of business are about in line with earned pricing trends. This will be imperative given the current competition in pricing.
Non-life reinsurers in aggregate achieved reinsurance netpremiumswritten(NPW)growthofapproximately4.5%over1H13,but after adjusting for foreign-currency translations only managed 2.6% growth. Fitch’s opinion is that this is largely due to flat ordeclining prices in both property and casualty reinsurance lines. Expansionintovariousspecialtylineswaspartlyoffsetbydeclinesin property catastrophe reinsurance business as prices continue to drop, with increased competition from the growing alternative reinsurance market.
Shareholders’ equity grew 5.2% in 1H14 from year-end 2013 for this group of reinsurers that had reported (5.1% assuming constant exchange rates), which was an improvement from a 5.2% decline for 1H13 over year-end 2012 (excluding Berkshire Hathaway). Solid earnings and unrealized gains on fixed-income securitiesdrove the reversal in trend, along with share repurchases dropping by roughly USD282m yoy for a subgroup comprised of 18 US and Canadian reinsurers. Dividends per share largely remained the same but were slightly down by 0.5% for this same group.
Figure 2
1H14 Non-Life Reinsurance Results(USDm) 1H14 1H13
Netpremiumswritten 47,093 45,074
Combined ratio (%) 87.4 85.9
Shareholders’ equity (including Berkshire Hathaway)
442,126 388,013
Note:Theaboveresultsincludedataonlyforthosecompaniesthathadreportedboth 1H14 and 1H13 results on a comparable basis at this report’s publication date. shareholders’ equity is organisation-wide equity and includes equity that supports operations other than non-life reinsurance operations Source: Individual company data
Figure 3
Reinsurer Common Share Repurchase Activity(USDm) 1H14 1H13
ACE Ltd 557 212
Alleghany Corporation 160 40
Allied World Assurance Company Holdings Ltd.
138 83
Arch Capital Group Ltd. 0 56
Aspen Insurance Holdings Ltd. 31 240
AXIS Capital Holdings Ltd. 318 341
Berkshire Hathaway Inc. 0 0
Endurance Specialty Holdings Ltd. 0 15
Everest Re Group, Ltd. 325 450
Montpelier Re Holding Ltd. 94 115
RenaissanceRe Holdings Ltd. 315 122
PartnerRe Ltd. 316 496
Platinum Underwriters Holdings, Ltd. 111 224
Validus Holdings, Ltd. 197 357
White Mountains Insurance Group, Ltd. 26 80
Markel Corporation 17 41
Fairfax Financial Holdings Limited 20 11
XL Group plc 352 375
Total 2,976 3,258
Source: Company reports
Global Reinsurance Guide 2015 42
Life Premiums Grow; Profits RecoverThe group of life reinsurance operations monitored by Fitch reported a moderate increase in net premiums earned in 1H14 from a year earlier mainly due to foreign-currency appreciation. In US dollar terms, net premiums earned increased by 3.2% relative to 1H13aftertheeffectsofforeigncurrencytranslation,andby0.9%holding the exchange rate constant. Three of the eight reinsurers who reported experienced a drop in total net premiums earned from ayearearlier,excludingXLGroupplc,whoserun-offlifereinsurancesubsidiary was recently sold to GreyCastle Holdings Ltd.
The 1H14 pre-tax income of the life reinsurance operations tracked by Fitch increased by 27% in US dollar terms compared with a year earlier after several reinsurers ran across problems in group risk business in the Australian market in 2013. Reinsurance Group of America’s pre-tax income more than doubled from the prior year after discontinuing writing new business in the Australian group total and permanent disability market. The group’s shareholders’ equity (excluding Berkshire Hathaway) increased by 2.6% from year-end2013asthesereinsurersalsobenefitedfromhigherearnings,unrealized bond gains, and foreign-currency exchange gains.
Sector Performance Highlights
1H14 Catastrophe Losses Continue to be ManageableWorldwide insured natural catastrophe losses in 1H14 were manageable for the (re)insurance industry at USD17bn, according to a reviewpublishedbyMunichRe’sNatCatService, down fromUSD21.1bn in 1H13. The 1H14 total was below the USD24.9bn (original value) 10-year average insured losses for the first-halfperiodsfrom2004to2013,butabovethe30-yearaverageoffirst-half periods (1984-2013) of USD14.7bn (original value).
The largest 1H14 industry loss was from heavy snowstorms in Japan in February, with Munich Re estimating more than USD2.5bn of insured industry losses. These were largely business interruption losses as several auto manufacturing plants were forced to suspend operations due to the extreme conditions. Residential and
commercial buildings collapsed due to the heavy snow loads, and wind gusts up to hurricane force caused widespread power outages.
Western Europe experienced the second largest 1H14 event with an estimated USD2.5bn insured loss from severe thunderstorms in June that produced tennis-ball sized hail and caused extensive flooding, resulting in considerable property damage andagriculturallosses.WhilethemostsignificantdamageoccurredinGermany,thestormsalsohitBelgium,FranceandtheNetherlands.
Severe winter storms in the US caused USD1.7bn of insured losses in the first week of January as the polar vortex pushedbelow freezing temperatures into every state of the country, a rare event.Thesignificantsnowfallandrecordseverecoldconditionsresulted in increased claims for both personal and commercial lines insurers from roof collapses, power failures, frozen and burst pipes, auto accidents and business interruption.
Third-quartercatastropheactivitystartedquicklyasthefirstAtlantichurricane of 2014, Arthur, made landfall on 3 July 2014 as a category 2 hurricane on the barrier islands of North Carolina, the earliesthurricane ever to make landfall in the state. The storm gradually weakened as it travelled northeast, bringing heavy rains and wind, and is estimated to have resulted in a relatively minor USD250m of insured losses. This result continues the current trend of a major hurricane (category 3-5) not making landfall in the US since Hurricane Wilma hit Florida in 2005, representing the longest period between US major hurricane landfalls since the 1860s.
Experts continue to predict average to below-average Atlantic hurricane frequency this season relative to long-term results, as a number of environmental forces that serve to stifle thedevelopment of tropical storms appear more prevalent in 2014 than in many recent years. However, there is always the potential for significant catastrophe losses during the peak period ofhurricane formation from mid-August to mid-October.
Reserve Redundancies Steady but Expected to DeclineReinsurers continue to report favourable prior-accident-year reserve development, with 2013 being the eighth consecutive year of overall favourable development, and continuing through thefirstsixmonthsof2014.Mostreinsurersarereportingamid-single-digitpercentage-pointbenefitonthecombinedratio,withseveral recording a double-digit favourable impact in both 2013 and 1H14. This level of positive development has persisted longer than Fitch had expected. It is driven in part by loss cost trends that have generally been more benign relative to initial assumptions by the industry, which proved to be conservative.
Figure 5
Calendar- and Accident-Year Combined Ratio Comparison1H14 1H13 2013 2012 2011 2010 2009
Calendar-year combined ratio (%) 85.9 87.0 88.3 93.2 103.6 92.4 88.9
Accident-year combined ratio (%) 92.0 93.4 94.4 99.7 110.5 99.8 94.3
Difference(pp) 6.1 6.4 6.1 6.5 6.9 7.5 5.4
Dataisfrom17(re)insuranceorganisationsinNorthAmericawithsignificantreinsuranceoperations Source:SNLfinancial
Figure 4
1H14 Life Reinsurance Results(USDm) 1H14 1H13
Netpremiumsearned 27,009 26,171
Pre-tax operating income 1,850 1,457
Source: Individual company data
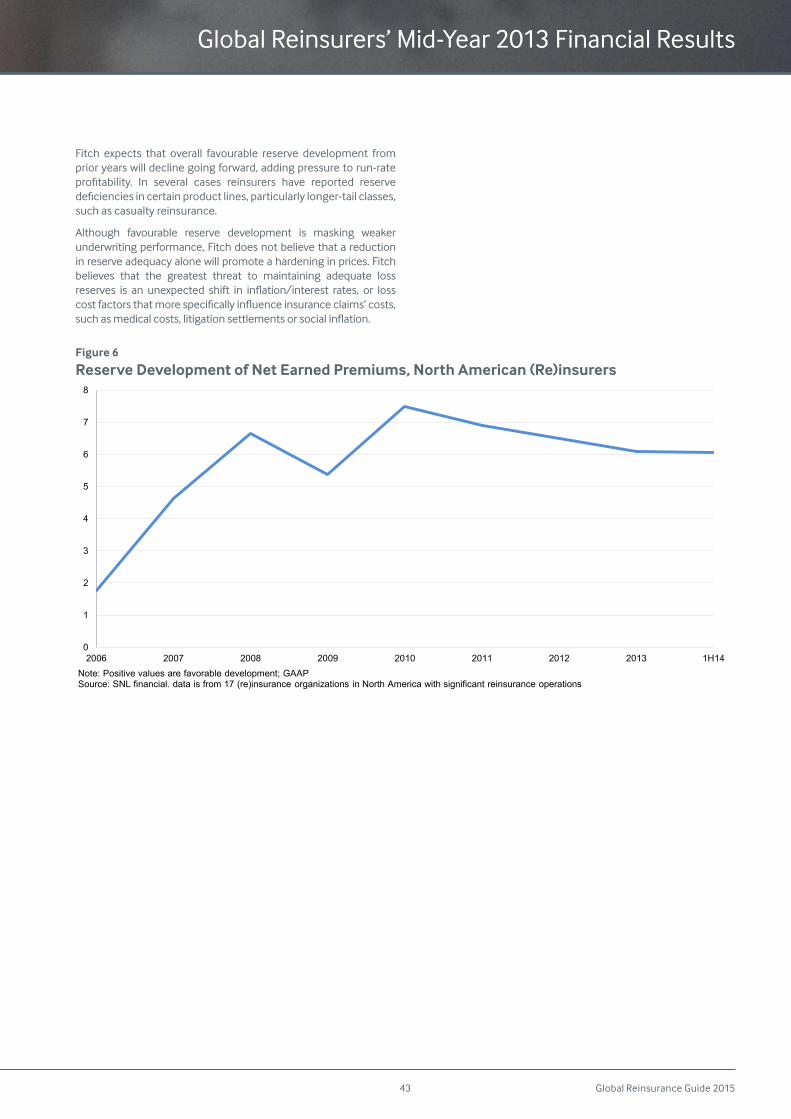
Global Reinsurance Guide 201543
Fitch expects that overall favourable reserve development from prior years will decline going forward, adding pressure to run-rate profitability. In several cases reinsurers have reported reservedeficienciesincertainproductlines,particularlylonger-tailclasses,such as casualty reinsurance.
Although favourable reserve development is masking weaker underwriting performance, Fitch does not believe that a reduction in reserve adequacy alone will promote a hardening in prices. Fitch believes that the greatest threat to maintaining adequate loss reserves is an unexpected shift in inflation/interest rates, or losscostfactorsthatmorespecificallyinfluenceinsuranceclaims’costs,suchasmedicalcosts,litigationsettlementsorsocialinflation.
Global Reinsurers’ Mid-Year 2013 Financial Results
Figure 6
Reserve Development of Net Earned Premiums, North American (Re)insurers
0
1
2
3
4
5
6
7
8
2006 2007 2008 2009 2010 2011 2012 2013 1H14Note: Positive values are favorable development; GAAPSource: SNL financial. data is from 17 (re)insurance organizations in North America with significant reinsurance operations
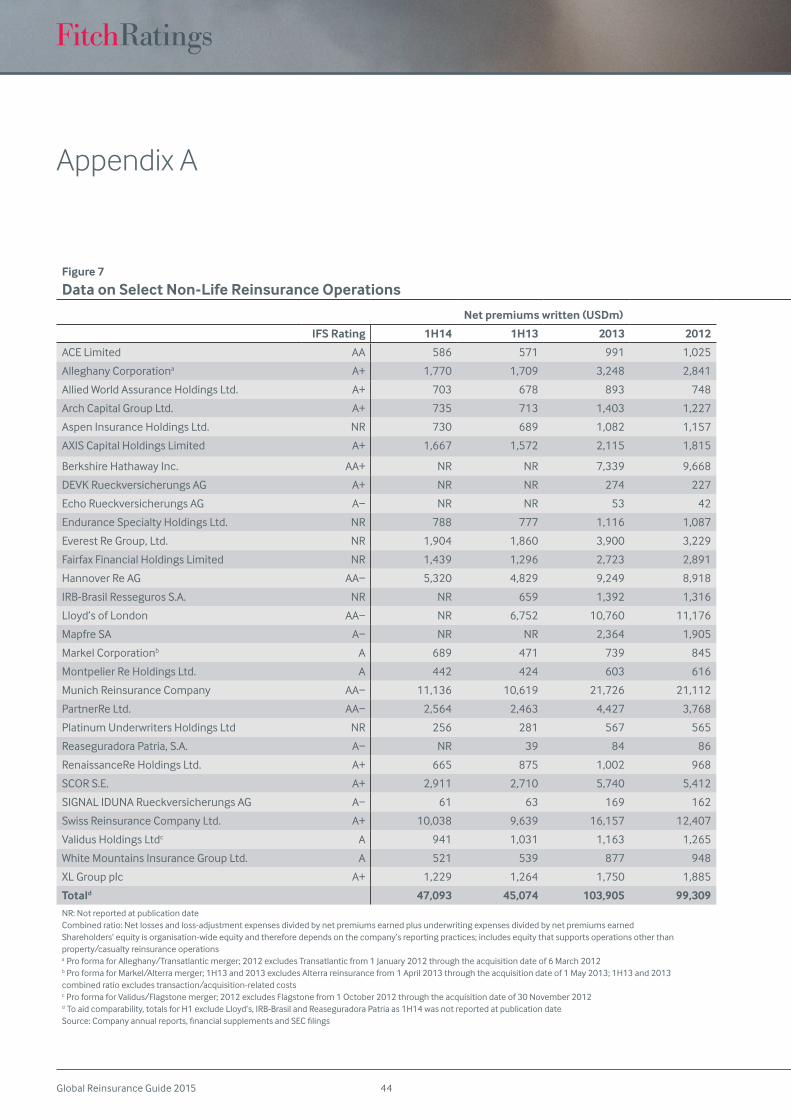
Global Reinsurance Guide 2015 44
Figure 7
Data on Select Non-Life Reinsurance Operations
Net premiums written (USDm) Combined ratio (%) Shareholders’ equity (USDm)
IFS Rating 1H14 1H13 2013 2012 1H14 1H13 2013 2012 1H14 1H13 2013 2012
ACE Limited AA 586 571 991 1,025 ACE Limited 71.6 64.8 65.9 77.4 30,325 27,295 28,825 27,531
Alleghany Corporationa A+ 1,770 1,709 3,248 2,841 Alleghany Corporationa 89.9 88.6 89.8 90.9 7,407 6,498 6,948 6,404
Allied World Assurance Holdings Ltd. A+ 703 678 893 748 Allied World Assurance Holdings Ltd. 79.2 77.7 75.8 95.1 3,683 3,373 3,520 3,326
Arch Capital Group Ltd. A+ 735 713 1,403 1,227 Arch Capital Group Ltd. 74.3 70.2 69.8 80.2 7,022 5,234 5,647 5,169
Aspen Insurance Holdings Ltd. NR 730 689 1,082 1,157 Aspen Insurance Holdings Ltd. 74.1 84.0 76.4 85.4 3,554 3,235 3,350 3,488
AXIS Capital Holdings Limited A+ 1,667 1,572 2,115 1,815 AXIS Capital Holdings Limited 80.6 80.4 82.8 89.4 6,009 5,562 5,868 5,780
Berkshire Hathaway Inc. AA+ NR NR 7,339 9,668 Berkshire Hathaway Inc. 87.6 77.5 83.0 92.8 234,005 202,016 221,890 187,647
DEVK Rueckversicherungs AG A+ NR NR 274 227 DEVK Rueckversicherungs AG NR NR 99.5 90.6 NR NR 1,394 1,279
Echo Rueckversicherungs AG A− NR NR 53 42 Echo Rueckversicherungs AG NR NR 83.7 87.5 NR NR 72 69
Endurance Specialty Holdings Ltd. NR 788 777 1,116 1,087 Endurance Specialty Holdings Ltd. 76.1 81.8 76.8 94.7 3,116 2,736 2,887 2,711
Everest Re Group, Ltd. NR 1,904 1,860 3,900 3,229 Everest Re Group, Ltd. 79.4 80.8 76.3 90.1 7,323 6,623 6,968 6,733
Fairfax Financial Holdings Limited NR 1,439 1,296 2,723 2,891 Fairfax Financial Holdings Limited 88.2 86.4 85.4 90.7 9,484 8,587 8,461 8,890
Hannover Re AG AA− 5,320 4,829 9,249 8,918 Hannover Re AG 95.3 94.6 95.1 96.0 9,682 8,106 8,996 8,799
IRB-Brasil Resseguros S.A. NR NR 659 1,392 1,316 IRB-Brasil Resseguros S.A. NR 115.8 89.1 112.4 NR 1,085 1,130 1,232
Lloyd’s of London AA− NR 6,752 10,760 11,176 Lloyd’s of London NR 83.5 80.5 91.0 NR 30,641 33,788 31,121
Mapfre SA A− NR NR 2,364 1,905 Mapfre SA NR NR 96.5 97.0 NR NR 1,391 1,269
Markel Corporationb A 689 471 739 845 Markel Corporationb 96.7 91.7 97.8 89.6 7,143 6,321 6,674 6,728
Montpelier Re Holdings Ltd. A 442 424 603 616 Montpelier Re Holdings Ltd. 63.8 65.4 56.1 81.0 1,923 1,669 1,887 1,629
Munich Reinsurance Company AA− 11,136 10,619 21,726 21,112 Munich Reinsurance Company 94.2 92.5 92.1 91.2 37,880 33,363 36,129 35,938
PartnerRe Ltd. AA− 2,564 2,463 4,427 3,768 PartnerRe Ltd. 87.8 90.0 85.3 87.8 6,957 6,415 6,766 6,933
Platinum Underwriters Holdings Ltd NR 256 281 567 565 Platinum Underwriters Holdings Ltd 63.6 60.8 62.6 62.5 1,778 1,747 1,747 1,895
Reaseguradora Patria, S.A. A− NR 39 84 86 Reaseguradora Patria, S.A. NR 101.2 112.3 101.3 NR 119 119 120
RenaissanceRe Holdings Ltd. A+ 665 875 1,002 968 RenaissanceRe Holdings Ltd. 46.0 41.0 32.6 49.2 3,836 3,572 3,904 3,507
SCOR S.E. A+ 2,911 2,710 5,740 5,412 SCOR S.E. 90.6 94.1 92.6 93.1 7,046 6,161 6,860 6,300
SIGNALIDUNARueckversicherungsAG A− 61 63 169 162 SIGNALIDUNARueckversicherungsAG 108.6 105.1 99.5 99.3 182 142 182 150
Swiss Reinsurance Company Ltd. A+ 10,038 9,639 16,157 12,407 Swiss Reinsurance Company Ltd. 86.1 84.8 83.3 80.7 33,655 30,135 32,977 34,026
Validus Holdings Ltdc A 941 1,031 1,163 1,265 Validus Holdings Ltdc 49.5 62.7 59.8 84.1 4,352 4,046 4,202 4,455
White Mountains Insurance Group Ltd. A 521 539 877 948 White Mountains Insurance Group Ltd. 77.3 79.7 82.1 90.3 4,356 3,939 4,156 3,982
XL Group plc A+ 1,229 1,264 1,750 1,885 XL Group plc 76.0 77.3 81.4 86.9 11,409 11,237 11,349 11,856
Totald 47,093 45,074 103,905 99,309 Totald 87.4 85.9 85.5 89.5 442,126 388,013 458,085 418,968NR:Notreportedatpublicationdate Combinedratio:Netlossesandloss-adjustmentexpensesdividedbynetpremiumsearnedplusunderwritingexpensesdividedbynetpremiumsearned Shareholders’ equity is organisation-wide equity and therefore depends on the company’s reporting practices; includes equity that supports operations other than property/casualty reinsurance operations a Pro forma for Alleghany/Transatlantic merger; 2012 excludes Transatlantic from 1 January 2012 through the acquisition date of 6 March 2012 b Pro forma for Markel/Alterra merger; 1H13 and 2013 excludes Alterra reinsurance from 1 April 2013 through the acquisition date of 1 May 2013; 1H13 and 2013 combined ratio excludes transaction/acquisition-related costs cProformaforValidus/Flagstonemerger;2012excludesFlagstonefrom1October2012throughtheacquisitiondateof30November2012 d To aid comparability, totals for H1 exclude Lloyd’s, IRB-Brasil and Reaseguradora Patria as 1H14 was not reported at publication date Source:Companyannualreports,financialsupplementsandSECfilings
Appendix A
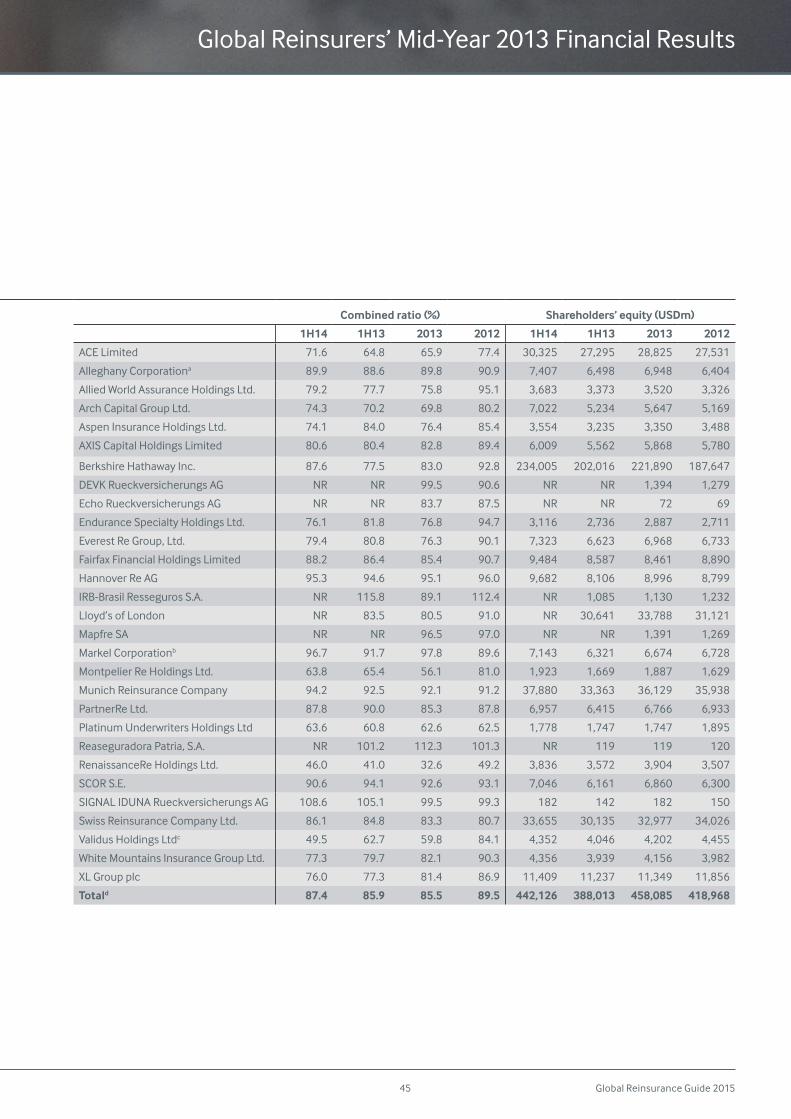
Global Reinsurance Guide 201545
Global Reinsurers’ Mid-Year 2013 Financial Results
Figure 7
Data on Select Non-Life Reinsurance Operations
Net premiums written (USDm) Combined ratio (%) Shareholders’ equity (USDm)
IFS Rating 1H14 1H13 2013 2012 1H14 1H13 2013 2012 1H14 1H13 2013 2012
ACE Limited AA 586 571 991 1,025 ACE Limited 71.6 64.8 65.9 77.4 30,325 27,295 28,825 27,531
Alleghany Corporationa A+ 1,770 1,709 3,248 2,841 Alleghany Corporationa 89.9 88.6 89.8 90.9 7,407 6,498 6,948 6,404
Allied World Assurance Holdings Ltd. A+ 703 678 893 748 Allied World Assurance Holdings Ltd. 79.2 77.7 75.8 95.1 3,683 3,373 3,520 3,326
Arch Capital Group Ltd. A+ 735 713 1,403 1,227 Arch Capital Group Ltd. 74.3 70.2 69.8 80.2 7,022 5,234 5,647 5,169
Aspen Insurance Holdings Ltd. NR 730 689 1,082 1,157 Aspen Insurance Holdings Ltd. 74.1 84.0 76.4 85.4 3,554 3,235 3,350 3,488
AXIS Capital Holdings Limited A+ 1,667 1,572 2,115 1,815 AXIS Capital Holdings Limited 80.6 80.4 82.8 89.4 6,009 5,562 5,868 5,780
Berkshire Hathaway Inc. AA+ NR NR 7,339 9,668 Berkshire Hathaway Inc. 87.6 77.5 83.0 92.8 234,005 202,016 221,890 187,647
DEVK Rueckversicherungs AG A+ NR NR 274 227 DEVK Rueckversicherungs AG NR NR 99.5 90.6 NR NR 1,394 1,279
Echo Rueckversicherungs AG A− NR NR 53 42 Echo Rueckversicherungs AG NR NR 83.7 87.5 NR NR 72 69
Endurance Specialty Holdings Ltd. NR 788 777 1,116 1,087 Endurance Specialty Holdings Ltd. 76.1 81.8 76.8 94.7 3,116 2,736 2,887 2,711
Everest Re Group, Ltd. NR 1,904 1,860 3,900 3,229 Everest Re Group, Ltd. 79.4 80.8 76.3 90.1 7,323 6,623 6,968 6,733
Fairfax Financial Holdings Limited NR 1,439 1,296 2,723 2,891 Fairfax Financial Holdings Limited 88.2 86.4 85.4 90.7 9,484 8,587 8,461 8,890
Hannover Re AG AA− 5,320 4,829 9,249 8,918 Hannover Re AG 95.3 94.6 95.1 96.0 9,682 8,106 8,996 8,799
IRB-Brasil Resseguros S.A. NR NR 659 1,392 1,316 IRB-Brasil Resseguros S.A. NR 115.8 89.1 112.4 NR 1,085 1,130 1,232
Lloyd’s of London AA− NR 6,752 10,760 11,176 Lloyd’s of London NR 83.5 80.5 91.0 NR 30,641 33,788 31,121
Mapfre SA A− NR NR 2,364 1,905 Mapfre SA NR NR 96.5 97.0 NR NR 1,391 1,269
Markel Corporationb A 689 471 739 845 Markel Corporationb 96.7 91.7 97.8 89.6 7,143 6,321 6,674 6,728
Montpelier Re Holdings Ltd. A 442 424 603 616 Montpelier Re Holdings Ltd. 63.8 65.4 56.1 81.0 1,923 1,669 1,887 1,629
Munich Reinsurance Company AA− 11,136 10,619 21,726 21,112 Munich Reinsurance Company 94.2 92.5 92.1 91.2 37,880 33,363 36,129 35,938
PartnerRe Ltd. AA− 2,564 2,463 4,427 3,768 PartnerRe Ltd. 87.8 90.0 85.3 87.8 6,957 6,415 6,766 6,933
Platinum Underwriters Holdings Ltd NR 256 281 567 565 Platinum Underwriters Holdings Ltd 63.6 60.8 62.6 62.5 1,778 1,747 1,747 1,895
Reaseguradora Patria, S.A. A− NR 39 84 86 Reaseguradora Patria, S.A. NR 101.2 112.3 101.3 NR 119 119 120
RenaissanceRe Holdings Ltd. A+ 665 875 1,002 968 RenaissanceRe Holdings Ltd. 46.0 41.0 32.6 49.2 3,836 3,572 3,904 3,507
SCOR S.E. A+ 2,911 2,710 5,740 5,412 SCOR S.E. 90.6 94.1 92.6 93.1 7,046 6,161 6,860 6,300
SIGNALIDUNARueckversicherungsAG A− 61 63 169 162 SIGNALIDUNARueckversicherungsAG 108.6 105.1 99.5 99.3 182 142 182 150
Swiss Reinsurance Company Ltd. A+ 10,038 9,639 16,157 12,407 Swiss Reinsurance Company Ltd. 86.1 84.8 83.3 80.7 33,655 30,135 32,977 34,026
Validus Holdings Ltdc A 941 1,031 1,163 1,265 Validus Holdings Ltdc 49.5 62.7 59.8 84.1 4,352 4,046 4,202 4,455
White Mountains Insurance Group Ltd. A 521 539 877 948 White Mountains Insurance Group Ltd. 77.3 79.7 82.1 90.3 4,356 3,939 4,156 3,982
XL Group plc A+ 1,229 1,264 1,750 1,885 XL Group plc 76.0 77.3 81.4 86.9 11,409 11,237 11,349 11,856
Totald 47,093 45,074 103,905 99,309 Totald 87.4 85.9 85.5 89.5 442,126 388,013 458,085 418,968NR:Notreportedatpublicationdate Combinedratio:Netlossesandloss-adjustmentexpensesdividedbynetpremiumsearnedplusunderwritingexpensesdividedbynetpremiumsearned Shareholders’ equity is organisation-wide equity and therefore depends on the company’s reporting practices; includes equity that supports operations other than property/casualty reinsurance operations a Pro forma for Alleghany/Transatlantic merger; 2012 excludes Transatlantic from 1 January 2012 through the acquisition date of 6 March 2012 b Pro forma for Markel/Alterra merger; 1H13 and 2013 excludes Alterra reinsurance from 1 April 2013 through the acquisition date of 1 May 2013; 1H13 and 2013 combined ratio excludes transaction/acquisition-related costs cProformaforValidus/Flagstonemerger;2012excludesFlagstonefrom1October2012throughtheacquisitiondateof30November2012 d To aid comparability, totals for H1 exclude Lloyd’s, IRB-Brasil and Reaseguradora Patria as 1H14 was not reported at publication date Source:Companyannualreports,financialsupplementsandSECfilings
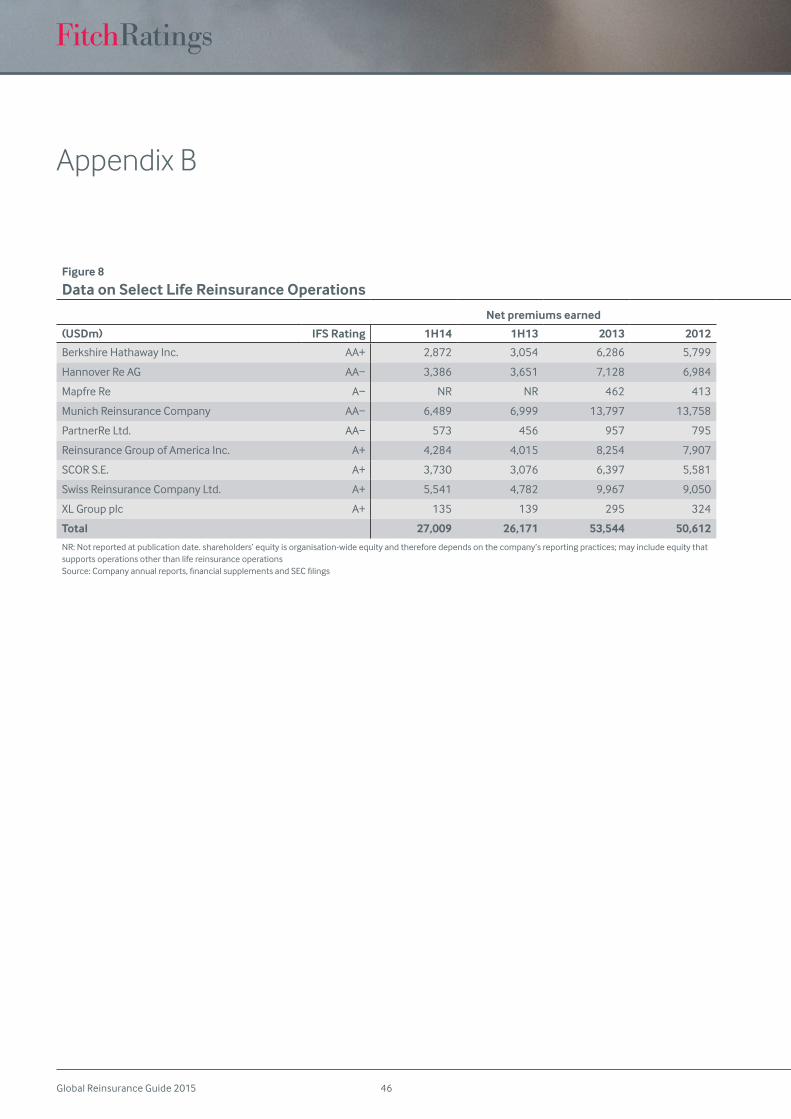
Global Reinsurance Guide 2015 46
Appendix B
Figure 8
Data on Select Life Reinsurance Operations
Net premiums earned Pre-tax operating income/(loss) Shareholders’ equity
(USDm) IFS Rating 1H14 1H13 2013 2012 1H14 1H13 2013 2012 1H14 2013 2012
Berkshire Hathaway Inc. AA+ 2,872 3,054 6,286 5,799 Berkshire Hathaway Inc. NR NR NR NR 234,005 221,890 187,647
Hannover Re AG AA− 3,386 3,651 7,128 6,984 Hannover Re AG 212 175 200 375 9,682 8,996 8,799
Mapfre Re A− NR NR 462 413 Mapfre Re NR NR 26 36 NR 1,391 1,269
Munich Reinsurance Company AA− 6,489 6,999 13,797 13,758 Munich Reinsurance Company 436 415 733 925 37,880 36,129 35,938
PartnerRe Ltd. AA− 573 456 957 795 PartnerRe Ltd. NR NR NR NR 6,957 6,766 6,933
Reinsurance Group of America Inc. A+ 4,284 4,015 8,254 7,907 Reinsurance Group of America Inc. 500 204 635 919 6,689 5,936 6,910
SCOR S.E. A+ 3,730 3,076 6,397 5,581 SCOR S.E. 152 140 270 275 7,046 6,860 6,300
Swiss Reinsurance Company Ltd. A+ 5,541 4,782 9,967 9,050 Swiss Reinsurance Company Ltd. 550 522 592 885 33,655 32,977 34,026
XL Group plc A+ 135 139 295 324 XL Group plc NR NR NR NR 11,409 11,349 11,856
Total 27,009 26,171 53,544 50,612 Total 1,850 1,457 2,457 3,416 347,323 332,294 299,679
NR:Notreportedatpublicationdate.shareholders’equityisorganisation-wideequityandthereforedependsonthecompany’sreportingpractices;mayincludeequitythatsupports operations other than life reinsurance operations Source:Companyannualreports,financialsupplementsandSECfilings
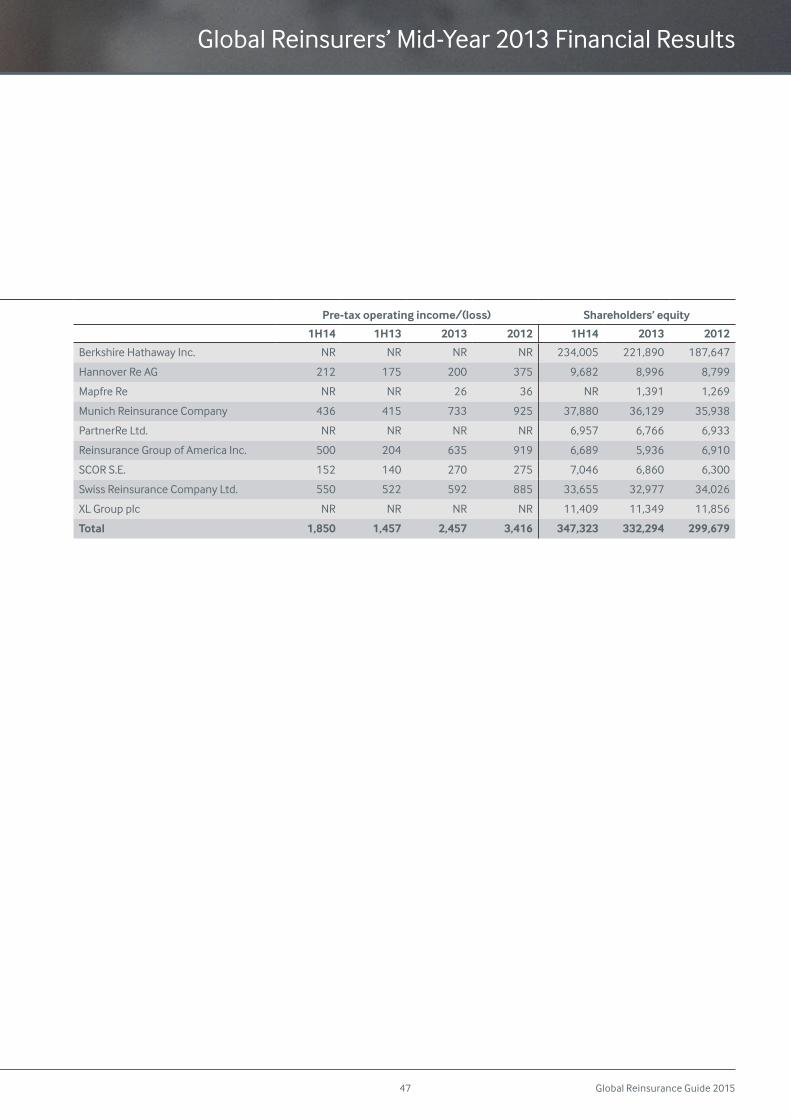
Global Reinsurance Guide 201547
Figure 8
Data on Select Life Reinsurance Operations
Net premiums earned Pre-tax operating income/(loss) Shareholders’ equity
(USDm) IFS Rating 1H14 1H13 2013 2012 1H14 1H13 2013 2012 1H14 2013 2012
Berkshire Hathaway Inc. AA+ 2,872 3,054 6,286 5,799 Berkshire Hathaway Inc. NR NR NR NR 234,005 221,890 187,647
Hannover Re AG AA− 3,386 3,651 7,128 6,984 Hannover Re AG 212 175 200 375 9,682 8,996 8,799
Mapfre Re A− NR NR 462 413 Mapfre Re NR NR 26 36 NR 1,391 1,269
Munich Reinsurance Company AA− 6,489 6,999 13,797 13,758 Munich Reinsurance Company 436 415 733 925 37,880 36,129 35,938
PartnerRe Ltd. AA− 573 456 957 795 PartnerRe Ltd. NR NR NR NR 6,957 6,766 6,933
Reinsurance Group of America Inc. A+ 4,284 4,015 8,254 7,907 Reinsurance Group of America Inc. 500 204 635 919 6,689 5,936 6,910
SCOR S.E. A+ 3,730 3,076 6,397 5,581 SCOR S.E. 152 140 270 275 7,046 6,860 6,300
Swiss Reinsurance Company Ltd. A+ 5,541 4,782 9,967 9,050 Swiss Reinsurance Company Ltd. 550 522 592 885 33,655 32,977 34,026
XL Group plc A+ 135 139 295 324 XL Group plc NR NR NR NR 11,409 11,349 11,856
Total 27,009 26,171 53,544 50,612 Total 1,850 1,457 2,457 3,416 347,323 332,294 299,679
NR:Notreportedatpublicationdate.shareholders’equityisorganisation-wideequityandthereforedependsonthecompany’sreportingpractices;mayincludeequitythatsupports operations other than life reinsurance operations Source:Companyannualreports,financialsupplementsandSECfilings
Global Reinsurers’ Mid-Year 2013 Financial Results
Global Reinsurance Guide 2015 48
Summary of Company Reports

Global Reinsurance Guide 201549
Global Reinsurance Guide 2015 50
Insurance
Property/Casualty Insurers / U.S.
Alleghany CorporationAnd Insurance SubsidiariesUpdate
Key Rating DriversStrong Earnings with Transatlantic: Alleghany Corporation (Alleghany) posted net earnings of $354 million in the first six months of 2014, compared to $310 million in first-half 2013 and $629 million for full year 2013. These favorable results are driven by solid underwriting performance in both its reinsurance and insurance segments, with manageable catastrophe losses and favorable loss reserve development at Transatlantic Holdings, Inc. (Transatlantic)and RSUI Group, Inc. (RSUI).
Combined Ratios Remain Favorable: Alleghany reported a six-month 2014 consolidated combined ratio of 89.4%, which included 2.2 points for catastrophe losses and 4.7 points offavorable reserve development. This compares to a 2013 combined ratio of 90.1%, which included 3.6 points for catastrophe losses and 4.8 points of favorable reserve development.
Conservative Capitalization: Fitch Ratings believes Alleghany utilizes a reasonable amount of operating leverage compared with its (re)insurer peers, with net premiums written to total shareholders’ equity of 0.6x in 2013. Total GAAP stockholders’ equity of $7.4 billion at June 30,2014, is up from $6.9 billion at Dec. 31, 2013, as favorable net income and an increase in unrealized investment gains was partially offset by share repurchases.
Higher Casualty Reserve Risk: Fitch views Alleghany’s exposure to potential adverse development as being higher than companies that focus more on property business because the duration on casualty reserves is comparatively long. However, Fitch recognizes this risk appears to have been conservatively managed, supported by the fact Alleghany’s loss reserves have consistently developed favorably.
Reasonable Financial Leverage and Coverage: Alleghany’s financial leverage ratio was 19.8% at June 30, 2014, which Fitch considers reasonable for the rating category, down slightly from 20.4% at Dec. 31, 2013. Operating earnings-based interest coverage was a strong 8.7x in both the first half of 2014 and in 2013.
Rating SensitivitiesDowngrade Triggers: Key rating triggers that could result in a downgrade include significant adverse loss reserve development; movement to materially below-average underwriting or operating performance; sizable deterioration in subsidiary capitalization that caused net written premiums-to-surplus to exceed 1.0x for reinsurance operations and 1.2x for insurance operations; financial leverage maintained above 25%; run-rate operating earnings-based interest and preferred dividend coverage of less than 7.0x; significant acquisitions that reduce the company’s financial flexibility; and a substantial decline in the holding company’s cash position.
Upgrade Triggers: Key rating triggers that could lead to an upgrade over the long term include continued favorable underwriting results in line with higher rated P/C (re)insurer peers; material improvement in key financial metrics (e.g. net premiums written to equity) to more overcapitalized levels; and enhanced competitive positioning while maintaining strong profitability with low earnings volatility. In addition, the ratings of its subsidiary, RSUI, could be upgraded should Fitch consider the ratings core relative to Transatlantic.
RatingsLong-Term Issuer Default Rating A−Senior Unsecured Notes BBBTransatlantic Holdings, Inc.Long-Term Issuer Default Rating A−Senior Unsecured Notes BBB+Transatlantic Reinsurance CompanyFair American Insurance and Reinsurance CompanyInsurer Financial Strength A+RSUI Indemnity CompanyCovington Specialty Insurance CompanyLandmark American Insurance CompanyInsurer Financial Strength A
Rating OutlooksLong-Term Issuer Default Rating StableInsurer Financial Strength Stable
Financial DataAlleghany Corporation($ Mil.) 12/31/13 6/30/14Total Equity 6,948 7,407Total Debt 1,794 1,786Total Assets 23,361 23,842Operating Revenue 4,784 2,446Net Earnings 629 354Combined Ratio (%) 90.1 89.4ROAE (%) 9.4 9.9
Source: Alleghany Corporation.
Related Research
Related CriteriaInsurance Rating Methodology (November 2013)
AnalystsBrian C. Schneider, CPA, CPCU, ARe+1 312 606-2321 [email protected]
James B. Auden, CFA+1 312 [email protected]
www.fitchratings.com March 6, 2014
The ratings above were unsolicited and have been provided by Fitch as a service to investors.The issuer did not participate in the rating process, or provide additional information, beyond the issuer’s available public disclosure.
Insurance
Property/Casualty Insurers / U.S.
Alleghany CorporationAnd Insurance SubsidiariesUpdate
Key Rating DriversStrong Earnings with Transatlantic: Alleghany Corporation (Alleghany) posted net earnings of $354 million in the first six months of 2014, compared to $310 million in first-half 2013 and $629 million for full year 2013. These favorable results are driven by solid underwriting performance in both its reinsurance and insurance segments, with manageable catastrophe losses and favorable loss reserve development at Transatlantic Holdings, Inc. (Transatlantic)and RSUI Group, Inc. (RSUI).
Combined Ratios Remain Favorable: Alleghany reported a six-month 2014 consolidated combined ratio of 89.4%, which included 2.2 points for catastrophe losses and 4.7 points offavorable reserve development. This compares to a 2013 combined ratio of 90.1%, which included 3.6 points for catastrophe losses and 4.8 points of favorable reserve development.
Conservative Capitalization: Fitch Ratings believes Alleghany utilizes a reasonable amount of operating leverage compared with its (re)insurer peers, with net premiums written to total shareholders’ equity of 0.6x in 2013. Total GAAP stockholders’ equity of $7.4 billion at June 30,2014, is up from $6.9 billion at Dec. 31, 2013, as favorable net income and an increase in unrealized investment gains was partially offset by share repurchases.
Higher Casualty Reserve Risk: Fitch views Alleghany’s exposure to potential adverse development as being higher than companies that focus more on property business because the duration on casualty reserves is comparatively long. However, Fitch recognizes this risk appears to have been conservatively managed, supported by the fact Alleghany’s loss reserves have consistently developed favorably.
Reasonable Financial Leverage and Coverage: Alleghany’s financial leverage ratio was 19.8% at June 30, 2014, which Fitch considers reasonable for the rating category, down slightly from 20.4% at Dec. 31, 2013. Operating earnings-based interest coverage was a strong 8.7x in both the first half of 2014 and in 2013.
Rating SensitivitiesDowngrade Triggers: Key rating triggers that could result in a downgrade include significant adverse loss reserve development; movement to materially below-average underwriting or operating performance; sizable deterioration in subsidiary capitalization that caused net written premiums-to-surplus to exceed 1.0x for reinsurance operations and 1.2x for insurance operations; financial leverage maintained above 25%; run-rate operating earnings-based interest and preferred dividend coverage of less than 7.0x; significant acquisitions that reduce the company’s financial flexibility; and a substantial decline in the holding company’s cash position.
Upgrade Triggers: Key rating triggers that could lead to an upgrade over the long term include continued favorable underwriting results in line with higher rated P/C (re)insurer peers; material improvement in key financial metrics (e.g. net premiums written to equity) to more overcapitalized levels; and enhanced competitive positioning while maintaining strong profitability with low earnings volatility. In addition, the ratings of its subsidiary, RSUI, could be upgraded should Fitch consider the ratings core relative to Transatlantic.
RatingsLong-Term Issuer Default Rating A−Senior Unsecured Notes BBBTransatlantic Holdings, Inc.Long-Term Issuer Default Rating A−Senior Unsecured Notes BBB+Transatlantic Reinsurance CompanyFair American Insurance and Reinsurance CompanyInsurer Financial Strength A+RSUI Indemnity CompanyCovington Specialty Insurance CompanyLandmark American Insurance CompanyInsurer Financial Strength A
Rating OutlooksLong-Term Issuer Default Rating StableInsurer Financial Strength Stable
Financial DataAlleghany Corporation($ Mil.) 12/31/13 6/30/14Total Equity 6,948 7,407Total Debt 1,794 1,786Total Assets 23,361 23,842Operating Revenue 4,784 2,446Net Earnings 629 354Combined Ratio (%) 90.1 89.4ROAE (%) 9.4 9.9
Source: Alleghany Corporation.
Related Research
Related CriteriaInsurance Rating Methodology (November 2013)
AnalystsBrian C. Schneider, CPA, CPCU, ARe+1 312 606-2321 [email protected]
James B. Auden, CFA+1 312 [email protected]
www.fitchratings.com March 6, 2014
Related Research2015 Outlook: Global Reinsurance (September 2014)Alternative Reinsurance 2014 Market Update (September 2014)Global Reinsurance’s Shifting Landscape (September 2014)Latin American Reinsurance (September 2014)Reinsurer Mergers and Acquisitions (August 2014)Global Reinsurers’ Mid-Year 2014 Financial Results (August 2014)Asian Reinsurance Markets (August 2014)
Related CriteriaInsurance Rating Methodology (September 2014)
Global Reinsurance Guide 201551
InsuranceInsuranceProperty/Casualty Insurers / U.S.A.
Arch Capital Group Ltd.And Insurance Company SubsidiariesUpdate
Key Rating DriversConsistently Strong Profitability: Fitch Ratings views Arch Capital Group Ltd.’s (ACGL) profitability as strong, characterized by low and stable combined ratios and high returns on capital. The company’s earnings are exposed to potential volatility from large catastrophes, although, favorably, ACGL has posted an underwriting profit and overall net income in every year of its 12-year operating history. ACGL’s GAAP combined ratio was 85.7% in the first halfof 2014, compared with 85.9% for full-year 2013.
Favorable Financial Leverage and Coverage: ACGL’s financial leverage ratio is modest at 12.8% as of June 30, 2014, down from 13.8% at year-end 2013. This decline reflects growth in capital from net earnings and unrealized investment gains. Operating earnings-based interest and preferred dividend coverage was a strong 9.4x through the first half of 2014, down from 14.3x in 2013. This drop reflects additional interest expense on $500 million of debt issued for the purchase of CMG Mortgage Insurance Company (CMG).
Watford Re Provides Alternative Vehicle: ACGL owns 11% of Watford Re Ltd., which was launched in March 2014. It provides ACGL a more permanent sidecar vehicle that generates an additional diversified source of revenue through fee income for its underwriting expertise or from premiums by participating on Watford Re’s business, which is primarily multi-line casualty risk. Fitch does not believe Watford Re’s operations present meaningful additional risk or volatility to ACGL’s overall profile.
U.S. Mortgage Insurance Expansion: ACGL’s entrance into the U.S. mortgage insurance market through the January 2014 acquisition of CMG and the operating platform of PMI Mortgage Insurance Co. offers an opportunity for an additional diversified source of earnings. However, it also represents a challenge in generating favorable profitability in a line of business that experienced severe difficulty during the financial crisis.
Rating SensitivitiesUpgrade Triggers: Key rating triggers that could result in an upgrade include continued growth in equity into a larger market position and size/scale, while maintaining favorable run-rate earnings and low volatility, with a combined ratio in the low 90s. Successfully integrating the U.S. mortgage insurance operations and Watford Re platform, with exposure growth prudently managed, would be viewed favorably by Fitch. Other upgrade triggers include maintaining aratio of net premiums written to equity of 0.8x or lower; a financial leverage ratio at or below 20%; and operating earnings-based interest and preferred dividend coverage of at least 10x.Fitch’s evolving view of negative fundamental trends in the reinsurance sector could result in an affirmation and return to a stable outlook.
Downgrade Triggers: Key rating triggers that could result in a downgrade include a sizable adverse prior-year reserve development that causes Fitch to question ACGL’s better than peer underwriting results and lower than peer underwriting volatility. In addition, increases in underwriting leverage above a 1.0x net premiums written-to-equity ratio or a financial leverage ratio above 25% could generate negative rating pressure.
RatingsLong-Term Issuer Default Rating ASenior Unsecured A−Preferred Stock BBBArch Capital Group (U.S.) Inc.Senior Unsecured A−Arch Reinsurance CompanyArch Reinsurance Europe Underwriting LimitedArch Insurance CompanyArch Excess and Surplus Insurance CompanyArch Specialty Insurance CompanyArch Indemnity Insurance CompanyArch Insurance Company (Europe) LimitedInsurer Financial Strength A+
Rating OutlooksLong-Term Issuer Default Rating PositiveInsurer Financial Strength Positive
Financial DataArch Capital Group Ltd.($ Mil.) 12/31/13 6/30/14Total Equity 5,647 7,022Total Debt 900 900Total Assets 19,566 22,574Operating Revenue 3,456 1,926Net Income 688 380Combined Ratio (%) 85.9 85.7ROAE (%) 13.5 13.5
Related ResearchFitch Affirms Arch Capital’s Ratings; Outlook Remains Positive (August 2014)Global Reinsurers’ Mid-Year 2014 Financial Results (August 2014)Global Reinsurers’ 2013 Financial Results (April 2014)Bermuda 2014 Market Update(January 2014)2014 Outlook: Property/Casualty Insurance (December 2013)Alternative Reinsurance 2013 Market Update (September 2013)
Related Criteria Insurance Rating Methodology (November 2013)
AnalystsBrian C. Schneider, CPA, CPCU, ARe+1 312 606-2321 [email protected]
Martha M. Butler, CFA+1 312 [email protected]
www.fitchratings.com August 26, 2014
The ratings above were solicited by, or on behalf of, the issuer, and therefore, Fitch has been compensated for the provision of the ratings.
InsuranceProperty/Casualty Insurers / U.S.A.
Arch Capital Group Ltd.And Insurance Company SubsidiariesUpdate
Key Rating DriversConsistently Strong Profitability: Fitch Ratings views Arch Capital Group Ltd.’s (ACGL) profitability as strong, characterized by low and stable combined ratios and high returns on capital. The company’s earnings are exposed to potential volatility from large catastrophes, although, favorably, ACGL has posted an underwriting profit and overall net income in every year of its 12-year operating history. ACGL’s GAAP combined ratio was 85.7% in the first halfof 2014, compared with 85.9% for full-year 2013.
Favorable Financial Leverage and Coverage: ACGL’s financial leverage ratio is modest at 12.8% as of June 30, 2014, down from 13.8% at year-end 2013. This decline reflects growth in capital from net earnings and unrealized investment gains. Operating earnings-based interest and preferred dividend coverage was a strong 9.4x through the first half of 2014, down from 14.3x in 2013. This drop reflects additional interest expense on $500 million of debt issued for the purchase of CMG Mortgage Insurance Company (CMG).
Watford Re Provides Alternative Vehicle: ACGL owns 11% of Watford Re Ltd., which was launched in March 2014. It provides ACGL a more permanent sidecar vehicle that generates an additional diversified source of revenue through fee income for its underwriting expertise or from premiums by participating on Watford Re’s business, which is primarily multi-line casualty risk. Fitch does not believe Watford Re’s operations present meaningful additional risk or volatility to ACGL’s overall profile.
U.S. Mortgage Insurance Expansion: ACGL’s entrance into the U.S. mortgage insurance market through the January 2014 acquisition of CMG and the operating platform of PMI Mortgage Insurance Co. offers an opportunity for an additional diversified source of earnings. However, it also represents a challenge in generating favorable profitability in a line of business that experienced severe difficulty during the financial crisis.
Rating SensitivitiesUpgrade Triggers: Key rating triggers that could result in an upgrade include continued growth in equity into a larger market position and size/scale, while maintaining favorable run-rate earnings and low volatility, with a combined ratio in the low 90s. Successfully integrating the U.S. mortgage insurance operations and Watford Re platform, with exposure growth prudently managed, would be viewed favorably by Fitch. Other upgrade triggers include maintaining aratio of net premiums written to equity of 0.8x or lower; a financial leverage ratio at or below 20%; and operating earnings-based interest and preferred dividend coverage of at least 10x.Fitch’s evolving view of negative fundamental trends in the reinsurance sector could result in an affirmation and return to a stable outlook.
Downgrade Triggers: Key rating triggers that could result in a downgrade include a sizable adverse prior-year reserve development that causes Fitch to question ACGL’s better than peer underwriting results and lower than peer underwriting volatility. In addition, increases in underwriting leverage above a 1.0x net premiums written-to-equity ratio or a financial leverage ratio above 25% could generate negative rating pressure.
RatingsLong-Term Issuer Default Rating ASenior Unsecured A−Preferred Stock BBBArch Capital Group (U.S.) Inc.Senior Unsecured A−Arch Reinsurance CompanyArch Reinsurance Europe Underwriting LimitedArch Insurance CompanyArch Excess and Surplus Insurance CompanyArch Specialty Insurance CompanyArch Indemnity Insurance CompanyArch Insurance Company (Europe) LimitedInsurer Financial Strength A+
Rating OutlooksLong-Term Issuer Default Rating PositiveInsurer Financial Strength Positive
Financial DataArch Capital Group Ltd.($ Mil.) 12/31/13 6/30/14Total Equity 5,647 7,022Total Debt 900 900Total Assets 19,566 22,574Operating Revenue 3,456 1,926Net Income 688 380Combined Ratio (%) 85.9 85.7ROAE (%) 13.5 13.5
Related ResearchFitch Affirms Arch Capital’s Ratings; Outlook Remains Positive (August 2014)Global Reinsurers’ Mid-Year 2014 Financial Results (August 2014)Global Reinsurers’ 2013 Financial Results (April 2014)Bermuda 2014 Market Update(January 2014)2014 Outlook: Property/Casualty Insurance (December 2013)Alternative Reinsurance 2013 Market Update (September 2013)
Related Criteria Insurance Rating Methodology (November 2013)
AnalystsBrian C. Schneider, CPA, CPCU, ARe+1 312 606-2321 [email protected]
Martha M. Butler, CFA+1 312 [email protected]
www.fitchratings.com August 26, 2014
Related Research2015 Outlook: Global Reinsurance (September 2014)Alternative Reinsurance 2014 Market Update (September 2014)Global Reinsurance’s Shifting Landscape (September 2014)Latin American Reinsurance (September 2014)Reinsurer Mergers and Acquisitions (August 2014)Global Reinsurers’ Mid-Year 2014 Financial Results (August 2014)Asian Reinsurance Markets (August 2014)
Related CriteriaInsurance Rating Methodology (September 2014)
Global Reinsurance Guide 2015 52
InsuranceProperty/Casualty Insurers/Bermuda
AXIS Capital Holdings, Ltd.And SubsidiariesUpdate
Key Rating DriversSolid Capitalization: Fitch Ratings views AXIS Capital Holdings, Ltd.’s (AXIS) capitalization as solid with operating leverage (as measured by prior 12 months net premiums written to shareholders’ equity) of 0.67x as of June 30, 2014. The company's shareholders' equity increased by 2.4% to $6.0 billion as of June 30, 2014, as net income and unrealized investment gains were partially offset by share repurchases and dividends. AXIS’s financial leverage remains moderate at 20.2% as of June 30, 2014.
Historically Strong Underwriting Results: AXIS has demonstrated solid underwriting results with a 10-year average combined ratio of 89.6% from 2004–2013. The company reported a 91.3% combined ratio for the first half of 2014 (including 2.6pp related to catastrophe losses and 6.7pp of favorable reserve development). This is in line with a combined ratio of 91.0% in 2013 (including 5.4pp related to catastrophe losses and 5.9pp of favorable reserve development).
Diverse Premium Base: Premium diversification allows AXIS to compete effectively in variousmarket conditions and also reduces its exposure to any one segment or product. The companyreported net written premium growth of 4% during the first half of 2014 and 18% during full year 2013, largely driven by growth in its new business lines: accident & health and agriculture.
Catastrophe Exposure in Line with Peers: Fitch views AXIS’s catastrophe exposure as significant, but in line with peer companies in similar lines of business and somewhat mitigated by its reinsurance programs. Among other measures, the company manages its enterprisewide exposure to catastrophic events by zone and return period, such that a 1-in-250-year single event within a single zone is estimated at no more than 25% of prior quarter-end common stockholders’equity.
Reserve Development Likely to Moderate: AXIS's history of favorable reserve development has benefited earnings; however, Fitch expects favorable development to diminish going forward as underwriting experience from recent soft market accident years mature. The agency continues to view AXIS’s reserves as modestly redundant.
Rating SensitivitiesFactors Supporting a Downgrade: Factors that could lead to a downgrade include a significant loss of capital resulting from a major catastrophic event that is worse than expectations or industry and peer company results; an inability to raise capital following a large loss event; a failure to maintain an underwriting profit for an extended period; an increase in operating leverage above a 1.0x net written premiums-to-equity ratio; significant reserve deficiencies; GAAP fixed-charge coverage (including preferred dividends) below 7.0x for a sustained period; or financial leverage above 25%.
Factors Supporting an Upgrade: Factors that could lead to an upgrade include a significant increase in capital that meaningfully reduces operating leverage and reduced exposure to catastrophe losses. However, given publicly traded companies' sensitivity around managing capital, Fitch believes the company is unlikely to move toward this level of overcapitalization.
Ratings
Security Class RatingLong-Term Issuer Default Rating ASenior Unsecured A–Preferred Stock BBB
AXIS Insurance Co.AXIS Reinsurance CompanyAXIS Specialty LimitedAXIS Surplus Insurance Co.AXIS Specialty Insurance Co.Insurer Financial Strength A+
Rating OutlookStable
Financial Data
AXIS Capital Holdings, Ltd.($ Mil.) 12/31/13 6/30/14Total Equity 5,868 6,009Total Debt 996 1,490Total Assets 19,635 21,446Operating Revenue 4,121 2,149Net Income 684 328Combined Ratio 91.0 91.3ROAE (%) 13.1 12.5
Source: SEC filings.
Related Research
Related Criteria Insurance Rating Methodology (November 2013)
AnalystsBrian C. Schneider, CPA, CPCU, ARe+1 312 606-2321 [email protected]
Doug M. Pawlowski, CFA+1 312 [email protected]
www.fitchratings.com April 3, 2014
The ratings above were unsolicited and have been provided by Fitch as a service to investors.The issuer did not participate in the rating process, or provide additional information, beyond the issuer’s available public disclosure.
InsuranceProperty/Casualty Insurers/Bermuda
AXIS Capital Holdings, Ltd.And SubsidiariesUpdate
Key Rating DriversSolid Capitalization: Fitch Ratings views AXIS Capital Holdings, Ltd.’s (AXIS) capitalization as solid with operating leverage (as measured by prior 12 months net premiums written to shareholders’ equity) of 0.67x as of June 30, 2014. The company's shareholders' equity increased by 2.4% to $6.0 billion as of June 30, 2014, as net income and unrealized investment gains were partially offset by share repurchases and dividends. AXIS’s financial leverage remains moderate at 20.2% as of June 30, 2014.
Historically Strong Underwriting Results: AXIS has demonstrated solid underwriting results with a 10-year average combined ratio of 89.6% from 2004–2013. The company reported a 91.3% combined ratio for the first half of 2014 (including 2.6pp related to catastrophe losses and 6.7pp of favorable reserve development). This is in line with a combined ratio of 91.0% in 2013 (including 5.4pp related to catastrophe losses and 5.9pp of favorable reserve development).
Diverse Premium Base: Premium diversification allows AXIS to compete effectively in variousmarket conditions and also reduces its exposure to any one segment or product. The companyreported net written premium growth of 4% during the first half of 2014 and 18% during full year 2013, largely driven by growth in its new business lines: accident & health and agriculture.
Catastrophe Exposure in Line with Peers: Fitch views AXIS’s catastrophe exposure as significant, but in line with peer companies in similar lines of business and somewhat mitigated by its reinsurance programs. Among other measures, the company manages its enterprisewide exposure to catastrophic events by zone and return period, such that a 1-in-250-year single event within a single zone is estimated at no more than 25% of prior quarter-end common stockholders’equity.
Reserve Development Likely to Moderate: AXIS's history of favorable reserve development has benefited earnings; however, Fitch expects favorable development to diminish going forward as underwriting experience from recent soft market accident years mature. The agency continues to view AXIS’s reserves as modestly redundant.
Rating SensitivitiesFactors Supporting a Downgrade: Factors that could lead to a downgrade include a significant loss of capital resulting from a major catastrophic event that is worse than expectations or industry and peer company results; an inability to raise capital following a large loss event; a failure to maintain an underwriting profit for an extended period; an increase in operating leverage above a 1.0x net written premiums-to-equity ratio; significant reserve deficiencies; GAAP fixed-charge coverage (including preferred dividends) below 7.0x for a sustained period; or financial leverage above 25%.
Factors Supporting an Upgrade: Factors that could lead to an upgrade include a significant increase in capital that meaningfully reduces operating leverage and reduced exposure to catastrophe losses. However, given publicly traded companies' sensitivity around managing capital, Fitch believes the company is unlikely to move toward this level of overcapitalization.
Ratings
Security Class RatingLong-Term Issuer Default Rating ASenior Unsecured A–Preferred Stock BBB
AXIS Insurance Co.AXIS Reinsurance CompanyAXIS Specialty LimitedAXIS Surplus Insurance Co.AXIS Specialty Insurance Co.Insurer Financial Strength A+
Rating OutlookStable
Financial Data
AXIS Capital Holdings, Ltd.($ Mil.) 12/31/13 6/30/14Total Equity 5,868 6,009Total Debt 996 1,490Total Assets 19,635 21,446Operating Revenue 4,121 2,149Net Income 684 328Combined Ratio 91.0 91.3ROAE (%) 13.1 12.5
Source: SEC filings.
Related Research
Related Criteria Insurance Rating Methodology (November 2013)
AnalystsBrian C. Schneider, CPA, CPCU, ARe+1 312 606-2321 [email protected]
Doug M. Pawlowski, CFA+1 312 [email protected]
www.fitchratings.com April 3, 2014
Related Research2015 Outlook: Global Reinsurance (September 2014)Alternative Reinsurance 2014 Market Update (September 2014)Global Reinsurance’s Shifting Landscape (September 2014)Latin American Reinsurance (September 2014)Reinsurer Mergers and Acquisitions (August 2014)Global Reinsurers’ Mid-Year 2014 Financial Results (August 2014)Asian Reinsurance Markets (August 2014)
Related CriteriaInsurance Rating Methodology (September 2014)
Global Reinsurance Guide 201553
InsuranceInsuranceProperty/Casualty Insurers / U.S.A.
Berkshire Hathaway Inc. And Insurance SubsidiariesUpdate Report
Key Rating DriversStrong Capital Profile: Berkshire Hathaway Inc.’s (BRK) capitalization remains a key credit characteristic at both the insurance operating subsidiaries and at the holding company level. Capitalization was “extremely strong” at BRK’s consolidated insurance operations, measured by Fitch Ratings’ Prism capital model at year-end 2013. At the holding company level, the financial leverage ratio was 14% at June 30, 2014 and was calculated to include holding company debt, insurance debt and finance segment debt guaranteed by the holding company.
Solid Insurance Operating Performance: BRK has a unique insurance franchise with major positions in reinsurance and personal auto lines. The consolidated insurance operations have a history of sizeable underwriting profits, for example, the statutory underwriting combined ratio averaged 92.1% over the five-year period between 2009−2013. Return on averagepolicyholders’ surplus over the same five-year period was nearly 9%.
Excellent Financial Flexibility and Liquidity: Fitch views BRK’s liquidity and financial flexibility as very strong. BRK consistently reports solid operating cash flow, maintains a largeand liquid investment portfolio and has excellent access to capital market. At June 30, 2014, BRK had approximately $55 billion of cash and equivalents on a consolidated basis that is held primarily within the insurance operations.
Material Risk Exposures: BRK’s $119 billion common stock holdings and $32 billion notional value in equity index put options represent greater exposure to equity market movements than peers. Concentration risk exists since more than one-half of BRK’s common stocks were invested in four companies, American Express Co., Wells Fargo & Co., International Business Machines Corp. and The Coca-Cola Co. Layered on top of investment risk is exposure to catastrophe losses, risks related to the company’s acquisition strategy as well as key man risk with CEO Warren Buffett.
Rating SensitivitiesDeterioration in Key Insurance Subsidiaries: A decline in the credit quality of key insurance subsidiaries below the ‘AA+’ rating measured by Fitch’s judgment of capitalization, a total financing and commitment ratio greater than 1.5x, net leverage (excluding affiliated investments) greater than 3.5x or a sharp and persistent reduction in underwriting profits could lead to a downgrade.
A Change in Leverage: A run-rate debt-to-total capital ratio from the holding company orinsurance and finance debt guaranteed by the holding company greater than 25% could lead to a downgrade. Conversely, a commitment to lower debt-to-tangible capital ratios attributed to the holding company, insurance and finance operations could lead to an upgrade. However, Fitch believes that this would likely require the scaling back of the finance operations.
Reduced Holding Company Cash: Acquisitions or other actions that reduce consolidated cash holdings below $10 billion or approximately 5x consolidated interest expense could lead to a downgrade.
Increased Leveraged Equity Exposure: Material increase in leveraged equity market exposure, such as its equity index put derivative portfolio, could lead to a downgrade.
RatingsSecurity Class RatingLong-Term Issuer Default AA−Senior Unsecured Debt A+Commercial Paper F1+
Insurance SubsidiariesInsurer Financial Strength AA+
Rating Outlook
Stable
Financial Data($ Mil.) 6/30/14Net Income 11,231Stockholders’ Equity 236,760Debt and Hybrids 74,087
Return on Equity (%) 9.8
Note: Consolidated GAAP; six months ended June 30, 2014. ROE annualized. Source: SNL Financial.
Related Research Fitch Rates Berkshire Hathaway Senior Debt Issue ‘A+’ (August 2014) 2014 Outlook: Property/Casualty Insurance (December 2013)2014 Outlook: Global Reinsurers (August 2013)
AnalystsDouglas M. Pawlowski, CFA+1 312 [email protected]
Christopher A. Grimes, CFA+1 312 [email protected]
www.fitchratings.com August 20, 2014
The ratings above were unsolicited and have been provided by Fitch as a service to investors.The issuer did not participate in the rating process, or provide additional information, beyond the issuer’s available public disclosure.
InsuranceProperty/Casualty Insurers / U.S.A.
Berkshire Hathaway Inc. And Insurance SubsidiariesUpdate Report
Key Rating DriversStrong Capital Profile: Berkshire Hathaway Inc.’s (BRK) capitalization remains a key credit characteristic at both the insurance operating subsidiaries and at the holding company level. Capitalization was “extremely strong” at BRK’s consolidated insurance operations, measured by Fitch Ratings’ Prism capital model at year-end 2013. At the holding company level, the financial leverage ratio was 14% at June 30, 2014 and was calculated to include holding company debt, insurance debt and finance segment debt guaranteed by the holding company.
Solid Insurance Operating Performance: BRK has a unique insurance franchise with major positions in reinsurance and personal auto lines. The consolidated insurance operations have a history of sizeable underwriting profits, for example, the statutory underwriting combined ratio averaged 92.1% over the five-year period between 2009−2013. Return on averagepolicyholders’ surplus over the same five-year period was nearly 9%.
Excellent Financial Flexibility and Liquidity: Fitch views BRK’s liquidity and financial flexibility as very strong. BRK consistently reports solid operating cash flow, maintains a largeand liquid investment portfolio and has excellent access to capital market. At June 30, 2014, BRK had approximately $55 billion of cash and equivalents on a consolidated basis that is held primarily within the insurance operations.
Material Risk Exposures: BRK’s $119 billion common stock holdings and $32 billion notional value in equity index put options represent greater exposure to equity market movements than peers. Concentration risk exists since more than one-half of BRK’s common stocks were invested in four companies, American Express Co., Wells Fargo & Co., International Business Machines Corp. and The Coca-Cola Co. Layered on top of investment risk is exposure to catastrophe losses, risks related to the company’s acquisition strategy as well as key man risk with CEO Warren Buffett.
Rating SensitivitiesDeterioration in Key Insurance Subsidiaries: A decline in the credit quality of key insurance subsidiaries below the ‘AA+’ rating measured by Fitch’s judgment of capitalization, a total financing and commitment ratio greater than 1.5x, net leverage (excluding affiliated investments) greater than 3.5x or a sharp and persistent reduction in underwriting profits could lead to a downgrade.
A Change in Leverage: A run-rate debt-to-total capital ratio from the holding company orinsurance and finance debt guaranteed by the holding company greater than 25% could lead to a downgrade. Conversely, a commitment to lower debt-to-tangible capital ratios attributed to the holding company, insurance and finance operations could lead to an upgrade. However, Fitch believes that this would likely require the scaling back of the finance operations.
Reduced Holding Company Cash: Acquisitions or other actions that reduce consolidated cash holdings below $10 billion or approximately 5x consolidated interest expense could lead to a downgrade.
Increased Leveraged Equity Exposure: Material increase in leveraged equity market exposure, such as its equity index put derivative portfolio, could lead to a downgrade.
RatingsSecurity Class RatingLong-Term Issuer Default AA−Senior Unsecured Debt A+Commercial Paper F1+
Insurance SubsidiariesInsurer Financial Strength AA+
Rating Outlook
Stable
Financial Data($ Mil.) 6/30/14Net Income 11,231Stockholders’ Equity 236,760Debt and Hybrids 74,087
Return on Equity (%) 9.8
Note: Consolidated GAAP; six months ended June 30, 2014. ROE annualized. Source: SNL Financial.
Related Research Fitch Rates Berkshire Hathaway Senior Debt Issue ‘A+’ (August 2014) 2014 Outlook: Property/Casualty Insurance (December 2013)2014 Outlook: Global Reinsurers (August 2013)
AnalystsDouglas M. Pawlowski, CFA+1 312 [email protected]
Christopher A. Grimes, CFA+1 312 [email protected]
www.fitchratings.com August 20, 2014
Related Research2015 Outlook: Global Reinsurance (September 2014)Alternative Reinsurance 2014 Market Update (September 2014)Global Reinsurance’s Shifting Landscape (September 2014)Latin American Reinsurance (September 2014)Reinsurer Mergers and Acquisitions (August 2014)Global Reinsurers’ Mid-Year 2014 Financial Results (August 2014)Asian Reinsurance Markets (August 2014)
Related CriteriaInsurance Rating Methodology (September 2014)
Global Reinsurance Guide 2015 54
Insurance
www.fitchratings.com 1 September 201422 August 2014
Germany xx
Hannover Rueck SE Full Rating Report
Key Rating Drivers Reduced Financial Leverage: Hannover Rueck SE’s (Hannover Re) financial leverage declined to 19.8% in 1H14 as the company redeemed in full amount the EUR750m subordinated bond issue in February 2014. The reinsurer’s fixed charge coverage is expected to improve for end-2014 as the amount of interest paid reduces. The five-year average for fixed charge coverage ratio is 11.6x, which remains supportive of the rating.
Strong Capitalisation: Hannover Re’s capital adequacy, as measured by Fitch Ratings, is considered to be very strong and a positive rating factor. The reinsurer has organically grown its shareholders’ equity to EUR6.5bn at end-2013 from EUR3.3bn at end-2008, supported by strong and consistent levels of retained earnings. Quality is marginally reduced by a higher level of hybrid debt present within the reinsurer’s capital structure. This is mitigated by what the agency considers to be a less volatile mix of business relative to peers.
Solid and Consistent Earnings: In 2013 Hannover Re’s earnings remained strong, driven by very strong performance of its non-life reinsurance segment; the company reported net income of EUR895m (2012: EUR850m). Fitch views positively the stability of Hannover Re’s earnings generation in recent years and believes that this reflects the diversified nature of the reinsurer’s business profile, as well as its prudent investment strategy.
Lower Volatility Versus Peers: The Fitch-calculated 2013 combined ratio improved to 94.4% (2012: 95.7%) despite major losses which came at EUR578m, below company’s expectations. Catastrophe losses accounted for 8.4pp (2012: 7.0pp) of the company’s reported combined ratio. The volatility of the combined ratio also remained lower than peers, which in Fitch’s view reflects Hannover Re’s selective underwriting approach and focus on preserving margins rather than on strong growth.
Developing Life & Health Business: In 2013 the life & health segment delivered lower net income of EUR161m (2012: EUR227m) mainly due to reserve strengthening required for its Australian disability business. The life & health reinsurance business continues to grow, although the segment’s contribution to Hannover Re’s profits remains modest. In the medium term, the contribution made by this segment is expected to increase, reflecting the reinsurer’s higher premium growth target of 5%-7%.
Strong Global Franchise: Hannover Re is one of a select band of global reinsurance companies with the financial strength to provide underwriting capacity across a broad range of underwriting classes and geographical markets. This is expected to provide a good degree of resilience to a protracted period of price softening, should this occur. Hannover Re maintains a strong position in the property & casualty (P&C) reinsurance market and a strengthening position in life & health reinsurance.
Rating Sensitivities Upgrade Unlikely: An upgrade is considered unlikely in the near-term, but could be achieved over the longer-term if financial leverage declines to 15%, the combined ratio remains below 93% and capitalisation remains very strong.
Downgrade Triggers: Hannover Re’s ratings could be downgraded if its net financial leverage is consistently above 25%; its fixed charge coverage is consistently below 9x; and its combined ratio is consistently above 100%.
Ratings Insurer Financial Strength AA- Long-Term Foreign-Currency IDR AA- Subordinated Debt A E+S Rueckversicherung AG Insurer Financial Strength AA- Sovereign Risk Long-Term Foreign-Currency IDR AAA Long-Term Local-Currency IDR AAA
Outlooks Insurer Financial Strength Stable
Long-Term Foreign-Currency IDR Stable
Related Research Global Reinsurers' 2013 Financial Results (April 2014)
Hurricane Season 2014: A Desk Reference for Insurance Investors (May 2014)
Analysts Martyn Street +44 20 3530 1211 [email protected] Harish Gohil +44 20 3530 1257 [email protected]
Financial Data Hannover Re
31 Dec 13 31 Dec 12
Total assets (EURbn) 53.9 54.8
Total equity (EURbn) 6.5 6.7
Net income (EURm) 895 850 Combined ratio – P&C RI (%) 94.4 95.7 Return on equity (after tax) (%) 15.0 15.4
The ratings above were unsolicited and have been provided by Fitch as a service to investors.The issuer did not participate in the rating process, or provide additional information, beyond the issuer’s available public disclosure.
Update
Insurance
www.fitchratings.com 1 September 201422 August 2014
Germany xx
Hannover Rueck SE Full Rating Report
Key Rating Drivers Reduced Financial Leverage: Hannover Rueck SE’s (Hannover Re) financial leverage declined to 19.8% in 1H14 as the company redeemed in full amount the EUR750m subordinated bond issue in February 2014. The reinsurer’s fixed charge coverage is expected to improve for end-2014 as the amount of interest paid reduces. The five-year average for fixed charge coverage ratio is 11.6x, which remains supportive of the rating.
Strong Capitalisation: Hannover Re’s capital adequacy, as measured by Fitch Ratings, is considered to be very strong and a positive rating factor. The reinsurer has organically grown its shareholders’ equity to EUR6.5bn at end-2013 from EUR3.3bn at end-2008, supported by strong and consistent levels of retained earnings. Quality is marginally reduced by a higher level of hybrid debt present within the reinsurer’s capital structure. This is mitigated by what the agency considers to be a less volatile mix of business relative to peers.
Solid and Consistent Earnings: In 2013 Hannover Re’s earnings remained strong, driven by very strong performance of its non-life reinsurance segment; the company reported net income of EUR895m (2012: EUR850m). Fitch views positively the stability of Hannover Re’s earnings generation in recent years and believes that this reflects the diversified nature of the reinsurer’s business profile, as well as its prudent investment strategy.
Lower Volatility Versus Peers: The Fitch-calculated 2013 combined ratio improved to 94.4% (2012: 95.7%) despite major losses which came at EUR578m, below company’s expectations. Catastrophe losses accounted for 8.4pp (2012: 7.0pp) of the company’s reported combined ratio. The volatility of the combined ratio also remained lower than peers, which in Fitch’s view reflects Hannover Re’s selective underwriting approach and focus on preserving margins rather than on strong growth.
Developing Life & Health Business: In 2013 the life & health segment delivered lower net income of EUR161m (2012: EUR227m) mainly due to reserve strengthening required for its Australian disability business. The life & health reinsurance business continues to grow, although the segment’s contribution to Hannover Re’s profits remains modest. In the medium term, the contribution made by this segment is expected to increase, reflecting the reinsurer’s higher premium growth target of 5%-7%.
Strong Global Franchise: Hannover Re is one of a select band of global reinsurance companies with the financial strength to provide underwriting capacity across a broad range of underwriting classes and geographical markets. This is expected to provide a good degree of resilience to a protracted period of price softening, should this occur. Hannover Re maintains a strong position in the property & casualty (P&C) reinsurance market and a strengthening position in life & health reinsurance.
Rating Sensitivities Upgrade Unlikely: An upgrade is considered unlikely in the near-term, but could be achieved over the longer-term if financial leverage declines to 15%, the combined ratio remains below 93% and capitalisation remains very strong.
Downgrade Triggers: Hannover Re’s ratings could be downgraded if its net financial leverage is consistently above 25%; its fixed charge coverage is consistently below 9x; and its combined ratio is consistently above 100%.
Ratings Insurer Financial Strength AA- Long-Term Foreign-Currency IDR AA- Subordinated Debt A E+S Rueckversicherung AG Insurer Financial Strength AA- Sovereign Risk Long-Term Foreign-Currency IDR AAA Long-Term Local-Currency IDR AAA
Outlooks Insurer Financial Strength Stable
Long-Term Foreign-Currency IDR Stable
Related Research Global Reinsurers' 2013 Financial Results (April 2014)
Hurricane Season 2014: A Desk Reference for Insurance Investors (May 2014)
Analysts Martyn Street +44 20 3530 1211 [email protected] Harish Gohil +44 20 3530 1257 [email protected]
Financial Data Hannover Re
31 Dec 13 31 Dec 12
Total assets (EURbn) 53.9 54.8
Total equity (EURbn) 6.5 6.7
Net income (EURm) 895 850 Combined ratio – P&C RI (%) 94.4 95.7 Return on equity (after tax) (%) 15.0 15.4
Related Research2015 Outlook: Global Reinsurance (September 2014)Alternative Reinsurance 2014 Market Update (September 2014)Global Reinsurance’s Shifting Landscape (September 2014)Latin American Reinsurance (September 2014)Reinsurer Mergers and Acquisitions (August 2014)Global Reinsurers’ Mid-Year 2014 Financial Results (August 2014)Asian Reinsurance Markets (August 2014)
Related CriteriaInsurance Rating Methodology (September 2014)
Global Reinsurance Guide 201555
InsuranceInsurance
www.fitchratings.com 31 July 2014
Reinsurers / United Kingdom
Lloyd’s of London Full Rating Report
Key Rating Drivers Disciplined Underwriting Approach: Underwriting conditions across several major (re)insurance classes are deteriorating, making continued underwriting discipline by market participants important. The diversity provided by Lloyd’s of London’s (Lloyd’s) (re)insurance portfolio, by line of business and geographically, is expected to be resilient to a protracted period of price softening, should this occur.
PMD’s Market Oversight Positive: Fitch Ratings views the Performance Management Directorate’s (PMD) market oversight as key in the reduction in cross-cycle earnings volatility since it was established in 2003. Processes including business plan reviews and syndicate benchmarking have helped the Corporation of Lloyd’s and syndicates improve key aspects of underwriting, including pricing, reserving, claims management, risk-adjusted capital setting and catastrophe modelling techniques.
Good Performance Versus Peers: Lloyd’s has achieved marginally reduced cross-cycle earnings volatility in the context of the wider industry, both in absolute terms and when compared with peers. Fitch believes this is a direct result of the measures introduced by PMD and other Corporation departments.
Continued Favourable Reserve Development: The work undertaken by the PMD has provided Fitch with increased confidence that, on an aggregate basis, prior underwriting years will develop favourably in the next two years. Of the seven main business classes, casualty and motor reserves are the agency’s key focus.
Extensive Financial Flexibility: The variety of funding sources for the central fund (see Appendix B: Glossary) gives Lloyd’s significant financial flexibility, being able to raise funds both internally – through contributions, levies and syndicate loans – and externally through the capital markets.
Strong Capitalisation: Fitch expects capitalisation to support the rating, assuming future losses fall within limits expected by Lloyd’s. The three-layered capital structure at Lloyd’s – syndicates’ premium trust funds, members’ funds at Lloyd’s and the central fund – remained strong in 2013, helped by reduced large loss activity during the year.
Rating Sensitivities Upgrade Unlikely: An upgrade is unlikely in the near to medium term, as credit metrics are not expected to strengthen significantly over the rating horizon.
Underwriting Deterioration/Increased Leverage: A downgrade may occur if the normalised combined ratio remains above 97% or if leverage, as measured by net premiums written to equity, rises above 1.2x.
Ratings Lloyd’s of London Insurer Financial Strength Rating AA− The Society of Lloyd’s Long-Term IDR A+ Subordinated debt A− Lloyd’s Insurance Company (China) Ltd Insurer Financial Strength Rating AA−
Outlooks Insurer Financial Strength Ratings Stable Long-Term IDR Stable
Financial Data Lloyd’s of London 2013 2012 Total assets (GBPm) 76,579 78,091 Total liabilities (GBPm) 56,193 58,791 Gross written premiums (GBPm)
26,106 25,500
Pre-tax profit (GBPm) 3,205 2,771 Combined ratio (%) 86.8 91.1 Return on capital (%) 16.2 14.8
Related Research Hurricane Season 2014: A Desk Reference for Insurance Investors (May 2014) UK Non-Life: London Market Comment (May 2014) Global Reinsurers' 2013 Financial Results (April 2014)
Analysts Martyn Street +44 20 3530 1211 [email protected] Anna Bender +44 20 3530 1671 [email protected]
The ratings above were solicited by, or on behalf of, the issuer, and therefore, Fitch has been compensated for the provision of the ratings.
Update
Insurance
www.fitchratings.com 31 July 2014
Reinsurers / United Kingdom
Lloyd’s of London Full Rating Report
Key Rating Drivers Disciplined Underwriting Approach: Underwriting conditions across several major (re)insurance classes are deteriorating, making continued underwriting discipline by market participants important. The diversity provided by Lloyd’s of London’s (Lloyd’s) (re)insurance portfolio, by line of business and geographically, is expected to be resilient to a protracted period of price softening, should this occur.
PMD’s Market Oversight Positive: Fitch Ratings views the Performance Management Directorate’s (PMD) market oversight as key in the reduction in cross-cycle earnings volatility since it was established in 2003. Processes including business plan reviews and syndicate benchmarking have helped the Corporation of Lloyd’s and syndicates improve key aspects of underwriting, including pricing, reserving, claims management, risk-adjusted capital setting and catastrophe modelling techniques.
Good Performance Versus Peers: Lloyd’s has achieved marginally reduced cross-cycle earnings volatility in the context of the wider industry, both in absolute terms and when compared with peers. Fitch believes this is a direct result of the measures introduced by PMD and other Corporation departments.
Continued Favourable Reserve Development: The work undertaken by the PMD has provided Fitch with increased confidence that, on an aggregate basis, prior underwriting years will develop favourably in the next two years. Of the seven main business classes, casualty and motor reserves are the agency’s key focus.
Extensive Financial Flexibility: The variety of funding sources for the central fund (see Appendix B: Glossary) gives Lloyd’s significant financial flexibility, being able to raise funds both internally – through contributions, levies and syndicate loans – and externally through the capital markets.
Strong Capitalisation: Fitch expects capitalisation to support the rating, assuming future losses fall within limits expected by Lloyd’s. The three-layered capital structure at Lloyd’s – syndicates’ premium trust funds, members’ funds at Lloyd’s and the central fund – remained strong in 2013, helped by reduced large loss activity during the year.
Rating Sensitivities Upgrade Unlikely: An upgrade is unlikely in the near to medium term, as credit metrics are not expected to strengthen significantly over the rating horizon.
Underwriting Deterioration/Increased Leverage: A downgrade may occur if the normalised combined ratio remains above 97% or if leverage, as measured by net premiums written to equity, rises above 1.2x.
Ratings Lloyd’s of London Insurer Financial Strength Rating AA− The Society of Lloyd’s Long-Term IDR A+ Subordinated debt A− Lloyd’s Insurance Company (China) Ltd Insurer Financial Strength Rating AA−
Outlooks Insurer Financial Strength Ratings Stable Long-Term IDR Stable
Financial Data Lloyd’s of London 2013 2012 Total assets (GBPm) 76,579 78,091 Total liabilities (GBPm) 56,193 58,791 Gross written premiums (GBPm)
26,106 25,500
Pre-tax profit (GBPm) 3,205 2,771 Combined ratio (%) 86.8 91.1 Return on capital (%) 16.2 14.8
Related Research Hurricane Season 2014: A Desk Reference for Insurance Investors (May 2014) UK Non-Life: London Market Comment (May 2014) Global Reinsurers' 2013 Financial Results (April 2014)
Analysts Martyn Street +44 20 3530 1211 [email protected] Anna Bender +44 20 3530 1671 [email protected]
Related Research2015 Outlook: Global Reinsurance (September 2014)Alternative Reinsurance 2014 Market Update (September 2014)Global Reinsurance’s Shifting Landscape (September 2014)Latin American Reinsurance (September 2014)Reinsurer Mergers and Acquisitions (August 2014)Global Reinsurers’ Mid-Year 2014 Financial Results (August 2014)Asian Reinsurance Markets (August 2014)
Related CriteriaInsurance Rating Methodology (September 2014)
Global Reinsurance Guide 2015 56
Insurance
www.fitchratings.com 1 September 2014
Reinsurers / Germany
Munich Reinsurance Company And Subsidiaries Update
Key Rating Drivers Consistently Strong Group Earnings: Munich Reinsurance Company’s ability to generate strong and consistent earnings is underpinned by the significant scale, dominant market position and diversity of the (re)insurance operating companies that form the Munich Re group. Fitch Ratings expects Munich Re’s core reinsurance business to drive the company’s profitability in the medium term, with its ERGO-branded primary insurance operations providing some diversification in earnings and business lines.
Reinsurance Underwriting Volatile: Despite the diversity of operating companies, past group results have been volatile because of the significant scale of the property and catastrophe (P&C) reinsurance segment. P&C reinsurance contributed over 70% of group net profits in 2013 (2012: 81%). Underwriting performance compared with a peer group of Fitch’s rated reinsurance universe is viewed as a key factor in determining the future direction of the rating.
Capitalisation Very Strong: Fitch regards Munich Re's capitalisation as very strong and commensurate with the ratings. While the reinsurer’s IFRS equity is sensitive to interest rate-induced movements in the market value of its fixed-interest investment portfolio, the agency considers that such sensitivity on an economic value basis would be reduced by offsetting movements in the value of liabilities. Strong capitalisation enables the reinsurer to provide underwriting capacity on a continuous and large scale basis, should it wish to do so.
Primary Operations in Transition: Munich Re’s primary life and international primary non-life operations are improving. Over the medium term, earnings contributions from these operations are expected to form a more significant part of overall group earnings.
Leverage and Coverage Adequate: Fitch views Munich Re's financial debt leverage as commensurate with the ratings, standing at 16% at end-2013. The agency expects that leverage will remain within an acceptable range for the ratings in the medium term. Asset risk is low to moderate with little exposure to equities and alternative investments, and credit risk is moderate.
Limited Retrocession, Manageable Exposure: Munich Re uses limited retrocession coverage and other forms of risk mitigation, leaving net losses near to gross losses. Fitch considers catastrophe risk exposure as reasonable given the highly diversified portfolio and the group's strong capital position. When catastrophe losses are close to the historical average, the majority of profits are generated from P&C reinsurance operations, benefiting from overall solid margins within its catastrophe book.
Rating Sensitivities Improved Profitability: Munich Re’s ratings could be upgraded if the reinsurer improves profitability on a sustainable basis to a return on equity of 10% or above and a multi-year average combined ratio of 96% or lower, provided the capital base remains strong on a risk-adjusted basis.
Weakened Capitalisation: The key rating triggers that could result in a downgrade include a sustained material drop in the company’s risk-adjusted capital position measured by Fitch’s risk-based capital assessment, a multi-year average combined ratio of 102% or above, or strong underperformance relative to peers.
Ratings Insurer Financial Strength Rating AA− Long-Term Foreign-Currency IDR AA− Subordinated Debt A Senior Unsecured Debt (Issued by Munich Reinsurance America Corporation)
A+
Outlooks Insurer Financial Strength Rating Stable Long-Term Foreign-Currency IDR Stable
Financial Data Munich Reinsurance Company 31 Dec
13 31 Dec
12 Total assets (EURm) 254,288 258,416 Total equity (EURm) 26,226 27,439 Gross written premiums (EURm)
51,060 51,969
Net income (EURm) 3,342 3,204 Reinsurance combined ratio (%)
92.1 91.0
Primary insurance combined ratio (%)
97.2 98.7
Related Research xxx
Analysts Martyn Street +44 20 3530 1211 [email protected] Harish Gohil +44 20 3530 1257 [email protected]
The ratings above were solicited by, or on behalf of, the issuer, and therefore, Fitch has been compensated for the provision of the ratings.
Insurance
www.fitchratings.com 1 September 2014
Reinsurers / Germany
Munich Reinsurance Company And Subsidiaries Update
Key Rating Drivers Consistently Strong Group Earnings: Munich Reinsurance Company’s ability to generate strong and consistent earnings is underpinned by the significant scale, dominant market position and diversity of the (re)insurance operating companies that form the Munich Re group. Fitch Ratings expects Munich Re’s core reinsurance business to drive the company’s profitability in the medium term, with its ERGO-branded primary insurance operations providing some diversification in earnings and business lines.
Reinsurance Underwriting Volatile: Despite the diversity of operating companies, past group results have been volatile because of the significant scale of the property and catastrophe (P&C) reinsurance segment. P&C reinsurance contributed over 70% of group net profits in 2013 (2012: 81%). Underwriting performance compared with a peer group of Fitch’s rated reinsurance universe is viewed as a key factor in determining the future direction of the rating.
Capitalisation Very Strong: Fitch regards Munich Re's capitalisation as very strong and commensurate with the ratings. While the reinsurer’s IFRS equity is sensitive to interest rate-induced movements in the market value of its fixed-interest investment portfolio, the agency considers that such sensitivity on an economic value basis would be reduced by offsetting movements in the value of liabilities. Strong capitalisation enables the reinsurer to provide underwriting capacity on a continuous and large scale basis, should it wish to do so.
Primary Operations in Transition: Munich Re’s primary life and international primary non-life operations are improving. Over the medium term, earnings contributions from these operations are expected to form a more significant part of overall group earnings.
Leverage and Coverage Adequate: Fitch views Munich Re's financial debt leverage as commensurate with the ratings, standing at 16% at end-2013. The agency expects that leverage will remain within an acceptable range for the ratings in the medium term. Asset risk is low to moderate with little exposure to equities and alternative investments, and credit risk is moderate.
Limited Retrocession, Manageable Exposure: Munich Re uses limited retrocession coverage and other forms of risk mitigation, leaving net losses near to gross losses. Fitch considers catastrophe risk exposure as reasonable given the highly diversified portfolio and the group's strong capital position. When catastrophe losses are close to the historical average, the majority of profits are generated from P&C reinsurance operations, benefiting from overall solid margins within its catastrophe book.
Rating Sensitivities Improved Profitability: Munich Re’s ratings could be upgraded if the reinsurer improves profitability on a sustainable basis to a return on equity of 10% or above and a multi-year average combined ratio of 96% or lower, provided the capital base remains strong on a risk-adjusted basis.
Weakened Capitalisation: The key rating triggers that could result in a downgrade include a sustained material drop in the company’s risk-adjusted capital position measured by Fitch’s risk-based capital assessment, a multi-year average combined ratio of 102% or above, or strong underperformance relative to peers.
Ratings Insurer Financial Strength Rating AA− Long-Term Foreign-Currency IDR AA− Subordinated Debt A Senior Unsecured Debt (Issued by Munich Reinsurance America Corporation)
A+
Outlooks Insurer Financial Strength Rating Stable Long-Term Foreign-Currency IDR Stable
Financial Data Munich Reinsurance Company 31 Dec
13 31 Dec
12 Total assets (EURm) 254,288 258,416 Total equity (EURm) 26,226 27,439 Gross written premiums (EURm)
51,060 51,969
Net income (EURm) 3,342 3,204 Reinsurance combined ratio (%)
92.1 91.0
Primary insurance combined ratio (%)
97.2 98.7
Related Research xxx
Analysts Martyn Street +44 20 3530 1211 [email protected] Harish Gohil +44 20 3530 1257 [email protected]
Related Research2015 Outlook: Global Reinsurance (September 2014)Alternative Reinsurance 2014 Market Update (September 2014)Global Reinsurance’s Shifting Landscape (September 2014)Latin American Reinsurance (September 2014)Reinsurer Mergers and Acquisitions (August 2014)Global Reinsurers’ Mid-Year 2014 Financial Results (August 2014)Asian Reinsurance Markets (August 2014)
Related CriteriaInsurance Rating Methodology (September 2014)
Global Reinsurance Guide 201557
InsuranceInsuranceLife Insurers / U.S.A.
Reinsurance Group of America, Inc.And SubsidiaryUpdate
Key Rating DriversLeading North American Life Reinsurer: Reinsurance Group of America (RGA) is the largest provider of individual and group life reinsurance in North America, and is one of the leading life and health reinsurers in the world. RGA has retained its market share, despite an overall decline in new business assumed in the U.S.
Pressure on Profitability: Fitch Ratings continues to view RGA’s run-rate profitability as good and generally in line with rating expectations. However, Fitch anticipates growth in profitability over the medium term will be constrained by competitive challenges in the company’s core U.S. traditional business, higher mortality and morbidity in select markets, and ongoing low interest rates. Operating earnings improved in the first half of 2014. As a result, GAAP operating earnings-based interest coverage increased to 7.3x.
Elevated Financial Leverage: Fitch views RGA’s financial leverage as at the high end of rating expectations following its third-quarter 2013 issuance of $400 million of senior notes. The financial leverage ratio was approximately 30% at June 30, 2014. The total financing andcommitments (TFC) ratio is also relatively high at 1.0x.
Rapid Growth of Asset-Intensive Business: RGA has experienced rapid growth in total assets over the past few years. Fitch has some concern that contraction in RGA’s core U.S. traditional market has caused it to look for growth in asset-intensive businesses, which Fitch views as riskier and outside the company’s core competence of managing mortality risk. Fitch will closely monitor growth in this area. Asset leverage — GAAP assets in relation to adjusted equity — was 8x at June 30, 2014.
Adequate Risk-Adjusted Capitalization: Fitch views the statutory capitalization of RGA Reinsurance Company (RGA Reinsurance) as adequate, although the company relies on support from its parent and the use of captives to maintain target capital levels. Fitch estimates RGAReinsurance’s RBC ratio was 365% at year-end 2013, up slightly from 360% at year-end 2012.
Macroeconomic Uncertainty: Uncertain monetary policy and ongoing discord among government officials pose risks to the economy and credit outlook, and could have a material negative effect on RGA’s earnings and capital in a severe, albeit unexpected, scenario.
Rating SensitivitiesDowngrade Triggers: Key rating triggers that could result in a downgrade include deterioration in the Asia Pacific segment or a loss in another segment that prevents a recovery in GAAP earnings to 2012 levels within the next 12–18 months; GAAP interest coverage maintained below 7x; RBC of RGA Reinsurance dropping well below 300% on a sustained basis; holding company financial leverage above 30%; TFC maintained well above 1x; and GAAP asset leverage of 10x or higher.
Upgrade Triggers: Key rating triggers that could result in an upgrade include RBC of RGA Reinsurance of 400% or more on a sustained basis; financial leverage (excluding collateralfinancing) maintained in the 15% range; a TFC ratio of 0.6x or below on a sustained basis; GAAP interest coverage of 10x or more; and GAAP asset leverage below 6x.
Ratings
Reinsurance Group of America, Inc.Long-Term IDR A−Senior Debt BBB+Junior Subordinated Debt BBB−
RGA Reinsurance Co.Insurer Financial Strength A+
IDR – Issuer Default Rating.
Rating OutlookStable
GAAP Financial Data
Reinsurance Group of America, Inc.($ Mil.) 6/30/14Shareholders’ Equity 6,689Total Debt 2,215Net Income 335Return on Equity (%) 12.9Risk-Based Capital (%) 365
Note: Risk-based capital ratio is as of Dec. 31, 2013.Source: RGA Statistical Supplement and SEC filings, Fitch.
Related ResearchU.S. Life Insurance Statutory Dividend Capacity (Improved Statutory Dividend Capacity a Credit Positive) (June 2014)2013 GAAP Results — U.S. Life Insurance (May 2014) 2014 Outlook: U.S. Life Insurance (Improved Credit Fundamentals) (December 2013)
Related Criteria Insurance Rating Methodology (November 2013)
AnalystsTana M. Higman+1 312 [email protected]
Douglas L. Meyer, CFA+1 312 [email protected]
www.fitchratings.com August 14, 2014
The ratings above were unsolicited and have been provided by Fitch as a service to investors.The issuer did not participate in the rating process, or provide additional information, beyond the issuer’s available public disclosure.
Related Research2015 Outlook: Global Reinsurance (September 2014)Alternative Reinsurance 2014 Market Update (September 2014)Global Reinsurance’s Shifting Landscape (September 2014)Latin American Reinsurance (September 2014)Reinsurer Mergers and Acquisitions (August 2014)Global Reinsurers’ Mid-Year 2014 Financial Results (August 2014)Asian Reinsurance Markets (August 2014)
Related CriteriaInsurance Rating Methodology (September 2014)
Global Reinsurance Guide 2015 58
InsuranceReinsurers / Bermuda
RenaissanceRe Holdings Ltd.And SubsidiariesUpdate
Key Rating DriversCompetitive Position Remains Strong: RenaissanceRe Holdings Ltd. (RNR) has a leadership position in the property catastrophe reinsurance market derived largely from the company’s ability to provide consistent capacity in the marketplace and technical proficiency inunderwriting and pricing catastrophe-related risks. Fitch Ratings views RNR’s property catastrophe underwriters as having a demonstrated record of success.
Pricing Under Pressure: RNR’s ratings reflect Fitch’s negative sector outlook on global reinsurance. The sector’s fundamentals have deteriorated, with declining premium pricing and weakening of terms and conditions — particularly for property catastrophe risk, RNR’s core line of business, with approximately 72% of gross premiums written in 2013. RNR has responded by reducing its risk exposure. Fitch expects RNR to maintain its historically strong underwriting discipline should market conditions continue to deteriorate.
Profitable, but Volatile, Underwriting Results: Fitch views RNR’s year-to-year underwriting profitability as volatile, but the effect of this volatility on the company’s ratings is mitigated somewhat by low average combined ratios over extended periods. This is an important factor supporting the company’s ratings and is evidence of RNR’s underwriting expertise.
Favorable 10-Year Underwriting Results: RNR’s average GAAP calendar-year combined ratio over the most recent 10-year period (2004–2013) was favorable, though volatile, at 74.8%, with a standard deviation of 34.4%. The average combined ratio for the catastrophe reinsurance segment was 69.9% with a standard deviation of 60.1%.
Reasonable Leverage and Capitalization: RNR uses a reasonable amount of operating leverage, with a ratio of net premiums written to shareholders’ equity of 0.2x−0.3x in recent periods. RNR’s financial leverage ratio is very modest at 8.8% as of June 30, 2014. RNR’sGAAP operating earnings-based interest and preferred dividend coverage has been strong, averaging 11.1x from 2009 to 2013, with 16.6x in first-half 2014.
Rating SensitivitiesDowngrade Triggers: Key rating triggers that could lead to a downgrade include continued deterioration in market conditions that impairs RNR’s leading position in the property catastrophe reinsurance market and results in a weakening of RNR's historically strong profitability, as demonstrated by sustained combined ratios above 80% and returns on common equity below 13%. Others include material weakening in balance sheet strength, as measured by net premiums written to shareholders’ equity above 0.5x or equity-credit adjusted financial leverage above 25%; or a catastrophe event loss that is 25% or more of shareholders’ equity.
Upgrade Triggers: Fitch considers a rating upgrade unlikely in the near term due to the earnings and capital volatility inherent in the company’s property catastrophe reinsurance focus. Key rating triggers that could lead to an upgrade over the long term include continued favorable underwriting results relative to other property catastrophe reinsurers and comparably rated property/casualty (re)insurer peers; improvement in RNR’s competitive position in profitable market segments outside of property catastrophe reinsurance, including its specialty reinsurance and Lloyd's of London business; and material risk-adjusted capital growth.
RatingsLong-Term Issuer Default Rating ASenior Unsecured Notes A−Preferred Stock BBB
RenRe North America Holdings Inc.Senior Unsecured Notes A−Renaissance Reinsurance Ltd.Insurer Financial Strength A+
Rating OutlooksLong-Term Issuer Default Rating StableInsurer Financial Strength Stable
Financial DataRenaissanceRe Holdings Ltd.($ Mil.) 12/31/13 6/30/14Total Equity and Minority Interest 5,004 4,860Total Debt 249 249Total Assets 8,179 8,516Operating Revenue 1,345 633Net Income 666 272Combined Ratio (%) 43.8 54.1ROAE (%) 20.1 15.7
Source: RenaissanceRe Holdings Ltd.
Related ResearchFitch Affirms RenaissanceRe’s Ratings; Outlook Stable (August 2014)Global Reinsurers’ 2013 Financial Results (April 2014)Bermuda 2014 Market Update(January 2014)2014 Outlook: U.S. Property/Casualty Insurance (December 2013)Alternative Reinsurance 2013 Market Update (Convergence Here to Stay) (September 2013)2014 Outlook: Global Reinsurance (August 2013)
Related Criteria Insurance Rating Methodology (November 2013)
AnalystsBrian C. Schneider, CPA, CPCU, ARe+1 312 606-2321 [email protected]
Gregory W. Dickerson +1 212 908-0220 [email protected]
www.fitchratings.com August 12, 2014
The ratings above were unsolicited and have been provided by Fitch as a service to investors.
InsuranceReinsurers / Bermuda
RenaissanceRe Holdings Ltd.And SubsidiariesUpdate
Key Rating DriversCompetitive Position Remains Strong: RenaissanceRe Holdings Ltd. (RNR) has a leadership position in the property catastrophe reinsurance market derived largely from the company’s ability to provide consistent capacity in the marketplace and technical proficiency inunderwriting and pricing catastrophe-related risks. Fitch Ratings views RNR’s property catastrophe underwriters as having a demonstrated record of success.
Pricing Under Pressure: RNR’s ratings reflect Fitch’s negative sector outlook on global reinsurance. The sector’s fundamentals have deteriorated, with declining premium pricing and weakening of terms and conditions — particularly for property catastrophe risk, RNR’s core line of business, with approximately 72% of gross premiums written in 2013. RNR has responded by reducing its risk exposure. Fitch expects RNR to maintain its historically strong underwriting discipline should market conditions continue to deteriorate.
Profitable, but Volatile, Underwriting Results: Fitch views RNR’s year-to-year underwriting profitability as volatile, but the effect of this volatility on the company’s ratings is mitigated somewhat by low average combined ratios over extended periods. This is an important factor supporting the company’s ratings and is evidence of RNR’s underwriting expertise.
Favorable 10-Year Underwriting Results: RNR’s average GAAP calendar-year combined ratio over the most recent 10-year period (2004–2013) was favorable, though volatile, at 74.8%, with a standard deviation of 34.4%. The average combined ratio for the catastrophe reinsurance segment was 69.9% with a standard deviation of 60.1%.
Reasonable Leverage and Capitalization: RNR uses a reasonable amount of operating leverage, with a ratio of net premiums written to shareholders’ equity of 0.2x−0.3x in recent periods. RNR’s financial leverage ratio is very modest at 8.8% as of June 30, 2014. RNR’sGAAP operating earnings-based interest and preferred dividend coverage has been strong, averaging 11.1x from 2009 to 2013, with 16.6x in first-half 2014.
Rating SensitivitiesDowngrade Triggers: Key rating triggers that could lead to a downgrade include continued deterioration in market conditions that impairs RNR’s leading position in the property catastrophe reinsurance market and results in a weakening of RNR's historically strong profitability, as demonstrated by sustained combined ratios above 80% and returns on common equity below 13%. Others include material weakening in balance sheet strength, as measured by net premiums written to shareholders’ equity above 0.5x or equity-credit adjusted financial leverage above 25%; or a catastrophe event loss that is 25% or more of shareholders’ equity.
Upgrade Triggers: Fitch considers a rating upgrade unlikely in the near term due to the earnings and capital volatility inherent in the company’s property catastrophe reinsurance focus. Key rating triggers that could lead to an upgrade over the long term include continued favorable underwriting results relative to other property catastrophe reinsurers and comparably rated property/casualty (re)insurer peers; improvement in RNR’s competitive position in profitable market segments outside of property catastrophe reinsurance, including its specialty reinsurance and Lloyd's of London business; and material risk-adjusted capital growth.
RatingsLong-Term Issuer Default Rating ASenior Unsecured Notes A−Preferred Stock BBB
RenRe North America Holdings Inc.Senior Unsecured Notes A−Renaissance Reinsurance Ltd.Insurer Financial Strength A+
Rating OutlooksLong-Term Issuer Default Rating StableInsurer Financial Strength Stable
Financial DataRenaissanceRe Holdings Ltd.($ Mil.) 12/31/13 6/30/14Total Equity and Minority Interest 5,004 4,860Total Debt 249 249Total Assets 8,179 8,516Operating Revenue 1,345 633Net Income 666 272Combined Ratio (%) 43.8 54.1ROAE (%) 20.1 15.7
Source: RenaissanceRe Holdings Ltd.
Related ResearchFitch Affirms RenaissanceRe’s Ratings; Outlook Stable (August 2014)Global Reinsurers’ 2013 Financial Results (April 2014)Bermuda 2014 Market Update(January 2014)2014 Outlook: U.S. Property/Casualty Insurance (December 2013)Alternative Reinsurance 2013 Market Update (Convergence Here to Stay) (September 2013)2014 Outlook: Global Reinsurance (August 2013)
Related Criteria Insurance Rating Methodology (November 2013)
AnalystsBrian C. Schneider, CPA, CPCU, ARe+1 312 606-2321 [email protected]
Gregory W. Dickerson +1 212 908-0220 [email protected]
www.fitchratings.com August 12, 2014
Related Research2015 Outlook: Global Reinsurance (September 2014)Alternative Reinsurance 2014 Market Update (September 2014)Global Reinsurance’s Shifting Landscape (September 2014)Latin American Reinsurance (September 2014)Reinsurer Mergers and Acquisitions (August 2014)Global Reinsurers’ Mid-Year 2014 Financial Results (August 2014)Asian Reinsurance Markets (August 2014)
Related CriteriaInsurance Rating Methodology (September 2014)
Global Reinsurance Guide 201559
Insurance
The ratings above were solicited by, or on behalf of, the issuer, and therefore, Fitch has been compensated for the provision of the ratings.
Insurance
www.fitchratings.com 1 September 2014
France
SCOR S.E. Full Rating Report
Key Rating Drivers Solid Risk Profile: SCOR S.E.‟s ratings reflect the group‟s strong solvency and good financial leverage in relation to its risk profile. SCOR benefits from significant business and risk diversification. The ratings also take into account the group‟s consistent and comprehensive strategy, solid business position and strong profitability.
Consistent Strategy: SCOR‟s management team has implemented a consistent strategy since 2002. Thanks to both internal and external growth, the group‟s activities are well balanced between life and non-life reinsurance, and within each of these business lines. This brings considerable diversification, with a favourable impact on the group‟s risk profile. In addition, SCOR‟s integration of acquired operations has been well managed and continues to deliver synergies.
Strong Solvency: SCOR‟s capital position has strengthened in the past five years and its 22% financial leverage ratio is in line with current ratings. However, the Total Financing and Commitments (TFC) ratio, a comprehensive measure of debt-related leverage including essentially all financing activities remains above average at 1.0x. SCOR‟s capital adequacy is expected to stabilise at its current strong level or improve, as future retained earnings are likely to compensate for increased capital requirements, largely relating to organic growth.
Improved Business Position: Fitch considers that SCOR‟s business position has improved as a result of the integration of acquired operations and organic growth. This is based on the group‟s solid financial strength and its ability to offer reinsurance solutions in selected countries and business lines. In line with its risk appetite framework, Fitch expects the group to strengthen its business position in areas where it can apply its expertise in addition to its risk-taking capacity.
Improving Profitability: SCOR‟s profitability has improved over recent years. However, competitive underwriting conditions in a number of business lines and exposure to catastrophes could challenge the group‟s ability to achieve significant earnings improvement in the short and medium term. In addition, low interest rates continue to depress investment returns.
Rating Sensitivities Strengthened Profitability: A rating upgrade could be triggered by a sustained track record of profitability, demonstrated by a combined ratio and fixed charge coverage ratio consistent with levels reported at end-2013.
Very Strong Capital Adequacy: Alternatively, an upgrade could result from maintaining a final Prism Factor-Based Model score consistent with a „AA‟ category rating, or from the TFC ratio falling below 0.8x.
Ratings Insurer Financial Strength Rating A+ Long-Term Foreign-Currency IDR A+ Senior Unsecured Debt A+ Junior Subordinated Debt A- See Appendix C for additional ratings
Outlooks Insurer Financial Strength Rating Positive Long-Term Foreign-Currency IDR Positive
Financial Data SCOR S.E.
(EURm) 31 Dec
12 31 Dec
13 Net earned premiums 8,399 9,066 Total assets 31,268 33,021 Net income 418 549 Adjusted equity 4,810 4,980
Related Research 2014 Outlook: Global Reinsurance (August 2013)
Analysts Marc-Philippe Juilliard +33 1 44 29 91 37 [email protected] Martyn Street +44 20 3530 1211 [email protected]
Update
Insurance
www.fitchratings.com 1 September 2014
France
SCOR S.E. Full Rating Report
Key Rating Drivers Solid Risk Profile: SCOR S.E.‟s ratings reflect the group‟s strong solvency and good financial leverage in relation to its risk profile. SCOR benefits from significant business and risk diversification. The ratings also take into account the group‟s consistent and comprehensive strategy, solid business position and strong profitability.
Consistent Strategy: SCOR‟s management team has implemented a consistent strategy since 2002. Thanks to both internal and external growth, the group‟s activities are well balanced between life and non-life reinsurance, and within each of these business lines. This brings considerable diversification, with a favourable impact on the group‟s risk profile. In addition, SCOR‟s integration of acquired operations has been well managed and continues to deliver synergies.
Strong Solvency: SCOR‟s capital position has strengthened in the past five years and its 22% financial leverage ratio is in line with current ratings. However, the Total Financing and Commitments (TFC) ratio, a comprehensive measure of debt-related leverage including essentially all financing activities remains above average at 1.0x. SCOR‟s capital adequacy is expected to stabilise at its current strong level or improve, as future retained earnings are likely to compensate for increased capital requirements, largely relating to organic growth.
Improved Business Position: Fitch considers that SCOR‟s business position has improved as a result of the integration of acquired operations and organic growth. This is based on the group‟s solid financial strength and its ability to offer reinsurance solutions in selected countries and business lines. In line with its risk appetite framework, Fitch expects the group to strengthen its business position in areas where it can apply its expertise in addition to its risk-taking capacity.
Improving Profitability: SCOR‟s profitability has improved over recent years. However, competitive underwriting conditions in a number of business lines and exposure to catastrophes could challenge the group‟s ability to achieve significant earnings improvement in the short and medium term. In addition, low interest rates continue to depress investment returns.
Rating Sensitivities Strengthened Profitability: A rating upgrade could be triggered by a sustained track record of profitability, demonstrated by a combined ratio and fixed charge coverage ratio consistent with levels reported at end-2013.
Very Strong Capital Adequacy: Alternatively, an upgrade could result from maintaining a final Prism Factor-Based Model score consistent with a „AA‟ category rating, or from the TFC ratio falling below 0.8x.
Ratings Insurer Financial Strength Rating A+ Long-Term Foreign-Currency IDR A+ Senior Unsecured Debt A+ Junior Subordinated Debt A- See Appendix C for additional ratings
Outlooks Insurer Financial Strength Rating Positive Long-Term Foreign-Currency IDR Positive
Financial Data SCOR S.E.
(EURm) 31 Dec
12 31 Dec
13 Net earned premiums 8,399 9,066 Total assets 31,268 33,021 Net income 418 549 Adjusted equity 4,810 4,980
Related Research 2014 Outlook: Global Reinsurance (August 2013)
Analysts Marc-Philippe Juilliard +33 1 44 29 91 37 [email protected] Martyn Street +44 20 3530 1211 [email protected]
Related Research2015 Outlook: Global Reinsurance (September 2014)Alternative Reinsurance 2014 Market Update (September 2014)Global Reinsurance’s Shifting Landscape (September 2014)Latin American Reinsurance (September 2014)Reinsurer Mergers and Acquisitions (August 2014)Global Reinsurers’ Mid-Year 2014 Financial Results (August 2014)Asian Reinsurance Markets (August 2014)
Related CriteriaInsurance Rating Methodology (September 2014)
Global Reinsurance Guide 2015 60
Insurance
www.fitchratings.com 21 August 2014
Switzerland
Swiss Reinsurance Company Ltd Full Rating Report
Key Rating Drivers
Improving Leverage Profile: The continued run-off of Swiss Re’s credit derivatives portfolio
and a reduction in operational debt, both served to improve the reinsurer’s leverage profile.
Fitch’s total financing and commitments (TFC) ratio reduced to 0.8x at 1H14 (1H13: 1.3x),
which falls within an acceptable range for the reinsurer’s financial profile. The TFC ratio
captures most forms of financial commitments, including financial debt, operational debt,
securitisations, certain derivative exposures and other debt-like commitments.
Capitalisation Very Strong: Fitch views capitalisation as being very strong, despite a marginal
decrease in coverage following the expiry of the 20% retrocession quota share agreement at
the end of 2012. As a consequence, Swiss Re’s risk exposure to single loss events has
increased although the agency considers this to remain within acceptable bounds.
Improving Earnings Consistency: Swiss Re earnings generation is expected to remain
strong despite the current headwinds faced within certain parts of the reinsurance market. The
property and casualty (P&C) reinsurance segment is expected to remain as the core earnings
generator with the product diversity and strong franchise presence within the P&C reinsurance
segment being viewed favourably.
P&C Reinsurance Portfolio Rebalanced: The weight of casualty business within Swiss Re’s
reinsurance portfolio continues to grow, partly driven by the changing attractiveness between
margins for property and casualty lines. Fitch expects continued earnings strain created by
declining property premium rates in mature peak-zone geographies to be partially offset by
higher margin business written in emerging market countries.
Resolution of YRT Business: Improvement in the performance of the life and health (L&H)
segment continues, with the reinsurer committed to meeting a 10-12% ROE target for 2015.
Rebalancing of the L&H investment portfolio is at an advanced stage, seeing a marginal rise in
risk assets. Fitch continues to closely monitor progress in improving the performance of the
legacy US term book, especially with regard to yearly renewable term (YRT) policies. A charge
of USD500m during 2014 is expected although the final cost and timing remain uncertain.
Moderate Investment Risk: Fitch considers Swiss Re’s investment portfolio to be of high
quality and moderately low risk. The portfolio weighting of corporate bonds and equities has
increased at the expense of government bonds. Overall, the risk profile of the portfolio remains
within rating tolerances and has been significantly reduced since 2008, when sizeable
exposure to both structured mortgage- and asset-backed securities caused major volatility in
the reinsurer’s reported results.
Rating Sensitivities
Upgrade: The key rating drivers that could result in an upgrade include: maintenance of TFC
ratio below 0.8x, with other credit metrics remaining close to current levels; reduced financial
leverage under 25%; and maintenance of Swiss solvency test (SST) capitalisation above
200%.
Downgrade: The key rating drivers that could result in a downgrade include: a marked
increase in the TFC ratio above 2.0x; increased financial leverage above 35%; deterioration in
SST capitalisation below 175%, for example due to large losses eroding capital, excessive
growth; weaker underwriting profitability relative to similarly rated peers.
Ratings
Insurer Financial Strength Rating A+
Long-Term Foreign-Currency IDR A+ Senior unsecured debt A+ Subordinated debt A−
Outlooks
Insurer Financial Strength Rating Positive Long-Term Foreign-Currency IDR Positive
Financial Data
Swiss Reinsurance Company Ltd
USD (bn) 31 Dec
13 31 Dec
12
Total assets 213.5 221.5 Total equity 33.0 34.0 Pre-tax profit 4.8 5.5 Net income 4.2 4.4 Combined ratio – P&C RI (%)
83.3 80.7
Return on equity (%) 13.7 13.4
Related Research Global Reinsurance Guide 2014 (September 2013)
German Flood Claims May Hit EUR3bn; Credit Impact Limited (June 2013)
Analysts Martyn Street +44 20 3530 1211 [email protected] Brian Schneider +1 212 606 2321 [email protected]
The ratings above were unsolicited and have been provided by Fitch as a service to investors.The issuer did not participate in the rating process, or provide additional information, beyond the issuer’s available public disclosure.
Update
Insurance
www.fitchratings.com 21 August 2014
Switzerland
Swiss Reinsurance Company Ltd Full Rating Report
Key Rating Drivers
Improving Leverage Profile: The continued run-off of Swiss Re’s credit derivatives portfolio
and a reduction in operational debt, both served to improve the reinsurer’s leverage profile.
Fitch’s total financing and commitments (TFC) ratio reduced to 0.8x at 1H14 (1H13: 1.3x),
which falls within an acceptable range for the reinsurer’s financial profile. The TFC ratio
captures most forms of financial commitments, including financial debt, operational debt,
securitisations, certain derivative exposures and other debt-like commitments.
Capitalisation Very Strong: Fitch views capitalisation as being very strong, despite a marginal
decrease in coverage following the expiry of the 20% retrocession quota share agreement at
the end of 2012. As a consequence, Swiss Re’s risk exposure to single loss events has
increased although the agency considers this to remain within acceptable bounds.
Improving Earnings Consistency: Swiss Re earnings generation is expected to remain
strong despite the current headwinds faced within certain parts of the reinsurance market. The
property and casualty (P&C) reinsurance segment is expected to remain as the core earnings
generator with the product diversity and strong franchise presence within the P&C reinsurance
segment being viewed favourably.
P&C Reinsurance Portfolio Rebalanced: The weight of casualty business within Swiss Re’s
reinsurance portfolio continues to grow, partly driven by the changing attractiveness between
margins for property and casualty lines. Fitch expects continued earnings strain created by
declining property premium rates in mature peak-zone geographies to be partially offset by
higher margin business written in emerging market countries.
Resolution of YRT Business: Improvement in the performance of the life and health (L&H)
segment continues, with the reinsurer committed to meeting a 10-12% ROE target for 2015.
Rebalancing of the L&H investment portfolio is at an advanced stage, seeing a marginal rise in
risk assets. Fitch continues to closely monitor progress in improving the performance of the
legacy US term book, especially with regard to yearly renewable term (YRT) policies. A charge
of USD500m during 2014 is expected although the final cost and timing remain uncertain.
Moderate Investment Risk: Fitch considers Swiss Re’s investment portfolio to be of high
quality and moderately low risk. The portfolio weighting of corporate bonds and equities has
increased at the expense of government bonds. Overall, the risk profile of the portfolio remains
within rating tolerances and has been significantly reduced since 2008, when sizeable
exposure to both structured mortgage- and asset-backed securities caused major volatility in
the reinsurer’s reported results.
Rating Sensitivities
Upgrade: The key rating drivers that could result in an upgrade include: maintenance of TFC
ratio below 0.8x, with other credit metrics remaining close to current levels; reduced financial
leverage under 25%; and maintenance of Swiss solvency test (SST) capitalisation above
200%.
Downgrade: The key rating drivers that could result in a downgrade include: a marked
increase in the TFC ratio above 2.0x; increased financial leverage above 35%; deterioration in
SST capitalisation below 175%, for example due to large losses eroding capital, excessive
growth; weaker underwriting profitability relative to similarly rated peers.
Ratings
Insurer Financial Strength Rating A+
Long-Term Foreign-Currency IDR A+ Senior unsecured debt A+ Subordinated debt A−
Outlooks
Insurer Financial Strength Rating Positive Long-Term Foreign-Currency IDR Positive
Financial Data
Swiss Reinsurance Company Ltd
USD (bn) 31 Dec
13 31 Dec
12
Total assets 213.5 221.5 Total equity 33.0 34.0 Pre-tax profit 4.8 5.5 Net income 4.2 4.4 Combined ratio – P&C RI (%)
83.3 80.7
Return on equity (%) 13.7 13.4
Related Research Global Reinsurance Guide 2014 (September 2013)
German Flood Claims May Hit EUR3bn; Credit Impact Limited (June 2013)
Analysts Martyn Street +44 20 3530 1211 [email protected] Brian Schneider +1 212 606 2321 [email protected]
Related Research2015 Outlook: Global Reinsurance (September 2014)Alternative Reinsurance 2014 Market Update (September 2014)Global Reinsurance’s Shifting Landscape (September 2014)Latin American Reinsurance (September 2014)Reinsurer Mergers and Acquisitions (August 2014)Global Reinsurers’ Mid-Year 2014 Financial Results (August 2014)Asian Reinsurance Markets (August 2014)
Related CriteriaInsurance Rating Methodology (September 2014)
Global Reinsurance Guide 201561
InsuranceInsuranceReinsurers/Bermuda
Validus Holdings, Ltd.And Validus Reinsurance Ltd.Update
Key Rating DriversOperating Performance Is Strong: Validus Holdings, Ltd.’s (Validus) ratings reflect its solid operating performance and internal capital generation since its inception in late 2005. Validus reported $316 million of net earnings in the first half of 2014, fueled by a strong combined ratio of 68.5% that benefited from the absence of large catastrophe events.
Negative Sector Outlook: Validus’ ratings also reflect Fitch's negative sector outlook on global reinsurance, as the fundamentals of the reinsurance sector have deteriorated with declining premium pricing and weakening of terms and conditions. This has been particularly the case for property catastrophe risk, Validus’ largest individual line of business that represented approximately one third of total company gross premiums written in 2013.
Ratings Recognize Potential Volatility: Validus’ ratings consider its significant exposure to earnings and capital volatility derived from its property catastrophe reinsurance products. Fitch believes that Validus uses sound risk management processes to manage its exposure to potential catastrophe-related losses by geographic zone and relative to its capital base.
Capitalization Is Solid: Fitch views capitalization as strong for the current rating category, when measured by operating and asset leverage ratios and the company’s publicly disclosed modeled catastrophe losses. Fitch believes that Validus’ capitalization provides protection for the underwriting and investment risks the company faces.
Solid Market Position: Through strategic acquisitions and organic growth, Validus has grown quickly into one of the largest providers of catastrophe and other short-tail reinsurance. Validus is larger than many competitors that focus on catastrophe reinsurance but is significantly smaller than many global competitors in reinsurance and primary insurance markets.
Rating SensitivitiesWeakerPerformance/Capital Strength: A downgrade could occur if net premiums written-to-equity ratios increased to levels at or above 0.8x from current levels of 0.5x. An increase in Validus’ 1-100- and 1-250-year per event catastrophe probable maximum loss to 30% (currently 17%) and 40% (currently 23%) of equity, respectively, could result in a downgrade.
Deteriorating Market Conditions: Continued deterioration in market conditions in Validus’ core business lines that impair the company’s ability to sustain its historically strong profitabilitycould lead to a downgrade. Specifically, failure to maintain a multi-year average combined ratio of 90% or better, could result in a ratings downgrade.
Catastrophe Losses Exceed Expectations: Fitch could downgrade the company’s ratings if Validus were to suffer catastrophe losses that were unfavorably inconsistent with its own internally modeled results or that resulted in earnings and/or capital declines that were significantly worse than comparably rated peers.
Sustained Strong Results: Key rating triggers that could generate longer term positive rating pressure include a prolonged period when Validus outperformed comparably rated peers with respect to underwriting performance and overall profitability, continued strong risk-adjusted capitalization metrics and enhanced competitive positioning and scale in the key product lines.
RatingsSecurity Class RatingLong-Term Issuer Default Rating A–Sr. Unsecured Notes BBB+Junior Subordinated Debt BBB–
Validus Reinsurance Ltd.Insurer Financial Strength A
Rating OutlookStable
Financial Data
Validus Holdings, Ltd.
($ Mil.) 2013 1H14Net Income Available to Common Shareholders 533 316Annualized Return on Avg. Equity (%) 13.8 16.7Total Debt (Par) 790 790Total Capital 5,077 5,207Combined Ratio (%) 71.2 68.5
Source: Company data, Fitch.
Related Research
Fitch Affirms Validus’ Ratings; Outlook Stable (August 2014)Global Reinsurers’ 2013 Financial Results (April 2014)Validus Holdings, Ltd. (March 2014)
Bermuda 2014 Market Update (January 2014)
2014 Outlook: Global Reinsurers (August 2013)
Reinsurance (Global) — Sector Credit Factors (August 2013)
AnalystsGregory W. Dickerson+1 212 [email protected]
Brian Schneider, CPA, CPCU, ARe+1 312 [email protected]
The ratings above were solicited by, or on behalf of, the issuer, and therefore, Fitch has been compensated for the provision of the ratings.
InsuranceReinsurers/Bermuda
Validus Holdings, Ltd.And Validus Reinsurance Ltd.Update
Key Rating DriversOperating Performance Is Strong: Validus Holdings, Ltd.’s (Validus) ratings reflect its solid operating performance and internal capital generation since its inception in late 2005. Validus reported $316 million of net earnings in the first half of 2014, fueled by a strong combined ratio of 68.5% that benefited from the absence of large catastrophe events.
Negative Sector Outlook: Validus’ ratings also reflect Fitch's negative sector outlook on global reinsurance, as the fundamentals of the reinsurance sector have deteriorated with declining premium pricing and weakening of terms and conditions. This has been particularly the case for property catastrophe risk, Validus’ largest individual line of business that represented approximately one third of total company gross premiums written in 2013.
Ratings Recognize Potential Volatility: Validus’ ratings consider its significant exposure to earnings and capital volatility derived from its property catastrophe reinsurance products. Fitch believes that Validus uses sound risk management processes to manage its exposure to potential catastrophe-related losses by geographic zone and relative to its capital base.
Capitalization Is Solid: Fitch views capitalization as strong for the current rating category, when measured by operating and asset leverage ratios and the company’s publicly disclosed modeled catastrophe losses. Fitch believes that Validus’ capitalization provides protection for the underwriting and investment risks the company faces.
Solid Market Position: Through strategic acquisitions and organic growth, Validus has grown quickly into one of the largest providers of catastrophe and other short-tail reinsurance. Validus is larger than many competitors that focus on catastrophe reinsurance but is significantly smaller than many global competitors in reinsurance and primary insurance markets.
Rating SensitivitiesWeakerPerformance/Capital Strength: A downgrade could occur if net premiums written-to-equity ratios increased to levels at or above 0.8x from current levels of 0.5x. An increase in Validus’ 1-100- and 1-250-year per event catastrophe probable maximum loss to 30% (currently 17%) and 40% (currently 23%) of equity, respectively, could result in a downgrade.
Deteriorating Market Conditions: Continued deterioration in market conditions in Validus’ core business lines that impair the company’s ability to sustain its historically strong profitabilitycould lead to a downgrade. Specifically, failure to maintain a multi-year average combined ratio of 90% or better, could result in a ratings downgrade.
Catastrophe Losses Exceed Expectations: Fitch could downgrade the company’s ratings if Validus were to suffer catastrophe losses that were unfavorably inconsistent with its own internally modeled results or that resulted in earnings and/or capital declines that were significantly worse than comparably rated peers.
Sustained Strong Results: Key rating triggers that could generate longer term positive rating pressure include a prolonged period when Validus outperformed comparably rated peers with respect to underwriting performance and overall profitability, continued strong risk-adjusted capitalization metrics and enhanced competitive positioning and scale in the key product lines.
RatingsSecurity Class RatingLong-Term Issuer Default Rating A–Sr. Unsecured Notes BBB+Junior Subordinated Debt BBB–
Validus Reinsurance Ltd.Insurer Financial Strength A
Rating OutlookStable
Financial Data
Validus Holdings, Ltd.
($ Mil.) 2013 1H14Net Income Available to Common Shareholders 533 316Annualized Return on Avg. Equity (%) 13.8 16.7Total Debt (Par) 790 790Total Capital 5,077 5,207Combined Ratio (%) 71.2 68.5
Source: Company data, Fitch.
Related Research
Fitch Affirms Validus’ Ratings; Outlook Stable (August 2014)Global Reinsurers’ 2013 Financial Results (April 2014)Validus Holdings, Ltd. (March 2014)
Bermuda 2014 Market Update (January 2014)
2014 Outlook: Global Reinsurers (August 2013)
Reinsurance (Global) — Sector Credit Factors (August 2013)
AnalystsGregory W. Dickerson+1 212 [email protected]
Brian Schneider, CPA, CPCU, ARe+1 312 [email protected]
Related Research2015 Outlook: Global Reinsurance (September 2014)Alternative Reinsurance 2014 Market Update (September 2014)Global Reinsurance’s Shifting Landscape (September 2014)Latin American Reinsurance (September 2014)Reinsurer Mergers and Acquisitions (August 2014)Global Reinsurers’ Mid-Year 2014 Financial Results (August 2014)Asian Reinsurance Markets (August 2014)
Related CriteriaInsurance Rating Methodology (September 2014)
Global Reinsurance Guide 2015 62
Insurance
Property/Casualty Insurers/Bermuda and U.S.
XL Group plcAnd SubsidiariesUpdate
Key Rating DriversImproved Net Earnings: XL Group plc (XL) posted a net loss of $24 million through the first six months of 2014, as favorable underwriting results were offset by a $621 million loss on the sale of its runoff life reinsurance business. This follows net income of $1.1 billion in 2013 and $651 million in 2012. XL recorded a net loss of $475 million in 2011, which included $761 million of catastrophe losses and a $429 million goodwill impairment charge in the insurance segment.
Underwriting Results Favorable: XL’s core property/casualty operations posted a favorable six -month 2014 GAAP combined ratio of 89.0%, which included 1.9 percentage points for catastrophe losses and 4.4 points of favorable prior year reserve development. This underwriting performance compares favorably with 92.5% for full-year 2013, which included 5.3points for catastrophe losses and 4.8 points of favorable prior year reserve development.
Insurance Segment Turnaround: XL’s insurance segment, in particular, has demonstrated meaningful improvement, with an accident year combined ratio, excluding catastrophes, of 95.3% in the first six months of 2014, compared with 96.7% in full-year 2013, 98.5% in 2012 and a sizable 104.2% in 2011. This favorable performance is due in part to underwriting actions taken by the company over the last several years to improve the margins in its poorer performing insurance businesses.
Improving Earnings-Based Interest Coverage: XL’s operating earnings-based interest and preferred dividend coverage has been weak in recent years, averaging a low 4.4x from 2009−2013. However, earnings coverage improved to more historic levels at 6.0x both throughthe first half of 2014 and in 2013, with low catastrophe losses and reduced interest costs.
Reasonable Financial Leverage: XL maintains a modest financial leverage ratio of 17.7% at June 30, 2014 and 16.9% at Dec. 31, 2013, with debt plus preferred equity to total capital of 26.4% at June 30, 2014, in line with 26.5% at Dec. 31, 2013. XL’s capital position has remained stable, with shareholders’ equity of $11.4 billion at June 30, 2014, up slightly from $11.3 billion at Dec. 31, 2013, as a net loss and share repurchases were offset by unrealized investment gains.
Rating SensitivitiesUpgrade Triggers: The key rating trigger that could result in a near term upgrade to XL’s IDR and debt ratings includes operating-earnings-based interest and preferred dividend coverage maintained at 6.0x or higher. Key rating triggers that could lead to an upgrade to XL’s ratings over time include favorable earnings with low volatility, including a combined ratio in the low 90s; continued strong capitalization of the insurance subsidiaries, with a net premiums written-to-equity ratio of 0.8x of lower; financial leverage ratio maintained at or below 20% and operating-earnings-based interest and preferred dividend coverage of at least 10x.
Downgrade Triggers: Key rating triggers that could result in a downgrade include significant charges for reserves that affect equity and the capitalization of the insurance subsidiaries;financial leverage ratio maintained above 20% or debt plus preferred equity to total capital above 30%; operating earnings-based interest and preferred dividend coverage below 6.0x−7.0x; increases in underwriting leverage above 1.0x net premiums written-to-equity ratio;or earnings below industry levels and failure to maintain consistent underwriting profitability.
RatingsXLIT Ltd.Long-Term Issuer Default Rating (IDR) A-Senior Unsecured Notes BBB+Preferred Stock BBB-XL Insurance (Bermuda) Ltd.XL Re Ltd.XL Re Europe SEXL Re Latin America Ltd.XL Insurance Switzerland Ltd.XL Reinsurance America Inc.XL Insurance Company SEXL Insurance Company of New York, Inc.XL Specialty Insurance Co.Indian Harbor Insurance Co.Greenwich Insurance Co.XL Insurance America, Inc.XL Select Insurance Co.Insurer Financial Strength A+
Rating OutlookLong-Term Issuer Default Rating PositiveInsurer Financial Strength Stable
Financial DataXL Group plc($ Mil.) 12/31/13 6/30/14Total Shareholders’ Equity 11,349 11,409Total Debt 2,263 2,262Total Assets 45,653 48,162Operating Revenue 7,446 3,524Net Income 1,060 (24)Combined Ratio (%) 92.5 89.0ROAE (%) 10.3 (0.5)
Source: XL Group plc.
Related Research
Related Criteria Insurance Rating Methodology (November 2013)
AnalystsBrian C. Schneider, CPA, CPCU, ARe+1 312 606-2321 [email protected]
James B. Auden, CFA+1 312 [email protected]
www.fitchratings.com July 10, 2013
The ratings above were solicited by, or on behalf of, the issuer, and therefore, Fitch has been compensated for the provision of the ratings.
Insurance
Property/Casualty Insurers/Bermuda and U.S.
XL Group plcAnd SubsidiariesUpdate
Key Rating DriversImproved Net Earnings: XL Group plc (XL) posted a net loss of $24 million through the first six months of 2014, as favorable underwriting results were offset by a $621 million loss on the sale of its runoff life reinsurance business. This follows net income of $1.1 billion in 2013 and $651 million in 2012. XL recorded a net loss of $475 million in 2011, which included $761 million of catastrophe losses and a $429 million goodwill impairment charge in the insurance segment.
Underwriting Results Favorable: XL’s core property/casualty operations posted a favorable six -month 2014 GAAP combined ratio of 89.0%, which included 1.9 percentage points for catastrophe losses and 4.4 points of favorable prior year reserve development. This underwriting performance compares favorably with 92.5% for full-year 2013, which included 5.3points for catastrophe losses and 4.8 points of favorable prior year reserve development.
Insurance Segment Turnaround: XL’s insurance segment, in particular, has demonstrated meaningful improvement, with an accident year combined ratio, excluding catastrophes, of 95.3% in the first six months of 2014, compared with 96.7% in full-year 2013, 98.5% in 2012 and a sizable 104.2% in 2011. This favorable performance is due in part to underwriting actions taken by the company over the last several years to improve the margins in its poorer performing insurance businesses.
Improving Earnings-Based Interest Coverage: XL’s operating earnings-based interest and preferred dividend coverage has been weak in recent years, averaging a low 4.4x from 2009−2013. However, earnings coverage improved to more historic levels at 6.0x both throughthe first half of 2014 and in 2013, with low catastrophe losses and reduced interest costs.
Reasonable Financial Leverage: XL maintains a modest financial leverage ratio of 17.7% at June 30, 2014 and 16.9% at Dec. 31, 2013, with debt plus preferred equity to total capital of 26.4% at June 30, 2014, in line with 26.5% at Dec. 31, 2013. XL’s capital position has remained stable, with shareholders’ equity of $11.4 billion at June 30, 2014, up slightly from $11.3 billion at Dec. 31, 2013, as a net loss and share repurchases were offset by unrealized investment gains.
Rating SensitivitiesUpgrade Triggers: The key rating trigger that could result in a near term upgrade to XL’s IDR and debt ratings includes operating-earnings-based interest and preferred dividend coverage maintained at 6.0x or higher. Key rating triggers that could lead to an upgrade to XL’s ratings over time include favorable earnings with low volatility, including a combined ratio in the low 90s; continued strong capitalization of the insurance subsidiaries, with a net premiums written-to-equity ratio of 0.8x of lower; financial leverage ratio maintained at or below 20% and operating-earnings-based interest and preferred dividend coverage of at least 10x.
Downgrade Triggers: Key rating triggers that could result in a downgrade include significant charges for reserves that affect equity and the capitalization of the insurance subsidiaries;financial leverage ratio maintained above 20% or debt plus preferred equity to total capital above 30%; operating earnings-based interest and preferred dividend coverage below 6.0x−7.0x; increases in underwriting leverage above 1.0x net premiums written-to-equity ratio;or earnings below industry levels and failure to maintain consistent underwriting profitability.
RatingsXLIT Ltd.Long-Term Issuer Default Rating (IDR) A-Senior Unsecured Notes BBB+Preferred Stock BBB-XL Insurance (Bermuda) Ltd.XL Re Ltd.XL Re Europe SEXL Re Latin America Ltd.XL Insurance Switzerland Ltd.XL Reinsurance America Inc.XL Insurance Company SEXL Insurance Company of New York, Inc.XL Specialty Insurance Co.Indian Harbor Insurance Co.Greenwich Insurance Co.XL Insurance America, Inc.XL Select Insurance Co.Insurer Financial Strength A+
Rating OutlookLong-Term Issuer Default Rating PositiveInsurer Financial Strength Stable
Financial DataXL Group plc($ Mil.) 12/31/13 6/30/14Total Shareholders’ Equity 11,349 11,409Total Debt 2,263 2,262Total Assets 45,653 48,162Operating Revenue 7,446 3,524Net Income 1,060 (24)Combined Ratio (%) 92.5 89.0ROAE (%) 10.3 (0.5)
Source: XL Group plc.
Related Research
Related Criteria Insurance Rating Methodology (November 2013)
AnalystsBrian C. Schneider, CPA, CPCU, ARe+1 312 606-2321 [email protected]
James B. Auden, CFA+1 312 [email protected]
www.fitchratings.com July 10, 2013
Related Research2015 Outlook: Global Reinsurance (September 2014)Alternative Reinsurance 2014 Market Update (September 2014)Global Reinsurance’s Shifting Landscape (September 2014)Latin American Reinsurance (September 2014)Reinsurer Mergers and Acquisitions (August 2014)Global Reinsurers’ Mid-Year 2014 Financial Results (August 2014)Asian Reinsurance Markets (August 2014)
Related CriteriaInsurance Rating Methodology (September 2014)

Global Reinsurance Guide 201563
Disclaimer
ALLFITCHCREDITRATINGSARESUBJECTTOCERTAINLIMITATIONSANDDISCLAIMERS.PLEASEREADTHESELIMITATIONSANDDISCLAIMERSBYFOLLOWINGTHISLINK:HTTP://FITCHRATINGS.COM/UNDERSTANDINGCREDITRATINGS. INADDITION,RATINGDEFINITIONSANDTHETERMSOFUSEOFSUCHRATINGSAREAVAILABLEONTHEAGENCY’SPUBLICWEB SITE ATWWW.FITCHRATINGS.COM. PUBLISHED RATINGS, CRITERIA, ANDMETHODOLOGIES ARE AVAILABLE FROM THIS SITE AT ALL TIMES. FITCH’S CODEOFCONDUCT,CONFIDENTIALITY,CONFLICTSOFINTEREST,AFFILIATEFIREWALL,COMPLIANCE,ANDOTHERRELEVANTPOLICIESANDPROCEDURESAREALSOAVAILABLEFROMTHECODEOFCONDUCTSECTIONOFTHISSITE.FITCHMAYHAVEPROVIDEDANOTHERPERMISSIBLESERVICETOTHERATEDENTITYORITSRELATEDTHIRDPARTIES.DETAILSOFTHISSERVICEFORRATINGSFORWHICHTHELEADANALYSTISBASEDINANEU-REGISTEREDENTITYCANBEFOUNDONTHEENTITYSUMMARYPAGEFORTHISISSUERONTHEFITCHWEBSITE.Copyright©2014byFitch,Inc.,FitchRatingsLtd.anditssubsidiaries.33WhitehallStreet,NewYork,NY10004.Telephone:1-800-753-4824,(212)908-0500. Fax: (212) 480-4435. Reproduction or retransmission in whole or in part is prohibited except by permission. All rights reserved. In issuing and maintaining its ratings, Fitch relies on factual information it receives from issuers and underwriters and from other sources Fitch believes to be credible. Fitch conducts a reasonable investigation of thefactualinformationrelieduponbyitinaccordancewithitsratingsmethodology,andobtainsreasonableverificationofthatinformationfromindependentsources,totheextentsuchsourcesareavailableforagivensecurityorinagivenjurisdiction.ThemannerofFitch’sfactualinvestigationandthescopeofthethird-partyverificationitobtainswillvarydependingonthenatureoftheratedsecurityanditsissuer,therequirementsandpracticesinthejurisdictioninwhichtheratedsecurityisofferedandsoldand/ortheissuer is located, the availability and nature of relevant public information, access to the management of the issuer and its advisers, the availability of pre-existing third-party verificationssuchasauditreports,agreed-uponproceduresletters,appraisals,actuarialreports,engineeringreports,legalopinionsandotherreportsprovidedbythirdparties,theavailabilityofindependentandcompetentthird-partyverificationsourceswithrespecttotheparticularsecurityorintheparticularjurisdictionoftheissuer,andavarietyofotherfactors.UsersofFitch’sratingsshouldunderstandthatneitheranenhancedfactualinvestigationnoranythird-partyverificationcanensurethatalloftheinformationFitch relies on in connection with a rating will be accurate and complete. Ultimately, the issuer and its advisers are responsible for the accuracy of the information they provide toFitchandtothemarketinofferingdocumentsandotherreports.InissuingitsratingsFitchmustrelyontheworkofexperts,includingindependentauditorswithrespecttofinancialstatementsandattorneyswithrespecttolegalandtaxmatters.Further,ratingsareinherentlyforward-lookingandembodyassumptionsandpredictionsaboutfutureeventsthatbytheirnaturecannotbeverifiedasfacts.Asaresult,despiteanyverificationofcurrentfacts,ratingscanbeaffectedbyfutureeventsorconditionsthatwerenotanticipatedatthetimearatingwasissuedoraffirmed.Theinformationinthisreportisprovided“asis”withoutanyrepresentationorwarrantyofanykind.AFitchratingisanopinion as to the creditworthiness of a security. This opinion is based on established criteria and methodologies that Fitch is continuously evaluating and updating. Therefore, ratings are the collective work product of Fitch and no individual, or group of individuals, is solely responsible for a rating. The rating does not address the risk of loss due to risks otherthancreditrisk,unlesssuchriskisspecificallymentioned.Fitchisnotengagedintheofferorsaleofanysecurity.AllFitchreportshavesharedauthorship.IndividualsidentifiedinaFitchreportwereinvolvedin,butarenotsolelyresponsiblefor,theopinionsstatedtherein.Theindividualsarenamedforcontactpurposesonly.AreportprovidingaFitchratingisneitheraprospectusnorasubstitutefortheinformationassembled,verifiedandpresentedtoinvestorsbytheissueranditsagentsinconnectionwiththesaleof the securities. Ratings may be changed or withdrawn at anytime for any reason in the sole discretion of Fitch. Fitch does not provide investment advice of any sort. Ratings are not a recommendation to buy, sell, or hold any security. Ratings do not comment on the adequacy of market price, the suitability of any security for a particular investor, or the tax-exempt nature or taxability of payments made in respect to any security. Fitch receives fees from issuers, insurers, guarantors, other obligors, and underwriters for rating securities. Such fees generally vary from US$1,000 to US$750,000 (or the applicable currency equivalent) per issue. In certain cases, Fitch will rate all or a number of issues issued by a particular issuer, or insured or guaranteed by a particular insurer or guarantor, for a single annual fee. Such fees are expected to vary from US$10,000 to US$1,500,000 (or the applicable currency equivalent). The assignment, publication, or dissemination of a rating by Fitch shall not constitute a consent by Fitch to use its name asanexpertinconnectionwithanyregistrationstatementfiledundertheUnitedStatessecuritieslaws,theFinancialServicesandMarketsAct2000oftheUnitedKingdom,orthesecuritieslawsofanyparticularjurisdiction.Duetotherelativeefficiencyofelectronicpublishinganddistribution,Fitchresearchmaybeavailabletoelectronicsubscribersup to three days earlier than to print subscribers. 140099

New York33 Whitehall Street NewYork,NY10004 +1 212 908 0500 +1 800 75 FITCH
London30NorthColonnade Canary Wharf LondonE145GN +44 20 3530 1000
Fitch Ratings www.fitchratings.com
Fitch Solutions www.fitchsolutions.com
Fitch Group