global presence in gold and gold products · pdf file• lowest cost gold jewellery...
TRANSCRIPT

Earnings Presentation - FY16
RAJESH EXPORTS LIMITEDGLOBAL PRESENCE IN GOLD AND GOLD PRODUCTS

2
• Posted record REVENUE, EBITDA and PAT for the year 2015-16.
• Consolidated position in the Global Gold business by emerging as the largest gold company in
the world.
• Successfully managed the operations of Valcambi and achieved growth in the operations.
• Increased thrust on direct selling of Valcambi products in retail to achieve higher profitability..
• Initiated project to achieve LBMA accreditation for Indian refinery.
• Launched new range of products Across various manufacturing operations.
HIGHLIGHT FOR THE QUARTER

3
FY 2016 Revenue : INR 1,652,114 Million (227.39% growth over FY 2015)
FY 2016 EBIDTA : INR 17,688 Million ( 39.65% growth over FY 2015)
FY 2016 Net Profit : INR 10,667 Million (62.88% growth over FY 2015)
FY 2016 EPS : INR 36.13 per equity share (62.89% growth over FY 2015)
FY16 HIGHLIGHTS
4
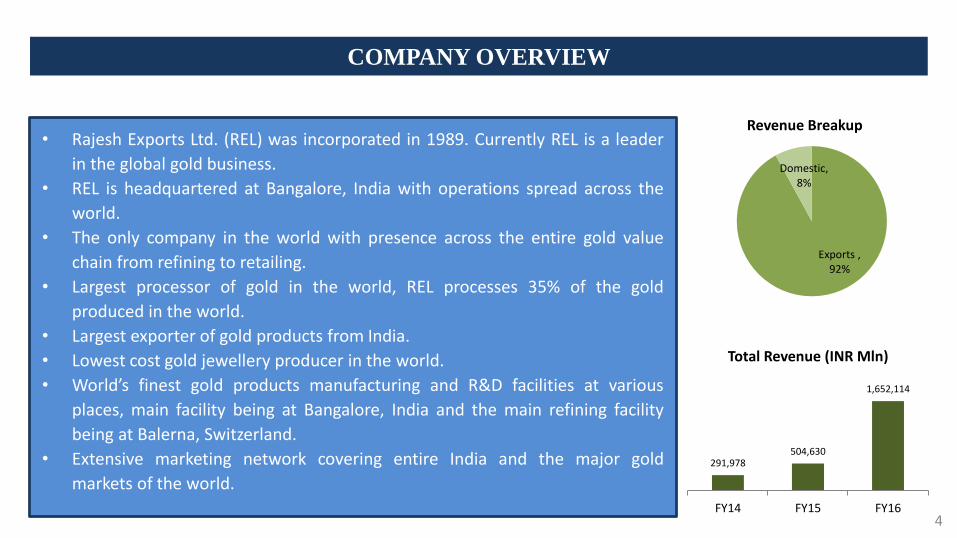
• Rajesh Exports Ltd. (REL) was incorporated in 1989. Currently REL is a leader
in the global gold business.
• REL is headquartered at Bangalore, India with operations spread across the
world.
• The only company in the world with presence across the entire gold value
chain from refining to retailing.
• Largest processor of gold in the world, REL processes 35% of the gold
produced in the world.
• Largest exporter of gold products from India.
• Lowest cost gold jewellery producer in the world.
• World’s finest gold products manufacturing and R&D facilities at various
places, main facility being at Bangalore, India and the main refining facility
being at Balerna, Switzerland.
• Extensive marketing network covering entire India and the major gold
markets of the world.
Exports , 92%
Domestic, 8%
Revenue Breakup
COMPANY OVERVIEW
291,978504,630
1,652,114
FY14 FY15 FY16
Total Revenue (INR Mln)

5
SEAMLESS INTEGRATION - REFINING
THE WORLD’S LARGEST REFINER
6
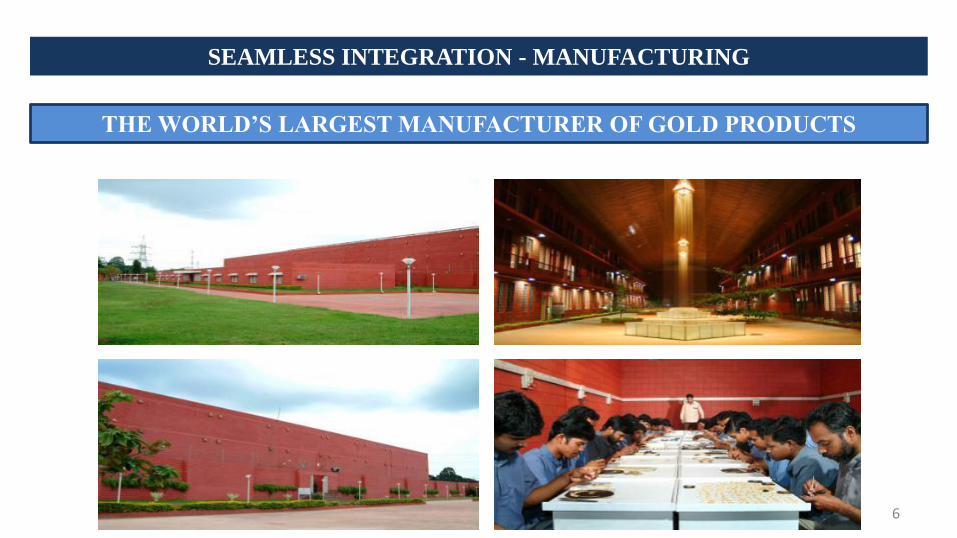
SEAMLESS INTEGRATION - MANUFACTURING
THE WORLD’S LARGEST MANUFACTURER OF GOLD PRODUCTS

7
SEAMLESS INTEGRATION - EXPORTS
THE WORLD’S LARGEST EXPORTER OF GOLD PRODUCTS

8
SEAMLESS INTEGRATION - WHOLESALE
SUPPLYING TO MORE THAN 5000 JEWELLERS ACROSS INDIA

9
SEAMLESS INTEGRATION - RETAIL
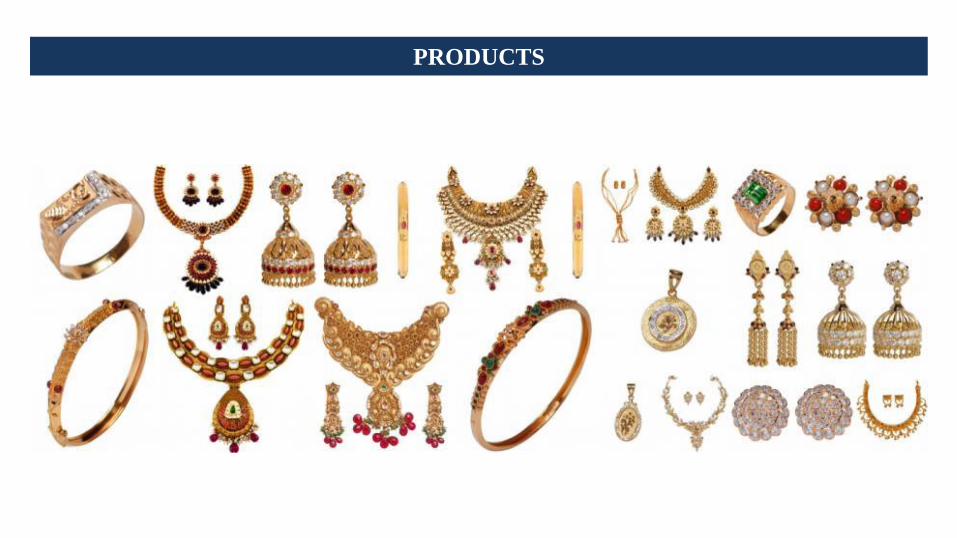
PRODUCTS

Cast Products Minted Products Combi Bars Grains
Round Bars Coins and MedalsLarge Bar 1 Kg Bar
11
PRODUCTS

12
Q4 FY 2016 Revenue : INR 559,283 Million (191.81% growth over Q4 FY 2015)
Q4 FY 2016 Net Profit : INR 2,470 Million (20.17% growth over Q4 FY 2015)
Q4 FY 2016 EPS : INR 8.37 per equity share (20.26% growth over Q4 FY 2015)
Q4 FY16 HIGHLIGHTS

13
INCOME STATEMENT (Figures in INR mln)
Description FY16 FY15 Y-o-Y
Net sales* 16,52,204 5,04,630 227.4%
Expenditure 16,34,516 4,91,964 232.2%
EBITDA 17,688 12,666 39.65%
EBITDA margin 1.07% 2.51% (1.44)%
Depreciation 790 622 27.0%
Finance Cost 5,776 4,783 20.7%
PBT 11,122 7,261 83.6%
Tax 413 711 (41.91)
Share of profit of associates 41 - -
PAT 10,668 6,550 62.8%
PAT margin 0.65% 1.30% (0.65)%
EPS 36.13 22.18 62.9%
* Includes Other Income
FY16 CONSOLIDATED RESULTS

14
INCOME STATEMENT (Figures in INR mln)
Description Q4-FY16 Q4-FY15 Y-o-Y
Net sales* 5,59,329 1,91,620 191.89%
Expenditure 5,54,149 1,86,879 196.53%
EBITDA 5,180 4,741 9.26%
EBITDA margin 0.93% 2.47% (1.54)%
Depreciation 180 196 (8.16)%
Finance Cost 2131 1778 19.85%
PBT 2,869 2,767 3.69%
Tax 358 711 (49.65)%
Share of profit of associates (41) 0 -
PAT 2,470 2,056 20.14%
PAT margin 0.44% 1.07% (0.63)%
EPS 8.37 6.96 20.26%
* Includes Other Income
QUARTERLY CONSOLIDATED RESULTS
15
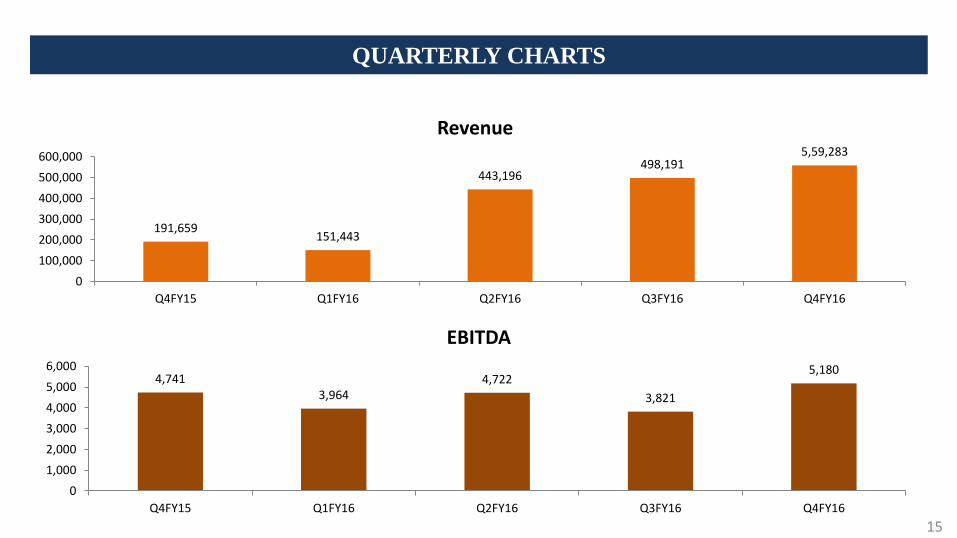
QUARTERLY CHARTS
191,659151,443
443,196498,191
5,59,283
0
100,000
200,000
300,000
400,000
500,000
600,000
Q4FY15 Q1FY16 Q2FY16 Q3FY16 Q4FY16
Revenue
4,7413,964
4,722
3,821
5,180
0
1,000
2,000
3,000
4,000
5,000
6,000
Q4FY15 Q1FY16 Q2FY16 Q3FY16 Q4FY16
EBITDA
16
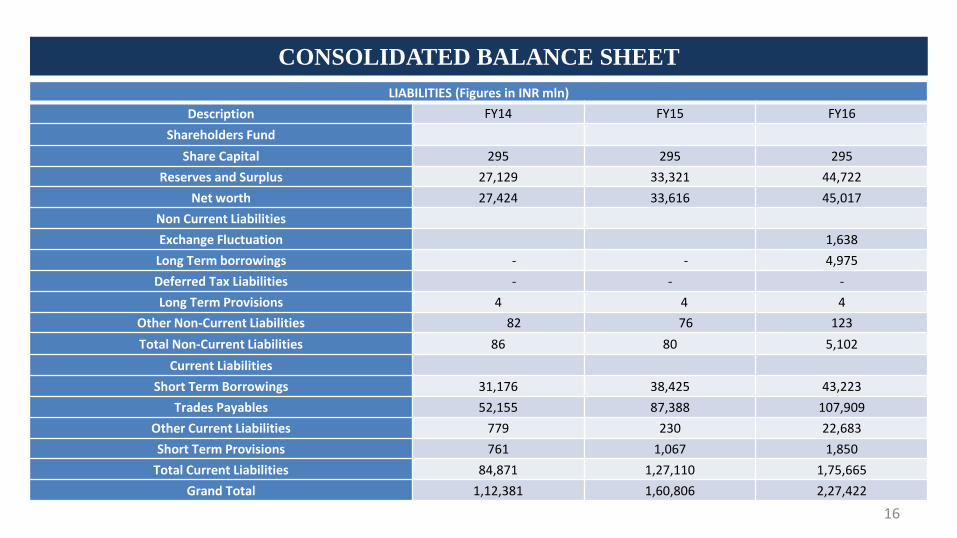
LIABILITIES (Figures in INR mln)
Description FY14 FY15 FY16
Shareholders Fund
Share Capital 295 295 295
Reserves and Surplus 27,129 33,321 44,722
Net worth 27,424 33,616 45,017
Non Current Liabilities
Exchange Fluctuation 1,638
Long Term borrowings - - 4,975
Deferred Tax Liabilities - - -
Long Term Provisions 4 4 4
Other Non-Current Liabilities 82 76 123
Total Non-Current Liabilities 86 80 5,102
Current Liabilities
Short Term Borrowings 31,176 38,425 43,223
Trades Payables 52,155 87,388 107,909
Other Current Liabilities 779 230 22,683
Short Term Provisions 761 1,067 1,850
Total Current Liabilities 84,871 1,27,110 1,75,665
Grand Total 1,12,381 1,60,806 2,27,422
CONSOLIDATED BALANCE SHEET

17
ASSETS (Figures in INR mln)
Description FY14 FY15 FY16
Non-Current Fixed Assets
Fixed Assets 1,685 2,637 7,011
Capital Work-in-Progress 4 4 -
Total Fixed Assets 1,689 2,641 7,011
Goodwill on Consolidation - - 6,477
Non-Current Investments 134 602 8,405
Long Term Loan and Advances 415 415 600
Deferred Tax Assets/ (Liabilities) 8 8 8
Total Non-Current Assets 2,246 3,666 15,490
Current Assets
Current Investments - - -
Inventories 5,713 5,675 9,926
Trade Receivables 24,152 29,898 68,890
Cash and Cash Equivalents 72,141 1,14,064 1,18,653
Short Term Loan and Advances 4,315 3,281 3,116
Other Current Assets 3,814 4,222 4,336
Total 1,10,135 1,57,140 2,04,921
Grand Total 1,12,381 1,60,806 2,27,422
CONSOLIDATED BALANCE SHEET
18
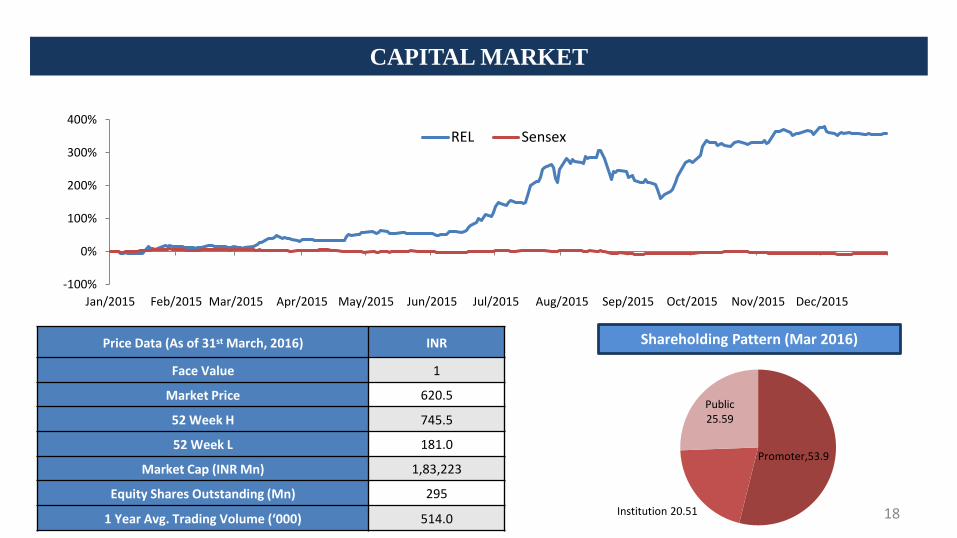
Price Data (As of 31st March, 2016) INR
Face Value 1
Market Price 620.5
52 Week H 745.5
52 Week L 181.0
Market Cap (INR Mn) 1,83,223
Equity Shares Outstanding (Mn) 295
1 Year Avg. Trading Volume (‘000) 514.0
Shareholding Pattern (Mar 2016)
-100%
0%
100%
200%
300%
400%
Jan/2015 Feb/2015 Mar/2015 Apr/2015 May/2015 Jun/2015 Jul/2015 Aug/2015 Sep/2015 Oct/2015 Nov/2015 Dec/2015
REL Sensex
Promoter,53.9
Institution 20.51
Public25.59
CAPITAL MARKET

19
For further details please contact our Investor Relations Representatives:VALOREM ADVISORSAnuj SonpalTel: +91-22-3006-7521/2/3/4Email: [email protected]
Rajesh Exports Ltd.
No representation or warranty, express or implied, is made as to, and no reliance should be placed on, the fairness, accuracy , completeness or correctness of the information or opinions contained in this presentation. Such information and opinions are in all events not current after the date of this presentati on. Certain statements made in this presentation may not be based on historical information or facts and may be "forward looking statements" based on the currently held beliefs and assu mptions of the management of Rajesh Exports Ltd. (“Company” or “ REL” ), which are expressed in good faith and in their opinion reasonable, including those relating to the Company ’s general business plans and strategy, its future financial condition and growth prospects and future developments in its industry and its competitive and regulatory environme nt.
Forward-looking statements involve known and unknown risks, uncertainties and other factors, which may cause the actual results, financial condition, performance or achievements of the Company or industry results to differ materially from the results, financial condition, performance or achievements expre ssed or implied by such forward-looking statements, including future changes or developments in the Company’s business, its competitive environment and political, economic, legal and social conditions. Further, past performance is no t necessarily indicative of future results. Given these risks, uncertainties and other factors, viewers of this presentation ar e cautioned not to place undue reliance on these forward-looking statements. The Company disclaims any obligation to update these forward -looking statements to reflect future events or developments.
This presentation is for general information purposes only, without regard to any specific objectives, financial situations o r informational needs of any particular person. This presentation does not constitute an offer or invitation to purchase or subscribe for any securities in any jurisdiction, incl uding the United States. No part of it should form the basis of or be relied upon in connection with any investment decision or any contract or commitment to purchase or subscribe for any secu rities. None of our securities may be offered or sold in the United States, without registration under the U.S. Securities Act of 1933, as amended, or pursuant to an exemption from r egistration there from.
This presentation is confidential and may not be copied or disseminated, in whole or in part, and in any manner.
Valorem Advisors Disclaimer:
Valorem Advisors is an Independent Investor Relations Management Service company. This Presentation has been prepared by Valo rem Advisors based on information and data which the Company considers reliable, but Valorem Advisors and the Company makes no representation or warranty, express or implied, whatsoever, and no reliance shall be placed on, the truth, accuracy, completeness, fairness and reasonableness of the contents of this Presentation. This Presentation may not be all inclusive and may not contain all of the information that you may consider material. Any liability in respect of the contents of, or any omission from, this Presentation is expressly excluded. Valorem Advisors also hereby certifies that the directors or employees of Valorem Advisors do not own any stock in personal or company capacity of the Company under review
DISCLAIMER

THANK YOU
20