global oilseed production: trends, drivers, competition · global oilseed production: trends,...
TRANSCRIPT

Folkhard Isermeyer
Prof. Dr. Folkhard Isermeyer Thünen Institute, Braunschweig, Germany
Global Oilseed Production: Trends, Drivers, Competition
October 2015

Folkhard Isermeyer
Content
1 Production
• Acreage
• Production
2 Trade and Consumption
• World trade
• Use for food, feed, fuel
3 Commodity Prices
• Food and feed
• Impact of bioenergy
4 Future Competitiveness
• Yield ratios
• Price ratios
10/2015
Global Oilseed Production: Trends, Drivers, Competition
page 2

Folkhard Isermeyer
World Acreage of Different Crops , 1971/73 – 2011/13
10/2015 Global Oilseed Production: Trends, Drivers, Competition
page 3
Pulses
Mill
ion
ha
0
100
200
300
400
500
600
700
800
0
100
200
300
400
500
600
700
800
Numbers in the legend = percent change of acreage between 1971/73 and 2011/13 Source: FAOSTAT, own calculations
Grains
-15%
-25%
-52%
+53%
+21%
-32%
+1%
Sorghum
Millet
Others
Corn
Rice
Barley
Wheat
71
/73
81
/83
91
/93
01
/03
11
/13
Oil Crops
+164%
+71%
+6%
+426%
Olives
Cocos
Others
Palm Oil
176%
+24%
+285%
+223%
+1%
Sunflowers
Groundnnut
Rapeseed
Soybeans
Cotton
71
/73
81
/83
91
/93
01
/03
11
/13
+30%
-2%
+32%
Beans
Peas
Others
71
/73
81
/83
91
/93
01
/03
11
/13
Roots & Tubers
-4%
+71%
+37%
Potatoes
Maniok
Others
71
/73
81
/83
91
/93
01
/03
11
/13
Sugar Crops
71
/73
81
/83
91
/93
01
/03
11
/13
Vegetable, Fruits, Nuts
+145%
+90%
+277%
Vegetable
Fruits
Nuts
71
/73
81
/83
91
/93
01
/03
11
/13
+136%
-39% Sugarbeet
Sugarcane

Folkhard Isermeyer
0
20
40
120
140
160
180
1963 1973 1983 1993 2003 2013
mill
ion
to
nn
es (
Mt)
10/2015 Global Oilseed Production: Trends, Drivers, Competition
page 4
World production of plant oil, 1963 - 2013
Source: FAOSTAT, own calculations.
60
80
100
Other
Maize oil
Olive oil, virgin
Coconut oil (copra)
Cottonseed oil
Groundnut oil
Sunflower oil
Rapeseed oil
Soybean oil
Palm & kernel oil
„G4“: 87 %

Folkhard Isermeyer
Sunflower oil 2013
1993
Rest of the world
10/2015 Global Oilseed Production: Trends, Drivers, Competition
page 5
Plant Oil Production, by Country, 1993 and 2013 (only countries with > 1 Mt in 2013)
Source: FAOSTAT, own calculations.
palm & palm kernel oil 2013
1993
Soybean oil 2013
1993
Canada: Rapeseed oil 2013: 2,8 Mt
EU
Argentina
Ukraine
Russia
Nigeria
India
China
Indonesia
Rapeseed oil 2013
1993
Canada
USA
Brazil
Colombia
Thailand
Malaysia

Folkhard Isermeyer 10/2015 Global Oilseed Production: Trends, Drivers, Competition
page 6
Production of Oil Crops, by country, 1993 and 2013 (only countries with > 1 Mt in 2013)
Source: FAOSTAT, own calculations. Canada rapeseed 2013: 18 Mt
Australia
Bolivia
Brazil
Canada
China
EU
Argentina
India
Indonesia
Malaysia
Paraguay
Russia
UkraineUSA
Rest of the world
Sunflower seed 2013
1993
palm & palm kernel oil 2013
1993
soybeans 2013
1993
rapeseed 2013
1993

Folkhard Isermeyer 10/2015 Global Oilseed Production: Trends, Drivers, Competition
page 7
World acreage of major oil crops , 1991 – 2013 (million ha)
Source: FAOSTAT, own calculations.
mill
ion
ha rapeseed
soybeans
sunflower seed
palm oil
0
20
40
60
80
100
120

Folkhard Isermeyer 10/2015 Global Oilseed Production: Trends, Drivers, Competition
page 8
World production of Major Oil Crops, 1991 – 2013 (1991/95 = 100)
Source: FAOSTAT, own calculations.
0
50
100
150
200
250
300
350
400
450
19
91
/95
= 1
00
rapeseed
soybeans
sunflower seed
palm oil
Folkhard Isermeyer
Content
1 Production
• Acreage
• Production
2 Trade and Consumption
• World trade
• Use for food, feed, fuel
3 Commodity Prices
• Food and feed
• Impact of bioenergy
4 Future Competitiveness
• Yield ratios
• Price ratios
10/2015 Global Oilseed Production: Trends, Drivers, Competition
page 9

Folkhard Isermeyer 10/2015 Global Oilseed Production: Trends, Drivers, Competition
page 10
Seed, Oil, Cake: Net Exports or Net Imports, 2010 (only trade volumes > 1 Mt / country)
palm and palm kernel
soybean
sunflower
Canada rapessed (seed, oil, cake): 12 Mt
rapeseed and mustardseed
net exp cake net exp oil net exp seed
net imp seed net imp oil net imp cake
Source: FAOSTAT, own calculations
Rest of the world
Canada
USA
Mexico
Argentina
Ukraine
EU
Brazil
Japan
India
Iran
Paraguay
China
Vietnam
MalaysiaThailand
Indonesia

Folkhard Isermeyer 10/2015 Global Oilseed Production: Trends, Drivers, Competition
page 11
Use of oil crops for food, feed, other purposes (World, Mt, 2001 and 2011)
Source: FAOSTAT, own calculations 0 20 40 60 80 100 120 140 160 180 200
2001 ∆ 01-11
2001 ∆ 01-11
2001 ∆ 01-11
2001 ∆ 01-11
Mt
sunflower
rapeseed
palm and palm kernel
soybean
sunflower
rapeseed
palm and palm kernel
soybean
sunflower
rapeseed
palm and palm kernel
soybean
Food
Feed
other
change from 2001 to 2011 Mio. t %
3 30
6 21
2 30
6 58
15 66
61 48
6 53
2 63
8 183
11 180
2 130
19 136
!
!
!

Folkhard Isermeyer
Content
1 Production
• Acreage
• Production
2 Trade and Consumption
• World trade
• Use for food, feed, fuel
3 Commodity Prices
• Food and feed
• Impact of bioenergy
4 Future Competitiveness
• Yield ratios
• Price ratios
10/2015 Global Oilseed Production: Trends, Drivers, Competition
page 12
Folkhard Isermeyer 10/2015 Global Oilseed Production: Trends, Drivers, Competition
page 13
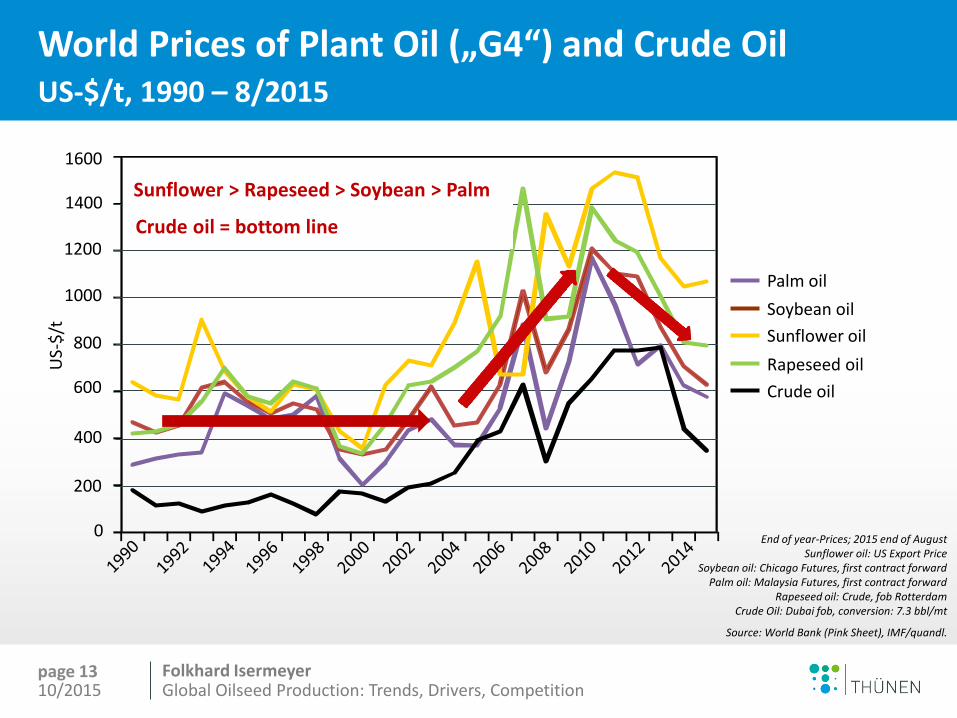
World Prices of Plant Oil („G4“) and Crude Oil US-$/t, 1990 – 8/2015
End of year-Prices; 2015 end of August Sunflower oil: US Export Price
Soybean oil: Chicago Futures, first contract forward Palm oil: Malaysia Futures, first contract forward
Rapeseed oil: Crude, fob Rotterdam Crude Oil: Dubai fob, conversion: 7.3 bbl/mt
Source: World Bank (Pink Sheet), IMF/quandl.
Rapeseed oil
Soybean oil
Sunflower oil
Palm oil
Crude oil
US-
$/t
0
200
400
600
800
1000
1200
1400
1600
Sunflower > Rapeseed > Soybean > Palm
Crude oil = bottom line

Folkhard Isermeyer 10/2015 Global Oilseed Production: Trends, Drivers, Competition
page 14
World Prices of Protein Feed Fish meal, Soybean meal, Rapeseed meal, US-$/t, 1990 – 2014
Source: World Bank (Pink Sheet), Canola Council of Canada, own calculations.
US-
$/t
0
200
400
600
800
1000
1200
1400
1600
1800
2000
fish meal
soybean meal
rapeseed meal
- Fishmeal prices show strongest increase
- Rapeseed meal constantly 2/3 of soybean meal

Folkhard Isermeyer Global Oilseed Production: Trends, Drivers, Competition
page 15
World Population
0
2
4
6
8
10
bn
. peo
ple
19
68
19
70
19
72
19
74
19
76
19
78
19
80
19
82
19
84
19
86
19
88
19
90
19
92
19
94
19
96
19
98
20
00
20
02
20
04
20
06
20
08
20
10
20
12
20
14
20
16
20
18
20
20
20
22
20
24
20
26
20
28
20
30
20
32
20
34
20
36
20
38
20
40
20
42
20
44
20
46
20
48
World Grain Production
0
1
2
3
4
bn
. to
nn
es
19
68
19
70
19
72
19
74
19
76
19
78
19
80
19
82
19
84
19
86
19
88
19
90
19
92
19
94
19
96
19
98
20
00
20
02
20
04
20
06
20
08
20
10
20
12
20
14
20
16
20
18
20
20
20
22
20
24
20
26
20
28
20
30
20
32
20
34
20
36
20
38
20
40
20
42
20
44
20
46
20
48
World Meat Production
0,0
0,1
0,2
0,3
0,4
0,5
bn
. to
nn
es
1968
1970
1972
1974
1976
1978
1980
1982
1984
1986
1988
1990
1992
1994
1996
1998
2000
2002
2004
2006
2008
2010
2012
2014
2016
2018
2020
2022
2024
2026
2028
2030
2032
2034
2036
2038
2040
2042
2044
2046
2048
+117 %
+191 %
Source: FAO, own presentation.
10/2015
Outlook for World Population and Food Demand Last 40 years, next 40 years (FAO estimates for grain and meat)

Folkhard Isermeyer
- Has triggered difficult policy debates (world food, ILUC) - Was policy-driven (subsidies, admix-quotas), not market-driven
0
500
1000
1500
2000
2500
1,0
00
bar
rel/
day
10/2015 Global Oilseed Production: Trends, Drivers, Competition
page 16
Biofuels: Policy-driven expansion, but slowdown Ethanol and Biodiesel, world production, 2000 - 2014
Biodiesel ROW
Biodiesel Europe
Ethanol ROW
Ethanol Brazil
Ethanol USA
Sources: EIA U.S. Energy Information Administration,
RFA Renewable Fuels Association, USA, OECD, Statistic Technology,
own calculations
2013: Provisional 2014: Forecast
- Biofuel boom between 2000 and 2010
Chances for market-driven bioenergy boom?

Folkhard Isermeyer
Can we expect market-driven expansion of biofuels? (First attempt to quantify a „bushel-barrel-correlation“ for corn)
Global Oilseed Production: Trends, Drivers, Competition
page 17 10/2015
Global energy consumption: 500 bn. GJ Supplying 1 % via biofuels would need 50 million ha Biofuel segment will remain small compared to total world energy demand Yes, rising prices for fossil fuels would pull all agricultural commodity prices upward

Folkhard Isermeyer
Decline of crude oil extraction is in sight
10/2015 Global Oilseed Production: Trends, Drivers, Competition
page 18
Projection
Source: Gehrling, BGR, 2004
Total crude oil
Conventional crude oil
Share of non-conventional crude oil - Very heavy oils - Oil sands - Oil shale
Crude oil supply will reach upper limit rather soon
Theoretically, this could speed up market demand for biofuels …

Folkhard Isermeyer
… but there are other fossil energy sources, with potential impact on agricultural commodity prices
10/2015
Global Oilseed Production: Trends, Drivers, Competition
page 19
The „fossil fuel story“ (in short):
Crude oil production will soon reach maximum
In 100 years, it will be much lower than today, with world energy consumption still growing
However, coal can fill the gap, ressources are sufficient for 1.000 years, and liquid fuels can be made from coal (break even at 50 $/barrel)
The “fossil fuel era“ may last for a long time, with low prices
But: >50% of GHG emissions caused by fossil fuels; persistence of fossil fuel era climate desaster
A global, legally binding & really effective GHG emission treaty is needed – however, little chances …

Folkhard Isermeyer
Coal: Undesired. Solar: Bright future - but needs time.
10/2015
Global Oilseed Production: Trends, Drivers, Competition
page 20
Long run: Little chances for biodiesel to find a place in the „eternal fuel portfolio“
Medium run: Only chances, if policy makes protective provisions for biodiesel
„Justifications“: (1) contribute to GHG policy, (2) no electromobility for trucks
But: Hardly possible to achieve better GHG figures than ethanol or soy diesel
Caution with praising biodiesel as „climate-smart fuel“ and neglecting ILUC
Chances for flexible bioenergy policy? (depending on world food prices)
Focus on other values of oilseed (crop rotation; landscape; healthy food)
Should policy enforce biodiesel to bridge the gap?

Folkhard Isermeyer
Content
1 Production
• Acreage
• Production
2 Trade and Consumption
• World trade
• Use for food, feed, fuel
3 Commodity Prices
• Food and feed
• Impact of bioenergy
4 Future Competitiveness
• Yield ratios
• Price ratios
10/2015 Global Oilseed Production: Trends, Drivers, Competition
page 21

Folkhard Isermeyer
Assessment of Future Competitiveness is complicated Analytical framework: Two dimensions, various determinants
10/2015
Global Oilseed Production: Trends, Drivers, Competition
page 22
Commodity markets
Competitors:
Food: other vegetable oils
Feed: other protein feedstuffs
Biofuels: Other feedstock
Farm level
Competitors:
Other oil & protein crops
Other cash crops (e.g. grains)
Fodder crops and grassland
Determinants
Price ratio Fatty acid composition Nutritional value of proteins Suitability for processing GHG balance Image of the product … Price ratio Input needed Input prices Yield ratio Crop rotation aspects …
Network for detailled analysis:

Folkhard Isermeyer
Wheat acreage
Wheat yield
Rapeseed acreage
Rapeseed yield
10/2015 Global Oilseed Production: Trends, Drivers, Competition
page 23
Wheat vs. Rapeseed vs. Sunflowers: World acreage and average yield, 1963-2013
0
100
200
300
400
500
600
1963/65 = 100
Source: FAOSTAT, own calculations
Sunflower seed acreage
Sunflower seed yield

Folkhard Isermeyer 10/2015 Global Oilseed Production: Trends, Drivers, Competition
page 24
Yields, major oil plants World average, dt/ha
Source: FAOSTAT, own calculations.
dt/
ha
0
5
10
15
20
25
30
35
rapeseed
soybeans
sunflower seed
palm oil
Folkhard Isermeyer 10/2015 Global Oilseed Production: Trends, Drivers, Competition
page 25
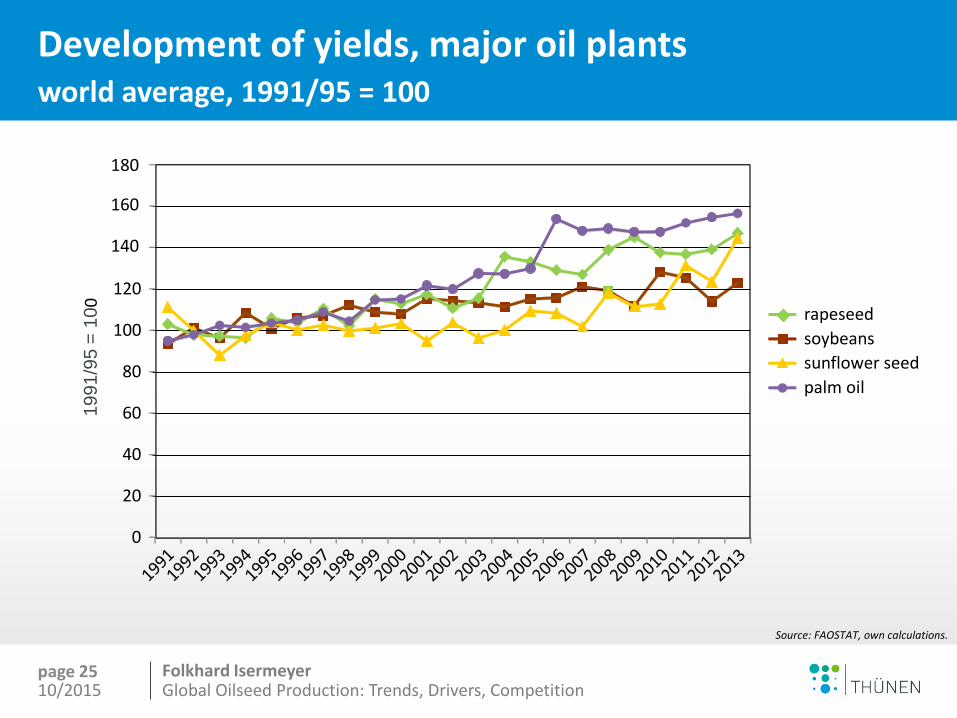
Development of yields, major oil plants world average, 1991/95 = 100
Source: FAOSTAT, own calculations.
19
91
/95
= 1
00
0
20
40
60
80
100
120
140
160
180
rapeseed
soybeans
sunflower seed
palm oil

Folkhard Isermeyer
Development of rapeseed and soybean yields Top 5 producers and world average, since 1991
10/2015 Global Oilseed Production: Trends, Drivers, Competition
page 26
Rapeseed yields
Ø 2009/13
growth since
1991/95
dt/ha dt/ha %
Canada 20 7 54
China 19 6 42
India 12 3 36
Germany 38 9 30
France 34 5 15
Ø Top 5 19 6 48
Ø Top 10 19 5 43
Ø World 19 6 41
Soybean yields
Ø 2009/13
growth since
1991/95
dt/ha dt/ha %
USA 29 4 17
Brazil 29 8 41
Argentina 24 3 14
China 18 2 12
India 12 2 23
Ø Top 5 25 4 20
Ø Top 10 25 4 19
Ø World 24 4 20
Source: FAOSTAT, own calculations.
Sunflower yields
Ø 2009/13
growth since
1991/95
dt/ha dt/ha %
Ukraine 17 5 41
Russia 13 3 31
Argentina 17 0 3
China 24 7 39
Romania 16 4 29
Ø Top 5 18 4 28
Ø Top 10 16 3 28
Ø World 15 3 25

Folkhard Isermeyer 10/2015 Global Oilseed Production: Trends, Drivers, Competition
page 27
Price ratio between oil and meal soybeans and rapeseed, 1990 – 2014
Source: World Bank (Pink Sheet), Canola Council of Canada, own calculations.
0
1.0
2.0
3.0
4.0
5.0
6.0
soybeans
rapeseed
Price ratio oil/meal
- Rapeseed oil price > soy oil price, but rapeseed meal is far behind
?
- Soy meal boom soy oil = by-product pressure on oil price
Focus on rapeseed meal? (breeding; segmentation of markets)

Folkhard Isermeyer
Summary
10/2015
Global Oilseed Production: Trends, Drivers, Competition
page 28
Production: Strong expansion: (1) palm, (2) soy & rapeseed, (3) sunflower
Trade: Soy and palm dominating; only Canada with significant rapeseed export
Use: Strong growth in bioenergy; rapeseed particularly poor in food segment
Prices: All agricultural commodities showed strong price increase after 2006
Price Outlook: Strong food & feed demand; new risks through low fossil fuel price
Biodiesel: Market-driven expansion unlikely; not easy to relaunch policy support
Competitiveness: Positive; EU-rapeseed could enter foreign markets, if necessary
Yield Development: Palm oil > rapeseed > soybeans > sunflower seed
Price Ratio: Market signals might suggest to focus more on protein than on fat

Folkhard Isermeyer 10/2015 Global Oilseed Production: Trends, Drivers, Competition
page 29
Thank you very much for your attention!