global monitoring report 2008 - icrier.orgicrier.org/pdf/gmr 2008.pdf · global monitoring report...
TRANSCRIPT

1
Global Monitoring Report 2008MDGs and the Environment
Agenda for Inclusive and Sustainable Development

2
World on track on poverty reduction and gender parity at school MDGs, but serious shortfalls likely on nutrition, education, health, and sanitation goals
dd

3
Africa lags on all MDGs, South Asia on most human development goals. At country level,
most countries are off track to meet most MDGs

4
Progress toward MDGs slowest in fragile states—even negative on some MDGs

5
Agenda ahead• Assessment at midpoint shows urgent need to generate
stronger, more inclusive momentum toward the MDGs
• With stronger efforts by countries and by development partners, most MDGs still achievable for most countries
• As MDG 7 underscores, development and environmental sustainability are integrally linked
• In this Year of Action for MDGs, need to agree on priority actions and milestones for monitoring progress
• Report emphasizes a six-point agenda for inclusive and sustainable development
6
MDGs and the environment: A six-point agenda for inclusive and sustainable development
• Sustain and broaden the growth momentum• Achieve better results in human development• Integrate development and environmental
sustainability• Scale up aid and increase its effectiveness• Harness trade for strong, inclusive, and sustainable
growth• Leverage IFI support for inclusive and sustainable
development

7
Increased risks from financial turbulence—developing-country growth slowing but still robust
0
2
4
6
8
10
World output Advancedeconomies
Emerging marketand developing
countries
Developing Asia Africa
2007 2008 (Projected) 2009 (Projected)
annual % change

8
Private capital flows expected to ease but remain relatively abundant
Net private capital flows to developing countries
0
200
400
600
800
1000
1990 1992 1994 1996 1998 2000 2002 2004 2006 2008P0
2
4
6
8
$ billions Percent
Percent of GDP (right axis)
$1 trillion in 2007

9
Sharp rises in energy and food prices add to risks
0
100
200
300
400
500
1990 1992 1994 1996 1998 2000 2002 2004 2006 2008
grains raw materials metals energy
Commodity Price Index (1990=100)

10
Diversity of food price impacts on povertyImpact of food price increases in 2005-07 on $1/day poverty
-4
-2
0
2
4
6
8
10
12
Bolivia
Cambodia
Madag
asca
r
Malawi
Nicarag
ua
Pakist
an
Peru
Vietna
m
Zambia
Averag
e
$1/day poverty rate
Rural Urban Total

11
Rising food prices—countries are responding, but differently
Percentage of 58 countries
0
5
10
15
20
25
30
35
40
45
Reduc
e foo
dgrain
taxe
s
Increas
e foo
dgra
in sto
cks
Expor
t res
tricti
ons
Price c
ontrols
/consu
mer su
bsidies
None
Safety net interventions Food price policies
Percentage of 58 countries
0
5
10
15
20
25
30
Cash t
ransfe
r
Food
for w
orkFo
od ra
tion/s
tamp
Schoo
l feed
ing

12
Growth in Africa has improved, but varies widely across countries

13
Growth Policies: priorities vary by country, but three essentials: sound macro; conducive private investment
climate (incl. infrastructure); and good governance
Note: Lower number denotes higher ranking
Ease of Doing Business Rankings, 2008
22
76 7787
96107
136
76
91
120
0
20
40
60
80
100
120
140
160
OECD HighIncome
EasternEurope
andCentral
Asia
East Asia& the
Pacific
LatinAmerica &
theCaribbean
MiddleEast &NorthAfrica
South Asia Sub-Saharan
Africa
Pakistan Vietnam India

14
Governance mattersQuality of overall public sector management and institutions
Note: A higher score denotes better performance.
World Bank CPIA indicators, 2006 (scale 1-6)
2.82.93.03.13.23.33.43.53.63.73.8
Middle-income
countries
Low-income
countries
Sub-Saharan
Africa
Pakistan Vietnam India

15
Growth needs to be more inclusive—both across and within countries
Annual change in Gini coefficient in 59 developing countries

16
More but better spending on education and healthPublic spending on education and health typically favors the rich
17
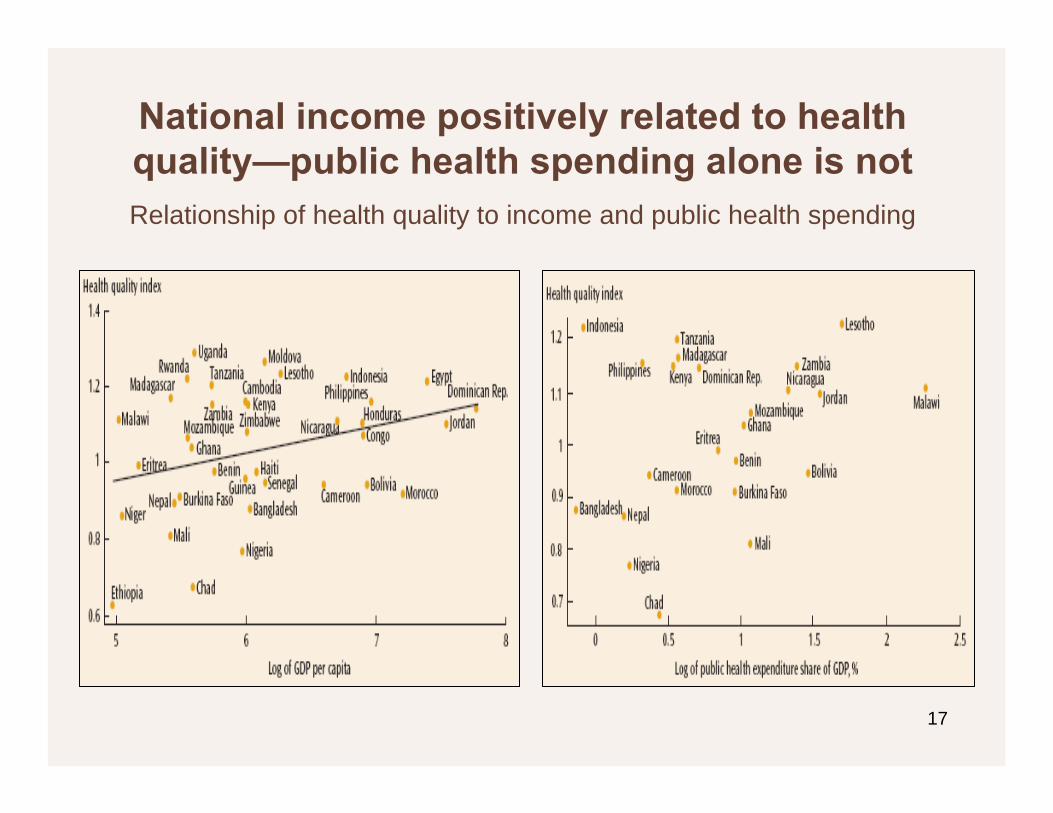
National income positively related to health quality—public health spending alone is notRelationship of health quality to income and public health spending

18
Stronger focus needed on combating malnutrition—higher food prices increase urgency
Incidence of stunting remains high in low-income countries

19
Environmental health risks—a significant concernEconomic burden of poor environmental health can be high—
1.5-4% of GDP annually

20
Environment and growth: many countries are on an unsustainable long-term path
Adjusted net saving trends,1990-2005

21
Natural resource dependence patterns vary across regions/income groups
Depletion of natural resources is often associated with declining national wealth
Developing countries’ heavier dependence on natural resources makes sound resource management
especially critical for sustainability
-20
-10
0
10
20
30
40
50
Major oil producers
Perc
ent o
f GN
I
Non-renewable resource rentsAdjusted net saving
22
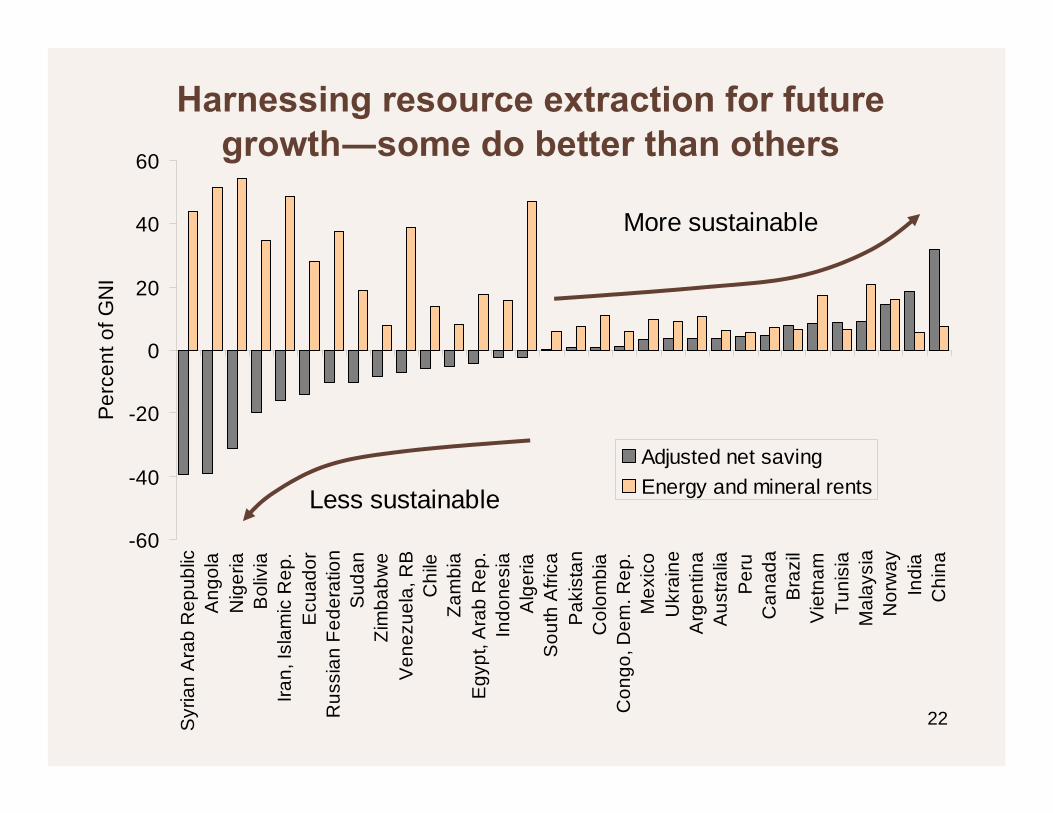
Harnessing resource extraction for future growth―some do better than others
-60
-40
-20
0
20
40
60S
yria
n A
rab
Rep
ublic
Ang
ola
Nig
eria
Bol
ivia
Iran,
Isla
mic
Rep
.E
cuad
orR
ussi
an F
eder
atio
nS
udan
Zim
babw
eV
enez
uela
, RB
Chi
leZa
mbi
aE
gypt
, Ara
b R
ep.
Indo
nesi
aA
lger
iaS
outh
Afri
caP
akis
tan
Col
ombi
aC
ongo
, Dem
. Rep
.M
exic
oU
krai
neA
rgen
tina
Aus
tralia
Per
uC
anad
aB
razi
lV
ietn
amTu
nisi
aM
alay
sia
Nor
way
Indi
aC
hina
Per
cent
of G
NI
Adjusted net savingEnergy and mineral rentsLess sustainable
More sustainable

23
Depletion of natural resources: it’s not just oilAnnual forest loss equal in size to Panama or Sierra Leone
Annual deforestation by region and income group, 2000-05

24
Water stress is especially acute in Middle East and South Asia
Internal freshwater resources per capita, 2005

25
Developing countries are most vulnerable to climate change and least able to adapt
Impact of climate change on agricultural yields, 2079-99

26
Climate change impacts health, particularly in Africa, South Asia, and the Middle East
Estimated deaths due to climate change in 2000, by WHO subregion

27
Sea level rise will have major impacts, especially in more vulnerable countries
0
5
10
15
20
25
30
Population GDP Urban Areas Wetlands
% im
pact
ed
LAC MNA SSA EAP SAR 10 most affected countries Vietnam
Impact of a 1 meter rise in sea level
28
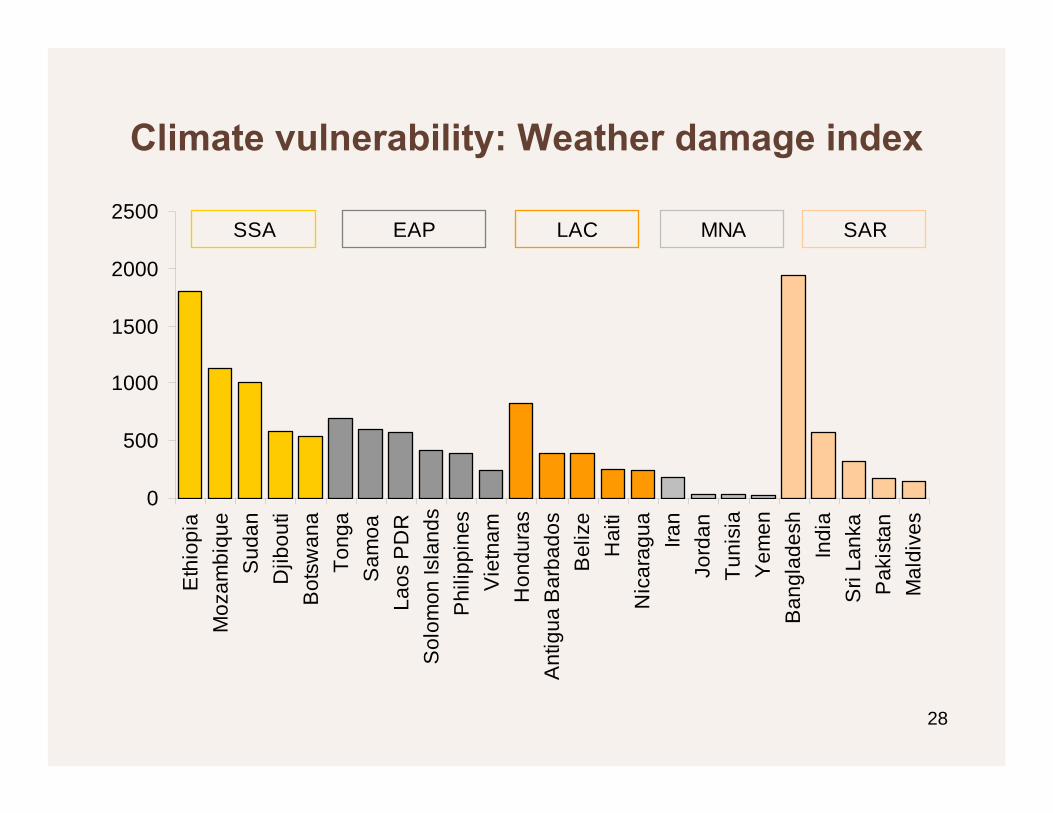
Climate vulnerability: Weather damage index
0
500
1000
1500
2000
2500E
thio
pia
Moz
ambi
que
Sud
anD
jibou
tiB
otsw
ana
Tong
aS
amoa
Laos
PD
RS
olom
on Is
land
sP
hilip
pine
sV
ietn
amH
ondu
ras
Ant
igua
Bar
bado
sB
eliz
eH
aiti
Nic
arag
ua Iran
Jord
anTu
nisi
aY
emen
Ban
glad
esh
Indi
aS
ri La
nka
Pak
ista
nM
aldi
ves
SSA LAC MNA SAREAP

29
Mitigation calls for common but differentiated responsibilities
Per capita GHG emissions (including from land use change), 2000
30
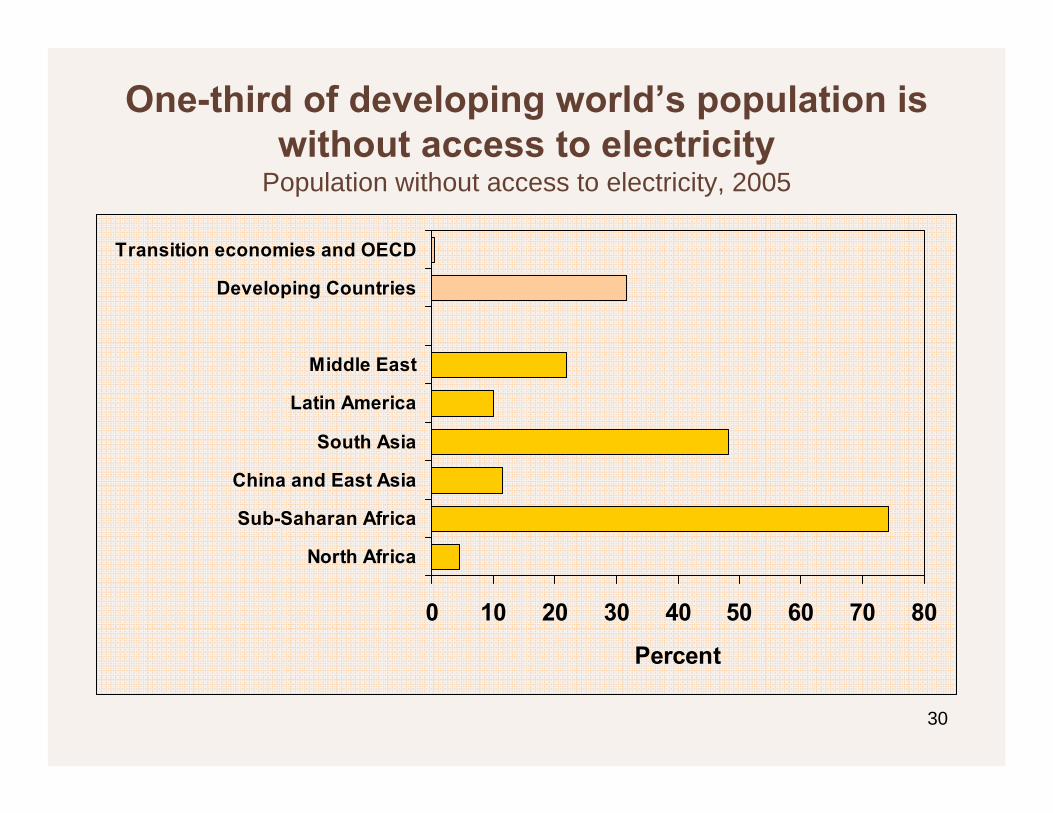
One-third of developing world’s population is without access to electricity
Population without access to electricity, 2005
0 10 20 30 40 50 60 70 80
North Africa
Sub-Saharan Africa
China and East Asia
South Asia
Latin America
Middle East
Developing Countries
Transition economies and OECD
Percent

31
Sources of Greenhouse Gas EmissionsBoth Brown and Green Issues

32
Global Environmental Sustainability-One Size Does Not Fit All
Sub-soil resource rich countries (e.g. Mozambique)Invest resource rents, improve governance
Rapidly urbanizing countries (e.g. Vietnam) Manage pollution from transport and industry
Agriculture-dependent countries (e.g. Ethiopia)Manage land and water resources, diversify assets
Biodiversity rich countries (e.g. Peru) – Conserve natural areas, tap global finance for conservation, develop ecotourism
High child mortality countries (e.g. Mali)Provide water and sanitation, improve access to electricity
Countries in transition (e.g. Ukraine) Increase energy efficiency and control pollution
High deforestation countries (e.g. Brazil) – Eliminate perverse incentives, improve governance
Increasing water scarcity (e.g. MNA)Increase water use efficiency, define water use rights
Rapidly growing countries (e.g. China, India) Reduce carbon intensity of growth
High income countriesProvide global public goods – e.g. Kyoto and beyond

33
Common but differentiated responsibilities across countries
Carbon intensity of GDP must be reduced by:•pricing / trading carbon•development and diffusion of cleaner, energy efficient technologies•development of renewable energy•financing and technology transfer•reducing deforestation using carbon finance
For developing countries, best way to adapt is to develop, which will:•diversify economies •reduce climate-sensitive diseases: malaria, malnutrition and diarrhea •provide the resources to adapt
Programs to reduce vulnerability and “climate proof” investments
Implementing early warning systems for heat waves, floods, droughts
Building dams to accommodate increased runoff
Climate Change Priorities
Mitigation Adaptation

34
Countries’ absorptive capacity rising, but aid fallingDAC members’ net ODA flows

35
Donor performance varies widelyDAC members’ ODA

36
Time to deliver on aid commitments is nowMost of the promised increase in aid has not yet materialized
*Based on commitments made at Gleneagles and other donor commitments in 2005
0
30
60
90
120
150
All DAC donors G7 donors All DAC donors G7 donors
2004 2007 2010 target*
2004 US$ billions
Total Net ODA Net ODA to SSA

37
Doha remains crucialSupport to agriculture has not been declining
Gross subsidy equivalents of assistance to farmers, 1960-2004

38
Increase aid for trade—to promote inclusiveness in exploitation of trade opportunities
Aid for trade, average 2002-06

39
Trade policy should facilitate transfer of environmentally friendly technologies
Environmental goods currently confront significant trade restrictiveness
Trade Restrictiveness Index (%)

40
MDBs had record disbursements in 2007Even as their relative financing role declines, international financial institutions’ impact through leverage remains key
MDBs’ gross disbursements by type of flow and region, 2000-07

41
Extra Slides

42
Depletion of natural resources: it’s not just oil
Annual deforestation (2000-2005) Freshwater availability (trends and projections)

43
Monitoring environmental policies and institutions
Progress in institutional and policy performance has been uneven across
regions (CPIA environment scores)
CPIA disaggregated scores show that there is a gap between policy formulation and
capacity to enforce

44
Climate change impacts on agriculture
Impact of baseline global warming on agriculture (by 2080)
-40-30-20-10
010203040
MWI ZAR TZA NER GNB USA NOR CHE DNK NLD
% c
hang
e in
out
put
Countries with lowest GDP Countries with highest GDP

45
Comparison of emissions for Annex I and Non-Annex I countries
Annex I: Developed countries Non-Annex I: Developing countries Source: CAIT Version 5.0 (World Resources Institute, 2008)
46
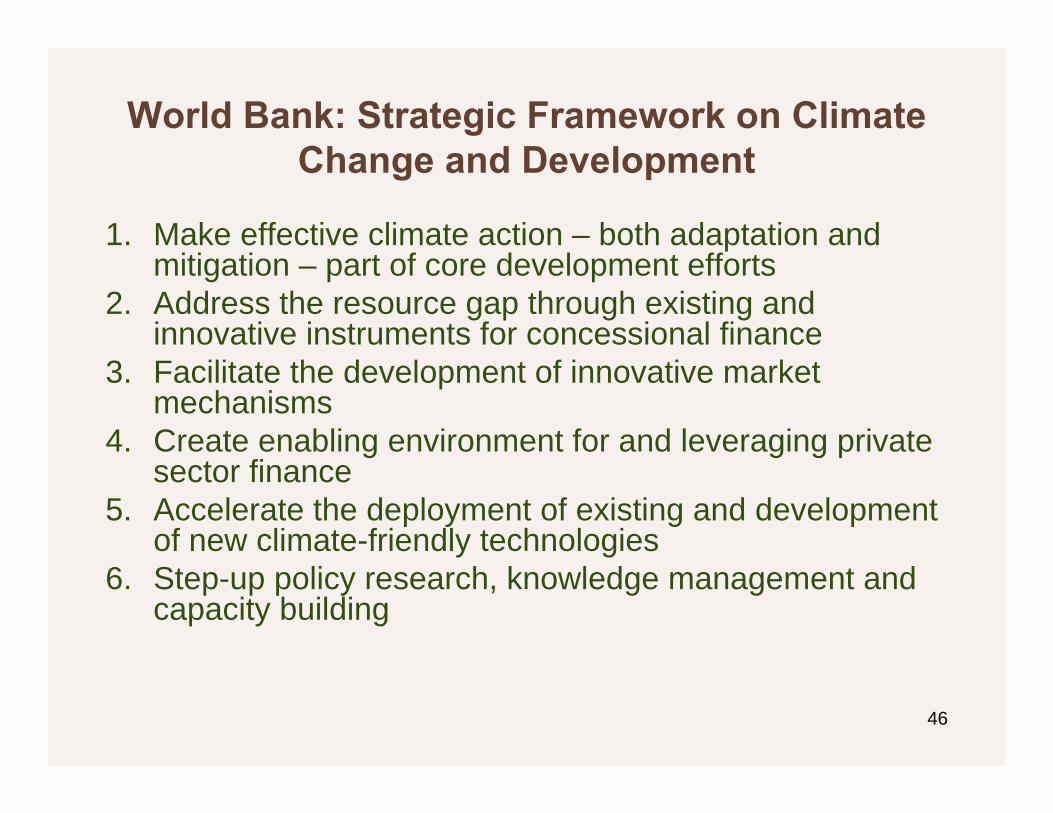
World Bank: Strategic Framework on Climate Change and Development
1. Make effective climate action – both adaptation and mitigation – part of core development efforts
2. Address the resource gap through existing and innovative instruments for concessional finance
3. Facilitate the development of innovative market mechanisms
4. Create enabling environment for and leveraging private sector finance
5. Accelerate the deployment of existing and development of new climate-friendly technologies
6. Step-up policy research, knowledge management and capacity building