global market analysis of microreactors
TRANSCRIPT

INL/EXT-21-63214
Global Market Analysis of
Microreactors
June 2021
DOE Microreactor Program
David Shropshire
Nuclear Science & Technology, Idaho National Laboratory
Geoffrey Black
Boise State University
Kathleen Araújo
CAES Energy Policy Institute, Boise State University

DISCLAIMER
This information was prepared as an account of work sponsored by an
agency of the U.S. Government. Neither the U.S. Government nor any
agency thereof, nor any of their employees, makes any warranty, expressed
or implied, or assumes any legal liability or responsibility for the accuracy,
completeness, or usefulness, of any information, apparatus, product, or
process disclosed, or represents that its use would not infringe privately
owned rights. References herein to any specific commercial product,
process, or service by trade name, trade mark, manufacturer, or otherwise,
does not necessarily constitute or imply its endorsement, recommendation,
or favoring by the U.S. Government or any agency thereof. The views and
opinions of authors expressed herein do not necessarily state or reflect
those of the U.S. Government or any agency thereof.

INL/EXT-21-63214
Global Market Analysis of Microreactors
DOE Microreactor Program
David Shropshire Nuclear Science & Technology, Idaho National Laboratory
Geoffrey Black Boise State University
Kathleen Araújo CAES Energy Policy Institute, Boise State University
June 2021
Idaho National Laboratory Nuclear Science & Technology
Idaho Falls, Idaho 83415
http://www.inl.gov
Prepared for the U.S. Department of Energy Office of Nuclear Energy
Under DOE Idaho Operations Office Contract DE-AC07-05ID14517

Page intentionally left blank

ABSTRACT
Microreactors are smaller and simplified versions of nuclear power plants using
current generation and advanced nuclear technology designs. The purpose of this
report is to assesses the unique capabilities of microreactors and assess potential
deployment in specific global markets in the 2030-2050 timeframe, with
consideration for regulatory limits. The methods include developing unique
microreactor deployment indicators and matching use cases to define future
profile markets. Top-down and bottom-up analysis techniques were used to
evaluate emerging market trends, derive a range of possible demands, and rank
potential markets in 63 countries including current nuclear users and newcomer
countries. Deployment is considered from regulatory and planning perspectives.
Results indicate significant potential for global deployment of microreactors, but
also significant challenges in achieving the technical capacities, meeting
regulatory requirements and international accords, achieving competitive costs,
and for gaining public acceptance. Profile microreactor markets were identified
that include isolated operations, distributed energy, resilient urban applications,
marine propulsion, and disaster relief. Market demands could be strong in
Western Europe and possibly even the U.S., but particularly strong across Asia
and Eastern Europe in isolated operations and distributed energy applications.
Build rates in the hundreds of units by 2040 and thousands by 2050 would be
needed to attain market penetration at scale.

Page intentionally left blank

SUMMARY
Following the trend set by small modular reactors toward smaller, simpler, more
versatile, and less costly power sources, microreactors are the latest nuclear
technology. This technology is also fundamentally different from large nuclear
plants in terms of the types of markets it may serve. Rather than powering the
backbone of large transmission systems to distant markets, microreactors are
designed to serve local users that are remote or need isolation, are energy
constrained, or are confined to markets traditionally served by fossil sources.
This report focuses on future, global microreactor markets and their potential for
replacing fossil sources and for complementing variable renewable technologies
(solar and wind) in distributed systems, with regulatory aspects noted.
Microreactor design characteristics are compared to the performance needs of
different market sectors (i.e., flexibility requirements for integrating with
renewables, thermal outputs needed to support process heat applications,
modularity, and capacity for transport [shipping by land and sea]). Market
deployment indicators that were originally developed for small modular reactor
markets are adapted for microreactors to identify potential localized markets.
These include markets with energy price premiums, poor electricity
infrastructure, little space for large energy systems, acute climate sensitivity, high
risks of energy disruptions, little domestic energy resources, high dependency on
energy imports, as well as others.
Studies of potential applications for microreactors in Alaska, Puerto Rico, and
U.S. federal facilities were conducted under the U.S. Department of Energy
(DOE) Microreactor Program during 2019–2021. Key results from these studies
conducted by the University of Alaska Anchorage, University of Wisconsin-
Madison and the Nuclear Alternative Project are provided in this report. Further
analysis of these and additional markets are provided by the Idaho National
Laboratory, Boise State University, and the Energy Policy Institute, the policy
arm of the Center for Advanced Energy Studies.
This report provides a top-down analysis of emerging trends in global energy
markets and projections for Generation III/III+ reactors and advanced nuclear
technology including a range of possible demands for microreactors in 2030–
2050. A bottom-up analysis is also provided, analyzing 63 countries currently
using nuclear power or indicating interest in developing a nuclear program. A
framework for analyzing country market sectors for microreactors is presented
along with summaries ranking prospective markets and their geographical
distribution.

For microreactors to capture new market shares, some significant challenges
must be overcome, and a balance achieved between market demands, technology
performance, costs, regulatory compliance, and public acceptance. The U.S.
Department of Energy Microreactor Program can evaluate or highlight trade-offs
to facilitate effective microreactor deployment.
A clean energy transition is underway in global energy markets. Microreactors
may serve as a valuable technology to address market gaps where other sources
are either unavailable or lack the capacity to satisfy needs for clean, reliable, and
affordable, localized sources of electricity and heat.

Page intentionally left blank

ACKNOWLEDGEMENTS
The authors want to recognize participants from the Emerging Energy
Market Analysis ‘ ’ Initiative for their help in formulating the concept of
“Profile Markets” and foresight on embedded energy systems from Steve
Aumeier. We appreciate feedback provided by the University of Wisconsin-
Madison (Tom Palmieri, Michael Corradini, and Paul Wilson), University of
Alaska – Anchorage (Richelle Johnson) and the Nuclear Alternative Project
(Eddie Guerra). We appreciate the reviews and thoughtful comments provided by
Dawn Scates, Abdalla Abou Jaoude, Andrew Foss, Jason Hansen, George
Griffith, Steve Aumeier, and editing support from Rebecca Ritter. We also wish
to thank Boise State University School of Economics Graduate Assistant Carson
Kidwell for his research and technical assistance in data collection and decile
analysis.

Page intentionally left blank

CONTENTS
ABSTRACT .................................................................................................................................................. 1
SUMMARY .................................................................................................................................................. 1
ACKNOWLEDGEMENTS .......................................................................................................................... 1
ACRONYMS ................................................................................................................................................ 7
1. INTRODUCTION ............................................................................................................................... 1
1.1 Idaho National Laboratory ....................................................................................................... 1
1.2 University of Wisconsin–Madison ........................................................................................... 1
1.3 University of Alaska Anchorage .............................................................................................. 2
1.4 Nuclear Alternative Project ...................................................................................................... 3
2. MICROREACTOR TECHNOLOGIES .............................................................................................. 3
2.1 Microreactor Concepts ............................................................................................................. 4
2.2 Microreactor Types and Design Parameters ............................................................................ 6
2.3 Microreactor Deployment Timeline (Notional) ....................................................................... 7
2.4 Microreactor Costs ................................................................................................................... 8
3. METHODOLOGY AND DECISION ANALYSIS PROCESS ....................................................... 11
3.1 Previous Approaches for Deployment Assessment ............................................................... 11
3.2 Initial Top-Down Approaches to Deployment Assessment ................................................... 11
3.3 Top-Down Assessments and Methodologies Used for This Report ...................................... 13
3.4 Initial Bottom-Up Approaches to SMR Deployment Assessment ......................................... 15
3.5 Bottom-Up Assessment Methodologies ................................................................................. 17
3.6 Microreactor Global Market Assessment ............................................................................... 18
4. DEVELOPMENT OF DEPLOYMENT INDICATORS FOR MICROREACTORS ...................... 18
4.1 National Energy Demand ....................................................................................................... 20
4.2 Microreactor Energy Demand ................................................................................................ 20
4.3 Financial and Economic Sufficiency ..................................................................................... 21
4.4 Physical Infrastructure Sufficiency ........................................................................................ 21
4.5 Climate Change Motivation ................................................................................................... 22
4.6 Energy Supply Surety Motivation .......................................................................................... 22
4.7 Using Microreactor Deployment Indicators for Market Assessment ..................................... 23
5. DEVELOPMENT OF DEPLOYMENT INDICATORS APPLIED TO USE CASES .................... 23
5.1 Use Cases for Microreactor Deployment ............................................................................... 25
5.2 Use Cases for Microreactor Deployment ............................................................................... 26
5.2.1 Use Case: Small Rural Community .......................................................................... 29

5.2.2 Use Case: Rural Hub Community ............................................................................. 30
5.2.3 Use Case: Regional Utility (Railbelt) Energy Producer............................................ 30
5.2.4 Use Case: Remote Mining Operations ...................................................................... 31
5.2.5 Use Case: Military Installations ................................................................................ 32
5.2.6 Use Case: Islands ...................................................................................................... 32
5.2.7 Use Case: Government Facility ................................................................................ 33
5.2.8 Use Case: University Campus ................................................................................... 34
5.2.9 Use Case: Resilient Urban Applications ................................................................... 34
5.2.10 Use Case: Disaster Relief .......................................................................................... 35
5.2.11 Use Case: Marine Propulsion .................................................................................... 35
5.3 Assessment of Use Cases ....................................................................................................... 37
5.3.1 Indicator Data Sources and Ranking ......................................................................... 38
5.3.2 Assessment of Use Cases .......................................................................................... 41
6. MICROREACTOR GLOBAL PROFILE MARKETS ..................................................................... 42
6.1 Defining New Microreactor Profile Markets ......................................................................... 42
6.1.1 Isolated Operation Profile Markets ........................................................................... 43
6.1.2 Distributed Energy Profile Markets .......................................................................... 45
6.1.3 Resilient Urban Profile Markets ............................................................................... 49
6.1.4 Disaster Relief Profile Markets ................................................................................. 53
6.1.5 Marine Propulsion Profile Markets ........................................................................... 54
6.2 Mapping Use Cases to Global Profile Markets ...................................................................... 55
6.2.1 Isolated Operations Global Profile Market ............................................................... 55
6.2.2 Distributed Energy Global Profile Market ................................................................ 56
6.2.3 Resilient Urban Global Profile Market ..................................................................... 58
6.2.4 Disaster Relief Global Profile Market....................................................................... 59
6.2.5 Marine Propulsion Global Profile Market ................................................................. 60
7. GLOBAL ENERGY MARKET ASSESSMENT ............................................................................. 61
7.1 Top-Down Assessment .......................................................................................................... 61
7.1.1 Advanced Reactor Development and Market Conditions ......................................... 61
7.1.2 Microreactors Are a Unique Subset of SMRs ........................................................... 63
7.1.3 Advanced Nuclear Can Fill Low-carbon Gaps in Achieving 2050 Climate
Goals ......................................................................................................................... 64
7.1.4 Integration of Advanced Nuclear in Low-Carbon Energy Systems .......................... 67
7.1.5 Electricity Market Shifts Toward Distributed Energy .............................................. 68
7.1.6 Role for Advanced Nuclear in Distributed Electricity Markets ................................ 69
7.1.7 Global Nuclear New Builds in Different Markets .................................................... 70
7.1.8 Projected Capacities of Microreactors in Electricity Markets .................................. 72
7.1.9 Microreactor Cost Competitiveness and Electricity Market Shares ......................... 74
7.1.10 Additional Microreactor Market Opportunities. ....................................................... 74
7.2 Bottom-Up Assessment .......................................................................................................... 75

7.2.1 Assessments of Global Profile Markets .................................................................... 76
7.2.2 Isolated Operations Global Profile Markets .............................................................. 77
7.2.3 Distributed Energy Global Profile Markets .............................................................. 79
7.2.4 Resilient Urban Global Profile Markets .................................................................... 80
7.2.5 Disaster Relief Global Profile Markets ..................................................................... 81
7.2.6 Marine Propulsion Global Profile Markets ............................................................... 82
7.2.7 Market Analysis for IAEA Global Regions .............................................................. 84
7.3 Integration of Top-Down and Bottom-Up Analysis .............................................................. 85
8. REGULATORY AND PLANNING CONSIDERATIONS ............................................................. 87
8.1 Regulatory Considerations ..................................................................................................... 87
8.1.1 Licensing and Certification in the U.S. ..................................................................... 87
8.1.2 Diverse Regulatory Considerations........................................................................... 88
8.1.3 Additional Planning Considerations ......................................................................... 90
9. SUMMARY AND CONCLUSIONS ................................................................................................ 91
10. REFERENCES .................................................................................................................................. 92
Appendix A Benchmarking Deployment Indicators ................................................................................ 100
Appendix B Value Elements .................................................................................................................... 104
Appendix C Indicators and Data Sources ................................................................................................ 105
Appendix D Smart Grids ......................................................................................................................... 111
Appendix E System Inertia ...................................................................................................................... 112
Appendix F Factory Production Learning Basis ...................................................................................... 113
Appendix G Global Profile Markets Scoring for All Nuclear Power Countries and Emerging
Nuclear Countries ........................................................................................................................... 114
FIGURES
Figure 1. Microreactor cost competitiveness (NEI 2019a). .......................................................................... 9
Figure 2. Microreactor LCOE for Design A’ across different electricity markets (Abou-Jaoude
2021). .......................................................................................................................................... 10
Figure 3. Nuclear capacity projections by GWe. ........................................................................................ 14
Figure 4. Nuclear capacity projections by TW-h. ....................................................................................... 14
Figure 5. Nuclear Ship Savannah, the first commercial nuclear-powered cargo vessel (Wikipedia). ........ 37
Figure 6. Number of microgrids and MW capacity in China, Australia, and sub-Saharan Africa
(BloombergNEF 2021). .............................................................................................................. 48
Figure 7. Global locations of water stress (WRI). ...................................................................................... 52
Figure 8. Nuclear capacity projections. ...................................................................................................... 62
Figure 9. Global nuclear market size projection, 2020–2050 (UxC 2020). ................................................ 63

Figure 10. Solar PV and wind power capacity additions (IAEA WEO 2020, Stated Policies
Scenario). .................................................................................................................................... 65
Figure 11. Power capacity in India by source (IAEA WEO 2020, Stated Policies Scenario). ................... 66
Figure 12. Market remuneration for wind and solar as a function of share in the energy mix (NEA
2019). .......................................................................................................................................... 66
Figure 13. Total nuclear new build additions. ............................................................................................ 68
Figure 14. European scale of generation in 2020 and 2030. (BloombergNEF 2021). ................................ 69
Figure 15. Distributed total market projections for all nuclear power. ....................................................... 70
Figure 16. Low projection of global new builds (IAEA 2020b). ................................................................ 71
Figure 17. High projection of global new builds (IPCC modified case). .................................................... 72
Figure 18. Microreactor top-down global projection (GWe capacity). ....................................................... 73
Figure 19. Microreactor top-down global projection (# of 10 MWe microreactors). ................................. 73
Figure 20. Global LCOE’s in selected countries (Statista 2021). ............................................................... 75
Figure 21. Global regional nuclear capacity additions (IAEA 2020). ........................................................ 85
Figure 22. Global regional nuclear capacity additions (IAEA 2020). ........................................................ 85
Figure 23. Global regional comparative profile market scores 1 of 2 (INL 2021). .................................... 86
Figure 24. Global regional comparative profile market scores 2 of 2 (INL 2021). .................................... 86
Figure D-1. Length of new and replaced electricity network lines by selected region, 2019–2030
(IEA 2020). ............................................................................................................................... 111
Figure E-1. Share of inverter-based capacity Source: BloombergNEF (2020a). ...................................... 112
Figure F-1. Cost Declines in PV solar systems (NREL 2021). ................................................................. 113
TABLES
Table 1. Examples of microreactor design parameters. ................................................................................ 6
Table 2. Nuclear power projections. ........................................................................................................... 13
Table 3. SMR categories and indicators. .................................................................................................... 16
Table 4. Adapted microreactor deployment indicators. .............................................................................. 19
Table 5. Microreactor deployment indicators translated to design characteristics. .................................... 24
Table 6. Nuclear power countries and emerging nuclear energy countries. ............................................... 26
Table 7. Microreactor deployment indicators applied to use cases............................................................. 27
Table 8. Microreactor deployment indicators applied to use additional use cases. .................................... 28
Table 9. Use cases combined into profile markets. ..................................................................................... 42
Table 10. ESMAP data on installed mini-grid projects, by region. (ESMAP 2019) .................................. 47
Table 11. Isolated operations profile market: use cases and indicators. ..................................................... 55
Table 12. Distributed energy profile market: use cases and indicators. ...................................................... 56

Table 13. Resilient urban profile market: use cases and indicators. ........................................................... 58
Table 14. Disaster relief profile market: use case and indicator ................................................................. 59
Table 15. Marine propulsion profile market: use case and indicators ........................................................ 60
Table 16. Global electricity generation of 1.5C pathways median case (IPCC 2018). ............................... 67
Table 17. Modified IPCC 1.5C pathways, enhanced nuclear. .................................................................... 67
Table 18. Capacity shares of nuclear technologies in transmission and distributed markets. .................... 70
Table 19. LCOE targets in selected profile markets. .................................................................................. 74
Table 20. Highest ranked countries for isolated operations profile markets. .............................................. 78
Table 21. Highest ranked countries for distributed energy profile markets. ............................................... 79
Table 22. Highest ranked countries for resilient urban profile markets. ..................................................... 80
Table 23. Highest ranked countries for disaster relief profile markets. ...................................................... 81
Table 24. Highest ranked countries for marine propulsion profile markets. ............................................... 82
Table 25. United Nations geographic regions and associated countries. .................................................... 84
Table 26. United Nations geographic regions and associated countries. .................................................... 84
Table G1. Ranking of all countries for isolated operations profile markets. ............................................ 114
Table G2. Ranking of all countries for distributed energy profile markets. ............................................. 115
Table G3. Ranking of all countries for resilient urban profile markets. ................................................... 117
Table G4. Ranking of all countries for disaster relief profile markets. ..................................................... 119
Table G5. Ranking of all countries for marine propulsion profile markets. ............................................. 120

Page intentionally left blank

ACRONYMS
AC Alternating current
AHP Analytic Hierarchy Process
ARDP Advanced Reactor Demonstration Program
ARIS Advanced Reactor Information Systems
ARPA-E Advanced Research Projects Agency-Energy
CAES Center for Advanced Energy Studies
CHP Combined heat and power
CNSC Canadian Nuclear Safety Commission
DER Distributed energy resources
DESA Department of Economic and Social Affairs
DOC Department of Commerce
DoD Department of Defense
DOE Department of Energy
EIA Energy Information Administration
EII Energy Intensive Industries
EPI Energy Policy Institute at Boise State University
EPRI Electric Power Research Institute
EPZ Emergency planning zone
ESMAP Energy Sector Management Assistance Program
EU European Union
EV Electric vehicles
FB Fission batteries
FDI Foreign direct investment
FOAK First-of-a-kind
GAIN Gateway for Accelerated Innovation in Nuclear
GCR Gas-cooled reactors
GDP Gross domestic product
GNI Gross national income
GRPEC Growth Rates of Primary Energy Consumption
HALEU High-Assay Low-Enriched Uranium
IAEA International Atomic Energy Agency
IEA International Energy Agency
INL Idaho National Laboratory

IPCC Intergovernmental Panel on Climate Change
LAE Limited Access to Energy
LCOE Levelized cost of electricity
LEGP Local Economic Growth Potential
LEII Local Energy Intensive Industries
LWR Light-water reactors
MCDA Multi-criteria decision analysis
MFR Metal-cooled fast reactors
MIT Massachusetts Institute of Technology
MSNB Micro-Scale Nuclear Battery
MMR Micro-modular reactors
MNPP Mobile nuclear power plants
MOC Memorandum of collaboration
MSR Molten salt reactors
MWe Megawatt - Electric
NAP Nuclear Alternative Project
NDAA National Defense Authorization Act
NDC Nationally Determined Contributions
NEA Nuclear Energy Agency
NEI Nuclear Energy Institute
NB Nuclear Battery
NPP Nuclear power plants
NRC Nuclear Regulatory Commission
NRIC Nuclear Reactor Innovation Center
PG&E Pacific Gas and Electric
PR Puerto Rico
PRIS Power Reactor Information System
R&D Research and development
ROC Remote operating centers
SA&I Systems Analysis and Integration
SCO Strategic Capabilities Office
SDG Sustainable Development Goal
SMR Small modular reactors
TM Technical Meeting
TRISO TRi-structural ISOtropic

UAA University of Alaska Anchorage
UN United Nations
USG United States Government
USGS United States Geological Survey
UW–Madison University of Wisconsin–Madison
VRE Variable renewable energy
vSMR Very Small Modular Reactor
WEF World Economic Forum
WNA World Nuclear Association
WRI World Resources Institute

Page intentionally left blank

1
1. INTRODUCTION
This report’s purpose to summarize work performed on the economics and market opportunities for
microreactors conducted under the U.S. Department of Energy (DOE) Microreactor Program and describe
the global market potential for microreactors, with regulatory considerations. Individual projects are
briefly detailed in this section, while the specific research elements are referenced throughout the report.
The anticipated outcome from these studies is to provide information on deployment potential that the
Idaho National Laboratory (INL), DOE, and microreactor developers can use to inform research and
development opportunities. Research is used to identify likely profile markets and customer segments as
well as value propositions, economic development aspects, and social and regulatory considerations
related to the technology.
1.1 Idaho National Laboratory
The primary objective of INL’s work was to increase the understanding of the markets and economic
potential for microreactors in the U.S. and internationally, focusing on deployment in remote areas, Arctic
regions, islands, and at U.S. federal facilities, as well as regulatory and planning aspects. Economic
performance and market analysis provide a techno-economic basis for support to industrial microreactor
deployment and operation. The activities leveraged economic tools and methodologies of the
International Atomic Energy Agency (IAEA) and other organizations to enable a consistent approach for
microreactor analysis with previous studies on small modular reactors (SMR).
INL was the technical point of contact for related work conducted through subcontracts with the
University of Alaska Anchorage (UAA), University of Wisconsin–Madison (UW–Madison), and the
Nuclear Alternative Project (NAP) study of nuclear energy in Puerto Rico. The work was coordinated
with other market and economic activities being performed in the Microreactor Program.
Specific Activities:
• Perform research on the global market potential for microreactors by extending previous work on
deployment indicators for SMRs to microreactors. Results were submitted for peer journal review in
collaboration with Boise State University, the Center for Advanced Energy Studies’ Energy Policy
Institute (CAES EPI) and researchers at the IAEA.
• Develop information on global market opportunities for microreactors and contribute information to
the 2nd Edition of the Handbook of Small Modular Reactors, edited by Ingersoll and Carelli
(Elsevier/Woodhead Publishing 2021).
• Perform a global market assessment for microreactors, as provided in this report.
This final report on Global Market Analysis of Microreactors integrates all the Microreactor Program
economics and market studies to date and aims to fill gaps, including regulatory aspects. Integrating this
analysis of the markets for microreactors outlines the market’s magnitude, evaluates different regions and
sectors (civilian, remote, island, and federal), and includes the studies by the INL, UAA, UW–Madison,
and NAP. This combined research provides information and details to characterize the existing potential.
The target audience includes DOE and microreactor developers, among others, to inform research and
development (R&D) opportunities.
1.2 University of Wisconsin–Madison
The primary objective of the UW–Madison contribution was to define the potential role for
microreactors at U.S. Government (USG) installations, for sites that are off-grid or remote applications
(i.e., the need for secure stand-alone power) and on-grid (i.e., the need for secure backup power). The
research spanned three fiscal years (FY-19, FY-20, and FY-21) through a subcontract with INL (Palmieri
et al. 2021).

2
Work consisted of two major parts: 1) short-term input to a report to congress required by the 2019
National Defense Authorization Act (NDAA) (NDAA 2019); and 2) a longer-term study to provide a
thorough analysis of microreactors. The input to the NDAA report was completed in FY-19. The
remaining research involved longer term analysis of the potential role for microreactors at USG
installations for sites that are off-grid and on-grid.
Specific activities:
• Identify the aggregate needs of these installations and determine the size distribution of the generators
currently powering those sites.
• Investigate the economics of those several choices.
• Note the special needs that may constrain the options available at a particular installation.
• Determine which sites may be candidates for micro-scale nuclear plants. Results from the study are
also expected to provide insights to the potential use of micro-scale reactors for supplying off-grid
power to federal entities.
Several interim draft reports, prepared under the INL contract, were integrated into a final UW–
Madison deliverable report “Analysis of the Case for Federal Support of Micro-Scale Nuclear Reactors to
Provide Secure Power at U.S. Government Installations.” UW–Madison research suggests microreactors
should be developed to achieve target costs ($4,000/kWe) to moderate the cost of low-carbon deployment
for on-grid federal facilities (Palmieri et al. 2021).
1.3 University of Alaska Anchorage
The primary objective of the UAA Business Enterprise Institute Center for Economic Development’s
contribution was to identify markets, applications, and economic development potential for nuclear-
powered microreactors in Alaska and the Arctic and export potential for remote locations around the
world. The research was completed in FY-20 through a subcontract with INL.
The work consisted of evaluating stakeholder and market awareness, customer discovery interviews,
and use case analysis. Research included the assessment of the potential motivations for adopting (or not
adopting) the microreactors, such as price, ease of maintenance, fossil fuel reduction, or other factors.
UAA used primary and secondary data, interviews, and the techniques of customer discovery to address a
series of research questions connected to this purpose.
Specific activities:
• Conduct surveys, interviews, and listening sessions to gauge the extent of potential concerns about
nuclear microreactors. These activities contributed to the customer discovery and use cases.
• Perform customer discovery interviews to identify customers and value propositions to identify the
market fit between microreactors and potential customer segments including defense installations,
remote mines, Railbelt energy producers, rural hub communities, and small rural communities.
Customer discovery and perception was summarized in the UAA (2020a) report.
• Identify likely use cases and describe the value propositions to the user (e.g., income, employment,
and tax revenues) while assessing the enabling factors or barriers to adoption including infrastructure,
workforce, regulatory factors, capital availability, public perceptions, or others. The use case analysis
was prepared in six UAA reports and executive summary (UAA 2020b).
The UAA reports including the summary reports “Use Case Analysis” and “Customer Discovery and
Perception” were prepared under an INL contract. UAA research suggests awareness of nuclear’s risks
and benefits in consideration of historical perspectives, especially in rural Alaska, could ultimately affect
a project’s success. The topic of nuclear energy is not a new one in Alaska and has, at times, received
pushback from rural communities. A key finding is that a successful microreactor technology

3
demonstration (at an external location) could be an important step towards establishing comfort with the
technology in rural areas (UAA 2020a and UAA 2020b).
1.4 Nuclear Alternative Project
The primary objective of the NAP was to 1) understand the market conditions for SMRs and
microreactors for Puerto Rico, 2) evaluate the public, leadership, and local stakeholder sentiment towards
SMRs and microreactors, and 3) provide responses to open questions presented in Puerto Rico House
Resolution 1189. The work was completed in FY-20 under an INL contract with NAP, which provided a
clear basis for outlining their prior work, current relationships, and expertise necessary to meet an
accelerated evaluation schedule in early 2020.
The NAP work consisted of developing a preliminary study for small modular reactors (SMRs) and
microreactors for use in Puerto Rico. Puerto Rico represents a strong potential use case for microreactor
concepts to provide resilient power for island territories, states, and nations. The study also provided
information to the Puerto Rico legislature (PR House Resolution 1189) on evaluating SMRs and
microreactors for use in their territory.
Specific activities:
• Assessing energy needs in Puerto Rico
• Assessing SMR and microreactor technology and special applications for use in Puerto Rico
• Assessing legal and regulatory framework for SMR and microreactor deployment in Puerto Rico
• Documenting the financing methods and assessing operation and ownership of SMRs and
microreactors in Puerto Rico
• Assessing electricity infrastructure and generation assets
• Documenting public and political sentiment on nuclear energy in Puerto Rico.
The final report including sections for each activity above was delivered under the INL contract in the
final NAP deliverable report, Report No. 20-0001 Rev 0 “Preliminary Feasibility Study for Small
Modular Reactors and Microreactors for Puerto Rico.” A project completion meeting was also held in San
Juan, Puerto Rico to communicate the study’s results to interested parties and stakeholders. The NAP
study concluded Puerto Rico represents a feasible market for SMRs and microreactors and recommended
steps for the near term (NAP 2020).
2. MICROREACTOR TECHNOLOGIES
The U.S. Department of Defense (DoD) has been interested in the use of small nuclear reactors for
decades. The U.S. Army examined potentially using mobile nuclear power plants (MNPPs) with very
small modular reactor (vSMR) technology for mobile operations back in the 1960s to provide mobile
power for field forces. In 1963, the nuclear power energy depot concept included using these reactors for
synthetic fuel manufacturing during field operations for military vehicles and subsequently led to building
a series of eight reactors for testing, training, and proof-of-concept purposes (Vitali 2018). The reactors
have also been examined in the past for non-military uses, such as in remote locations in Alaska (UAA
2011). A DoD study in 2011 concluded reactors sized <300 MWe have potential to contribute to DoD
missions; however, many reactor concepts were larger than needed (King 2011). Since that time,
microreactor designs have emerged <20 MWe that are better aligned to provide power and heat for a wide
range of DoD installations (NEI 2019a).
The DoD collaborates with the DOE to develop microreactors’ potential for providing commercial
and defense sectors with clean, reliable, and resilient energy supply technology. The DOE Microreactor
Program performs cross-cutting research and development to achieve technological breakthroughs for key
features of microreactors, empower initial demonstration of the next advanced reactor in the U.S., and

4
enable successful demonstrations of multiple commercial microreactors. INL is the lead national
laboratory that provides programmatic guidance and technical expertise on microreactor technology
development areas, serves as the site for potential reactor demonstrations, and hosts an extensive nuclear
R&D infrastructure. Additional laboratories participating in the Microreactor Program include Los
Alamos National Laboratory, Oak Ridge National Laboratory, Argonne National Laboratory, and Pacific
Northwest National Laboratory. This report is prepared under the system integration and analysis work
element including techno-economic analysis and market assessment of microreactors and microreactor-
specific regulatory and technical challenges. Industry engagement and outreach for the program is
provided through the Gateway for Accelerated Innovation in Nuclear (GAIN) that hosts periodic
Microreactor Program virtual workshops.a
Initial deployment of microreactors is also under evaluation by DOE’s Advanced Research Projects
Agency-Energy (ARPA-E) which focuses on high-potential, high-impact energy technologies that are too
early for private sector investment. The ARPA-E program is examining microreactor technologies, below
10 MWe (WNA 2021).
The U.S. Nuclear Regulatory Commission (NRC) recognizes the uniqueness of microreactors and is
engaged with several reactor developers. The NRC notes “Many of the issues center around the fact that
a) these reactors may be operated remotely and/or semi-autonomously and b) it will be difficult to analyze
risk from new, unique, technologies. Initial thoughts are given on how probabilistic methods could be
used to determine risk and how the current approach for reviewing non-power reactors could be useful for
microreactors” (NRC 2020b).
Internationally, microreactors have gained attention in the past two years. The IAEA held their first
Technical Meeting (TM) on the Status, Design Features, Technology Challenges and Deployment Models
of Microreactors on April 26–29, 2021. More than 50 international participants from the 13 IAEA
member states and two international organizations (OECD Nuclear Energy Agency and European
Commission) participated with presentations and breakout discussions. INL participated in the meeting
and presented an overview of the U.S. DOE Microreactor Program. The TM was directly followed by an
IAEA web seminar: “Spotlight on Nuclear Microreactors: A High-Level Dialogue between IAEA
Director General Grossi and Former U.S. Secretary of Energy Moniz.” During the moderated discussion
by Jeffrey Donovan, IAEA DG Grossi commented microreactors “enlarge the options” for nuclear power.
Former U.S. Secretary of Energy, Ernest Moniz, commented due to the high-energy density of
microreactors, they could broaden markets particularly for remote applications, industry, and security
facilities. Moniz also mentioned microreactors could be operated on microgrids and support grid
resilience.
2.1 Microreactor Concepts
Microreactors are a subset of SMRs, representing in the smallest capacity range of 1 MWe to
20 MWeb. Microreactors are sometimes also referred to as nuclear batteries (Buongiorno et al. 2021) and
fission batteriesc. Potential benefits from microreactors include planned, enhanced inherent safety
characteristics, smaller footprints significantly reducing source terms, semi-autonomousd and remote-
a For more information visit the GAIN website at: https://gain.inl.gov/SitePages/Workshops.aspx.
b Participants at the April 2021 IAEA TM were surveyed on the power category for microreactors, where the majority preferred
the definition of ‘from less than 1 MWe to 20 MWe from advanced technology lines.’ The IAEA intends to formalize this
definition with IAEA’s Standing Advisory Group on Nuclear Energy (SAGNE) prior to the September 2021 General
Conference.
c Fission batteries are described by INL as having five features: cost competitive, fabricated, installed, unattended, and reliable
(Federal Laboratory Consortium workshop series on technology innovations for fission batteries).
d Autonomous control in microreactors requires sensor and instrumentation technologies for long term, unattended operation,
monitoring of the state of the microreactor system/subsystems, predictive decision making that can assess the condition of

5
control operations reducing staffing needs, high-temperature operation for both electricity and process
heat production, and highly integrated and transportable systems reducing on-site construction times.
Potential applications include competitive electricity and process heat supplies for remote and off-grid
communities and industrial locations, resilient and reliable energy supplies for remote and forward
military bases, fast growing megacities, space and naval applications, and reliable and clean electricity
supplies for disaster and emergency relief operations.
Developers note the microreactors are expected to have characteristics which include:
• Modular and rapid deployment capabilities
• Flexibility and load-following
• Ability to ‘rack and stack’ reactor units to scale up or down in size
• Combined heat and power (CHP) characteristics
• Remote or semi-autonomous operation
• Minimal facility footprint and emergency planning zone (EPZ)
• High-reliability and minimal moving parts
• Inherent safety features
• Low capital overnight costs (compared to larger reactors)
• Three years and longer refueling intervals or no refueling
• Reduced number of moving parts such as mechanical pumps
• Optimized power density (vs. weight) of the reactor system
• Self-contained, minimizing transport of separate auxiliary systems.
Microreactors could potentially provide economic and social value in new markets. They could serve
as a reliable power source that generates no pollution during normal operation, can run for years without
refueling, and reduces reliance on energy imports. In addition, their value proposition can also include
creating new enterprises and services adding economic and social value for communities. For example,
microreactors could help tap resources for economic development (e.g., mining, shipping port, and
regional centers). New applications could be developed to facilitate deploying microreactors through new
community services and capabilities, improving access and reliability of critical utilities (e.g., electricity,
heat, and potable water), creating entrepreneurial opportunities including new small- and medium-sized
enterprises, and ultimately shape public attitudes towards using nuclear energy.
Microreactors are being designed to be transported by road, rail, barge, or air in standard 40-foot long
containers (e.g., CONEX Box), commonly used in commerce. Once sited at a field location, the
microreactor can be connected to a local electricity network (e.g., mini-/micro-grid) and/or heat network.
The technology is conceived in such a way that along with the microreactor container’s shipment
additional containers are also delivered to a site. These additional boxes contain applications customized
to the users’ needs and designed to plug-and-play with the microreactors. Examples include containerized
mobile medical centers, desalination units, hydrogen production units, telecommunication centers (i.e.,
Starlinke), hydroponic food cultivation units, and other applications that would integrate with the
microreactor to provide new products, services, and networks for the community.
the microreactor and determine impacts on components from operational decision, and long-lived hardware that can survive
harsh environments, and cybersecurity to ensure secure operations.
e https://en.wikipedia.org/wiki/Starlink

6
Nuclear developers could work with industry to create new products and services for containerized
applications for microreactors. Modularized applications with standardized capabilities could support
economic production and delivery to diverse markets. Once an application is delivered to the field, further
specialization could be made to meet the local requirements. Industry partners would be motivated to
invest in the microreactor technology since it would inherently link to their supply chain. Like the
relationships personal computer manufacturers have in working closely with software developers,
microreactor developers could work closely with industrial partners to create new business opportunities.
This new paradigm of bundling energy technology with energy application services could expand the
desirability and uses for microreactors and generate the sales needed to justify building factories to
support mass microreactor deployment and increase economic competitiveness. This could be a win-win
for microreactor developers and the communities that use them.
2.2 Microreactor Types and Design Parameters
Microreactor types include light-water reactors (LWRs), molten salt reactors (MSRs), gas-cooled
reactors (GCRs), metal-cooled fast reactors (MFRs), and heat pipe reactors. In addition to more
traditional designs using UO2 fuel and uranium zirconium (UZr) cladding, some microreactors are being
designed with new nuclear fuel and cladding technologies (e.g., TRi-structural ISOtropic [TRISO]
particle fuel, UZr metal alloy fuels, and molybdenum-rhenium [Mo-Re] cladding). Examples of
microreactors from North America are provided in Table 1, and other designs are in development in the
Czech Republic (Energy Well), Japan (MoveluX), Russia (Elena), and in other countries. The UW–
Madison summarized microreactor design parameters in Appendix D of their report (Palmieri et al 2021),
and the Nuclear Alternative Project considered microreactor designs for application in Puerto Rico (NAP
2020). Information on international SMR designs, including some microreactor designs, is available in
IAEA’s Advanced Reactor Information Systems (ARIS) database and publications (IAEA 2020a).
Table 1. Examples of microreactor design parameters.
Name, Design
Organization, and
Country
Reactor
Type
(Coolant)
Electrical Capacity/
Power Conversion/
Moderator
Fuel Type/
Enrichment
Percent
Development Status
(Licensing and Funding)
HOLOS
QUAD/TITAN
(Filippone 2020,
ARPA-E 2020)
(U.S.)
GCR 13–81 MWe Turbo
Jet/Closed loop
Brayton cycle/Four
module
TRISO in solid
monolithic core,
8–10% U235
Conducting non-nuclear
system testing
Recipient of DOE funding for
development, NRC licensing
status unknown
X-Energy XE-
Mobile (X-energy)f
GCR 7.4 MWe, Rankine
cycle
TRISO fuel
19.7% U235
URENCO’S
U- Battery
(Campbell 2020,
WNN 2019)
(Canada/UK)
GCR
(He and
N)
4 MWe, Indirect
Brayton
TRISO fuel, 17–
20% U235
Technical status unknown
Recipient of UK government
funding for development
In pre-license review by
Canada
MicroNuclear LLC
Micro-Scale Nuclear
Battery (MSNB)g
(U.S.)
Heat
Pipe
(FliBe)
10 MWe, molten salt
(Na/K), Brayton cycle,
heat recovery steam
generator
UF4 dissolved in
salt, 20% enriched
Limited additional design
information is available for
public release
f Refers to: Xenergy. https://x-energy.com/reactors/xe-mobile
g Refers to INL GAIN Workshop: https://gain.inl.gov/SiteAssets/Micro-reactorWorkshopPresentations/Presentations/14-
Marotta-MsNBMRWorkshop_June2019.pdf

7
Name, Design
Organization, and
Country
Reactor
Type
(Coolant)
Electrical Capacity/
Power Conversion/
Moderator
Fuel Type/
Enrichment
Percent
Development Status
(Licensing and Funding)
OKLO AURORA
(US NRC 2020a)
(U.S.)
MFR
(Na)
1.5 MWe /Brayton
cycle, CO2 Power
conversion
UZr metal fuel
<20% U235
Licensing application for
construction at INL has been
accepted by the U.S. NRC
HYDROMINE
Nuclear Energy
LFRh, (IAEA 2018)
(TL-X reactor)
(U.S.)
MFR
(Pb)
20 MWe, Fast
Reactor, Rankine, or
Brayton cycle
UO2 or advanced
fuels (nitride,
carbide)
Limited additional design
information is available for
public release
Westinghouse
eVinci Micro
Reactor (U.S.)i
Heat
Pipe
4–5 MWe, metal
hydride moderator,
low pressure heat
pipes, Brayton Cycle
TRISO or other
encapsulated fuel
Conceptual Design, pre-
licensing discussion with U.S.
NRC and Canadian regulator,
Canadian Nuclear Safety
Commission (CNSC)
MMRTM Ultra-Safe
Nuclear Corporation
(Green 2018, SBIR
2020, CNL 2020,
NEI 2019a, PR
2020, Patel 2020,
POWER 2020)
(U.S./Canada)
MSR
(He)
5 MWe, Intermediate
to Rankine cycle
FCM containing
UO2, 9–20%
U235
Recipient of DOE, NASA, and
Canadian Government funding
for development.
Progressing on gaining
commercial investors and
licensing support for
construction at Chalk River
2.3 Microreactor Deployment Timeline (Notional)
The U.S. DOE Microreactor Program is conducting fundamental research and development to reduce
uncertainty and risk in the design and deployment of microreactors and facilitate more efficient
technology commercialization. The research is broadly applicable to multiple reactor cooling/technology
options ensuring concepts can be licensed and deployed to meet specific use requirements. Concurrent
with DOE’s Microreactor Program is the U.S. DoD’s Strategic Capabilities Office (SCO) initiative called
Project Pele j. The DoD program is proceeding with the development of a final design for a 5 MWe
transportable advanced nuclear microreactor prototype. Project Pele is a Generation IV reactor that, once
proven, could provide an entry for commercial adoption of microreactors.
Below is a notional timeline for deploying microreactors in North America that assumes a level of
commitment to these programs by both government and private industry that is on par with other low-
carbon energy technologies, such as wind and solar, also referred to as variable renewable energy (VRE).
• 2020–2030. After successful design development, experimental testing and risk reduction, initial
regulatory approvals may be attained for two to four reactor designs by the mid-to-late 2020s. Supply
chains begin to be established for reactor manufacturing, key components, and specialized fuels with
U235 enrichments up to 20%. Initial commercial deployments may be made in domestic niche
applications to replace diesel generators and imported liquified natural gas. First deployments may be
stationary, electricity only, in applications where costs are less important than resilience and
reliability (industry, military) due to unique niche applications and lack of alternatives. Successful
h Refers to: https://www.hydromineinc.com/
i Refers to Westinghouse eVinci: https://www.westinghousenuclear.com/Portals/0/new%20plants/evincitm/GTO-
0001_eVinci_flysheet_RSB_03-2019_003.pdf?ver=2019-04-04-140824-613
j Refers to: https://www.defense.gov/Newsroom/Releases/Release/Article/2545869/strategic-capabilities-office-selects-two-
mobile-microreactor-concepts-to-proce/

8
operation of the first one or two units may lead to deployments in markets subject to fuel insecurity
and high-energy prices (mining, islands) and on isolated microgrids (100 kWe–20 MWe).
• 2030–2040. Commercial technology deployment may expand as the highest potential microreactors
are proven in the field. Designs are further refined and scaled for factory production, where quality
and cost goals become more aggressive. Entries may begin in the first export markets and in markets
where extra degrees of mobility, transportability, and energy flexibility (electricity, heat) are required.
Later in the 2030s, microreactors begin to be integrated into mini-grids (1 MWe to 100 MWe) along
with variable energy sources and energy storage.
• 2040–2050. In addition to significant expansion and learning in the markets indicated above,
microreactors may be used as embedded energy sources in urban environments to power key assets
and infrastructure, packaged together to step-up power production (e.g., transport vessels), and
optimized as mobile energy systems capable of new missions such as for first response in disaster
relief, space missions (ground operations), etc.
Deploying microreactors within these timeframes will need to be on par with other transformations in
our energy infrastructure (e.g., linked and smart grids), energy efficiency, non-fossil liquid transport fuels
(e.g., hydrogen and ammonia) and maritime propulsion technology required to address climate change
and the emerging energy needs for a planet of nearly 10 billion people by 2050 according to the United
Nations (UN) Department of Economic and Social Affairs (DESA) (2017).
2.4 Microreactor Costs
The Nuclear Energy Institute (NEI) estimates the cost for a first-of-a kind (FOAK) microreactor
between $0.14/kWh and $0.41/kWh based on a two-unit 5 MWe plant. Costs are expected to fall to
$0.09/kWh–$0.33/kWh as the number of reactors deployed increases to 50. The wide range of costs result
from variations in individual reactor technologies, cost variation due to site conditions (transport
accessibility), type or ownership, and ability to reduce future costs through lessons learned. Electricity
costs in remote locations are estimated between $0.15/kWh and $0.60/kWh, where electricity is typically
produced by diesel generators. NEI considered several target markets including remote Arctic
communities and defense installations, islands, remote mining, and the Alaska Railbelt where utilities are
linked by a common electric transmission system. Figure 1 captures the cost projections for microreactors
in these markets (NEI 2019a).

9
Figure 1. Microreactor cost competitiveness (NEI 2019a).
The DOE Nuclear Energy Systems Analysis and Integration (SA&I) Campaign extended the NEI
analysis by leveraging an “Economics-by-Design” approach to produce bottom-up cost estimates for
microreactors. This approach consists of adapting the Gen IV code of accounts and using scaling
algorithms to adapt design elements and their associated costs for microreactors. The procedure was
demonstrated by evaluating the costs of a demonstration microreactor with a heat pipe design (A) and
adapting the design to reduce costs to economically fit markets by creating a hypothetical new design
(A’). Potential design modifications were identified to reduce costs include reactor size, neutron
spectrum, fissile inventory, plant lifetime, refueling interval, reflector, reactor building, instrumentation
and control (I&C), and operations staffing. Costs were further reduced by leveraging economies of
multiples. Figure 2 captures Microreactor A’ levelized cost of electricity (LCOE) based on a 15%
learning rate for most cost components as compared to the cost ranges of various electricity markets
(Abou-Jaoude et al. 2021).

10
Figure 2. Microreactor LCOE for Design A’ across different electricity markets (Abou-Jaoude 2021).
Based on the UAA (2020a) study, the comparative electricity costs for small rural communities in
Alaska were $0.35–$0.60/kWh (average $0.52) or equivalent to $350–$600/MWh (average $520/MWh);
Alaska Rural Hub Communities were $0.17–$0.48/kWh or equivalent to $170–$480/MWh; and the
Alaska Railbelt intertied system costs were $0.20–$0.28/kWh or equivalent to $200–$280/MWh. The
LCOE range used in the NAP (2020) study for using a microreactor in Puerto Rico ranges from
$80/MWh to $210/MWh based on a 25% to 75% capacity factor.
The UW–Madison study (Palmieri et al. 2021) based the microreactor costs of the NEI (2019a) study,
assumed a medium capital cost of $12,000/kWe (range of $10,000/kWe to $20,000/kWe) for the FOAK
demonstration plant as compared to the normalized cost of $34,715/kWe in the SA&I report.
The SA&I study as well as the studies performed under the Microreactor Program suggest the initial
units would be competitive in remote markets as a replacement to expensive diesel fuels. The learning
curve assumptions suggest additional markets could become economically viable for microreactors with
sufficient cost reduction as the number of units are deployed for a specific microreactor design. It should
be noted if multiple dissimilar microreactor designs reach the market around the same time, then a
decreased market share would be apportioned to each thus reducing the potential cost reductions due to
lower build rates. However, if the microreactors can share some key components (e.g., fuels), then the
higher manufacturing rates can benefit both designs.
For microreactors, competitive costs are a necessary but insufficient measure for potential success.
Additional value elements are important to factor and to determine what is important in specific markets.
Further discussion on these value elements is covered in Section 6.1 and Appendix B.

11
3. METHODOLOGY AND DECISION ANALYSIS PROCESS
The methodology and analysis process in this report builds upon the work done by INL’s
Microreactor Program as well as previous work on SMRs. As with microreactors, SMRs are significantly
smaller than large, utility-size nuclear power plants (NPPs). Microreactors and SMRs share some features
that are important to determining their global deployment potential, including their smaller size, advanced
technology, reduced componentry, reduced financing requirements, broader grid compatibility, ability to
pair with renewable energy sources, and other characteristics. At the same time, there are differences in
their size and functions that differentiates their suitability for deployment across geographic regions and
across applications. The methodology employed here incorporates two main approaches to assess the
deployment potential of new nuclear technologies. The first is a top-down quantitative assessment of
global and regional markets. The second is a bottom-up qualitative assessment matching the technological
characteristics of new energy sources with national and regional markets.
Previous research on SMRs employs these two methodology types. Given the similarities between
larger SMRs and several features of microreactors, a brief review of the SMR research is provided to
offer context for the methodology and decision analysis used later in this report. The following section
provides an explanation of the bottom-up approach using deployment indicators. In Section 4,
deployment indicators for SMRs are adapted to the characteristics and features of microreactors.
Microreactor-specific indicators are described and applied to specific use cases in Section 5 and adapted
to a series of global profile markets in Section 6. A top-down assessment of the global potential for
microreactors is developed in Section 7.1 and a bottom-up assessment is provided in Section 7.2.
Findings of these two methodologies are combined in Section 7.3 to provide a regional evaluation of the
global market potential for microreactor deployment.
3.1 Previous Approaches for Deployment Assessment
This section reviews the previous work done on the deployment potential for small-scale nuclear
energy production by SMRs. As noted above, both top-down and bottom-up approaches have been
employed to assess the market potential of SMRs. It is important to note while several studies on the
economic viability of energy production for using SMRs and microreactors have been published (e.g.,
NEI 2019a), previous research on the deployment potential of these technologies is limited. The section
below discusses studies using a top-down methodology, beginning with a review of its development for
SMR market assessment and concluding with more recent assessments of future advanced reactor
potential.
3.2 Initial Top-Down Approaches to Deployment Assessment
Given the relatively nascent stage of development for commercial microreactors, initial studies of the
small nuclear reactors’ global market potential involved SMRs and utilized top-down approaches relying
on global projections of energy demand and the projected shares of nuclear power and SMRs. The IAEA
supported early research on the development of SMRs following the IAEA General Conference in 1997.
Kupitz et al. (2000) performed an early review on the development of small- and medium-sized nuclear
technologies for the IAEA. This study noted SMRs are suitable for cogeneration applications where
process heat is needed for smaller-scale applications in addition to electricity production. It specifically
projected desalination as a leading market for future SMR deployment given the relatively small scale but
energy intensive nature of desalination processes, especially in developing economies. Faibish and
Koneshi (2003) subsequently reported similar findings. Although identifying regions for SMR uses in
cogeneration applications, neither study provided quantitative estimates of projected future demand for
SMRs. Kuznetsov (2008) performed an early study employing a top-down methodology to make
projections of SMR demand for the IAEA. In this study, future SMR demand was projected by
constructing two scenarios, each with a different number of countries likely to adopt SMRs over a 20-year
period based on their existing or anticipated nuclear status. Subsequent studies highlighting the features
12
and advantages of SMRs over traditional nuclear designs for a variety of uses (e.g., studies by Ingersoll
2009; Carelli et al. 2010; Office of Nuclear Energy 2009; and World Nuclear Association 2010). The
design characteristics of SMRs were also the focus of the influential IAEA (2018) ARIS report that
anticipated most future SMR demand coming from countries with existing nuclear capacity and only a
small share of future SMR demand coming from countries without existing nuclear capacity.
Although studies such as these used design features of SMRs to identify markets with potential high
demand, they did not provide quantitative estimates of future potential SMR sales. One of the first studies
to do so was performed by the CAES EPI (Solan et al. 2010). This study’s focus was the economic and
fiscal impacts on the U.S. economy from developing a national SMR industry consisting of
manufacturing, domestic operations, and exports of SMRs. Projected growth in the global demand for
SMRs was assessed by developing estimates of projected global energy, nuclear power’s share of global
energy production, and the share of nuclear power amenable to the characteristics of SMRs. These
generated a range of scenarios of future nuclear energy demand and SMR adoption. Total nuclear market
share for electricity generation in each scenario is derived from established models and datasets provided
by the U.S. Energy Information Administration (EIA), the IAEA, and the Electric Power Research
Institute (EPRI). The advantages of SMRs over large-scale nuclear facilities for power generation in some
markets, as well as the potential of SMRs for district heating, desalination, and hydrogen production, are
incorporated in the future scenarios of a domestic SMR industry through 2030. These scenarios were
constructed based on the assumption SMRs are likely to capture different shares of the forecasted nuclear
power capacity additions. Some displacement of fossil-fuel electricity generation sources by nuclear
source is incorporated into the projections from EIA, IAEA, and EPRI. Further replacement based on
SMR-specific characteristics was not explicitly incorporated into this study’s projections, although it is
noted this would likely further increase the estimates of future SMR production. To create the four
scenarios of potential SMR adoption, the projections for growing nuclear power capacity were combined
with estimates in SMR market share of nuclear power capacity growth and the degree of global SMR
market penetration of U.S. manufacturers. The Moderate Deployment Scenario assumed some policies
targeting climate change mitigation would be implemented both domestically and internationally and
much of the increased energy demand would come from international markets, especially in the Far East.
Using the EPRI (2009) and IAEA (2009) energy demand projections for the U.S. and international
markets, respectively, the CAES EPI study forecast 4,400 MWe of new annual global energy production
would be produced by SMRs in 2030.
A subsequent study by the OECD Nuclear Energy Agency (NEA 2016) also projected potential SMR
demand using updated projections of global nuclear additions. Unlike the CAES EPI (2010) study, which
projected annual SMR manufacture, the NEA study calculated total SMR production capacity over a 15-
year period. In evaluating projected SMR demand, this study noted the suitability of SMRs for small grids
as well as their potential for cogeneration, desalination, and load-following with renewables as principal
drivers of future SMR demand. According to the higher end of its two scenarios, this study projected
about 21 GWe of new nuclear additions in the 2020–2035 period would be supplied by SMRs. Much of
the analysis in this study was focused on regional projections for SMR demand, with little demand
coming from South America and moderate demand from Russia, North America, Africa, the Middle East,
and the European Union (EU). As with the CAES EPI study, the NEA study projected most of the
demand for SMRs would come from markets in China, East Asia, Southeast Asia, and South Asia. It is
important to note this study emphasized that the commercial prospects for SMRs could vary widely
depending on regulatory and licensing conditions, manufacturing economics, and successful supply chain
development. A very recent update from the NEA (2021) on SMR opportunities and challenges
maintained these projections and noted economic competitiveness with other energy technologies is
central to SMR market potential, and mass production is likely to be key to contributing to their economic
viability. Given the demand projections for SMRs, this requires that markets for single designs will have
to be relatively large thus limiting the number of designs currently under development from becoming
commercial.

13
3.3 Top-Down Assessments and Methodologies Used for This Report
Several studies conducted by the IAEA, International Energy Agency (IEA), Intergovernmental Panel
on Climate Change (IPCC), and Third Way provide capacity projections for nuclear energy in 2020–
2050. The IAEA produces an annual projection for nuclear energy, Reference Data Series No. 1 (RDS#1),
titled ‘Energy, Electricity and Nuclear Power Estimates for the Period up to 2050’. This report is used by
the IAEA to inform its Member States on the future status of nuclear power (IAEA 2020b). The IEA
produces the annual World Energy Outlook; the latest report is 2020 (IEA 2020). The IPCC analyzed a
range of pathways including nuclear energy as a mitigation option (IPCC 2018). Third Way prepared an
analysis “Mapping the Global Market for Advanced Nuclear, in support of nuclear power addressing
climate change” (Third Way 2020). The key attributes of these studies are described in Table 2 including
the methodology, key findings, assumptions, and applicability for describing advanced nuclear markets
for SMRs and microreactors.
Table 2. Nuclear power projections.
IAEA RDS#1 IEA WEO IPCC 1.5C Third Way
Projections from
2019 to
2030, 2040, 2050 2030, 2040 (except
the net-zero emission
case)
2030 2030
Methodology Bottom-up low, high Equilibrium
Modelled four
scenarios
Equilibrium
Modelled 1.5C
scenario in 2030
Parametric, three
market groups, 5%,
10%, 20% benchmark
share allocations
Key Findings Nuclear newcomers
make small capacity
contribution, growth
in Asia not in EU or
U.S.
SMRs considered but
not broken out,
nuclear holds 10%
share of global
electricity
Increased
ambition drives
higher numbers
in 2030
New capacity shares
provided by advanced
nuclear, primary growth
in China and India
Assumptions Reactor Retirements,
large NPP
replacements
Nuclear deployment
limited due to their
large scale
Nuclear slowed
by scalability,
public perception,
costs, safety
issues
Electricity growth
based on electric
consumption and
GNI/per capita
Define Adv.
Nuclear
Not up to 2030, could
be part of 2030–2050
Not discriminated Not discriminated Specifically identified,
but not detailed to
SMRs
Results from the nuclear capacity projections (less reactor retirements) are provided in Figure 3 and
Figure 4 as compiled by INL.

14
Figure 3. Nuclear capacity projections by GWe.
Figure 4. Nuclear capacity projections by TW-h.
The World Nuclear Association (WNA) set the Harmony goal to supply 25% of global electricity
using nuclear energy by 2050, resulting in a tripling of nuclear generation from its present level. This goal
requires the construction of around 1000 GWe of new nuclear capacity by 2050. This is roughly
equivalent to the 2050 high estimates from IAEA, IPCC, and Third Way plus the replacement of 174–
297 GWe (IAEA 2020) of retiring nuclear capacity.
-
200
400
600
800
1,000
IAEA Low IAEA High IEA Net ZeroEmissions (NZE2050)
IPCC 1.5C Scenario Third Way
GW
eNuclear Capacity Projections (GWe)
(less retirements)
2019 2030 2040 2050
2,657 2,872 2,774
2,929
5,762
2,789
3,777
4,855
5,497
4,294
6,102
7,474
-
1,000
2,000
3,000
4,000
5,000
6,000
7,000
8,000
2019 2030 2040 2050
TW-h
Nuclear Capacity Projections (TW-h) (less retirements)
IAEA Low
IAEA High
IEA Net Zero Emissions (NZE2050)
IPCC 1.5C Scenario
Third Way

15
The trends derived from these studies suggest:
• Nuclear is increasingly recognized by countries as a low-carbon contributor and is becoming a part of
the low-carbon portfolio with renewables. Scenarios with enhanced climate action (IPCC 1.5C) show
nuclear with an increased role.
• SMRs are becoming recognized, but the potential role of microreactors is so far unknown.
• Microreactors, as a disruptive technology, could help facilitate renewable penetration and provide a
low-C alternative to markets transitioning from fossil energy (particularly diesel fuel) for heat,
flexibility, and resilience.
• Little changes over the next decade (until 2030), where advanced nuclear technology will have little
impact. The potential role of advanced nuclear is recognized beyond 2030 but unclear in terms of the
impact due to FOAK investment risks and uncertainties.
• Most future nuclear development is in emerging markets (China, India, and Russia) to support
emerging energy demands.
• Current nuclear-powered countries, particularly the U.S. and EU, are only partially replacing or
retiring large reactors and not expanding their nuclear shares.
• Growth projections generally reflect nuclear shares, staying at about 10% of electricity demands
through to 2050.
• Projections are primarily oriented to Gen III/III+ large reactors, generally no discrimination between
Gen III and Gen IV (aside from Third Way) in the 2030–2050 timeframe, or specific contribution
from SMRs.
• COVID-19 could set back growth by 2–4 years, and country policy responses due to climate change
could accelerate nuclear.
• Current projections reflect an increasing role of electrification in non-electricity sectors (transport)
but generally do not address the potential use of nuclear in heat markets, for flexibility, or role in
energy storage.
• Renewables are projected to increase shares up to 60% by 2030 from 2020 levels per the “Net Zero
Emission by 2050” case and the IEA (2020) report; however, IEA analysts recognize potential limits
due to shortages of critical material, land, storage, and well-functioning electricity networks.
Hydropower and bioenergy are expected to help meet flexibility requirements associated with
increased shares of VRE on the grid.
Section 7.1 uses the results from these projections to support a top-down assessment for
microreactors.
3.4 Initial Bottom-Up Approaches to SMR Deployment Assessment
As noted above, these top-down projections of future SMR demand are all based on projections of
global energy demand with the deployment prospects for SMRs dependent on nuclear energy’s share of
this increased demand and, ultimately, the portion of new nuclear additions from SMRs. An alternative
approach is a bottom-up methodology focusing on matching SMR characteristics and applications with
market conditions within countries or regions. the U.S. Department of Commerce (DOC) (2011)
performed the first study to do so using six criteria to evaluate a pre-selected set of 27 countries identified
as likely markets for U.S. SMR developers. These countries were ranked according to their scores of
indicators such as population density, CO2 emissions, electricity imports, economic growth, energy
consumption, and nuclear capacity. While China and South Korea were included in the DOC report, other
Asian countries identified as top potential markets in the studies by CAES EPI (2010) and NEA (2016,

16
2021) discussed above were not. Latvia was ranked highest while China was ranked 7th and South Korea
ranked 14th in the DOC study.
A more comprehensive and systematic approach was taken in a subsequent study by Black et al.
(2014) in which the number of indicators and countries evaluated were dramatically increased from the
DOC (2011) study. Unlike the DOC study, countries were not pre-selected for inclusion, and rather than
six indicators being used to evaluate a sample of 27 countries, over 200 countries were evaluated using 15
indicators. Scores for each indicator were obtained from established sources such as the World Bank,
IAEA, Energy Information Administration, and others. Rather than employing a quartile scoring system,
each country’s score for each indicator was incorporated into a multi-criteria decision analysis (MCDA)
technique, termed Analytic Hierarchy Process (AHP), to evaluate a country’s overall amenability to SMR
deployment (described further below). Two succeeding studies were performed by CAES EPI (2015a and
2015b) for the IAEA to evaluate the potential for SMR deployment across all IAEA member states. In
these studies, the number of indicators was increased from 15 to 22 and grouped into categories
pertaining to areas of financial and economic, technology and infrastructure, and government policy and
regulatory conditions. Using data from the World Bank, the U.S. Energy Information Administration, and
other data sources, each country’s suitability for SMR deployment was evaluated by ranking its score for
each indicator. These studies were further modified through a series of IAEA consultancy meetings, with
contributions from IAEA member states and solicitations of expert input. The assessment methodology
using the decile scoring system was adopted and the deployment indicators further refined and released in
the IAEA publication “Deployment Indicators for Small Modular Reactors: Methodology, Analysis of
Key Factors, and Case Studies” (IAEA 2018). This forms the framework for the bottom-up assessment
for microreactors used in this report. Eighteen indicators were identified in the IAEA (2018) report and
grouped into six categories based on economic, technical, and policy conditions. Table 3 shows the SMR
indicators within each of these categories. The modification and additions to these indicators to make
them applicable to the distinct characteristics of microreactors is described in Section 4 and Appendix C
of this report, along with the needed adaptations of the assessment methodology for microreactors.
Table 3. SMR categories and indicators.
National Energy
Demand
SMR Energy
Demand
Financial/
Economic
Sufficiency
Physical
Infrastructure
Sufficiency
Climate Change
Motivation
Energy Security
Motivation
Growth of
economic
activity
(GDP GWTH)
Dispersed
energy
(RURAL)
Ability to
support new
investments
(GDP/PC-GDP)
Electric grid
capacity
(GRID)
Reduce CO2
emissions per
capita
(CO2)
Reduce energy
imports
(ENG IMP)
Growth rate of
primary energy
consumption
(GRPEC)
Co-generation
(DESAL/DH)
Openness to
international
trade
(FDI/TRADE)
Infrastructure
conditions
(INFRA)
Reduce fossil
fuel-energy
consumption
(FOSSFUEL/
OGC)
Use domestic
uranium
resources
(URAN)
Per capita
energy
consumption
(PC-EC)
Energy
intensive
industries
(EII)
Fitness for
investment
(CREDIT)
Land
availability
(LAND)
Achieve NDC
carbon
reduction goals
(NDC)
Balance
intermittent
renewables
(RES)

17
3.5 Bottom-Up Assessment Methodologies
The SMR deployment studies noted above identify different indicators to evaluate the market
conditions which are suitable to SMR characteristics. These studies vary both in terms of the number and
types of indicators used as well as the analytical methodology used to incorporate the indicators into a
quantitative framework. As noted above, the initial bottom-up study by the U.S. DOC (2011) identified
six indicators to evaluate the SMR market potential for 27 countries of interest as potential markets for
domestic SMR manufacturers. Using national-level data from global databases, each country’s ranking
for each indicator was determined and assigned a score based on a quartile-ranking system. Countries
within the top quartile for a given indicator were given a score of four, with scores descending to 1 for
countries in the lowest quartile for that indicator. The overall ranking of the 27 countries was determined
by the total score for the six indicators, with a theoretical maximum score of 24.
The MCDA technique employed by Black et al. (2014) is termed the AHP and has been used
extensively for decision-making for energy sector projects such as energy source selection and siting (see,
for example, Stein 2013; Wang et al. 2009). The AHP methodology uses pair-wise comparisons across
evaluative elements (indicators) to estimate the relative weights in the decision process across indicators
and thereby create a hierarchical structure to rank possible outcomes. While this technique is applicable to
decision-making using qualitative individual criteria, the use of quantitative measures for each indicator
in this study is relatively more straightforward. In this case, the pair-wise comparisons for the 15
indicators are incorporated into a 15x15 matrix to determine the importance of each indicator in the
decision-making procedure. One advantage of this technique is that the relative weights of each indicator
is determined endogenously in the overall decision process. After the relative weights for each indicator
are determined, the score for an individual country in terms of SMR market potential is determined by
summing the numerical score for each indicator multiplied by the weight for each indicator (see Table 4
for the indicator’s definitions). For the 15 indicators used in this research, each country’s score is given
by:
Score = GDP (wt1) + PCGDP (wt2) + RGDPG (wt3) + ITPGDP (wt4) + GREC (wt5) + TRGC (wt6) +
PPRA (wt7) + AE (wt8) + IR (wt9) + TR (wt10) + DBI (wt11) + CPI (wt12) + CO2 (wt13) + OGC (wt14) +
EIP (wt15)
For further description of the indicators and methodology used in this study, see Black et al. (2014).
While the original sample included over 200 countries, the imposition of some necessary conditions,
including minimum grid size, credit worthiness, gross domestic product (GDP), and technological
readiness, resulted in about half of these countries being eliminated from further consideration. The
ranking of the remaining 97 countries ranged from AHP scores of 2.12 for Singapore to 0.755 for
Venezuela.
It is important to note the CAES EPI studies (2015a; 2015b) performed for the IAEA compared the
use of AHP methodology with a simpler evaluative system along the lines of the quartile system used in
the DOC (2011) study. These CAES EPI studies found increasing the number of indicators and using a
more discerning decile-ranking methodology yielded results strikingly like those derived from using the
AHP methodology. In this ranking system, countries were grouped according to their decile ranking for
each indicator. Thus, countries within the top decile of scores for a given indicator were given a score of
10 and those in the lowest decile were given a score of one for that indicator. With the 22 indicators in the
CAES EPI (2015b) study, a theoretical maximum score of 220 is possible. Of the 164 Member States
evaluated for this study, the top five scores were obtained by Australia (168), United States (166), Canada
(162), Singapore (161) and China (160).
One advantage of a MCDA methodology, such as AHP, is the relative weights of indicators in the
decision process is endogenously determined. Using a quartile or decile scoring system imposes the same
relative weights across indicators. However, given the sophisticated analytical techniques, coupled with
the necessity of using costly licenses and programming, using a much simpler decile-ranking system was

18
more appropriate for countries with widely varying levels of economic, technical, and analytical
capabilities. Although even simpler to use, employing a quartile-based scoring system was not
recommended as there were significant disparities between a quartile-based system and a decile-based
system. It was found that, even with the use of the same indicators, the quartile system placed too much
importance on indicators relating to economic and financial conditions.
3.6 Microreactor Global Market Assessment
In Section 4, the SMR deployment indicators are adapted in an assessment framework for
microreactor market potential with a bottom-up methodology. In general, the microreactor indicators are
more localized than those for SMRs, given their smaller size and different capabilities. Following the
description of the indicators for microreactors in Section 5, microreactor characteristics and applications,
identified by the microreactor deployment indicators, are matched to a wide variety of market conditions
extant in varying use cases. This allows for the identification of specific features and applications of
microreactors to be evaluated across a variety of global markets. Data for each microreactor indicator is
then used to evaluate the countries with greater potential benefit from deploying microreactors for each
use case. Section 6 of this report condenses the use cases into five global profile markets, and then in
Section 7, the global top-down and a country bottom-up analyses are performed. In Section 8, regulatory
challenges and deployment issues for microreactors are further considered.
4. DEVELOPMENT OF DEPLOYMENT INDICATORS FOR MICROREACTORS
As discussed in the Section 3, the approach to the assessment of microreactor market potential that is
proposed here is based on the previous work for SMR deployment, especially the IAEA report
Deployment Indicators for Small Modular Reactors: Methodology, Analysis of Key Factors, and Case
Studies (IAEA Tech-Doc 1854, 2018). The IAEA study used inputs from potential users of SMRs for
newcomer nuclear countries. For example, this approach was taken to evaluate the potential use of SMRs
and microreactors in Puerto Rico (NAP 2020). Subsequent research by Shropshire et al (2021) modified
this SMR framework to better capture the unique characteristics of microreactors. Input was also taken
from surveys conducted by the UAA (2020b) for uses of microreactors in Alaska, the UW–Madison
(Palmieri et al. 2021) for federal facilities, and the NAP (2020) for specific requirements for islands.
In this research, indicators from the SMR categories of the IAEA (2018) report are reviewed for their
applicability to microreactors. Researchers determined some SMR indicators are applicable to
microreactors only as benchmarking measures of a country’s overall demand for new energy production,
its economic and financial sufficiency to support new nuclear technologies, a considerable amount of
energy imported from abroad, as well as the incentives at the national level to achieve carbon reduction
goals and reducing CO2 emissions and fossil fuel usage. Benchmarking indicators may be used to define
the minimum conditions for host country readiness based on comparable rates from countries and locales
with existing nuclear power programs. While these may influence the overall conditions or incentives for
energy production options at a national level, localized factors are expected to be more relevant for
microreactor deployment. Further information on the microreactor benchmarking indicators are provided
for reference purposes in Appendix A.
The deployment indicators described in this report, the types of supporting data for each indicator,
and the overall methodology can be used in conducting a pre-assessment of potentially using
microreactors as part of a country’s overall energy development strategy. Importantly, these are not
predictive, but rather indicate potential. The microreactor deployment indicators may be used as a starting
point to customize the methodology for country- and site- specific conditions using additional indicators,
weighting factors, and localized data. This methodology can be refined as more is known about the
performance of specific technologies (e.g., mobility, costs, electric and heat outputs, and infrastructure
needs), the local energy infrastructure (e.g., integration on a micro-/mini-grid), and use (e.g., electricity,

19
district heating, cogeneration, desalination, and hydrogen production). Users of these indicators may find
it helpful to compare their site-specific scores (e.g., local energy prices) to countries with existing nuclear
programs and those considering use of microreactors as a guide for potential viability.
With the modification and additions of new indicators, data sources are also revised to support the
specific types of analyses. In general, due to the size of anticipated SMR power production facilities, the
SMR methodology provided in the IAEA (2018) Technical Document uses national-level data from
global databases to identify overall country conditions amenable to SMR deployment and evaluating
deployment potential on a national basis. Overall, the microreactor indicators developed here reflect more
localized conditions than those for SMRs and adopting a similar approach for evaluating microreactor
deployment potential within a country will depend on the availability of local data sources within the
country.
Table 4 shows the deployment categories and indicators adapted from Table 3, indicating their
applicability for microreactors. The following sections focus on the microreactor-specific indicators in
each category.
Table 4. Adapted microreactor deployment indicators.
Microreactor Deployment Indicator Categories
National Energy
Demand
Microreactor
Energy Demand
Financial/
Economic
Sufficiency
Physical
Infrastructure
Sufficiency
Climate Change
Motivation
Energy Supply
Surety
Motivation
Growth of
economic
activity
(GDP GWTH)
Dispersed
energy/remote/
land/locked
(DISP/R/L)
Ability to
support new
investments
(GDP/PC-GDP)
Electric grid
capacity
(GRID)
Reduce CO2
emissions per
capita
(CO2)
Reduce energy
imports/
diversify energy
sources
(ENG IMP/DIV)
Growth rate of
primary energy
consumption
(GRPEC)
Local
cogeneration
(LOC COGEN)
Openness to
international
trade
(FDI/TRADE)
Limited access
to energy
(LAE)
Reduce fossil
fuel energy
consumption
(FOSSFUEL/
OGC)
Use domestic
uranium
resources
(URAN)
Per-capita
energy
consumption
(PC-EC)
Local energy
intensive
industries
(LEII)
Fitness for
investment
(CREDIT)
Land
availability
(LAND)
Achieve carbon
reduction goals
(NDC)
Balance
intermittent
renewables/
scalability
(RES/SCALE)
Local economic
growth potential
(LEGP)
Local energy
price premiums/
seasonal
(LEPP/S)
Limited access
to local capital
(LOCCAP)
Limited access
to trades/QA
(TRADES/QA)
Local climate
change/disaster
vulnerability
(LCC/DV)
Local critical
loads/facilities
(CRIT)
Microreactor-
specific
indicator
Microreactor
benchmarking
indicator
Not applicable to
microreactors

20
4.1 National Energy Demand
As indicated in the previous section, the SMR indicators were reviewed for their relevance for
microreactor-specific characteristics. The national energy demand benchmarking shows increases in
economic growth or energy demand at a national level may generate increases in microreactor
deployment as part of an overall projected increase in energy production. However, given their much
smaller size and differences in characteristics, the specific application needs at a more local level are
likely to be more important for microreactors. Thus, while these three SMR indicators are shown for the
general benchmarking conditions for microreactor deployment, the microreactor-specific indicator
identified here is Local Economic Growth Potential (LEGP).k This indicator represents energy growth in
a localized economic region, including energy for household, commercial and industry use. These may
result from improving economic conditions due to factors such as regional economic activity, the
development of new industries, or general population growth or growth due to societal climate migration
and rapid urbanization to megacities. A microreactor is the “right-sized” for location, population size and
energy usage patterns. Additional details on the SMR benchmarking deployment indicators are included
in Appendix A.
4.2 Microreactor Energy Demand
While the previous indicators in the National Energy category incorporate assessments of overall
economic growth and energy demand, the indicators in this category assess the conditions specific to the
characteristics and applications of microreactors as opposed to larger energy power plants. The indicators
in the category for SMR Energy Demand, shown in Table 4, are generally applicable to microreactor
demand with some additional considerations. While large energy production facilities are well suited for
population centers, the size and features of SMRs and microreactors are well suited for the electricity
needs of a more dispersed population. Therefore, the Dispersed Energy (rural and local) SMR indicator
measures market dispersion as given by the difference between the percentages of a country’s population
in rural areas versus urban areas. A predominantly concentrated population in urban areas would generate
a lower ranking for this indicator than a predominantly rural population with a relatively smaller and more
dispersed energy grid. As with the SMR version of the indicator, market dispersion is relevant for the
deployment of microreactors. In addition, because of their size, transportability, and ability to operate
independently, microreactors are also conducive to remote/isolated locations or relatively inaccessible
regions such as islands. In line with these attributes, the microreactor indicator Dispersed
Energy/Remote/Locked (DISP/R/L) represents energy systems with dispersed generating capacity
including remote locations and those with sea or land-locked geography with limited access,
infrastructure, and few domestic energy sources.
Like the above indicator, Cogeneration (DESAL/DH) and Energy Intensive Industries (EII)
indicators are applicable to microreactor deployment potential with some modifications. Given their
ability to provide non-electric energy for a variety of applications, both SMRs and microreactors share
features that differentiate them from other energy production technologies. While large nuclear and fossil
fuel plants produce electricity, these technologies have the additional ability to provide thermal energy for
CHP applications. The indicator Local Cogeneration (LOC COGEN) includes the ability for
microreactors to co-produce electricity and heat to support various capacities using the combined
electricity and heat from on-site generation sources. These include desalination and purification of water
for domestic and industrial use, district heating/cooling, hydrogen, and production. These CHP uses for
microreactors provide a substitute for local process heat applications dependent on fossil fuels. A
microreactor can co-produce electricity and heat and may adjust shares depending on local needs. Thus,
this indicator is used to assess the demand for this feature of microreactors by measuring the potential
k In this section and following sections, microreactor-specific indicators are italicized to distinguish them from the SMR
indicators described in the previous section.
21
demand for desalination and district heating applications. As noted by Kupitz and Mistra (2007), the need
for desalination is increasing globally and has the potential to be a major driver in the demand for new
small nuclear technologies because of their ability to provide thermal energy for desalination during times
of off-peak electricity demand. This indicator ranks the projected additions to the desalination capacity
of countries globally, with high rankings that may be indicative of microreactor demand for
desalination. In addition to desalination, using microreactors and SMRs for both thermal and electric
energy for district heating is a source of increased demand. Unlike countries with high desalination needs,
the demand for district heating is more prevalent in cold regions, especially those with very low
temperatures and where heat is needed for much of the year. Rankings for this indicator are
based on time-series observations of temperature and precipitation globally, with higher scores
for countries with lower temperatures over 10 months annually. Similarly, the Local Energy
Intensive Industries (LEII) microreactor indicator includes industries requiring high reliability and high-
capacity factors such as ore processing, steel production, oil refining, and chemical production as well as
urban centers lacking space for local renewable energy sources.
A new microreactor-specific indicator, Local Energy Price Premiums (LEPP/S), represents exposure
to high energy prices and assesses areas where energy costs are relatively high. Price premiums on diesel
fuel, liquefied natural gas, and energy storage improve microreactors’ economic competitiveness in the
short and long term. This new indicator is constructed by determining average energy prices across broad
national or regional geographic spaces and measuring relative energy price deviations on a localized
basis. Areas where energy prices are higher are more conducive for microreactor deployment.
4.3 Financial and Economic Sufficiency
SMRs are differentiated from microreactors on several of the indicators. While the SMR indicators in
this category are used to evaluate economic and financial conditions conducive to establishing a reactor,
the assessment for microreactors differs from previous SMR deployment analyses. With the large capital
requirements for conventionally sized nuclear or fossil fuel power plants, low external debt levels and
high credit ratings are favorable for obtaining the requisite financing. Further, given the relatively long
construction periods for these sources and risks of cost overruns, obtaining financing at lower interest
rates can dramatically affect their financing costs. While these factors play a role at the national level in
determining the ability of a country to pursue potential SMR development, and are used for benchmarking
here, they are much less important in the case of microreactors. The much lower cost and financing risk of
microreactors increases their ability to be installed in cases with limited access to capital on the part of a
local entity such as a mining company, tribal community, or small utility. Thus, the microreactor indicator
Limited Access to Local Capital (LOCCAP) evaluates the capacity of a local entity to raise capital to build
new energy sources. Rather than fitness at a country or state level, this microreactor indicator focuses on
local financial conditions. Similarly, the national financial conditions and trade policies are important for
the ability of a country to develop capital-intensive energy sources such as large NPPs or SMRs.
However, given their much smaller size and lower capital requirements, these conditions are less
important for microreactors. Additional details on the SMR benchmarking deployment indicators are
included in Appendix A.
4.4 Physical Infrastructure Sufficiency
These physical infrastructure sufficiency indicators are quite different for microreactors as compared
to SMRs. The grid requirements for large power plants or SMRs are not applicable given the small
electrical output of microreactors. Similarly, land requirements are dramatically reduced for microreactors
compared to large NPPs, fossil fuel plants, and large wind or solar installations. The SMR indicator
Infrastructure Conditions (INFRA) is modified here and termed Limited Access to Energy (LAE). This
microreactor-specific indicator relates to the local access to existing energy transmission and distribution
sources to support basic societal needs for clean and sustainable sources of energy. A new microreactor
indicator in this category is Limited Access to Trades/QA (TRADES/QA). This indicator represents the

22
capacity for skilled, qualified trades and supply chain needed to support construction, operations, and
quality assurance. Large nuclear and fossil fuel power facilities require the availability of a skilled labor
force and supply chain for initial construction as well as ongoing operation and maintenance activities
over the life of the facility. Given their off-site manufacturing and ability to operate independently,
microreactors are well suited to areas with low levels of skilled labor force availability and limited supply
chain. With reasoning similar to that for the above Local Access to Energy indicator, a low rating for the
microreactor indicator Limited Access to Trades/QA (TRADES/QA) is deemed to be favorable for
microreactor deployment given their simpler designs that limit on-site construction activities and limited
supply chain needs. Additional details on the SMR benchmarking deployment indicators are included in
Appendix A.
4.5 Climate Change Motivation
One of the motivators for increasing low-carbon energy production is to support a country’s
decarbonization goals by reducing fossil fuel usage and reducing greenhouse gas emissions. For
microreactors, a country’s commitment to actions for climate change mitigation provides an overall
incentive for reducing use of fossil fuels, and supporting state, corporate, or national climate change
goals. Microreactors, as with SMRs and other low-carbon energy production technologies, provide a
means to achieve these goals on a general basis. One new indicator for microreactors is added here, Local
Climate Change/Disaster Vulnerability (LCC/DV). This indicator captures the local vulnerability to
climate change, such as rising sea levels, impacted food production, as well the susceptibility to natural
disasters such as hurricanes, earthquakes, and flooding. A microreactor can quickly be deployed to a
disaster area and redeployed as necessary to new sites. Additional details on the SMR benchmarking
deployment indicators are included in Appendix A.
4.6 Energy Supply Surety Motivation
The final category focuses on the risks related to energy security. Increasing the level of domestically
produced energy can increase the level of energy surety within a country. Two of the SMR indicators in
this category are adopted here with some modifications, one is deleted, and a new microreactor-specific
indicator is added.
Countries with a high reliance on energy imports are likely to have an incentive to adopt SMRs and
microreactors to increase domestic production. The SMR indicator Reduce Energy Imports (ENG IMP)
measures the difference between domestic energy production and energy consumption to obtain the
percentage of energy use from imported energy sources. Countries with high levels energy imports are
assessed to have increased incentive to adopt SMRs to fulfill part of their future energy production. For
microreactors, this indicator is modified and termed the Reduce Imports/Diversify Energy (ENG
IMP/DIV) indicator to address an area’s desire to reduce reliance on external sources of energy and
motivations for developing local sources of energy, especially in areas where there is an overreliance on
one or two sources of energy. Given the small size and lower cost of microreactors relative to SMRs, an
area is likely to have a higher probability of using microreactors to diversify its energy production
portfolio.
The SMR indicator Balance Intermittent Renewables (RES) recognizes the growth of wind and solar
energy production and the opportunity to provide backup sources of energy when variable renewables are
unable to produce power. Many SMR designs are capable of load-following with renewable energy and
thereby provide more surety of baseload power production. For microreactors, this indicator is modified
to address the incentive to not only balance variable renewables but to also address the ability of
microreactors to adjust to changes in energy demand with changes in load-following, ramping, and other
factors. A microreactor that is compatible with intermittent sources of energy and can scale to load over
time, such as adjust to changing seasonal requirements, is needed. Thus, this indicator is broadened to

23
include these characteristics of microreactors and is termed Balance Intermittent Renewables/ Scalability
(RES/SCALE).
A new microreactor-specific indicator is added here, Local Critical Loads/Critical Facilities (CRIT).
This indicator represents the condition of supporting a critical load across a distribution area (microgrid,
mini-grid) for important operations and the capacity to supply specific critical facilities such as hospitals,
datacenters and disaster relief centers with the need for power particularly during and after periods of
natural disaster. A microreactor can operate independently from the electric grid to supply highly resilient
power for critical loads.
Finally, the SMR indicator Use Uranium Resources (URAN) is employed for those countries
with demonstrated uranium resources that are likely to be economically viable to extract over the
short- and medium-term and measures the uranium resources in a country. Countries with such
domestic uranium deposits are more likely to engage in nuclear development programs such as the
deployment of SMRs. However, this indicator is omitted here as this is not deemed to be a significant
motivator for microreactor usage.
4.7 Using Microreactor Deployment Indicators for Market Assessment
Alternative approaches are developed here combining the bottom-up and top-down methodologies
described in Section 3 of this report. Microreactor deployment indicators are used to analyze use cases
applicable to microreactor characteristics. Several specific use cases are examined in the following
section of this report correlating microreactor characteristics with specific applications and locational
requirements to identify market opportunities for microreactor deployment. This analysis identifies
specific market conditions amenable to microreactor deployment. These use cases provide the framework
for a quantitative assessment of 63 countries identified as being nuclear energy countries or emerging
nuclear energy countries. For each use case, a decile scoring methodology is used to identify the countries
most likely to be potential adopters of microreactors for the specific market characteristics identified in
each use case. Additional qualitative measures are recognized as also needed. The methodology and data
sources for this assessment are described in the following section. The specific rating of countries for
each use case are provided in Section 7.2.
5. DEVELOPMENT OF DEPLOYMENT INDICATORS APPLIED TO USE CASES
Developing the microreactor deployment indicators in the previous section of this report serves two
purposes. The first is evaluating microreactor characteristics and applications can significantly inform the
market potential for this technology. This, in turn, can serve to provide input into the energy development
strategies on the part of existing and emerging nuclear countries. The second purpose is identifying the
characteristics and designs valued for use in different applications can, in turn, serve to inform the
developers of microreactor designs. For example, for the microreactor deployment indicator Local
Economic Growth Potential, the technical requirement is defined as the ability to be “right-sized” to fit a
specific location, population size, energy usage, where a typical measure is the electrical capacity with a
range of 1–20 MWe. Given the size and requirements best matched with this indicator, example
microreactor designs are listed from smallest to largest capacity to show how each relate to this
requirement. The other 11 indicators follow a similar pattern, although data is not always available, so
only designs with published data are provided as examples in Table 5.

24
Table 5. Microreactor deployment indicators translated to design characteristics.
Microreactor Deployment
Categories and Indicators
Microreactor Technical
Requirements Typical Measures
Examples of Microreactor
Design Characteristics
(Category: National
Energy Demand)
1. Local Economic
Growth Potential
Ability to be “right-sized”
for location, population
size, energy usage
1–20 MWe 1–10 MWe heat pipe
(NuScale), 1.5 MW (Aurora
OKLO), 2.0–3.5 MWe
(eVinci), 4.0 MWe (Urenco),
>5.0 MWe (MMR), 7.4 MWe
(X-Energy), 10 MWe
(MicroNuclear), 10–50 MWe
module (NuScale), 3–13
MWe (HOLOS), 20 MWe
(Hydromine)
(Category: Microreactor
Energy Demand)
2. Dispersed Energy/
Remote/Locked
Transportable to areas
with limited access and
infrastructure (labs, SNF
storage), self- contained
units, long-life cores,
contained cores, ease of
siting (small EPZs)
Transportable via ISO
container
Rail/Truck/Barge/Air (MMR,
NuScale, eVinci, HOLOS)
3. Local Cogeneration Co-produce electricity
and heat (desal, H2, other)
for process applications.
Heat sink options
2–40 MWth available
for process heat,
reactor coolant outlet
temperature
HTRs burning TRISO fuel:
7.0–12.0 MWth (eVinci), 10
MWth (URENCO), >15
MWth (MMR), >22 MWth
(HOLOS), ~18 MWth (X-
Energy)
4. Local Energy Intensive
Industries
Reliable with high-
capacity factors, maturity
of design, resilience to
disruptions
Capacity Factor: 90–
98%, high TRLs
Est. CF’s: 90% (X-Energy),
95% (NuScale), 95%
(MMR), 98% (eVinci)
5. Local Energy Price
Premiums/Seasonal
Cost competitive in the
local energy market,
annual operating, and fuel
costs
Comparable to
existing (fossil)
market energy costs
(LCOE $/MWh)
Comparable with diesel cost
at $140–200/MWh (X-
Energy)
(Category:
Financial/Econ
Sufficiency)
6. Limited Access to
Local Capital
Limited capital at-risk for
overnight capital costs
$10,000–$20,000/kWe
(NEI 2019a)
15,700/kWe (MMR)
(Category: Physical
Infrastructure)
7. Limited Access to
Energy
No off-site power
required, hard or soft
infrastructure needs (labs,
SNF storage)
Operate in island-
mode and to have
black-start capabilities
Black-start capable (NuScale
and eVinci)
8. Local Access to
Trades/On-site
construction QA
Meet safety standards
(e.g., ASME
qualifications for NQA-
1) for construction and
on-site personnel needed
2) local supply chain
3) Specialized skills
On-site construction,
QA, supply chain,
workforce capabilities
%
Modular vs. stick built
On-site facilities needed for
fuel servicing, maintenance,
and decommissioning
(Hydromine, NuScale, X-
Energy), Cartridge core
factory refueling (eVinci,
HOLOS). Minimal on-site
operations (eVinci, HOLOS)

25
Microreactor Deployment
Categories and Indicators
Microreactor Technical
Requirements Typical Measures
Examples of Microreactor
Design Characteristics
(Category: Climate
Change)
9. Local Climate/Disaster
Vulnerability
Rapid initial deployment,
mobility to redeploy to
new site
Minimum site
preparations
On-site installed 1–6
months post-site
preparations
1 month (eVinci), 3–6
months on-site (X-Energy), 6
months on-site (MMR)
(Category: Energy
Surety)
10. Reduce
Imports/Diversify Energy
Sources
Long lived fuel with long
refueling cycles, quick
refueling (hot swap)
Years between
refueling
>3 years (eVinci), 3–10 years
(X-Energy), 5 years
(Urenco), 6 to 10 years
(NuScale), 8 years
(Hydromine), 10 years
(Urenco), 12 years (HOLOS),
20 years (MMR)
11. Balance Intermittent
Renewables/Scalability
Flexible power
conversion system, scale
to meet changing loads
over time, multiple
voltage outputs
Load follow (Up
%/min; Down %/min)
Multi-modules to
support scalable power
generation
Up 3%/min; Down 10%/min
(NuScale),
10%/min (MMR), four
modules stacked in ISO
Container (HOLOS), 1+
reactors share common salt
heat storage (MMR), scalable
design (URENCO, X-
Energy, HOLOS)
12. Local Critical
Loads/Critical Facilities
Operate independently
from the electric grid to
supply highly resilient
power for critical loads
Avoid common-mode
failure of on-site
generators and provide
reliable operation
Autonomous
connection,
disconnection, and
load adjustment on
micro- and mini- grids
Standard/proven
designs (fuel), system
redundancy,
operational flexibility
Remote monitoring and semi-
autonomous operation
(eVinci, HOLOS),
autonomous operation
(Aurora OKLO, eVinci,
MMR)
Redundant control systems
and ability to rapidly change
core geometry (HOLOS),
built on standard 17x17 PWR
design arrangement
(NuScale), proven UO2 fuel
(eVinci, NuScale) and
maturing TRISO fuel (MMR,
X-Energy, HOLOS,
URENCO, eVinci)
5.1 Use Cases for Microreactor Deployment
The following subsections focus on the linking of the microreactor deployment indicators with
several potential uses of microreactors identified in the studies through INL’s subcontracts with UAA
(2020a, 2020b), UW–Madison (Palmieri et al. 2021), and Puerto Rico’s NAP (2020). In addition, two
other use cases developed by INL are proposed here to further broaden the range of applications
considered in this report. For each use case, the following sections provide a brief synopsis of their
characteristics and the applicability of each of the microreactor deployment indicators for the assessment
of microreactor deployment potential. Then, the methodology and data sources used to evaluate each use
case is reviewed and an overview of the findings for the use case under consideration. This section
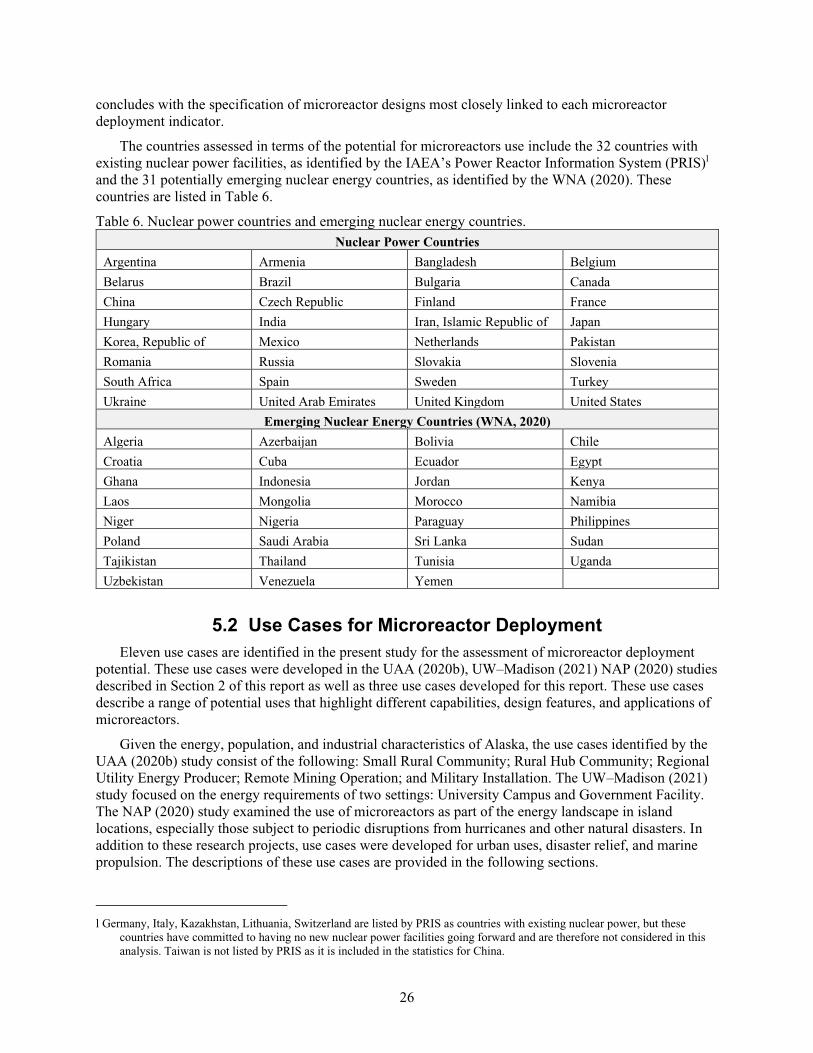
26
concludes with the specification of microreactor designs most closely linked to each microreactor
deployment indicator.
The countries assessed in terms of the potential for microreactors use include the 32 countries with
existing nuclear power facilities, as identified by the IAEA’s Power Reactor Information System (PRIS)l
and the 31 potentially emerging nuclear energy countries, as identified by the WNA (2020). These
countries are listed in Table 6.
Table 6. Nuclear power countries and emerging nuclear energy countries.
Nuclear Power Countries
Argentina Armenia Bangladesh Belgium
Belarus Brazil Bulgaria Canada
China Czech Republic Finland France
Hungary India Iran, Islamic Republic of Japan
Korea, Republic of Mexico Netherlands Pakistan
Romania Russia Slovakia Slovenia
South Africa Spain Sweden Turkey
Ukraine United Arab Emirates United Kingdom United States
Emerging Nuclear Energy Countries (WNA, 2020)
Algeria Azerbaijan Bolivia Chile
Croatia Cuba Ecuador Egypt
Ghana Indonesia Jordan Kenya
Laos Mongolia Morocco Namibia
Niger Nigeria Paraguay Philippines
Poland Saudi Arabia Sri Lanka Sudan
Tajikistan Thailand Tunisia Uganda
Uzbekistan Venezuela Yemen
5.2 Use Cases for Microreactor Deployment
Eleven use cases are identified in the present study for the assessment of microreactor deployment
potential. These use cases were developed in the UAA (2020b), UW–Madison (2021) NAP (2020) studies
described in Section 2 of this report as well as three use cases developed for this report. These use cases
describe a range of potential uses that highlight different capabilities, design features, and applications of
microreactors.
Given the energy, population, and industrial characteristics of Alaska, the use cases identified by the
UAA (2020b) study consist of the following: Small Rural Community; Rural Hub Community; Regional
Utility Energy Producer; Remote Mining Operation; and Military Installation. The UW–Madison (2021)
study focused on the energy requirements of two settings: University Campus and Government Facility.
The NAP (2020) study examined the use of microreactors as part of the energy landscape in island
locations, especially those subject to periodic disruptions from hurricanes and other natural disasters. In
addition to these research projects, use cases were developed for urban uses, disaster relief, and marine
propulsion. The descriptions of these use cases are provided in the following sections.
l Germany, Italy, Kazakhstan, Lithuania, Switzerland are listed by PRIS as countries with existing nuclear power, but these
countries have committed to having no new nuclear power facilities going forward and are therefore not considered in this
analysis. Taiwan is not listed by PRIS as it is included in the statistics for China.
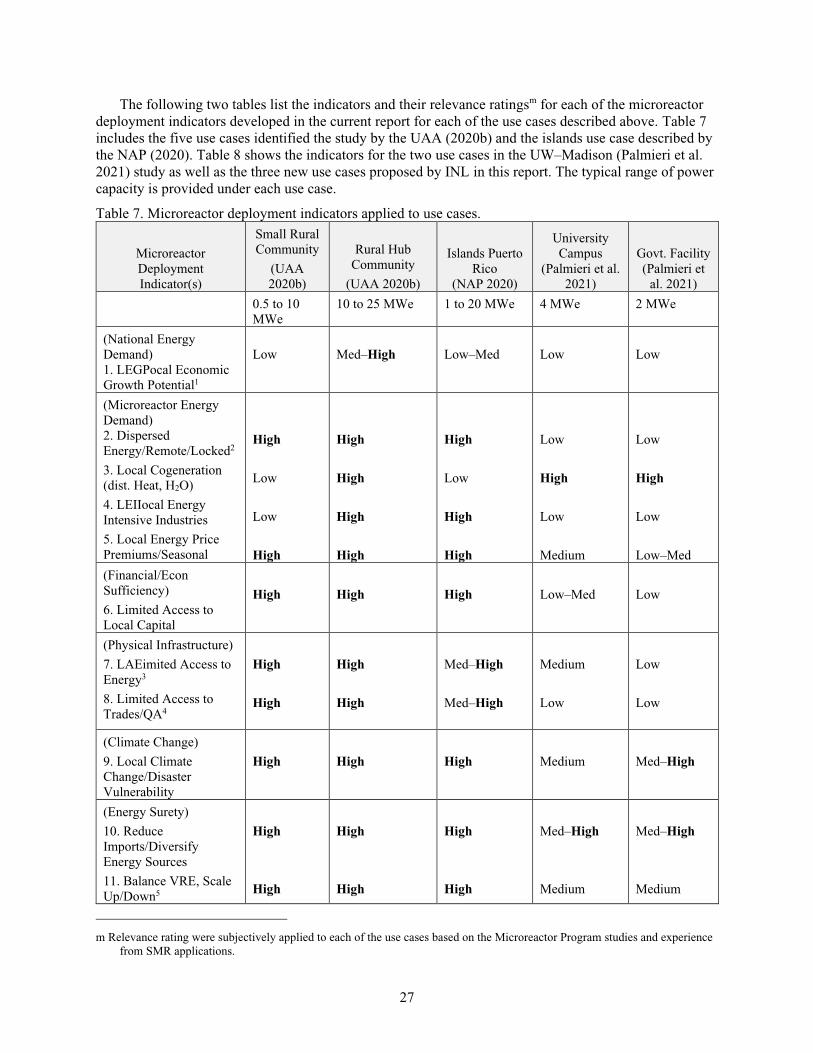
27
The following two tables list the indicators and their relevance ratingsm for each of the microreactor
deployment indicators developed in the current report for each of the use cases described above. Table 7
includes the five use cases identified the study by the UAA (2020b) and the islands use case described by
the NAP (2020). Table 8 shows the indicators for the two use cases in the UW–Madison (Palmieri et al.
2021) study as well as the three new use cases proposed by INL in this report. The typical range of power
capacity is provided under each use case.
Table 7. Microreactor deployment indicators applied to use cases.
Microreactor
Deployment
Indicator(s)
Small Rural
Community
(UAA
2020b)
Rural Hub
Community
(UAA 2020b)
Islands Puerto
Rico
(NAP 2020)
University
Campus
(Palmieri et al.
2021)
Govt. Facility
(Palmieri et
al. 2021)
0.5 to 10
MWe
10 to 25 MWe 1 to 20 MWe 4 MWe 2 MWe
(National Energy
Demand)
1. LEGPocal Economic
Growth Potential1
Low
Med–High
Low–Med
Low
Low
(Microreactor Energy
Demand)
2. Dispersed
Energy/Remote/Locked2
3. Local Cogeneration
(dist. Heat, H2O)
4. LEIIocal Energy
Intensive Industries
5. Local Energy Price
Premiums/Seasonal
High
Low
Low
High
High
High
High
High
High
Low
High
High
Low
High
Low
Medium
Low
High
Low
Low–Med
(Financial/Econ
Sufficiency)
6. Limited Access to
Local Capital
High
High
High
Low–Med
Low
(Physical Infrastructure)
7. LAEimited Access to
Energy3
8. Limited Access to
Trades/QA4
High
High
High
High
Med–High
Med–High
Medium
Low
Low
Low
(Climate Change)
9. Local Climate
Change/Disaster
Vulnerability
High
High
High
Medium
Med–High
(Energy Surety)
10. Reduce
Imports/Diversify
Energy Sources
11. Balance VRE, Scale
Up/Down5
High
High
High
High
High
High
Med–High
Medium
Med–High
Medium
m Relevance rating were subjectively applied to each of the use cases based on the Microreactor Program studies and experience
from SMR applications.

28
Microreactor
Deployment
Indicator(s)
Small Rural
Community
(UAA
2020b)
Rural Hub
Community
(UAA 2020b)
Islands Puerto
Rico
(NAP 2020)
University
Campus
(Palmieri et al.
2021)
Govt. Facility
(Palmieri et
al. 2021)
12. Local Critical
Loads/Critical Facilities
High
Medium
High
High
High
Table 8. Microreactor deployment indicators applied to use additional use cases.
Microreactor
Deployment
Indicator(s)
Regional Utility
(Railbelt)
Energy
Producer
(UAA 2020b)
Urban
Center
(Megacity)
(INL)
Remote
Mining
Operations
(UAA
2020b)
Military
Installation
(UAA
2020b)
Disaster
Relief
(INL)
Marine
Propulsion
(INL)
170 to 566 MWe
<5 MWe 10 to 40 MWe
7 to 40 MWe
<<1 MWe >20 MWe
(National Energy
Demand)
1. Local Economic
Growth Trends1
Medium
High
Low
Low
Low
Low
(Microreactor Energy
Demand)
2. Dispersed
Energy/Remote/
Locked2
3. Local
Cogeneration
(dist. Heat, H2O)
4. Local Energy
Intensive Industries
5. Local Energy Price
Premiums/Seasonal
Low
Low
Low
Medium
Low
High
High
Medium
Med–High
High
High
High
Low–Med
Medium
Low
Medium
High
High
Low
High
High
Low–Med
Low
Med–High
(Financial/Econ
Sufficiency)
6. Limited Access to
Local Capital
Low
Low–Med
Low
Low
High
Low–Med
(Physical
Infrastructure)
7. Limited Access to
Energy3
8. Limited Access to
Trades/QA4
Low
Low–Med
Low
Low
High
High
Medium
Low
High
High
Low
Low

29
Microreactor
Deployment
Indicator(s)
Regional Utility
(Railbelt)
Energy
Producer
(UAA 2020b)
Urban
Center
(Megacity)
(INL)
Remote
Mining
Operations
(UAA
2020b)
Military
Installation
(UAA
2020b)
Disaster
Relief
(INL)
Marine
Propulsion
(INL)
(Climate Change)
9. Local Climate
Change/Disaster
Vulnerability
Med–High
High
High
High
High
Med–High
(Energy Surety)
10. Reduce
Imports/Diversify
Energy Sources
11. Balance
Intermittent
Renewables/
Scalability5
12. Local Critical
Loads/Critical
Facilities
High
Low–Med
High
Med–High
Low–Med
Med–High
High
High
High
High
Low–Med
High
High
Med
High
High
Low
Low
The following sections describe these use cases and the applicability ratings (high, medium, low) of
the 12 microreactor indicators for each use case. This is followed by a description of the data sources and
methodology used in this report to assess the deployment potential of microreactors across the 63 existing
and emerging nuclear power countries.
5.2.1 Use Case: Small Rural Community
Many regions across the globe are characterized by having dispersed populations living in small
communities with energy supplied via small, islanded microgrids. As noted in the UAA (2020b) report,
Alaska has over 100 of these communities. They are generally isolated from ground transportation, with
access by air and, occasionally, by barge. They have a very high reliance on diesel power generation, with
100%of electric production coming from diesel in most communities. A very small percentage of power
is supplied by wind-diesel hybrid systems in a few communities. The UAA (2020b) study notes the high
costs of diesel fuel, coupled with the high maintenance and operations costs mean high energy prices are
significantly higher in these communities than elsewhere, ranging on the order of $0.55–$0.75/kWh,
significantly higher than the rest of the state and the average U.S. price for residential electricity. Energy
usage in these communities is primarily residential, with some community usage from schools, water
treatment, and health clinics that require constant power and, in some cases, with an associated
agricultural or industrial facility of modest size. Household incomes and levels of education are below
both state and national levels and, coupled with small populations, local workforces are also less formally
trained and diverse than elsewhere. These factors suggest limited local project financing and technical
resources are available in small rural communities. (UAA, 2020b).
In terms of the applicability of microreactor indicators to this use case, the following are deemed to
be particularly relevant. The indicators Dispersed Energy/ Remote/Land/Locked and Limited Access to
Energy are both highly associated with this use case due to the remote and dispersed nature of the
population and energy landscape. Given the high costs of energy in these areas, the Local Energy Price
Premiums/Seasonal is an important indicator. Similarly, the indicators Limited Access to Local Capital,
Reduce Energy Imports/Diversify Energy Sources, and Local Critical Loads/Facilities coincide with the
conditions of this use case. Along similar lines, the indicator Limited Access to Trades/QA is deemed to
be important for this use case given the relatively low levels of labor force diversity as well as formal,

30
post-secondary education and training in many of these communities.n The UAA (2020b) study notes that
the percentage of renewable energy production in small rural communities in Alaska is minimal (but a
growing number of wind and solar projects are installed each year) due in part to the unavailability of
qualified operations and maintenance personnel as well as climate conditions. These types of
communities on a global basis are increasingly utilizing renewable energy in localized microgrids.
Further, the ability of microreactors to scale to local energy needs is important for these types of
communities. Therefore, the indicator Balance Intermittent Renewables/ Scalability is rated to be highly
associated with this use case. Finally, the vulnerability of remote communities to fuel supply and other
disruptions points to the designation of Local Climate Change/Disaster Vulnerability as a highly ranked
indicator for this use case.
5.2.2 Use Case: Rural Hub Community
The Rural Hub Communities Use Case in the UAA (2020b) study shares some common features with
the small rural communities described above. They are typically remote, with household income and
formal education levels below the state average. The latter feature also means that these communities
have smaller, less diverse, and less formally trained labor forces than in other areas. Rural hub
communities are typically in the thousands of people, as compared to small rural communities that are
generally in the range of a few hundred people. Along with larger populations, there is a wider range of
energy usage and commercial activities in the Rural Hub Community Use Case. Residential usage is
typically less than half of electricity sales, exceeded by community usage, such as education, local
government, and health services, as well as commercial usage. The latter includes fish processing
facilities which constitute large, but seasonal, power demands in several hub communities. As with the
Small Rural Community Use Case, most hub communities rely on diesel fuels for power production,
although some operate wind-diesel hybrid systems with diesel required to provide backup power when
needed (UAA, 2020b). The high reliance on diesel means energy prices are higher in hub communities
than elsewhere in the state or nationwide, with residential rates generally in the $0.38–$0.48/kWh range.
Given the similarity of these hub communities with the small rural communities, these use cases share
several of the microreactor indicators with high relevance. These include Dispersed Energy/
Remote/Land/Locked, Local Cogeneration, Local Energy Intensive Industries, Local Energy Price
Premiums/Seasonal, Limited Access to Local Capital, Limited Access to Energy, Limited Access to
Trades/QA, Local Climate Change/Disaster Vulnerability, Reduce Energy Imports/Diversify Energy
Sources, Balance Intermittent Renewables/ Scalability, and Local Critical Loads/Facilities. Some
differences between these are reflected by changes in the ratings of some of the other indicators. The
Local Economic Growth Potential indicator, rated as having low applicability to the Small Rural
Community Use Case, is rated higher here. Given the larger market size and share of industrial and
commercial usage, strong economic growth in hub communities is more likely to occur along with
increased need for new energy sources. Similar reasoning applies to the higher relevance for the Local
Cogeneration and Local Energy Intensive Industries indicators.
5.2.3 Use Case: Regional Utility (Railbelt) Energy Producer
As noted in the study by the UAA, the state’s energy usage pattern consists primarily of two types.
The first is the ‘Railbelt’ wherein most of the Alaska’s population lives proximal to the road system that
connects Southcentral Alaska with part of the state’s interior (UAA 2020b). Of the state’s 732,000
population in 2019, the UAA study estimated 550,000 individuals live within the Railbelt. The labor pool
is deeper and more diverse than the more isolated communities described above and, as a result, the
availability of trained personnel for operations and maintenance activities for new energy sources is
greater. However, as noted by the UAA (2020b) study, the requirements for advanced nuclear reactor
n The potential for training the local workforce for specialized skills merits further attention since remote populations are
generally more self-sufficient.
31
systems are still unclear and having workforce flexibility and training will be important for microreactor
deployment. In terms of the energy production profile, there are five separate utilities providing power to
the Railbelt that are interconnected and able to buy and sell power from each other. Approximately 68%of
the power in the Railbelt comes from natural gas, with four of the five utilities able to purchase and utilize
natural gas. Diesel and coal fossil fuel provides 20% of power, 10% comes from hydro, and wind and
batteries account for just 3%of Railbelt power production.
With over two-thirds of Railbelt power coming from natural gas, electricity prices are lower than in
the Small Rural and Rural Hub Communities Use Cases discussed above. They are, nonetheless, still
higher than U.S. average rates, with residential electricity prices ranging from $0.28/kWh to $0.20/kWh
across the five utilities. However, as noted by the UAA (2020b) study, the heavy reliance on two
imported fossil fuels, with over 80%of power production coming from natural gas and diesel, resiliency
issues have been of concern to policymakers in the state, with the potential for resiliency gaps coming not
only from periodic disruptions of the fuel supply chain but also by the declining production of natural gas
from Cook Inlet, which supplies Railbelt utilities. Resiliency is of further concern given the profile of
Railbelt power purchasers. Unlike the Small Rural and Rural Hub Communities, for which energy use
consists almost exclusively of residential power consumers, Railbelt power consumption on the part of
commercial users is significantly higher than residential sales in four of the five Railbelt utilities. These
commercial users include a several large industrial users, including mines, as well as hospitals and
military installations (UAA 2020b).
Given the characteristics of Railbelt power production and consumption, the Reduce Energy
Imports/Diversify Energy Sources is highly relevant given the heavy reliance on imported fossil fuels.
Similarly, given the usage by industrial, commercial, hospitals, and military installations, the indictor
Local Critical Loads/Facilities is also deemed here to be highly relevant. In addition, the following
microreactor deployment indicators are deemed here to have medium relevance: Local Economic Growth
Potential; Local Energy Price Premiums/Seasonal; Limited Access to Trades/ QA; and Local Climate
Change/ Disaster Vulnerability.
5.2.4 Use Case: Remote Mining Operations
Remote mining operations represent a major potential source of microreactor deployment potential.
The characteristics of many of these operations are consistent globally. They are often highly energy
intensive and account for the largest single power users in each region. They are often isolated from
electric grids but, even when connected to an external power grid, they generally require a redundant and
self-generating power source to ensure continuous operations. Demographically, these locations look
much different from the three use cases described above as these are not community setting but, rather,
industrial installations. As a result, unemployment is near zero and incomes are relatively high. For
example, as noted in the UAA (2020) study, wages in the Alaskan mining industry average nearly
$133,000 annually. As with remote Small Rural and Regional Hub communities, power production is
almost entirely from diesel. The ability of some of these mines to acquire bulk purchase discounts means
that energy prices are somewhat lower than those of Small Rural or Rural Hub communities. The UAA
(2020) study estimates that diesel-dependent energy costs are likely to be in the $0.20 - $0.35/kWh range.
While a very few mining operations have generation a capacity more than 200 MWe, most are much
smaller. Of the mines referenced in the UAA (2020) study, electric power capacity ranges from 10 to 40
MW. In addition to providing power, additional diesel is used to provide heat and transportation.
Remote mining operations share several of the microreactor indicator ratings with the Rural Hub
Community use case. Thus, these indicators are rated as being highly correlated with this use case:
Dispersed Energy/ Remote/Land/Locked, Local Co-Generation, Local Energy Intensive Industries, Local
Energy Price Premiums/Seasonal, Limited Access to Energy, Limited Access to Trades/QA, Local
Climate Change/Disaster Vulnerability, Reduce Energy Imports/Diversify Energy Sources, Balance
Intermittent Renewables/ Scalability and Local Critical Loads/Facilities. The following differences are
32
noted. Given the industrial nature of these locations and their economic viability being generally
dependent on global market prices, the Local Economic Growth Potential is not rated highly for this use
case. Similarly, local access to capital is much less of a concern for these large mining operations, most of
which are owned, at least in part, by large corporations.
5.2.5 Use Case: Military Installations
The last microreactor use case identified in the University of Alaska study is Military Installations.
As in many such installations globally, these facilities in Alaska are often isolated and subject to harsh
conditions. Energy usage derives from a wide range of needs, including residential heat and power,
transportation, and base operations. In Alaska, there are nine major military installations and several other
small ones located across the state. The peak capacity usage for the installations provided by the UAA
(2020) study range from 2.4 to 18.4 MWe, with installed capacity ranging from 7.4 – 33.5 MWe. As with
all such facilities, energy security is vital and resiliency regarding potential disruptions are critical. While
most power, heat and transportation needs are produced by natural gas and coal, where available, and by
imported diesel fuel and heating oil. Some base power comes from local utilities. Given the critical
requirement of energy security and resilience, the reliance on imported fossil fuels is problematic with the
chance of supply chain disruptions, as is the partial reliance on power supplied from local utilities for
some of these installations. The critical nature of energy security is noted by both the Department of
Defense and the Department of Homeland Security, with independent operations indicated as a goal and
planning objective. In addition to independence, fuel security, power availability, infrastructure
capabilities, and physical and cyber security are all viewed as critical elements of energy security for
military installations.
Given the unique needs of military installations, only three of the microreactor deployment indicators
are deemed to have high relevance for this use case. These are Local Climate Change/Disaster
Vulnerability, Reduce Energy Imports/Diversify Energy Sources, and Local Critical Loads/Facilities. The
Dispersed Energy/ Remote/Land/Locked, Local Co-Generation, and Limited Access to Energy indicators
are deemed to have medium applicability to this use case, while the remaining microreactor indicators are
viewed as having only low or no applicability to decisions regarding microreactor deployment on military
installations.
5.2.6 Use Case: Islands
Puerto Rico’s Nuclear Alternative Project (NAP) began in 2015 to examine the innovations and
capabilities of advanced nuclear reactors and their prospects for future domestic energy production. Idaho
National Laboratory is one of the principal sponsors of the project. This tool on increased importance in
the aftermath of Hurricane Maria in 2017 and the over 3,000 deaths attributed to the lack of electricity
and basic services (NAP, 2020). Some of the key features of Puerto Rico’s energy landscape include the
age and outage frequency of its power plants, the necessity of having a steady baseload of energy
production, the projected lack of growth of Puerto Rico’s energy demand over the coming decades, a high
reliance on imported fossil fuels for energy production, the vulnerability to oil and gas supply disruptions
due to natural events, and the high price of electricity on the island. Global spikes in oil prices resulted in
severe supply-side shocks to the Puerto Rican economy, exposing its vulnerability from dependence on
imported fossil fuels. In addition, the widespread destruction of the island’s energy infrastructure made
apparent the dangers of the island’s aging and centralized grid system. As a result, the Puerto Rican
government initiated an investigation of avenues to “transition from a centralized system dependent on
fossil fuels to a distributed system centered on clean energy” (NAP 2020, p. 15).
Of the microreactor indictors identified in the current study, only two, Local Economic Growth
Potential, and Local Co-Generation, are deemed to have low or medium applicability to the Islands Use
Case. For the first of these, the Puerto Rico Electric Power Authority projects a substantial decrease in
Puerto Rico’s net total electric load over the next two decades due to Puerto Rico’s staggering and
ongoing debt crisis, long-standing economic downturn, and population decline. As part of its efforts to

33
address the island’s ongoing debt problems, the U.S. Congress’s Federal Oversight and Management
Board (FOMP) is endorsing the modernization of the island’s electrical generation and grid system as a
means of promoting economic growth and foreign investment. However, in other island locations, local
economic growth may indicate the need for new incremental energy production. For the Local
Cogeneration indicator, district heating is not viewed as a demand driver for most island locations. The
remaining indicators are deemed to have high applicability for Islands Use Case deployment.
The following sections describe four additional use cases. Two of these stems from a study by the
UW–Madison on the potential of microreactors on government facilities and university campuses. This is
followed by brief descriptions of two additional use cases proposed by INL as part of the present study.
Following this, two additional use cases are proposed in this report. These involve the pre-deployment of
microreactors to high-risk areas and the use case of microreactor usage proximal to urban centers and
megacities.
5.2.7 Use Case: Government Facility
The UW–Madison, with support from Idaho National Laboratory, studied the potential of
microreactors to provide power for USG facilities. As noted in the study, nearly all federal government
facilities purchase power from off-site electric utilities. At the same time, these facilities provide for
backup power production typically through diesel or natural gas generators. Increasing amounts of
activities at many of these facilities, such as data centers, laboratories, hospitals, etc. have increased the
need for energy security at these facilities. At the same time, however, the generators and other elements
of the backup power systems are aging. The UW–Madison study examined using of microreactors in on-
site microgrids to provide back-up power as well as complement the power purchased from utilities. By
doing so, the use of microgrids not only reduces the reliance on off-site power purchases but, at the same
time, increases the resilience and security of energy supply at these facilities.
The study compares a status quo scenario of a utility as the primary power provider, with backup
generators running on diesel or natural gas and three other scenarios having different levels of power
provision from on-site microgrids. In one of these scenarios, on-site microgrids provided the critical
power needs of the facility by running continuously with the utility providing the rest of the required
power, with each source serving as a backup for the other. In another scenario, the on-site microgrid
provides critical power with the utility supplying the rest of the required power plus backup. In the last
scenario, government facilities are taken off-grid with the on-site microgrid providing all required power
plus increased capacity to provide backup power. The study found that, depending on the ability to obtain
a low rate of interest for financing the construction of the microreactor, the use of microgrids with
microreactors can be cost competitive with status quo cases in which backup power is provided by diesel
generators and could also be cost competitive with natural gas generators. The UW–Madison study
identifies more than 200 government facilities with average total power demands of 4 MW or greater,
where microreactors of 2 MW capacity would be right-sized to cover the critical loads for many of these
facilities, with larger facilities using multiples of microreactors and with the largest government facilities
using microreactors with greater than 2 MW output. In the two scenarios in which microreactors are only
providing critical power, this therefore projects a potential market of more than 200 microreactors over
the next 10–20 years. If on-site microgrids powered by microreactors are used to provide all required
power plus backup power, the potential market over the next 10–20 years would be twice that amount.
In the use case of government facilities, several of the microreactor indicators are viewed as having
low applicability. As these facilities are independent of local economic conditions, the Local Economic
Growth Trend indicator is not consequential. The Dispersed Energy/Remote/Land/Locked and LAE
indicators have low applicability here given that all these facilities have access to utilities. Their being
financed, operated, and staffed by the federal government implies low applicability for the indicators
LEII, Limited Access to Local Capital, and Limited Access to Trades/QA.

34
With the varied activities and needed applications of energy at these facilities, the Local
Co-Generation indicator is viewed here as highly applicable. Similarly, the Local Critical
Loads/Facilities indicator is highly relevant due to the need for energy security and resiliency. In a similar
vein, where these facilities are in areas subject to natural hazards, the need for energy security and
resiliency is greater. Thus, the Local Climate Change/ Disaster Vulnerability indicator will have greater
relevance in such areas but lower applicability in other areas. Further, while the operations of these
facilities are funded by the government, facilities managers are likely to take price premiums for fossil
fuels used to power backup generators into account when making energy supply decisions. Thus, the
Local Energy Price Premiums/Seasonal indicator may have medium relevance in some areas. Finally,
while using renewables is limited at federal facilities, the ability to scale power supply is likely to be
important, with the indicator Balance Intermittent Renewables/ Scalability ranging from low to high
degrees of relevance.
5.2.8 Use Case: University Campus
An additional use case briefly examined in the UW–Madison study is university campuses. The
characteristics and energy needs of this use case are generally like those of the Government Facility Use
Case. However, the differences between these two use cases imply differences in the applicability of three
microreactor indicators. Since the funding for the operations of universities is more local than for federal
facilities, the incentives to reduce energy costs is likely higher for campuses. Thus, the Local Energy
Price Premiums/Seasonal indicator may range up to high levels of relevance in some areas. Similarly, the
Limited Access to Local Capital indicator is judged to be of medium relevance for campuses, as opposed
to low relevance for government facilities. Lastly, the indicator Balance Intermittent Renewables/
Scalability has the same range of applicability for campuses as with government facilities but for
somewhat different reasons. While the use of renewables is relatively low for government facilities, their
use is increasing for many university campuses. As a result, campuses with increased levels of renewable
energy production will have increased incentive to adopt microreactors for load-following.
The following three use cases are proposed by INL as part of the development of this report. They are
presented as possible additional uses of microreactors along with the rationale for their consideration.
These three applications have not been evaluated as completely as the previous eight uses cases but are
presented for completeness and to expand the views on how microreactors may be used. Subsequent
detailed analysis may be required to assess their viability.
5.2.9 Use Case: Resilient Urban Applications
There has been dramatic growth in urban areas over recent decades and this trend is expected to
continue with an estimated 67% of the global population living in cities by 2050 (UN DESA 2018b).
Coincident with the growth of both population and economic activity is an increase in energy demand.
This is especially true in areas with EII and for industries where CHP processes are important. However,
the ability to increase energy production and distribution from large power plants and existing grids in
megacities is often limited because of the lack of available land and reliable transmission infrastructure.
This is similarly true for the development of new energy sources from renewables in such areas. Problems
with a lack of reliable energy is especially prominent in areas prone to disruptions from natural disasters.
Given these considerations, the following indicators were deemed to be highly applicable to this use case:
Local Economic Growth Potential, Local Cogeneration, Local Energy Intensive Industries, and Local
Climate Change/ Disaster Vulnerability. Since the development of new facilities for which energy
security may be important, the indicator Local Critical Loads/Facilities may range from medium to high
in applicability. The remaining indicators are judged to have low to medium relevance for this use case.
Further details for the Resilient Urban Use Case as described under profile markets, in Section 6.1.3.

35
5.2.10 Use Case: Disaster Relief
This use case focuses on the potential of microreactors to reduce the harm caused by natural disasters,
including hurricanes and typhoons, wildfires, earthquakes, and floods. On average, natural disasters kill
more than 60,000 annually with some years having more than a million deaths (Ritchie and Roser 2019).
Such disasters affect the populations in low-to-middle income regions most severely, both in terms of
deaths and widespread damage, where the infrastructure to protect and respond to such events is lacking.
An example in such areas is 2013’s Typhoon Haiyan in the Philippines, causing approximately 7,000
deaths and nearly $3 billion in damage. While most of these occurred during the typhoon itself, the
damage to the area’s infrastructure and energy supply resulted in the long-term displacement of more than
4 million people. While the death tolls from natural disasters in generally lower in higher income
countries, the damage to a region’s infrastructure and energy supply can be both significant and long
lasting. One example, described in the Islands Use Case, is 2017’s Hurricane Maria in Dominica and
Puerto Rico in which nearly 3.5 million people went without power for months with power loss attributed
to many of the estimated move than 4,500 deaths from the storm (Kishore, et al. 2018). Similarly, the
damage to the energy supply system in the Eastern United States led to widespread power outages and
loss of heat, resulting in over 100 deaths in New York and New Jersey from exposure and related
conditions.
Currently, emergency power is provided by portable generators fueled by gasoline, diesel, natural gas,
or others (liquid-propane gas, propane, and biodiesel). They are typically classified as below 5 kW, 5–
10 kW, and 10–20 kW to service residential, commercial, and industrial uses. The growth of the
residential end-user segment is attributed to the unreliability of power grids particularly in areas prone to
natural disasters and abrupt power outages. Portable generators used by residential end users most
commonly range up to 6 kW. Such generators are used in residences for running a range of appliances,
such as lights, refrigerators, sump pumps, heaters, TVs, water purifiers, and air conditioners in emergency
situations. These generators have an average running time of 10–12 hours with a single filling of the
tank.o
The mobile nature of microreactors would allow them to be deployed to provide power and heat
either independently or in a microgrid. They could be pre-deployed prior to the onset of forecast events or
as a rapid response after a natural disaster or environmental change. In addition to providing critical
power to needed stationary and mobile facilities such as hospitals and communications centers,
microreactors can be deployed to provide power for desalination, heating, and other critical needs.
Of the microreactor deployment indicators, the Local Climate Change/ Disaster Vulnerability is, of
course, ranked very highly relevant to this use case. Of the remaining microreactor indicators, the
following are viewed here as being highly relevant to this use case: Dispersed
Energy/Remote/Land/Locked, Local Cogeneration, Local Energy Price Premiums/Seasonal, Limited
Access to Local Capital, LAE, Limited Access to Trades/ QA, Reduce Energy Imports/Diversify Energy
Sources, and Local Critical Loads/Facilities.
Further details for the disaster relief use case as described under profile markets, in Section 6.1.4.
5.2.11 Use Case: Marine Propulsion
While the use cases discussed thus far focus on electricity production and cogeneration, other sectors
of the global economy must be addressed if the goals of the IPCC are to be met. One of these is the fuels
and transportation sector. As noted by Lucid Catalyst (2020) and others, significant efforts are underway
to develop the use of carbon-free fuels such as hydrogen and ammonia to replace oil and gas in shipping,
aviation, and ground transportation. For commercial marine transportation, most ships are powered by
o Refer to Portable Generator Market: https://www.marketsandmarkets.com/Market-Reports/portable-generator-market-
195875841.html

36
diesel-electric systems in which generators, typically fueled by diesel or bunker fuel, generate electric
power to propel the ships. To accomplish the steps needed to achieve global net-zero carbon emissions by
2050, as recommended by the IPCC, the replacement of these fuels in the marine transportation sector is
needed. Hydrogen is a promising carbon-free energy source for some applications but is likely not
suitable to marine transportation due to issues around its storage and long-distance transportation.
Ammonia, however, is an indirect hydrogen storage medium with well-known transportation and storage
properties and ideal for solid state fuel cells (Jeerh et al. 2021). The use of ammonia in solid state fuel
cells suitable for commercial marine transportation usage is being actively investigated and may supply
about half of the carbon-free energy for marine propulsion by 2050 (World Bank 2021). Production
facilities for ammonia and hydrogen fuels typically require significant power, often more than 200 MWe,
and are therefore not coincident with the use of microreactors. However, microreactors are capable as a
direct drive option for marine transportation.
This use case is based on microreactors expanding beyond military application to commercial
shipping. The advantage of a nuclear-powered ship is the avoidance of storing large and fluctuating
quantities of bunker fuel. Nuclear propulsion for military marine transportation, including submarines,
ships and aircraft carriers has occurred for decades. The U.S. built the nuclear ship Savannah as a
passenger/cargo ship, Germany built the Otto Hahn, which carried ore for nearly a decade; Japan built the
Mutsu, which was decommissioned after a single test run; and Russia built the Sevmorput, which carried
cargo until 2012p. The NS Savannah, shown in Figure 5 en route to the World’s Fair in Seattle in 1962,
was built as a proof of concept to prove the viability of nuclear-powered ships for civilian purposes as
part of the Atoms for Peace project. The 74 MW powered ship fulfilled the promise of low fuel use but
had trouble carrying its liquid nuclear waste, had limited capacity as a cargo ship, and required larger
crews than comparable sized ships. As a one-of-a-kind vessel, port facilities were limited to provide fuel
services. For economic reasons, after eight years of service the vessel was decommissioned in 1971 and is
now a National Historic Landmark in Baltimore MD.
p Refer to Flexport: https://www.flexport.com/blog/nuclear-powered-cargo-ships/

37
Figure 5. Nuclear Ship Savannah, the first commercial nuclear-powered cargo vessel (Wikipedia).
Other countries have continued development of non-defense nuclear-powered ships. Russia deploys
nuclear-powered icebreakers along the Northern Sea Route in the frozen Arctic waterways north of
Siberia. The economics in this case favor nuclear propulsion over diesel powered ships with heavy fuel
demands, range limitations, and difficulty of refueling in the Arctic region.q Russia is also converting
some reactors from land to marine use, like the Russian KLT-40S floating power plant providing
70 MWe through power coupling at shore docking facilities. Note the KLT40S is not propelled by nuclear
power but uses conventional sources (IAEA 2020a).
Three of the microreactor indicators are deemed to have high relevance to this use case. These are the
Dispersed Energy/Remote/Land/Locked, the Local Energy Price Premiums/Seasonal, and Local Climate
Change/Disaster Vulnerability indicators, as shown in Tables 7 and 8.
Further details for the Marine Propulsion Use Case as described under profile markets, in
Section 6.1.5.
5.3 Assessment of Use Cases
In this section, the deployment indicators described are used to assess the potential use of
microreactors for each of the use cases applied to the 63 countries in Table 6. The analysis and use of
indicators employed here were chosen because of their applicability to decisions regarding microreactor
use, and due to the availability of data for each indicator. This section of this report provides a description
of how the indicators and associated data can be used in assessing the conditions relevant to microreactor
deployment.
q Refer to Wikipedia: https://en.wikipedia.org/wiki/Nuclear-powered_icebreaker

38
5.3.1 Indicator Data Sources and Ranking
For the assessment of microreactor deployment potential, countries were scored using a decile system
for each indicator. Those achieving the most favorable decile for each indicator were awarded a score of
10 with the least receiving a one. The following section describes the data sources and ranking method
used for each of the 12 deployment indicators.
5.3.1.1 Local Economic Growth
As described in Section 4 of this report, this indicator represents economic growth and the
commensurate growth in household, commercial and industrial energy use. Local energy demand may
result from regional economic activity, the development of new industries, population growth or new
energy demand due to societal climate migration or rapid urbanization to megacities. The data source for
evaluating this indicator is the World Bank Databank, GDP Growth (annual %). To measure the trend in
economic growth, this report averages economic growth over a five-year period. The most complete data
for the 63 countries of interest to this report are from the 2010–2015 period, and this time frame is used to
evaluate this indicator. Countries with the strongest economic growth over this period are ranked higher
than those with slower economic growth.
5.3.1.2 Dispersed Energy/Remote/Locked
This indicator represents energy systems with dispersed or isolated electrical generating capacity,
limited access or infrastructure, and few domestic energy sources. These include remote locations,
emerging economies with dispersed energy systems and microgrids, and areas with sea or land-locked
geography. Given the characteristics of microreactors, electricity systems with a more dispersed
generating capacity are more likely target markets for this technology than more centralized systems. Two
data sources are used to evaluate this indicator. To quantify measure the dispersed nature of population
and electricity demand, data from the World Bank Databank’s measure of rural population (% of total
population) is used. Countries with a higher percentage of their population living in rural areas are ranked
higher than countries with more concentrated populations. In addition, countries with more population
living on islands are also used here. The data for this are obtained from One World Nations list of island
nations by population (One World Nations 2021).
5.3.1.3 Local Cogeneration
This indicator is used to assess a non-electric application for SMRs. Two measures are used to
evaluate this indicator. The first is district heating. In cold to temperate regions, heat can be derived from
a variety of heat sources and this measure notes where heat is required nine to ten months per year due to
the coldest months with extreme low mean temperatures and where summers are cold. The data used for
this indicator are derived from an updated Köppen-Geiger scale. This uses time-series temperature and
precipitation observations to develop climate maps. To score this indicator, 10 climate classifications are
derived from mean temperature and seasonal variation. Countries in which the coldest inhabited Köppen-
Geiger classifications are present were given a score of 10 for this indicator, with progressively lower
scores for countries with climate classifications classified as temperate, arid, and tropical. Another
possible cogeneration use of energy from microreactors is desalination. Nearly 90% of the energy used
for desalination on a global basis comes from coal, oil, and natural gas. Therefore, countries that
simultaneously wish to reduce carbon emissions while maintaining or increasing their desalination
capacity can consider using microreactors for at least some of the energy mix for desalination facilities.
Data on the desalination facilities by country is available, but quite expensive. Instead, data for the
countries with the greatest desalination use was obtained from Statista and incorporated into the rankings
for this indicator.

39
5.3.1.4 Local Energy Intensive Industries
This microreactor indicator represents the opportunities for microreactors to provide energy for EII
requiring high reliability and high-capacity factors. According to the Energy Information Administration
(2016), representative industries in energy intensive manufacturing include pulp and paper
manufacturing, chemical production, petroleum refining, iron and steel manufacturing, and iron ore
production. Data on these industries by country was obtained by a variety of sources listed as follows:
• Statista (www.statista.com) for oil refining and pulp and paper manufacturing
• World Population Review (www.worldpopulation review.com) for steel production
• IndexMundi (www.indexmundi.com) for iron ore production
• Investing News (www.investingnews.com) for iron production.
Production by volume data was used to rank countries by aggregating production across these sectors.
Countries were then ranked and scored by deciles according to the total production from these industries.
5.3.1.5 Local Energy Price Premiums
As shown in Figures 1 and 2 in Section 2 of this report, the economic viability of microreactor use in
some markets depends to a large degree on the price of alternative energy forms. In remote locations
where energy production is fueled primarily by expensive diesel, the potential for microreactors is much
higher than in areas with low prices for existing power sources. Price premiums on diesel fuel, liquefied
natural gas, and energy storage improve microreactors’ economic competitiveness in the short and long
term. On a local level, where local energy price premiums are most relevant, data on energy price
variability within a country would be most useful. As these data are not available on a global basis, this
new indicator is constructed using data on electricity prices as well as diesel prices on a country-level
basis. The sources for these data are:
• Global Petrol Prices (www.globalpetrolprices.com/countries/) for diesel prices, and natural gas prices;
these data are updated on a daily basis.
• Statista (www.statista.com) for household electricity prices as of September, 2020.
5.3.1.6 Local Access to Local Capital
This indicator evaluates the capacity of an entity to raise capital to build new energy sources. While
national financial conditions are important for the ability of a country to develop capital-intensive energy
sources such as large NPPs or SMRs, these conditions are less important for microreactors given their
much smaller size and lower capital requirements. The data source used here is from the 2018 Global
Competitiveness Index from the World Economic Forum (WEF). This index is comprised of
114 indicators assessing the economic, financial, workforce, technology, and other market characteristics.
For this indicator, this report uses the WEF’s Financial Market Development category, comprised of
eight separate criteria assessing financial markets. These include the ability to obtain financing through
local equity markets, the availability of financial services local equity market, and others.
5.3.1.7 Limited Access to Energy
This microreactor-specific indicator relates to the local access to existing energy transmission and
distribution sources to support basic societal needs for clean and sustainable sources of energy. Two data
sources are used to evaluate this indicator. The first is the World Bank Databank’s listing of ‘Access to
Energy.’ This gives the percentage of the population with access to electricity. The second is an indictor
from the 2018 Global Competitiveness Index termed from the WEF. One indicator of the WEF’s
infrastructure assessment rates the ‘Quality of Energy Supply.’ For both of the data sources used to
evaluate the Limited Access to Energy indicator, a low rating is deemed favorable for microreactor

40
potential where local power availability and quality is poor given that no off-site power is needed for
startup and microreactors can provide energy where other sources are lacking in quantity or quality.
5.3.1.8 Limited Access to Trades/QA
This indicator represents the capacity for skilled, qualified trades and a supply chain needed to
support construction, operations, and quality assurance. Large nuclear and fossil fuel power facilities
require the availability of a skilled labor force and supply chain for initial construction as well as ongoing
operation and maintenance activities over the life of the facility. Given their off-site manufacturing and
ability to operate independently, microreactors may be suited to areas with low levels of (formally
trained) skilled labor force availability and limited supply chain. Therefore, two data sources inform this
indicator, both from the WEF. Labor force characteristics are assessed using WEF’s indicator termed
‘Local availability in specialized training services.’ Supply chain characteristics are evaluated with
WEF’s data on ‘Local supplier quality’ and Local supplier quantity.’ The numerical weighting for this
indicator is constructed by assigning 50% weight to the labor force characteristics data and 25% each for
the two ratings for supply chain characteristics. With reasoning similar to that for the above Local Access
to Energy indicator, a low rating for the microreactor indicator Limited Access to Trades/QA
(TRADES/QA) is deemed to be favorable for microreactor deployment given their simpler designs that
limit on-site construction activities and limited supply chain needs.
5.3.1.9 Local Climate Change/Disaster Vulnerability
This indicator captures the local vulnerability to climate change (rising sea levels, impacted
hunting/fishing/agricultural seasons, and land subsidence) and/or natural disasters (hurricanes,
earthquakes, etc.). A microreactor can quickly be deployed to a disaster area and redeployed as necessary
to new sites. The best data source for this indicator was judged to be Our World in Data, a collaborative
initiative between the University of Oxford and the Global Change Data Lab. The data on natural
disasters from this source included the number of internally displaced persons, by country, updated to
2019. In addition, data on the annual amount of economic loss from natural disasters from 2007–2018
was obtained from EM-DAT (https://public.emdat.be/). These were averaged over the 5-year period from
2013–2015, and the average economic loss by country over this period was used in the construction of
this indictor by equally weighting the number of internally displaced persons and the average economic
loss due to natural disasters.r
5.3.1.10 Diversify Energy Sources/Reduce Imports
This indicator to assesses the reliance on external sources of energy and the breadth of the energy
supply portfolio in an area. Where there is a heavy reliance on imported energy or on one or two types of
energy supply, an area is likely to have a higher probability of using microreactors to diversify its energy
production portfolio. Data for this indicator is obtained from the Energy Information Agency (2020),
which provides data on the amount of fuel used by each county to produce electricity and the percentage
of total energy production from each type of fuel. In addition, this source provides data on the amount of
energy and fuel imported. For this indicator, countries are ranked by weighting equally the percentage of
imported energy and the percentage of energy production from the top two energy sources. Countries that
have a high reliance on imported energy and with a high percentage of energy production from two fuels
are ranked relatively higher with this indicator.
5.3.1.11 Balance Intermittent Renewables/Scalability
This indicator recognizes the growth of wind and solar energy production and the commensurate need
to provide backup sources of energy when renewables are unable to produce power. Many microreactor
r Local finetuning is highly encouraged for this indicator, as it is very rudimentary. Using the number of people displaced or
economic impacts in the most recent reported disaster year does not account for the fact extreme weather events are
increasingly occurring out of step with historical trends.

41
designs are capable of load-following renewable energy and thereby provide more surety of baseload
power production. In addition, microreactors can not only address the incentive to balance with
renewables but to also to adjust to changes in energy demand with changes in load-following, ramping,
and other factors. Ideally, the abilities of microreactors to be compatible with intermittent sources of
energy as well as to scale to load over time, such as adjust to changing seasonal needs, would be assessed
with this indicator. Unfortunately, data on the needs for scalability were not found during this study.
However, the increased demand for energy technologies to balance with intermittent renewable energy
sources is assessed here by measuring the increased use of wind and solar energy production per country.
Using data from the IEA (www.iea.org), countries with higher percentages of total energy production, and
those with higher rates of growth of total energy production, from renewable energy sources are ranked
relatively high in the construction of this indicator.
5.3.1.12 Local Critical Loads/Critical Facilities
A potentially valuable feature of microreactors is their ability to operate independently from the
electric grid and to supply highly resilient power for critical loads. This includes critical facilities such as
hospitals, datacenters, certain government facilities and military installations, and disaster relief centers.
In these, and similar settings where backup power is needed to support a critical load across a distribution
area (on a microgrid or mini-grid) for important operations in case of power interruptions due to electric
utility disruptions or local conditions during and after periods of natural disaster. At the time this report’s
completion, data sources at either the regional, national, or local levels are unavailable to provide
quantitative measures for this indicator. However, this indicator is retained in the description of the
analyses of use cases and global profile markets in this report to demonstrate how local data availability
could be used by individual countries or areas to assess microreactor use.
5.3.2 Assessment of Use Cases
This study examines the potential of microreactors to offer low-carbon and flexible yet dependable
power source that can easily be transported and installed in a range of sites. Microreactors can not only
integrate in a power system with renewables but are able to provide both electric and heat energy where
needed. Their ability to operate independently to provide continuous power enables them to reduce the
risk of power disruptions. These and other features highlighted earlier in this study and coupled with the
matching of the microreactor deployment indicators with use cases, suggests microreactors have greater
potential in the following areas: to reduce vulnerabilities due to climate change and natural disasters;
diversify the energy mix with electricity and heat; be competitive in current local markets; be adaptable,
reliable, and secure; be deployed within the constraints of local infrastructures and access to capital; and
provide cost-effective alternatives where energy price premiums from other sources exist.
While these are likely the features and markets with the greatest potential for microreactors, the
deployment indicators can be used to quantitatively assess the countries and regions with greater potential
in these types of use cases and markets. To do so, this report incorporates the data from the sources and
the weighting of different data within each indictor, as described above, in order to obtain the scoring of
countries for each indicator and then identifying the countries and regions with the greatest potential for
microreactor deployment for each use case. The scoring of countries for each indicator is done based on
the decile ranking by country. As described in Section 3 of this report, a quartile-ranking system has been
used previously for the assessment of SMRs. For example, the DOC (2011) study scored countries for
each indicator based on the country’s quartile ranking, with a ranking of four (4) for the highest quartile
and one (1) for the lowest.
In Section 7.2 of this report, a decile-ranking system is used to assess microreactor potential across
use cases. Unlike previous studies by the Energy Policy Institute (2015a and 2015b) and by Black et al.
(2015), which applied equal weighting across all of the identified indicators used in those studies, the
assessment in this report weight each indicator differently across different use cases. Further, the use

42
cases are then incorporated into several global profile markets for a regional assessment of the types of
microreactor characteristics and applications across a variety of global market types.
6. MICROREACTOR GLOBAL PROFILE MARKETS
Future market shares for microreactors are not explicitly indicated in the 2020–2050 projections for
nuclear power developed by the WNA, IAEA, and IEA. In Third Way’s global market projection for
advanced nuclear power, they do not differentiate between reactor technologies; however, they reference
the U.S. Advanced Reactor Demonstration Program (ARDP)s which supports demonstration of a variety
of U.S. advanced reactor designs of various sizes, including microreactor concepts. In this section, several
new markets are explored for microreactors and their potential for global deployment. This assessment
continues in Section 7, where microreactor profile markets are matched to country needs and capabilities.
A summary of the global market for nuclear power is provided in Section 7.1.
6.1 Defining New Microreactor Profile Markets
Microreactors do not fit the mold of typical NPPs due to their very small size, modularity,
transportability/mobility, and simplicity. Therefore, it is not surprising the typical sources and
applications for these reactors do not fit within the mainstream of large baseload, fixed nuclear
applications. Instead, microreactors are more closely aligned with smaller, localized applications typically
supported by renewable energy sources. In this section, the use cases previously described in this report
are binned into profile markets that have a unique set of attributes. Profile markets use a consistent set of
multi-dimensional attributes (social, cultural, economic, timing, development potential, location
attributes, etc.) and can be used to provide insight to how microreactors may be used, and as a way to
accelerate and reduce the risk of energy transition and deployment generally. Beyond this study’s focus,
the profile markets can also provide the framework for transparent engagement, discussion, and
education, between various stakeholders including regulators, community, federal-state-local officials,
thought leaders, etc. The profile market framework is needed to inform decision-making about nuclear
power and its role in emerging and transitioning markets.
These profile markets are non-traditional from the ways that nuclear power is used today.
Microreactors are described for remote and isolated operations, emerging distributed economies; growing
urban centers/new megacities; and for maritime shipping and disaster relief. Each of these market
opportunities are described in terms of important enabling technologies, market locations, projected
markets/case studies, potential role for microreactors, potential technical limitations, and related program
studies (UW–Madison, CAES EPI, UAA, NAP, etc.). All these markets are possible for microreactors,
where competitive costs are a necessary but insufficient measure for potential success. Additional value
elements are important to factor to determine what is important in a “place-based”t market. Value
comparisons (Appendix B) between options are important for describing how markets are different, and
therefore what type of engagement, planning, approach for transition/development may be relevant. This
could also be used to assess areas of uncertainty and risk and pointing where technology, regulatory, or
other innovation might be most important. A summary of the five profile markets and corresponding use
cases are shown in Table 9.
Table 9. Use cases combined into profile markets.
Profile Market Use Cases
Isolated Operations Remote Mining Operations
Military Installations
s Refer to ARDP: https://www.energy.gov/ne/downloads/infographic-advanced-reactor-demonstration-program
t ”Place-based” refers to an approach where the technology is not imposed on the community, but the community comes to
accept the solution because they believe it is the right thing to do.

43
Federal Facilities, critical loads
University Campuses, critical loads
Distributed Energy Small Rural Community
Rural Hub Community
Islands
Resilient Urban Applications Regional Utility (e.g., Alaska Railbelt)
Megacities
Marine Propulsion Marine Propulsion
Disaster Relief Disaster Relief
6.1.1 Isolated Operation Profile Markets
Isolated operation profile markets are defined as high value facilities and operations, typically
government or industry owned, preferring 100% stand-alone operations or backup coverage for critical
loads. The microreactors could operate semi-autonomously to support remote applications and to
minimize staffing requirements. Uses include electric and heat applications. The use cases related to
isolated operations profile market include remote mining, military installations, federal facilities, and
university campuses. The Remote Mining Use Case is representative of several industries currently
considering use of remote operating centers. Isolated military installations (e.g., northerly military bases)
focus on security and readiness placing emphasis on microreactor reliability and long refueling cycles.
Federal facilities and university campuses could use microreactors with microgrids (1 to 20 MWe) for
islanding and reconnection to the grid to increase energy resiliency.
The spread of COVID-19 has resulted in renewed interest in remote operating centers (ROCs) and
how they can be better managed to maximize efficiencies and reduce the number of personnel required
on-site at any time, according to MST Globalu. McKinsey & Companyv reported companies are rapidly
advancing their capabilities for remote means of working and collaboration. ROCs present an opportunity
for mining companies to reimagine and reform the ways they operate as remote working becomes
imperative to ensuring value and sustainability.w
Companies are increasingly adopting automation and use of ROCs to improve economics, reduce
environmental impacts, and increase safety. According to International Miningx, Rio Tinto was one of the
early adopters of ROCs, introducing the world’s first fully autonomous haul trucks at its Pilbara iron ore
operations in 2008 followed by the launch of an automated hub in Perth, Western Australia in June 2010,
which controlled its rail systems, infrastructure facilities and port operations, which was 1,500 km away
from site. In July 2013, BHP followed suit, opening an automated ROC in Perth for its seven Pilbara
mines. Today, all the major players globally have introduced similar ROCs to their operations. There is
increased interest in the supply of commodities from underground such as minerals and metals. Change is
underway however as coal demand is anticipated to drop and industry consolidation results and
exploration shifts to other natural resources, such as precious minerals and rare earths needed to supply
high-tech industries including electronics, wind and solar technologies, and others.
u MST Global on the rise of remote operating centers in mining. Refer to: https://im-mining.com/2021/02/02/mst-global-rise-
remote-operating-centres-mining/
v Refer to: https://www.mckinsey.com/industries/metals-and-mining/our-insights/remote-operating-centers-in-mining-unlocking-
their-full-potential
w Refer to: https://www.miningglobal.com/technology/mckinsey-firms-must-invest-remote-operating-centers and
https://www.mckinsey.com/industries/metals-and-mining/our-insights/remote-operating-centers-in-mining-unlocking-their-
full-potential
x Refer to: https://im-mining.com/

44
According to C. Farrelly and LR Recordsy, ROC’s have also become a common practice in the
petroleum, defense, and aerospace industries, primarily to optimize their operations by maximizing the
effectiveness of scarce expertise. In upstream petroleum, a critical shortage of expertise as well as the
need for deep-water submersible facilities has forced that industry to invest in remote operations. Early
successes for existing offshore platforms have involved developing onshore collaborative ROCs, with a
few operational roles being relocated onshore. In defense, there has been a revolution in battlefield
management, with the increased use of remote sensor and communications technologies providing real-
time information back to remote command centers. While safety is a clear driver, the increased flow of
information also leads to better tactical and strategic decisions. In aerospace, there has always been an
imperative to minimize the number of people who visit a facility to install and manage the equipment.
This industry has taken the next step in developing expert systems and intelligent agents so that ROCs can
be completely unmanned with humans on call to manage anomalous events. In data centers, remote
management and automation is increasing due to the surge in remote working due to COVID-19. Data
centers are also moving to enhance resiliency by increasing automation to allow faster response to issues
not requiring human intervention.
Microreactors could be deployed in the 2030–2050 timeframe as a key component of ROC
infrastructures by providing secure, reliable, and resilient power for remote facility operations and support
digital and automated systems. In this environment, microreactors would operate at high-capacity factors
to minimize operations downtime, achieve fast maintenance turnarounds, and mobility to transportability
between resources. Microreactors would replace fossil (diesel and others) used in operations and materials
transport including driverless trucks, robotic operations, etc. They would provide a source of secure and
reliable electricity for automated facility operations, sensors for data collection, location technologies,
real-time monitoring, collaboration and knowledge networks, and secure internet functionality.
Potential ROC global markets:
• Mining, mineral exploration, replacement of fossil sources in existing mines, and new remote mines
for example in Canada.
• Petroleum, offshore petroleum facilities (this could be phased out in the future).
• Military, remote operations.
• Aerospace, unmanned remote earth-based terrestrial operations (satellite tracking, etc.).
• Data Centers.
The UAA performed use case analysis on remote mines in Alaska. The microreactor would need to be
prefabricated and pre-fueled before being deposited at a mining site and would need to support ease of
removal at the mine end of life. A microreactor could provide on-site electricity and heat at remote mines
as a replacement to expensive diesel. Microreactors sized from 1 to 20 MWe could be scaling to meet the
capacity needs of mining operations or multiple units could be deployed to support larger energy needs.
Microreactors with load-following capabilities could help accommodate fluctuations to mine power
demand. Microreactors capable of meeting the combined power and heat needs of a mine would add
value for their use; however, this would require the mine to build out the district heating infrastructure.
Operation characteristics, consistent with ROCs, require microreactors operate at high-capacity factors to
minimize impact to mine operations, operate remotely or autonomously, include security and maintenance
requirements, and support the mobility needed to move the reactor to new mining sites. Economic
operation is key to the profitability of the mine (UAA 2020b).
The UAA also studied the use of microreactors at military installations in Alaska. In military
applications, the focus is mostly on security and mission readiness: fuel security and availability, physical
y Refer to: https://www.researchgate.net/publication/260321220_Remote_Operations_Centres_-
_Lessons_from_Other_Industries

45
and cyber security, and infrastructure fit and operational capabilities. The capacity for microreactors to
operate for three years or greater without refueling would provide benefits to the mission readiness of the
installation, although some would also point to target potential. Operation of the microreactor in northerly
latitudes increases the focus on CHP applications. While costs do play a role in decision-making, it is not
the sole driver of technology implementation (UAA 2020b).
The UW–Madison studied the use of microreactors operating at federal facilities and university
campuses. The microreactor could be used to provide secure on-site power for critical loads to increase
resiliency. These types of uses could include microgrids to have the capability for islanding and
reconnection to the grid, local reconfiguration of generation and load power flow and control, and
seamless additions of new distributed energy resources (renewables, storage, etc.). Researchers found that
the combination of microreactors operating in a microgrid distribution system can result in a life cycle
cost benefit (Palmieri et al. 2021).
The UW–Madison studies did not find any remote federal facilities with annual energy use above 4
MW-y (DoD sites were not studied). They also looked at DOE’s Federal Energy Management Program
data for federal facilities in remote areas. They found most installations in remote areas tend to be small
for a microreactor, with a few notable exceptions such as the U.S. Coast Guard Base in Kodiak, with
electricity rates almost double the Alaskan state average (Palmieri et al. 2021).
6.1.2 Distributed Energy Profile Markets
Distributed energy profile markets are defined as less capital-intensive users including residential,
businesses, municipal facilities, and local infrastructures (water, sanitation, and communications)
requiring reliable energy sources. Microreactors could be integrated on a distributed electrical system
including renewable energy and energy storage on micro- and mini-grids. Semi-autonomous operation of
the microreactor may minimize needs for on-site operating staffs if security is aptly addressed. Uses
include electricity and heat applications where infrastructure is present (e.g., district heating and biomass
drying). The use cases related to distributed energy profile market include small rural community, rural
hub community, and islands. Small rural communities could use very small reactors (< 1MWe) as a
replacement to fossil sources and to complement wind and solar. Rural hub communities and islands
could use microreactors to help increase reliability and to support economic development. Microreactors
could improve access to energy for communities vulnerable to natural or man-made disruptive events.
Energy systems are becoming more decentralized as shares of renewable energy increase in the mix,
major transmission infrastructures become expensive to maintain and expand, and energy planners seek
new systems designs with greater resilience and energy security such as described in the NAP (2020)
study.
Microreactors could be deployed in distributed energy systems including mini/microgrids starting
around 2030 to scale up the transition to clean energy and make the next step in electrification, further
improving the quality of life for energy users. A microreactor operating independently or in combination
with renewable sources could power a microgrid to help off-grid communities in developed and
developing countries meet their growing energy needs. Microreactors are expected to have relatively high
grid inertia as compared to other distributed energy sources and therefore promote the proper autonomous
connection, disconnection, and load adjustment thus enabling better resiliency features for the
mini/microgrid (see Appendix E). Microreactors have the capacity to extend the performance of
microgrids by providing an additional source of flexible generation, compactness, and generation of heat
for commercial and industrial uses. Connecting microgrids into networks could also improve performance
and provide an alternative to the expensive expansion of the transmission infrastructure in a country. As
an example, Puerto Rico’s Integrated Resource Plan proposes building a new electricity infrastructure
with microgrids (1–20 MW) to increase resilience in response to natural disasters (hurricanes). The NAP
recommends microreactors as a good fit in these systems (NAP 2020).

46
Emerging economies are increasingly using mini-grids to address energy poverty in regions of the
world by bringing electricity to populations in remote locations where transmission lines are not
economically viable, or where power supply is unreliable and unstable, and to areas suffering from
constant power outages. According to International Renewable Energy Agency (IRENA), renewable
based mini-grids include generation capacity ranging from kW to over 100 MW (IRENA 2019). These
small energy systems interconnect loads and distributed energy resources within a defined electrical
boundary that acts as a single controllable entity with respect to the grid in such a manner as to provide no
interruption to the critical loads and distributed energy sources z. Commonly, mini-grids operate with
independence from the main grid, and as such are referred to as “off-grid” or “autonomous” mini-grids.
First and second generation mini-grids were deployed as off-grid solutions. Historically, diesel and
hydro made up the vast majority of mini-grids in rural areas in emerging countries. However, in the last
decade there has been a profound shift to solar (Herzog 2015). By the end of 2019, 55% of operating
mini-grids incorporate solar (BloombergNEF 2020a, 2020b), along with batteries, charge controllers,
inverters, and diesel backup generators. These systems help to create jobs, enhance livelihoods in
communities, and modernize the infrastructure. The mini-grids enable electric cooking in communities,
reducing the pollution from fossil heating sources. They also enable use of energy efficient appliances and
can use smart, remotely controlled electricity meters allowing customers to pay as they go.
Third generation mini-grids are now being tailored to different applications and in grid-connected
areas to increase the reliability of supply for consumers, reduce electricity bills, decrease grid
dependency, and avoid unnecessary infrastructure investments. An interconnected mini-grid can both
connect to the national or neighboring grid and operate as an autonomous unit. Leveraged by digital
technologies, mini-grids can further help integrate distributed energy resources (DERs) including low-
carbon energy technologies, storage, energy efficiency, and demand-side management to provide services
to the electric grid. The DERs use remote monitoring systems to manage the system in real time and
stimulate local economies by providing electricity and heat to produce new revenue streams.
The Energy Sector Management Assistance Program (ESMAP) (ESMAP 2019) is a global
knowledge and technical assistance program administered by the World Bank. In the ESMAP report
“Mini Grids for half a billion people,” there are currently 19,163 mini-grids that would need to increase to
64,000 mini-grids by 2030 under a new policies scenario where 26% of people gain access to energy
through mini-grids. An increase is needed to 213,000 mini-grids by 2030 for 40% of the 1.2 billion
people lacking electricity, to achieve universal access. Mini-grids are one of the three primary solutions to
achieve universal access to electricity by 2030, alongside main grid extensions and solar home systems.
ESMAP provides a breakdown of the number of mini-grids by world region in Table 10.
z Refer to: https://www.ieee-pes.org/images/files/pdf/IEEE%20QER%20Report%20September%205%202014%20HQ.pdf.

47
Table 10. ESMAP data on installed mini-grid projects, by region. (ESMAP 2019)
Mini-grids are used worldwide but are significantly used in South Asia, East Asia and Pacific, and
Africa. According to ESMAP analysis, only ten countries (Afghanistan, Myanmar, India, Nepal, China,
Philippines, Indonesia, Russia, U.S., and Senegal) make up 89% of the global total of mini-grids, with
Afghanistan and Myanmar making up nearly half of all installed mini-grids with an average size of
11 kW and 15 kW, respectively. Mini-grids range larger in the Middle East and North Africa, Latin
America and Caribbean, Europe and Central Asia, U.S and Canada, in size from about 1 MWe to 4 MWe.
Country infrastructures are expected to be improved from 2020–2030 creating the capacity to support new
commercial and industrial enterprises. Smaller mini-grids may be combined and strengthened to support
population growing energy needs. Applications of mini-grids with energy storage systems in the
Philippines and Indonesia showed 50% reduction in the use of imported diesel and resulted in end-user
cost savings of 35%, equivalent to approximately $0.09/kWh (Ahmed 2017).
According to BloombergNEF (BNEF), there are 584 known microgrids either completed or in the
pipeline providing 8.4 GW of generation capacity (BloombergNEF 2019). BNEF analysis indicates the
largest user of microgrids is the U.S. with 106 installed microgrids (489MW). BNEF states that 56 of the
off-grid projects are more than 1MW. The estimated number of microgrids is less than reported by
ESMAP, as BNEF only tracks microgrids that have two or more distributed energy sources, of which one
must be renewable, and has at least 100 kW of aggregated capacity (not counting smaller microgrids
below 100 kW in Southeast Asia, South Asia, and sub-Saharan Africa). The microgrid market is
experiencing strong demand due to concerns over energy cost savings, ensuring stable electrical supplies,
and balancing needed for sites with high penetration of VRE. BNEF expects microgrids to be one of the
key technologies in providing electricity access and estimates $38 billion investment globally from 2018
to 2030. Interestingly, the projections for projects in the pipeline suggest the size of the projects is
increasing from an average of about 3 MW/project to 10 MW/project depending on region, as shown in
Figure 6.

48
Figure 6. Number of microgrids and MW capacity in China, Australia, and sub-Saharan Africa
(BloombergNEF 2021).
Practically all rural mini-grid projects are currently being funded by international financing programs,
“without any economic or business case behind [them], from what I’ve seen in the field,” according to
Thomas Hillig, of the consulting firm THEnergy. It is a challenging model to scale up a business with
only a fraction of commitments from donor organizations so far making their way into projects (Deign
2020). As a result, a growing number of microgrid developers appear to be focusing on urban and peri-
urban markets, the latter term refers to areas on the borders between cities and rural areas. These customer
groups tend to have higher electrification requirements than do rural villagers, and thus, they provide
more consistent demand for reliable and affordable microgrid services needed to develop new economic
opportunities.
Distributed systems present challenging flexibility requirements due to higher proportion of
renewables and the geographic diversity lost by splitting the system into smaller areas. Data analyses
show significantly higher grid flexibility requirements for microgrids, as compared to full system
operation. NAP recommends SMRs and microreactors be designed as flexible as possible to contribute to
balancing of the mini-grid/microgrids net-loads. Also, for some mini-grids, it can be highly desirable for
SMRs and microreactors to be able to ramp down to zero-power output, if possible, for several hours per
day. For the temporary operation of mini-grids during emergency operation after catastrophic events,
SMRs and microreactors could, for example, perform aggressive load-following by bypassing turbine-
steam or perhaps be integrated with batteries or other flexible generators to meet the more challenging
operating conditions (NAP 2020).
49
The UAA (2020a) described Alaska’s energy landscape as made up of a dynamic patchwork of
systems, from extremely small islanded microgrids and remote mining operations to one larger
interconnected system. Alaska is home to over 100 very small microgrids serving small rural
communities with fewer than 1,000 residents isolated from the road system with air and, sometimes,
barge access. These isolated micro- and mini- grids range in size from 0.5–85 MWe, serving both
communities and industry, such as seafood processors and resource development sites (UAA 2020a).
To ease entry to energy markets, microreactors could be operated on a mini-/microgrids as part of
larger energy portfolio consisting of multiple sources to assure clients they are not experimental subjects
for new technology. In the U.S., microgrids are being deployed in California as a response to wildfires,
where Pacific Gas and Electric (PG&E) executives note “PG&E is eager to deliver the benefits of remote
grids to our customers, and we intend to expand the use of stand-alone power systems as an alternative to
certain existing distribution lines, providing enhanced reliability with a lower risk profile and at a lower
total cost” (Galford 2021). Companies such as Caterpillar see microgrid development as an additional
way to improve service to clients. Also, offering microgrids ‘as a service’ business models could simplify
customer acceptance of relatively complex systems (BloombergNEF 2018).
6.1.3 Resilient Urban Profile Markets
Globally, mass migration from rural areas into cities will create new megacities (greater than
10 million people) that can further extend the energy crisis, even as current access problems may continue
to persist. In these emerging megacities, using renewable energy to meet the basic energy needs of the
population will be challenging due to the lack of available land and infrastructure (transmission and
distribution) and the capacity to reliably stand up to natural disasters. A 2019 report from Wood
Mackenzie estimated a $1.7 billion global market as of 2018 for companies with products, services, and
financing to make electricity available both to customers off the grid and those served by unreliable
power. While roughly 1 billion people lack grid access, another billion are served by unreliable grids,
according to data from sources including the World Bank and the International Monetary Fund.
To keep up with the increased power needs of cites, new energy sources need to maintain costs of
power but also fill resiliency gaps in the system due to disruptions in the fuel supply chain. In Alaska,
policy makers are concerned about dwindling supplies of natural gas in Cook Inlet, a basin producing fuel
since the 1950s. Cook Inlet not only supplies power production but also residential and commercial space
heating needs. A number of utilities in Alaska (Chugach Electric Association, Municipal Light and
Power, and Golden Valley Electric Association serve a number of large industrial power users including
mines, hospitals, and military installations, and, therefore, a larger percentage of those utilities’ kWh sales
are attributed to commercial power usage. The Railbelt utilities are investigating options for
decarbonization and resiliency including alternative energy systems, expansion of hydro resources,
installation of energy storage, landfill gas projects, solar and wind projects. The needs of the Railbelt are
increasingly guided by cost, decarbonization, reliability, and security (UAA 2020a).

50
Microreactors deployed in the 2030–
2050 timeframe could operate as
components in embedded energy systems
(see Box A) serving the needs of urban
centers and megacities lacking energy
resources, power infrastructures, and
limited by space to site new power plants or
support large solar or wind farms.
Microreactors, also described as Nuclear
Batteries (NB), could be collocated with
end users, bypassing the need for massive
centralized infrastructure such as the
national grid, energy storage, and fuel
distribution networks (Buongiorno et al.
2021). Microreactors as described in the
Resilient Urban Use Case in Section 5.2.9
could provide the flexibility (modularity) to
scale to meet growing energy needs, require
a minimal facility footprint, and have the
flexibility to produce electricity and heat for
industrial processes and for energy storage
and conversion (H2). The microreactors, as
high-capacity energy sources in a small
package, could be embedded within city
infrastructures to power mass transit
(electric public transport and electric
vehicles [EVs]), public water treatment and
sanitation, telecommunications, public
light/heat, emergency services (hospitals),
security, and other needs. Microreactors
could additionally harden energy systems
(as compared to diesel generators) against
natural disasters and increase the system
resilience in critical services such hospitals
and critical infrastructures. Microreactors
embedded in the energy system could serve
location-specific residential, commercial,
and industrial energy needs including heat.
Electricity markets serving emerging
megacities will likely have limited access to
large shares from renewable energy and will
require additional flexibility and ability to shift between electric demands (public transport, fleet EVs,
etc.) and heat products (e.g., desalination and district heating) dependent on demand conditions.
Deep decarbonization in energy generation
and use will require not just collections of new or
better technologies connected in complex ways,
but different architectures in which they fit.
Digital technologies using secure embedded
intelligence may open a frontier of possible new
applications modules that could significantly
enable clean energy deployment in developing
economies. Microreactors using SEI could allow
for many very small (1-10 MWth) systems to be
“built in” to applications in (or processes to be
built-around) an inherent design approach, the
same way many consumer products are built
around their own energy source (batteries).
Embedded energy systems operate without as
much need for geographically disperse connected
generators (and wires connecting them) or on-site
substantial operations personnel. They are
scalable—where one can add and subtract energy
as necessary given economic conditions. They
can be deployed in a fleet-leasing business model
and creating economies of scale (number). The
owners / operators could be in a partnership of
nations guaranteeing a public corporation focused
on leasing these systems and working with the
energy user to provide what they want when they
want it without having to develop stand-alone
national nuclear energy infrastructure. This type
of application, where the process (or community
use, etc.) benefits from an energy source
“embedded” in/inherent to, the process, is very
different than systems today.
BOX A: EMBEDDED ENERGY SYSTEMS

51
Resilient urban markets could additionally be served by embedded reactors that provide heat as well
as electricity. The Massachusetts Institute of Technology (MIT) Center for Advanced Nuclear Energy
Systems conducted a study on fission batteries (FBs)aa use in industrial and commercial heat markets
supporting chemical industries, biomass drying, biofuel and hydrogen production, paper manufacturing,
food production, and other industries. They reported 4,000 industrial users (excluding utilities) in the U.S.
require more than 1 MW of heat. The main competitor in this market is natural gas with lessor
competition by biofuels, hydrogen, and grid electricity. The competitive price point for FBs is reported as
$20–50/MWh for delivered heat, and the preferred business model is a lease option that limits the
ownership obligations to the end users (Forsberg and Foss 2021).
Many countries around the world are experiencing increased water stress. According to the World
Resources Institute (WRI), 3.5 billion people could have water scarcity by 2025, and water demand may
grow by 30% by 2050. WRI reports 44 countries face “high” levels of water stress and 17 countries with
“extremely high” levels of water stress as located around the globe shown in Figure 7. Water demands for
irrigated agriculture, industries, and municipalities are exceeding supplies by greater than 80% on average
every year. Water stress exacerbated by climate change can lead to increased conflicts and political
instability (Hofste 2019).
aa Fission Batteries are nuclear reactors defined by MIT (Forsberg and Foss 2021) as having five characteristics which enable
large-scale deployment: (1) cost competitive, (2) standardized sizes for economic mass production, (3) easily installed and
removed, (4) secure and safe unattended operation and (5) highly reliable. FBs power outputs are expected between 20
MWth and 30 MWth.

52
Figure 7. Global locations of water stress (WRI).
In locations with access to water bodies, microreactors as part of an embedded energy system in
urban areas can provide heat for desalination and water purification, and electricity to run water and
sewage treatment systems.
Emerging economies in many parts of the world may not only experience energy shortages but
expose populations to natural disasters, according to United Nations (UN) DESA (UN DESA 2018a).
Natural disasters may take the form of cyclones, floods, droughts, earthquakes, landslides, or volcanic
eruptions – or a combination of those. Some large cities are exposed to as many as four or five different
types of natural disasters. These include such large urban centers as Manila, Tokyo, Santiago and
Guatemala City, capitals including Manila, Philippines; Tokyo, Japan; Santiago, Chile; and Guatemala
City, Guatemala. Megacities of more than 10 million inhabitants are more exposed (UN DESA 2017).
“Urban areas produce the majority of the world’s economic output but are home to over half the
population,” said UN DESA’s Danan Gu, lead author behind the study. “Such a concentration of people
and economic activity means that natural disasters could be potentially costlier and more lethal if they hit
cities.”

53
6.1.4 Disaster Relief Profile Markets
There is a saying “calm before the storm” that refers to a period of relative quiet prior to a time of
intense activity. These periods occur when we are about to enter a crossroad or period of transition. In a
global environment characterized by an increasing population, shifting demographics and geopolitical
centers, environmental changes, and human-caused conflicts as well as natural disasters, the pace of
change is now faster than ever before. There will be many transitions, but the role of energy is particularly
crucial. The role of energy was recognized by the UN in the adoption of the 2015 UN Sustainable
Development Goals (SDGs), where SDG#7 “Affordable and Clean Energy” was identified as central to
the achievement of the other 16 goals. Worldwide, about 1 billion people currently lack access to
electricity with over 1 billion additional people expected to lack energy in new megacities by 2030. By
2050, more than 67% of the population will live in cities. Worldwide concerns about climate change
(SDG#13) have motivated many countries to seek new clean energy sources to fuel their economies.
Nuclear is a time tested, clean energy technology, but must be re-invented to mitigate risks during these
transitions by offering greater resilience and adaptability. The UN Office for Disaster Risk Reduction
states “The human race has never before faced such large and complex threats.” There is no better time
during this relative period of calm to develop the energy technologies to meet the emerging energy needs
of a rapidly changing world (UNDRR 2019).
Microreactors as described in the Disaster Relief Use Case in Section 5.2.10. could replace portable
field diesel generators reducing vulnerability by limiting the exposure to energy blackouts and by
increasing the resilience of the energy system to adapt to environmental conditions (sea level rise,
desertification, extreme cold, wildfires, etc.). Microreactors could act as a mobile/transportable energy
source to deliver electricity and heat to meet critical needs. Envisioned applications for microreactors
include:
• Rapid response for disaster relief or quick onset environmental changes.
• Transitional energy needs of mass migration and resettlement of populations (i.e., for survival, avoid
persecution, war and other forms of systemic violence, and opportunity).
• Preemptive deployment to strategically important, however vulnerable areas to strengthen the
resilience of energy systems and mitigate from risks.
• As embedded in microgrids with Integrated Energy Systems for clean/secure urban living.
• As a source of reliable electricity to accelerate electro-mobility (public transport, fleet EVs,
commerce), particularly in emerging megacities.
• As coupled to mobile applications to provide critical needs for emergency communication, mobile
hospitals, water desalination, heating needs, and other basic services.
Electricity from new mobile energy sources powered by microreactors could help reduce global
disaster mortality, reduce the number of people impacted by disasters or environmental events, reduce
direct disaster economic loss, and reduce damage to the critical infrastructure and disruption of basic
services among the health and educational facilities. Disasters have no borders, and no place on earth is
exempt. Microreactors can stand apart in terms of their reliability, adaptability, and range of deployment
not equaled by other energy technologies.

54
6.1.5 Marine Propulsion Profile Markets
Ships are propelled by nuclear power through heat generated by a reactor to produce steam for a
turbine used to turn the ship's propeller through a gearbox or through an electric generator and motor.
Naval nuclear propulsion is used specifically within naval warships such as supercarriers. A small number
of experimental civil nuclear ships have been built (see Section 5.2.11). However, with few exceptions,
essentially all commercial ships powered today use dirty bunker fuelsbb supplied by a limited number of
oil-exporting countries. Typically, a large container ship is powered by four or five generator sets
(medium-speed, 500 revolutions per minute), fueled by diesel and creating 8–10 MW of energy each.
Most (80%) of oceangoing ships now use a diesel-electric transmission system. Diesel generators
generate the electricity, which then drives the electric engine, powering the ship's propeller.
There is a move to replace bunker fuels powering ships after 2030, according to the IEA. Zero or low-
carbon fuels are considered important to cut CO2 emissions in hard-to-electrify sectors including maritime
transport. Ammonia is proposed to supply about half the low-carbon energy needed in maritime shipping
in 2050. Ammonia is favored among a range of different zero-carbon candidate bunker fuels relating to
the fuels’ lifecycle green-house gas emissions, broader environmental factors, scalability, economic
viability, and the technical and safety implications of using these fuels. Biofuels were also considered but
are unlikely to play a big role in powering future ships due to the availability of feedstock at sufficient
scale and will be sufficiently cost competitive by 2050 (Englert 2021).
New clean fuels are not yet a reality, and their competitiveness with fossil fuels and vessels remains
unclear. Environmental regulation could help the industry overcome these barriers, but there is
uncertainty around which measures will be agreed on, and how quickly. The supply of zero or low-carbon
bunker fuels will impact the whole shipping sector including, for example, fuel producers, fuel suppliers,
equipment manufacturers, shipyards, ship owners, charterers, and shipping companies. However,
continued supply to thirsty ships with new cleaner fuels will require similar types of refueling
infrastructure as needed today for fossil derived fuels. The emergence of alternatives to bunker fuels and
the decoupling of the energy supply for shipping from oil derived fuels provides a unique opportunity for
more countries to enter this market. Potential producers in developing countries including Brazil, India,
Mauritius, and Malaysia are being considered to produce zero-carbon bunker fuels in their regional
markets.
Microreactors could be good alternative to power commercial ships to cut emissions and remove the
costly refueling infrastructure needed for liquid-based energy carriers. Designs could optimally size the
units (power/shielding/weight) for stacking together to meet the scale of different sizes of vessels. The
advantages of using a reactor includes long refueling intervals, faster transit speeds, production of heat or
cooling for cargo, faster turn-around times due to elimination of refueling, reduced draught allowing
increased cargo capacity, no need to transport huge quantities of engine fuel, and reduction of
environmental damage from fuel leakages or impacts from running aground, such as when the Exxon
Valdez struck a reef in Alaska’s Prince William Sound. Microreactors simple and compact designs could
lend themselves to fitting into the engine compartments of modern cargo vessels.
Worldwide maritime markets were evaluated for FBs by MIT (Forsberg and Foss 2021). Researchers
studied the electricity demand from ships to provide propulsion and the smaller demands from auxiliary
power. They found container ships are the largest potential user due to spending a larger relative fraction
of their time (relative to other vessels) at sea, thus a larger fraction of cost is associated with their fuel.
Relatively few ports (approximately 30) service most container ships globally, where reactor refueling
could be conducted subject to harbor regulations and international regulations (e.g., UN International
Maritime Organization).
bb Bunker fuels are marine distillates such as marine diesel oil and marine gasoil, and heavy fuel oil (HFO).

55
Countries are exploring options that could include nuclear. Singapore recently announced plans to set
up a global center to develop and coordinate solutions for decarbonization in the maritime sector.
“Maritime decarbonisation is a global challenge requiring a collective responsibility from all stakeholders
involved,” said MPA Chief Executive Quah Ley Hoon in a statement. With about 90% of world trade
transported by sea, shipping accounts for nearly 3% of the world’s carbon dioxide emissions
(Reuters 2021).
6.2 Mapping Use Cases to Global Profile Markets
In the following sections, the characteristics of each global profile market are linked with the use
cases and microreactor deployment indicators described in Section 5 of this report. Given the specific
characteristics and capabilities of microreactors, evaluating the market potential for microreactors is best
carried out by countries based on use cases and using local (subnational) data. Doing so will enable
countries to target the aspects of their energy development strategies most relevant to the use of
microreactors. As the ability to access the requisite local-level data is limited for the preparation of this
report, the approach taken here is to identify general global profile markets and evaluate which countries
and regions have the potential to benefit from microreactor deployment. Doing so provides information
for individual countries to identify the types of amenable microreactor applications that may be useful for
developing energy production strategies going forward and will also provide information to the
developers of these technologies about the microreactor characteristics. The global profile markets and
their associated use cases were indicated in Table 9.
6.2.1 Isolated Operations Global Profile Market
The isolated operations global profile market contains the four use cases that operate as independent
ROCs as described in Section 6.1.1. These are the remote mining operations, military installations,
government facilities, and university campuses. In each of these, fossil fuels, principally diesel, are used
for primary and backup energy supply and microreactors can be employed to provide a reliable energy
source that is both resilient and secure. The use cases and associated deployment indicators for this global
profile market are shown below in Table 11. The four use cases all contain common elements in terms of
operations independence to supply 100% of the energy requirements or in covering critical loads. They
could be integrated in systems with remote operations center capabilities.
Table 11. Isolated operations profile market: use cases and indicators.
Microreactor Deployment
Indicator(s)
Remote
Mining
Operations
(UAA
2020b)
Military
Installation
(UAA
2020b)
Govt.
Facility
(Palmieri et
al. 2021)
University
Campus
(Palmieri et al.
2021)
(National Energy Demand)
1. Local Economic Growth Potential1
Low
Low
Low
Low
(Microreactor Energy Demand)cc
2. Dispersed Energy/Remote/Lockeddd
3. Local Cogeneration (dist. Heat, H2O)
4. Local Energy Intensive Industries
5. Local Energy Price Premiums/Seasonal
Med–High
High
High
High
Low–Med
Medium
Low
Medium
Low
High
Low
Low–Med
Low
High
Low
Medium
cc Growth could include societal climate migration and rapid urbanization to megacities.
dd Inclusive of remote locations and those with sea or land-locked geography.

56
Microreactor Deployment
Indicator(s)
Remote
Mining
Operations
(UAA
2020b)
Military
Installation
(UAA
2020b)
Govt.
Facility
(Palmieri et
al. 2021)
University
Campus
(Palmieri et al.
2021)
(Financial/Econ Sufficiency)
6. Limited Access to Local Capital
Low
Low
Low
Low–Med
(Physical Infrastructure)
7. Limited Access to Energyee
8. Limited Access to Trades/QAff
High
High
Medium
Low
Low
Low
Medium
Low
(Climate Change)
9. Local Climate Change/Disaster
Vulnerability
High
High
Med–High
Medium
(Energy Surety)
10. Reduce Imports/Diversify Energy
Sources
11. Balance VRE, Scale Up/Downgg
12. Local Critical Loads/Critical Facilities
High
High
High
High
Low–Med
High
Med–High
Medium
High
Med–High
Medium
High
Several indicators are ranked similarly in all four of these use cases. These are Local Economic
Growth Potential, Local Cogeneration, Limited Access to Local Capital, Local Climate Change/Disaster
Vulnerability, Reduce Imports/Diversify Energy Sources, and Local Critical Loads/Critical Facilities.
The remaining indicators are treated differently in some cases. The Dispersed Energy/Remote/Locked
indicator is a highly relevant feature of most remote mining operations. However, this is much less
important for the other three use cases in this profile market. Similar reasoning applies to the Local
Energy Intensive Industries, Local Energy Price Premiums/Seasonal, Limited Access to Energy, and
Limited Access to Trades/QA indicators. Remote mining operations are energy intensive and generally
subject to energy price premiums and have limited access to grid energy or natural gas pipelines and
limited access to workforces with high levels of education or training in specialized operations. As with
the remote/distributed energy profile market described above, these indicators are given different weights
when using them for evaluating microreactor market potential of countries for this profile market.
6.2.2 Distributed Energy Global Profile Market
The distributed energy global profile market encompasses three use cases with several characteristics
in common but with some differences that necessitate slight variations in their assessment methodology.
Table 12 shows the use cases and their associated deployment indicators.
Table 12. Distributed energy profile market: use cases and indicators.
Microreactor Deployment
Indicator(s)
Small Rural
Community
(UAA 2020b)
Rural Hub
Community
(UAA 2020b)
Islands Puerto Rico
(NAP 2020)
(National Energy Demand)
1. Local Economic Growth Potentialhh
Low
Med–High
Low–Med
ee Combined with Infrastructure Conditions since this relates to access to energy (transmission sources).
ff This indicator represents the capacity for skilled, qualified trades needed to support the construction, O&M, transport, etc. and
rigorous QA regulatory environment (e.g., mining).
gg Scalability refers to reactor modular to enable large changes to energy demands (i.e., more than load following, ramping).
hh Growth could include societal climate migration and rapid urbanization to megacities.

57
Microreactor Deployment
Indicator(s)
Small Rural
Community
(UAA 2020b)
Rural Hub
Community
(UAA 2020b)
Islands Puerto Rico
(NAP 2020)
(Microreactor Energy Demand)
2. Dispersed Energy/Remote/Lockedii
3. Local Cogeneration (dist. Heat, H2O)
4. Local Energy Intensive Industries
5. Local Energy Price Premiums/Seasonal
High
Low
Low
High
High
High
High
High
High
Low
High
High
(Financial/Econ Sufficiency)
6. Limited Access to Local Capital
High
High
High
(Physical Infrastructure)
7. Limited Access to Energyjj
8. Limited Access to Trades/QAkk
High
High
High
High
Med–High
Med–High
(Climate Change)
9. Local Climate Change/Disaster
Vulnerability
High
High
High
(Energy Surety)
10. Reduce Imports/Diversify Energy
Sources
11. Balance VRE, Scale Up/Downll
12. Local Critical Loads/Critical Facilities
High
High
High
High
High
Medium
High
High
High
This profile market includes the Small Rural Community Use Case as it is based on these types of
communities in remote areas that rely principally on fossil fuels for both electricity generation and
heating, as described in the UAA (2020a) study and summarized in Section 5 of this report. This profile
market also includes regional hub communities that have characteristics of these types of communities in
Alaska as well as emerging economies in relatively remote areas with limited access to electricity and
with an increasing use of mini-grid and microgrids. Finally, this market also includes the Islands Use
Case as this share’s characteristics of both previous use cases. For all three of these use cases, several of
the microreactor deployment indicators have the same ratings in terms of applicability. These include
Dispersed Energy/Remote/Locked, Limited Access to Local Capital, Local Energy Price
Premiums/Seasonal, Limited Access to Energy, Limited Access to Trades/QA, Local Climate
Change/Disaster Vulnerability, Reduce Imports/Diversify Energy Sources, Balance VRE, Scale Up/Down,
and Local Critical Loads/Critical Facilities. As a result, their scoring with the data sources for these
indicators are treated the same in terms of assessing the market potential for this profile market.
There are, however, three deployment indicators that vary according to their relevance across these
three use cases. The applicability of the Local Economic Growth Potential indicator is rated somewhat
higher for rural hub community. In these communities described in the UAA (2020a) study as well as the
emerging economies in relatively remote areas with limited access to electricity and increasing use of
mini-grids, the potential for microreactors to foster opportunities for economic development is higher than
ii Inclusive of remote locations and those with sea or land-locked geography.
jj Combined with Infrastructure Conditions since this relates to access to energy (transmission sources).
kk This indicator represents the capacity for skilled, qualified trades needed to support the construction, O&M, transport, etc. and
rigorous QA regulatory environment (e.g., mining).
ll Scalability refers to reactor modular to enable large changes to energy demands (i.e., more than load following, ramping).

58
for the Small Rural Communities and Islands Use Cases. In these use cases, economic growth may well
be stagnant but the impetus to replace expensive and less reliant fossil fuel remains. This is evident in the
case of Puerto Rico, where the lack of resilient energy production is partially responsible for negative
economic growth over recent years. Similar reasoning applies to the Local Cogeneration indicator, which
is rated somewhat higher for the Rural Hub Community Use Case than for the other two use cases in this
profile market. In both hub communities described in the UAA (2020b) study and for emerging
economies with distributed energy systems, the opportunities for non-electrical uses of power are
relatively more important than for small remote rural communities and islands. Finally, the Local Energy
Intensive Industries is rated highly relevant for islands and hub Communities as these opportunities are
deemed as potentially important uses of microreactors but less so for small remote communities. To
account for the difference in the relevance ratings of these indicators across the three use cases in this
profile market, the weight in the overall scoring of these indicators varies somewhat, with indicators
having a medium relevance in a given use case being weighted at 70% of the same indicator rated as
having high relevance. Similarly, an indicator with a low-relevance rating in a use case is weighted at
30% of the same indicator with a high relevance rating in another use case in this profile market.
6.2.3 Resilient Urban Global Profile Market
While the applicability ratings for some of the deployment indicators are consistent across the four
use cases in this global profile market, there is a great deal of variability in other indicators. Table 13
shows the use cases and their associated deployment indicators.
Table 13. Resilient urban profile market: use cases and indicators.
Microreactor Deployment
Indicator(s)
Regional Utility
(Railbelt)
Energy
Producer
(UAA 2020b)
Urban Center
(Megacity)
(INL)
(National Energy Demand)
1. Local Economic Growth Potentialmm
Medium
High
(Microreactor Energy Demand)
2. Dispersed Energy/Remote/Lockednn
3. Local Cogeneration (dist. Heat, H2O)
4. Local Energy Intensive Industries
5. Local Energy Price Premiums/Seasonal
Low
Low
Low
Medium
Low
High
High
Medium
(Financial/Econ Sufficiency)
6. Limited Access to Local Capital
Low
Low–Med
(Physical Infrastructure)
7. Limited Access to Energyoo
8. Limited Access to Trades/QApp
Low
Low–Med
Low
Low
(Climate Change)
9. Local Climate Change/Disaster
Vulnerability
Med–High
Med–High
mm Growth could include societal climate migration and rapid urbanization to megacities.
nn Inclusive of remote locations and those with sea or land-locked geography.
oo Combined with Infrastructure Conditions since this relates to access to energy (transmission sources).
pp This indicator represents the capacity for skilled, qualified trades needed to support the construction, O&M, transport, etc. and
rigorous QA regulatory environment (e.g., mining).

59
Microreactor Deployment
Indicator(s)
Regional Utility
(Railbelt)
Energy
Producer
(UAA 2020b)
Urban Center
(Megacity)
(INL)
(Energy Surety)
10. Reduce Imports/Diversify Energy
Sources
11. Balance VRE, Scale Up/Downqq
12. Local Critical Loads/Critical Facilities
High
Low–Med
High
Med–High
Low–Med.
Med–High
These two use cases have similar ratings for the Dispersed Energy/Remote/Locked and the Limited
Access to Energy indicators as they have, for the most part, existing connections to utilities. Similarly,
Local Access to Capital and Limited Access to Trades/QA are not major factors for these use cases as they
have access to funds and skilled workforces. Local Energy Price Premiums is rated relatively lower in
this profile market than in others because cost is less of a factor here than those such as resilience,
stability, and security. For the use cases here, the need to diversify energy sources and reduce reliance on
energy imports is of high importance. The need to supply critical energy loads, especially where there is
susceptibility to natural hazards or climate change risks, lead to the generally high ratings for these
indicators.
There is variability in the applicability ratings of the remaining indicators across use cases. For Local
Economic Growth Potential, it is rated as having high applicability for urban centers as rapid growth,
often accompanied by rapid population growth, challenge the provision of energy with the existing
infrastructure in these areas. This is less true for smaller, more stable Railbelt communities. The ability
for microreactors to provide energy for cogeneration and for energy intensive industrial uses is rated high
for megacities as these applications are likely part of needed increased energy supply for growing urban
centers.
6.2.4 Disaster Relief Global Profile Market
Nine of the 12 microreactor indicators are rated as having high applicability for this profile market.
Microreactors can be an important element providing energy and economic stability in areas vulnerable to
natural disasters and climate-related hazards. Microreactor deployment can be part of a rapid response for
disaster relief as well as a proactive strategy to fortify and increase the energy supply in such areas. The
use of microreactors for these purposes, as well as for improving the security and stability of energy
production by providing baseload electricity, thermal energy for cogeneration, integrating with
renewables and/or microgrids, and fostering economic development in islands, megacities, remote
locations and similar settings can be a vital part of an area’s energy development strategy. The ratings for
the microreactor deployment indicators in this profile market are given in Table 14.
Table 14. Disaster relief profile market: use case and indicator
Microreactor Deployment
Indicator(s)
Disaster Relief
(INL)
(National Energy Demand)
1. Local Economic Growth Trendsrr
Low
qq Scalability refers to reactor modular to enable large changes to energy demands (i.e., more than load following, ramping).
rr Growth could include societal climate migration and rapid urbanization to megacities.

60
(Microreactor Energy Demand)
2. Dispersed Energy/Remote/Lockedss
3. Local Cogeneration (dist. Heat, H2O)
4. Local Energy Intensive Industries
5. Local Energy Price Premiums/Seasonal
High
High
Low
High
(Financial/Econ Sufficiency)
6. Limited Access to Local Capital
High
(Physical Infrastructure)
7. Limited Access to Energytt
8. Limited Access to Trades/QAuu
High
High
(Climate Change)
9. Local Climate Change/Disaster
Vulnerability
High
(Energy Surety)
10. Reduce Imports/Diversify Energy
Sources
11. Balance Intermittent
Renewables/Scalabilityvv
12. Local Critical Loads/Critical Facilities
High
Med
High
6.2.5 Marine Propulsion Global Profile Market
As with the disaster relief case above, the Marine Propulsion Profile Market incorporates just one of
the use cases described in Section 5 of this report. Of all the profile markets reviewed here, this one has
the fewest microreactor deployment indicators ranked as highly applicable. Considering the use of
microreactors for commercial ships, currently powered primarily by bunker fuels, the indicators for
remote usage, energy price premiums, and diversifying energy sources are rated as highly applicable. The
ratings for the microreactor deployment indicators in this profile market are given below in Table 15.
Table 15. Marine propulsion profile market: use case and indicators
Microreactor Deployment
Indicator(s)
Marine Propulsion
(INL)
(National Energy Demand)
1. Local Economic Growth Trendsww
Low
(Microreactor Energy Demand)
2. Dispersed Energy/Remote/Lockedxx
3. Local Cogeneration (dist. Heat, H2O)
4. Local Energy Intensive Industries
5. Local Energy Price Premiums/Seasonal
High
Low–Med
Low
Med–High
ss Inclusive of remote locations and those with sea or land-locked geography.
tt Combined with Infrastructure Conditions since this relates to access to energy (transmission sources).
uu This indicator represents the capacity for skilled, qualified trades needed to support the construction, O&M, transport, etc. and
rigorous QA regulatory environment (e.g., mining).
vv Scalability refers to reactor modular to enable large changes to energy demands (i.e., more than load following, ramping).
ww Growth could include societal climate migration and rapid urbanization to megacities.
xx Inclusive of remote locations and those with sea or land-locked geography.

61
(Financial/Econ Sufficiency)
6. Limited Access to Local Capital
Low–Med
(Physical Infrastructure)
7. Limited Access to Energyyy
8. Limited Access to Trades/QAzz
Low
Low
(Climate Change)
9. Local Climate Change/Disaster
Vulnerability
Med–High
(Energy Surety)
10. Reduce Imports/Diversify Energy Sources
11. Balance Intermittent
Renewables/Scalabilityaaa
12. Local Critical Loads/Critical Facilities
High
Low
Low
7. GLOBAL ENERGY MARKET ASSESSMENT
In this section, the global energy markets for microreactors are assessed using a top-down and
bottom-up approach. The potential markets will be defined for the 2030–2050 timeframe across regions
of the world, per the UN Statistical Commission classification. The results are compiled and evaluated.
7.1 Top-Down Assessment
In the top-down assessment, projections for future nuclear power and market conditions are described
along with how SMRs and microreactor markets are differentiated. New roles for advanced nuclear power
in reaching the 2050 decarbonization goals are described including decentralized electric systems with
high shares of wind and solar. A range of capacity projections are constructed including shares for
Gen III/III+, larger NPPs, SMRs and microreactors. Implications on the depth of penetration in different
market sectors are described relative to the number of builds and improving economics. Non-electric
markets for microreactors are additionally discussed.
7.1.1 Advanced Reactor Development and Market Conditions
Global nuclear-market projections described in Section 3.3 and shown in Figure 8, provide a range of
future capacities for nuclear power based primarily on its role as a large baseload power source providing
electricity. New roles for nuclear are beginning to emerge, but there is little recognition of their potential
contributions in the capacity shares in these wide-ranging projections. Third Way (2021), as an exception,
recognizes advanced nuclear projects are necessary for the U.S. to re-establish a global nuclear program,
and are needed to support fast- growing markets in developing economies. The Third Way projection
does not assign capacities to different types of advanced nuclear technologies but comprehends the
growing demands for energy particularly in developing economies. It is noted their 2050 projection
exceeds the IAEA high projection by more than 200 GWe, potentially accounting for new roles for
nuclear.
yy Combined with Infrastructure Conditions since this relates to access to energy (transmission sources).
zz This indicator represents the capacity for skilled, qualified trades needed to support the construction, O&M, transport, etc. and
rigorous QA regulatory environment (e.g., mining).
aaa Scalability refers to reactor modular to enable large changes to energy demands (i.e., more than load following, ramping).

62
Figure 8. Nuclear capacity projections.
According to the IAEA (2020), more than 70 designs for SMRs are under development worldwide;
some of which are microreactors (see Section 2). The U.S. DOE ARDP awarded $20 million in late 2020
to fund three advanced reactor concepts including: Inherently Safe Advanced SMR for American Nuclear
Leadership - Advanced Reactor Concepts, LLC; Fast Modular Reactor Conceptual Design-General
Atomics; and Horizontal Compact High-Temperature Gas Reactor-–MIT. “ARDP is significant because it
will enable a market for commercial reactors that are safe and affordable to both construct and operate in
the near- and mid-term.” said U.S. Secretary of Energy Dan Brouillette, “All three programs under ARDP
pave the way for the United States to be highly competitive globally.” Additionally, five teams will
receive $30 million in initial funding under ARDP’s Risk Reduction for Future Demonstration program.
(INL 2021)
The timeframe for development and initial deployment is in the mid- to late 2020s. New builds after
2030 could include advanced reactors ranging from larger NPPs (>300 MWe) to SMRs (20–300 MWe),
and microreactors (<1–20 MWe). The markets each technology will operate is likely different and fit
within the marketplace depending on the transmission and distribution conditions. Due to economics,
microreactors lend themselves to remote locations, decentralized markets, use with renewables sources on
micro- and mini- grids, and in densely populated areas lacking transmission/distribution infrastructure.
The high costs to replace and digitalize networks and build new transmission lines is a constraint on
deploying wind and solar in some locales, where distributed systems including microreactors on mini-
/micro- grids is the ‘cellular phone network’ equivalent to developing large, centralized infrastructures.
UxC (2020) estimates cumulative nuclear market expenditures from 2020 to 2050 at $8.6 trillion (in
2019 U.S. dollars), as shown in Figure 9. While very large, the estimate is not unreasonable considering
the IEA projects the total cost of a future global clean energy system at $67.7 trillion (in 2017 U.S.
dollars). U.S. nuclear suppliers have opportunities for new conventional reactors and for small and
advanced designs, maintaining and fueling the global fleet of reactors, and in decommissioning aging
reactors. The near-term outlook is primarily for the life-extension up to 80 years for existing reactors and
some construction of large, traditional reactor types (e.g., light water reactors), and as the energy system
further transitions from fossil power to low-carbon energy systems, a mix of emerging new technologies,
including SMR, microreactors, and other advanced designs will be built (UxC 2020).
-
200
400
600
800
1,000
IAEA Low IAEA High IEA Net ZeroEmissions (NZE2050)
IPCC 1.5C Scenario Third Way
GW
eNuclear Capacity Projections (GWe)
(less retirements)
2019 2030 2040 2050

63
Figure 9. Global nuclear market size projection, 2020–2050 (UxC 2020).
According to UxC (2020), the ability of U.S. vendors to supply global markets, particularly in Asia,
Africa, Eastern Europe, and the Middle East, has lagged other suppliers. However, U.S. suppliers are
better positioned in North America, Western Europe, Japan, Taiwan, and South Korea. Based on this view
and additional analysis, UxC arrived at the following estimates for global nuclear sales for U.S. nuclear
suppliers considering the 840 GWe IPCC 2050 target. UxC estimates the 30-year cumulative total for
U.S. nuclear market revenues could range between $1.3 trillion and $1.9 trillion to support new reactor
construction projects (large, small modular, and advanced designs), maintaining and fueling the global
fleet of reactors, as well as decommissioning aging reactors.
7.1.2 Microreactors Are a Unique Subset of SMRs
Microreactor markets are different from SMR markets, just as SMRs differ from large NPPs in new
markets (e.g., to replace coal and gas plants, and generate process heat and hydrogen). Due to capacity
differences, SMRs will typically operate in grid-served electricity markets and where the physical
infrastructure can support on-site construction and operations of the reactors. Microreactors are more
suited to smaller off-grid markets, for integration with renewable sources in distributed energy systems,
sited in locations where physical space is limited (urban), and/or the energy infrastructure is minimal.
SMRs and microreactors could additionally serve heat markets, but at different scales.

64
Current U.S. coal plants are potential future sites for SMRs, according to a NuScale report bbb and in
the popular press. According to NuScale “Nearly 70 percent of coal-fired generating units comprising
more than 50 percent of the coal generating capacity [in the U.S.] are more than 40 years old. At the end
of 2015, the coal-fired generating units in the United States totaled 286 gigawatts of capacity. In 2015
alone, 11.3 gigawatts of coal-fired capacity were retired. EIA projects with a total of 30 gigawatts of coal-
fired generating capacity will retire by 2025, 87 percent of which by the end of 2020.” In the phase out of
coal, natural gas is expected to play an increased role since it is cleaner than coal and at low prices. In the
longer term, low-carbon energy sources such as SMRs are needed to fill this gap. The coal electricity
markets typically serve central transmission with plant unit sizes ranging from 100 MW to 1,000 MW,
with most U.S. coal plants in the mid-range of 250–750 MWe. The U.S. coal production is only about
12% of the world total, where other leaders include China (42%), India (8%), and Indonesia (6%).
SMR developer TerraPower, along with its partner PacifiCorp, announced on June 2, 2021 plans to
site a Natrium reactor demonstration plant at a retiring coal plant in Wyoming. Governor Mark Gordon
announced, “Nuclear power is clearly a part of my all-of-the-above strategy for energy in Wyoming,” and
“This facility will be in coal country and replace an existing coal-fired plant. It will provide opportunities
for job and career transformation.” (ANS 2021)
SMRs are also suited for cogeneration markets typically served by coal and natural gas. In a study of
industrial heat demands in the EU (Carlsson 2012), the average capacity per site was 34 MWth for
existing cogeneration plug-in market and 66 MWth for potential cogeneration markets that are currently
served by natural gas fueled boilers. The scale of heat production is amenable with the capacity needs of
large chemical processing industries such as petroleum refineries, production of hydrogen (and
derivatives including ammonia). The steam and heat requirements vary greatly in terms of temperatures
and mass flows for different industrial processes. Relatively small sized reactors (from 50MWth to
250 MWth) capable of supporting processes in the range of 200–550°C support various markets including
iron and steel, refineries, primarily aluminum, cement, and non-ferrous metals. Forsberg and Foss (2021)
evaluated heat markets with applicability to FB producing 20–30 MWth. They found FB’s are most
applicable to chemical, paper and food manufacturing particularly in the range of 10 to 50 MWth. In the
U.S., they identified over 6,000 heat users with demands greater than 1 MWth.
7.1.3 Advanced Nuclear Can Fill Low-carbon Gaps in Achieving 2050 Climate Goals
The IPCC (2018) 1.5C Report concludes “additional resources” are needed to achieve high VRE
penetration rates (e.g., demand side management, energy storage, and smart grids). Current projections by
the IPCC and IEA place a huge emphasis on variable renewables (solar and wind) ramping up to achieve
2050 climate goals. The share of renewables in global electricity supply rises from 27% in 2019 to 60% in
2030, while nuclear power generates just over 10%. After setbacks by COVID 19 shown in Figure 10,
capacity additions of solar and wind are expected to recover and quickly push higher.
Considerable research has been performed on the use of smart grids to assist in the integration of
renewable energy. Smart grids may also help to avoid blackouts, reduce electrical waste, as a response to
national disasters and cyber-attacks. More information is provided in Appendix D.
Refer to NuScale Power: https://www.nuscalepower.com/environment/coal-plants

65
Figure 10. Solar PV and wind power capacity additions (IAEA WEO 2020, Stated Policies Scenario).
Although renewables have seen significant increases over the past decade, continued acceleration to
2050 is not guaranteed without major adaptations. For example, global solar photovoltaic (PV) capacity
needs to triple over the coming decade. With the continued changes to the energy mix including less
baseload from coal and flexible power provided by natural gas, electrical power systems will need to
draw on additional resources to provide grid reliability and the resilience to protect against the impacts
from climate change.
Some countries heavily invested in fossil fuels are significantly betting now on renewables. In IEA’s
WEO assessment, India’s coal-fired capacity plateaus by 2025, mainly due to ambitious targets for
renewables. Renewable capacity (primarily solar PV) is expected to reach 175 GW by 2022, achieving
60% of the total capacity by 2030 (doubling share since 2019). Utility scale and distributed solar PV and
onshore wind power are the primary sources. Energy storage is expected to be used to save energy
produced earlier in the day to serve India’s peak evening loads. Demands for storage are expected to also
grow rapidly and eventually surpass coal-fired capacity. The considerable projection for solar PV as
compared to other energy sources is shown in Figure 11 raising speculation about the impacts to grid.

66
Figure 11. Power capacity in India by source (IAEA WEO 2020, Stated Policies Scenario).
Advanced reactors could support the growing shares of renewables particularly beyond 2030 when
VREs produce 30%, 50%, and 75% of demand. According to the OECD NEA study on the Cost of
Decarbonization (2019), the value of electricity generated diminishes quickly as a function of their share
in the electricity mix, shown in Figure 12. Factors such as the level of regional smoothing and use of
demand side management will matter.
Figure 12. Market remuneration for wind and solar as a function of share in the energy mix (NEA 2019).
With recognition of the balancing points for VRE penetration, further needs for integrated energy
systems consisting of VREs, storage, and other assets (nuclear) are required to achieve net-zero emissions
by 2050.

67
7.1.4 Integration of Advanced Nuclear in Low-Carbon Energy Systems
A study prepared by the European Commission Joint Research Centre (Shropshire 2012) showed
additional shares of VREs in the energy mix could be facilitated by flexible nuclear systems (0.6 to 1.0
from rated power) enabling wind to achieve a 50% share of the energy mix. SMRs would provide firming
power generation to back up the supply from renewable resources and load-follow. The study showed
when nuclear was paired with offshore wind, that the combination could produce 80% less power
variation, but at a loss of 30% of the SMR capacity utilization. The reactor in demand following mode
could improve the output correlation to demand by 60–70% as compared to a wind only system. The
insight gained from the study was if wind could be deployed at a ratio of 2:1 by capacity (wind to
nuclear), such as 10 GW wind farms to 5 GW flexible SMRs, then the resulting system variability could
be cut by a least 50%. Additional variability reduction could be achieved by aggregation of wind/nuclear
over great distances and use of other options including energy storage, smart grids, and hybrid nuclear
systems. Hybrid nuclear systems could further optimize outputs by producing heat products when
electricity is not needed due to balancing VREs outputs.
Canada’s SaskPower (2021) is evaluating several potential alternative low emissions pathways
including expanded electricity imports, generation from solar and wind, carbon capture and storage
technology and the deployment of nuclear power from SMRs. Ontario’s Power Generation’s assessment
is SMRs can provide stable backup support for wind and solar generation on the system to contribute to
system reliability. The alternative is to continue to use gas as a flexible generation option that will
increase carbon emissions as demand and capacity needs arise. Ontario’s system operator’s high-growth
scenario further supports implementing a SMR. The combination of expanded electricity imports and the
addition of reliable, zero emissions power from SMRs could facilitate an expansion of intermittent
renewable generation from wind and solar in Saskatchewan after 2030.
Nuclear power could increase its contribution toward low-carbon systems through additional
integration with VREs in the period of 2030–2050. The projected shares of wind, solar, nuclear, and fossil
are compared in the IPCC 1.5 C pathway scenario (supplementary material 2.SMR.1.3) in Table 16.
Table 16. Global electricity generation of 1.5C pathways median case (IPCC 2018).
Source Electricity Generation (EJ)
2020 2030 2050
Wind & Solar 1.66 8.91 39.04
Nuclear 10.84 15.46 21.97
Fossil 59.43 36.51 14.81
The generation increases for wind and solar are notable during the period 2030–2050 where they
increase over 400% while nuclear increases about 40% and fossil declines by around 60%. Future
generation could be further distributed between wind, solar, and advanced nuclear to reduce the need for
balancing measures and avoid negative impacts to energy prices. To account for this enhanced balancing
measure, the IPCC scenario is modified as shown in Table 17. Nuclear generation is increased from
15.46 EJ to 20.00 EJ by 2030 and from 21.97 EJ to 30.00 EJ by 2050. In this modified scenario,
additional shares of nuclear could further displace fossil (diesel, LNG, etc.) while helping wind and solar
achieve the high-generation rates. These generation rates could support new uses for SMRs and
microreactors as part of a diversified energy mix with additional baseload reliability. There is further
potential for increased use of nuclear power, particularly in emerging decentralized markets.
Table 17. Modified IPCC 1.5C pathways, enhanced nuclear.
Source Electricity Generation (EJ)
2020 2030 2050

68
Wind & Solar 1.66 8.91 39.04
Nuclear 10.84 20.00 30.00
Fossil 59.43 31.97 6.78
In Figure 13, the projections for nuclear power were adapted to show only new builds by removing
existing reactors (and their retirements) from the nuclear capacity projections.ccc What is left over is a
clearer picture of the opportunity for nuclear growth including the projection adapted from the enhanced
scenario (units converted from EJ to GWe). This new “high” projection of 474 GWe by 2050,
significantly expands the nuclear contribution for advanced nuclear technologies in emerging low-carbon
energy markets.
Figure 13. Total nuclear new build additions.
7.1.5 Electricity Market Shifts Toward Distributed Energy
BNEF reports on an emerging trend in the energy marketplace, indicating a shift in generation from
transmission to distribution. Reasons cited include the large expenses to upgrade transmission. Many
countries are facing a need for huge infrastructure projects to expand and modernize the electric grids.
This is particularly true in developing economies still lacking universal access to electricity, such as sub-
Saharan Africa, and South Africa, where trillions of dollars need to be spent. Finding these investments
for the power infrastructure is not getting any easier, due to weakened financial condition of utilities in
and increased constraints on their access to capital. In 2019 going into 2020, the cost of borrowing
increased by around two percentage points on average in this region. In Europe, the scale of generation is
significantly tipping towards distribution with median plant sizes projected to decrease substantially, from
596 MWe (2020) to 224 MWe (2030) as shown in Figure 14.
ccc Reactor retirements are based on the numbers in IAEA RDS#1 (IAEA 2020b). The 297 GWe projected retirements under the
IAEA low case are applied to only the IAEA low case, and the 174 GWe projected retirements under the IAEA high case
(fewer and later in time) applied to the IAEA high case and the IPCC cases.
80
130
187 187
79
211 233
277
109
157 198
474
-
50
100
150
200
250
300
350
400
450
500
IAEA Low Case IAEA High Case IPCC 1.5C Median IPCC 1.5C Enhanced
GW
e
Total Nuclear - New Build Additions
2030 2040 2050
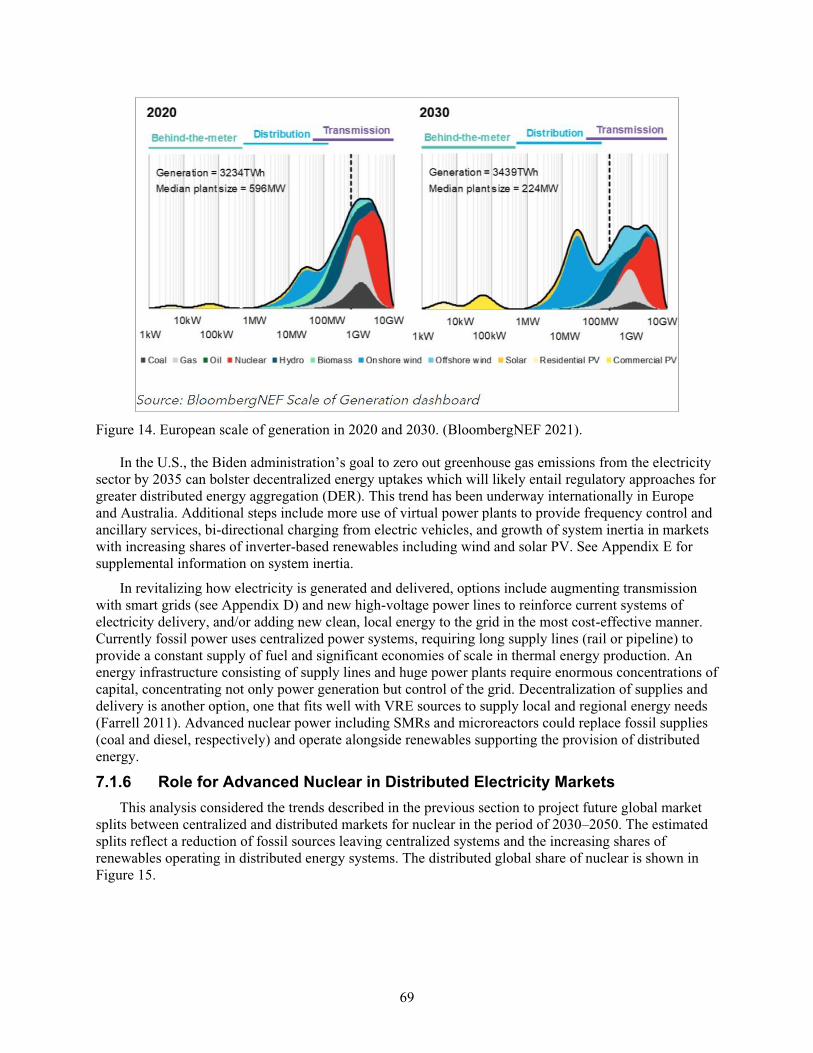
69
Figure 14. European scale of generation in 2020 and 2030. (BloombergNEF 2021).
In the U.S., the Biden administration’s goal to zero out greenhouse gas emissions from the electricity
sector by 2035 can bolster decentralized energy uptakes which will likely entail regulatory approaches for
greater distributed energy aggregation (DER). This trend has been underway internationally in Europe
and Australia. Additional steps include more use of virtual power plants to provide frequency control and
ancillary services, bi-directional charging from electric vehicles, and growth of system inertia in markets
with increasing shares of inverter-based renewables including wind and solar PV. See Appendix E for
supplemental information on system inertia.
In revitalizing how electricity is generated and delivered, options include augmenting transmission
with smart grids (see Appendix D) and new high-voltage power lines to reinforce current systems of
electricity delivery, and/or adding new clean, local energy to the grid in the most cost-effective manner.
Currently fossil power uses centralized power systems, requiring long supply lines (rail or pipeline) to
provide a constant supply of fuel and significant economies of scale in thermal energy production. An
energy infrastructure consisting of supply lines and huge power plants require enormous concentrations of
capital, concentrating not only power generation but control of the grid. Decentralization of supplies and
delivery is another option, one that fits well with VRE sources to supply local and regional energy needs
(Farrell 2011). Advanced nuclear power including SMRs and microreactors could replace fossil supplies
(coal and diesel, respectively) and operate alongside renewables supporting the provision of distributed
energy.
7.1.6 Role for Advanced Nuclear in Distributed Electricity Markets
This analysis considered the trends described in the previous section to project future global market
splits between centralized and distributed markets for nuclear in the period of 2030–2050. The estimated
splits reflect a reduction of fossil sources leaving centralized systems and the increasing shares of
renewables operating in distributed energy systems. The distributed global share of nuclear is shown in
Figure 15.

70
The assumptions on splits are as follows:
• In 2030, 70% of the market is estimated to serve centralized markets (30% distributed markets)
• In 2040, due to increasing shares of VREs, the share of centralized reduces to 60%
• In 2050, there are equal shares of market (50% distributed, 50% centralized).
Figure 15. Distributed total market projections for all nuclear power.
Large NPPs including Gen III/III+ plants and larger >300 MW plants are assumed to connect to large
transmission grids. SMRs could support distributed markets in balancing loads from VREs. For
microreactors, initial shares from 2030–2040 could focus on off-grid remote operations and next
generation mini-grids expanding into distributed energy markets. In 2040–2050, markets would continue
to expand in distributed markets focusing on improving security and resilience.
7.1.7 Global Nuclear New Builds in Different Markets
Using the splits described in Section 7.1.6, the market is further disaggregated based on the size of the
reactor (evolutionary Gen III/III+, and larger Generation IV innovative reactors >300 MW) and between
evolutionary and innovative SMRs (20 to 300 MWe) and microreactors (<1 MW to 20 MWe). The
assumed splits between advanced reactors into transmission and distributed markets is provide in
Table 18.
Table 18. Capacity shares of nuclear technologies in transmission and distributed markets.
Large Transmission Markets Medium to Small Distributed Markets
Year Gen III/III+ Large Gen IV Large SMRs (Gen III/IV) Microreactors
2030 90% 10% 95% 5%
2040 50% 50% 75% 25%
2050 20% 80% 50% 50%
-
50
100
150
200
250
2030 2040 2050
GW
e
Distributed Market Projections for Nuclear
IAEA Low Case IAEA High Case IPCC 1.5C Median IPCC 1.5C Enhanced

71
The global new builds from 2030–2050, based on the IAEA low case projections, is provided in
Figure 16.
Figure 16. Low projection of global new builds (IAEA 2020b).
In the OECD Nuclear Energy Agency’s 2021 report on “Small Modular Reactors: Challenges and
Opportunities” (NEA 2021), the NEA identified microreactors as micro-modular reactors (MMRs) with
capacities of less than 10 MWe vs. SMRs with capacities between 10 MWe and 300 MWe. The 2021
report provides an update from their 2016 report where the NEA derived SMR capacities by region in
2035. NEA’s estimated SMR demands ranged from approximately 1 GWe to 20 GWe by 2035.
Projections for microreactors are not specifically identified.
The global new builds from 2030–2050, based on the IPCC modified case projections is provided in
Figure 17.
-
50
100
150
200
250
300
350
400
450
500
2030 2040 2050
GW
e
Low Projection - Global Nuclear New Builds
Gen III/III+ (central) Advanced Reactors (central) SMRs (distributed) Microreactors (distributed)

72
Figure 17. High projection of global new builds (IPCC modified case).
7.1.8 Projected Capacities of Microreactors in Electricity Markets
The global projection for 10 MWe sized microreactors ranges from 0.4 to 0.9 GWe by 2030, 6 to 21
GWe by 2040, and 27 to 119 GWe by 2050 and is shown in Figure 18. The global projection for the
number of 10 MWe sized microreactors ranges from 40–90 reactors by 2030 to 600–2,075 reactors by
2040, and 2,700–11,850 by 2050 and is shown in Figure 19.
-
50
100
150
200
250
300
350
400
450
500
2030 2040 2050
GW
e
High Projection - Global Nuclear New Builds
Gen III/III+ (central) Advanced Reactors (central)
SMRs (distributed) Microreactors (distributed)

73
Figure 18. Microreactor top-down global projection (GWe capacity).
Figure 19. Microreactor top-down global projection (# of 10 MWe microreactors).
-
20
40
60
80
100
120
140
2030 2040 2050
GW
e
Microreactor Top-Down Global Projection (Capacity)
Microreactors (IAEA Low Case) Microreactors (IAEA High Case) Microreactors (IPCC Modified)
-
2
4
6
8
10
12
14
2030 2040 2050
Tho
usa
nd
s
Microreactor Top-Down Global Projection (Number of 10 MWe reactors)
Microreactors (IAEA Low Case) Microreactors (IAEA High Case) Microreactors (IPCC Modified)

74
7.1.9 Microreactor Cost Competitiveness and Electricity Market Shares
Market penetrations are based on ability to meet or exceed cost targets for specific markets over time.
The depth of the market penetration represented by the different cases is limited to cost competitiveness
within each market sector (see Section 2). Generally, the unwritten rule is the more remote the location
then the higher the market price, and the more energy choices and energy transmission options available
then the lower the price.
As indicated in Table 19, initial market entry before 2030 is at a cost target of less than $0.60/kWh
based on the first 9 units for government uses. After a microreactor achieves 10 built units, cost would
reduce to $0.50/kWh by the early 2030 timeframe. From 2030 to 2050 accelerated learning rates are
needed to achieve competitive costs in the profile markets, based on the same magnitude of cost
reductions as seen by solar PV during the 10-year period of 2010 to 2020 (see Appendix F on factory
production learning basis for more information). Costs are assumed to continue to decline through factory
scale-ups and producibility improvements to the designs. If high build rates are achieved in factory
production (1,000 -10,000 units), costs come to rest around $0.15/kWh to $0.20/kWh.
Table 19. LCOE targets in selected profile markets.
Timeframe Cost Targets at Cumulative Number of Builds
1st Units Profile Markets 1–9 10 100 1,000 10,000
2020–2030 FOAK units/
Government
Uses
<$0.60/kWh
2030–2035 Isolated
Operations
<$0.50/kWh <$0.35/kWh <$0.20/kWh <$0.15/kWh
2035–2040 Distributed
Energy
<$0.35/kWh <$0.20/kWh <$0.15/kWh
2040–2050 Resilient Urban,
Marine
Propulsion,
Disaster Relief
<$0.20/kWh <$0.15/kWh
Microreactor costs in this target range should prove competitive in the profile markets described in
Section 6. Achievement of the cost targets appears possible when considering the LCOE values for
Microreactor A’ described in Section 2.4 based on a 15% learning rate for most cost components (Abou-
Jaoude et al. 2021).
7.1.10 Additional Microreactor Market Opportunities.
Market opportunities discussed in this report are global, but the microreactor cost targets described in
Section 7.1.9 are primarily oriented to markets in North America. Globally, electricity costs can vary
significantly as illustrated for selected countries in Figure 20 (Statista 2021). National LCOE in the U.S.
and Canada range from about $0.11/kWh to $0.14/kWh (U.S. dollars) respectively, based on 2020 data
(Statista 2021). Other countries may have lower average national electricity costs which suggests that
microreactors would not compete for energy shares in centralized markets, but they could still find market
opportunities in remote and distributed markets with higher costs of electricity. Electricity markets in
selected countries are discussed further in Section 7.2.

75
Figure 20. Global LCOE’s in selected countries (Statista 2021).
This assessment assumes electricity is the primary product from the microreactor, with some ancillary
use of heat to improve the economics. Additional markets and demands may exist for heat-alone and/or
cogeneration markets. Microreactor heat could be used to produce additional value-added products
including desalinated water at a village scale and small-scale hydrogen production for use as a fuel or
storage. Further discussion on additional (non-electric) applications is provided in the Section 7.2 on
bottom-up assessment.
7.2 Bottom-Up Assessment
In this section, the microreactor deployment indicators and use cases and the profile markets
described in the Section 5.1 are brought together with the global profile markets described in Section 6 to
assess the applicability of microreactors for use in each of the global profile markets considered in this
report. Quantitative assessments were performed for each of the Nuclear Power and Emerging Nuclear
Energy countries as identified by the IAEA’s Power Reactor Information System (PRIS). Based on these
assessments, there is significant potential among a broad variety of these countries for microreactor
deployment going forward.
The analysis performed in this section incorporates the characteristics of each use case with one of the
five global profile markets. This enables the assessment of which countries are most closely matched with
each global profile market based on the use cases identified as being most coincident with the features
and capabilities of microreactors. This section begins with a description of the methodology used for this
assessment. This is followed by subsections on each of the five profile markets with overviews of the
countries and their respective rankings in terms of their likely potential for microreactors deployment.
Following these assessments of the profile markets, Subsection 7.2.7 shows the relationship of each of the
five profile markets with the major regions of the world as defined by the UN Series M, No. 49 standard.
These regional results can then be compared to the regional nuclear capacity assessments in Section 7.3
below.

76
7.2.1 Assessments of Global Profile Markets
The analysis of the global profile markets is based on the microreactor deployment indicators
introduced in Section 4 of this report and listed in Table 5 of Section 5. The construction, quantification
and data sources for each indicator is described in Appendix C of this report. An analysis of countries’
deployment potential in each use case uses the quantitative assessment of each deployment indicator. The
63 countries studied here are ranked by deciles according to their score for each indicator, with those
achieving the highest scores being awarded a score of 10 and those with the lowest scores receiving a
score of one. As described earlier in this report, the decile system is a refinement of the previous scoring
system used by the U.S. DOC (2011) that utilized quartiles and a quartile indicator scoring system to
analyze the deployment potential for SMRs in select countries. The decile system used here reduces the
effects of indicators for which there are large disparities in the values for data across countries so that
larger economies are not scored higher based on the sheer size of their economy. Further, the decile
system used here yields outcomes much closer to those achieved by the MCDA methodology, as noted by
Black et al. (2019).
The decile rankings of countries for each indicator are then used to assess each country’s relative
potential for each use case. To do so, the decile score for each indicator is weighted according to the
assigned indicator weights based on their relative importance in each use case. These weights are shown
in Table 7 and Table 8 in Section 5.2 of this report. For example, in the case of the Small Rural
Community Use Case, the indicators for Local Economic Growth Potential, Local Cogeneration, and
Local Energy Intensive Industries are listed as having low relevance while the remaining indicators are
listed as having high relevance in Table 7 and described in Section 5.2.1. When determining the rankings
of countries within this use case, the decile rankings for those indicators with a low relevance are
weighted as 20% of the decile score for those indicators with a high relevance for that use case. For the 11
use cases, the range of numerical weights for the different relevance rating of indicators shown in Table 7
and Table 8 are as follows: High (weight = 1), Med–High (weight = 0.75), Medium (weight = 0.6), Low–
Med (weight = 0.4) and Low (weight = 0.2). The decile scores for each indicator and the overall use case
score for each country for the Small Rural Community Use Case are shown in Appendix G.
This study focuses on the global assessment of microreactor deployment potential, as identified in the
five global profile markets described in Section 6 of this report. To do so, the 11 use cases are used to
quantitively assess and identify each of the Nuclear Power and Emerging Nuclear Energy countries of
interest here. In Section 6.2 of this report, the mapping of the use cases to the global profile markets are
identified in TablesTable 11–Table 15. Also identified in these tables are the relative weights assigned to
each indicator when determining the rankings and scores of countries within each use case. As with the
decile scoring of each indicator to determine the overall score of each country within each use case,
aggregating the scores for the relevant use case scores within each global profile market also utilized a
decile-ranking system. This was necessary given the difference in indicator weights across the relevant
use cases within each global profile market. For example, in the Isolated Operations Profile Market Use
Case and the Remote Mining Operations Use Case has several indicators with a high-level of relevance.
In the same global profile market, the Military Installation Use Case has several indicators with a medium
and low level of relevance. Given the different weights assigned to these indictors, the Remote Operations
Use Case scores will be much higher than the scores for the Military Installation Use Case. When
aggregating these different use cases within a global profile market, simply adding the respective use case
scores across those within each global profile market will give undue weight to those some use cases. In
the case of the isolated operations profile market, the country scores for the Remote Mining Operations
Use Case will weigh much more heavily than the other use cases within that profile market. As a result,
the decile ranking of countries for each use case was used to aggregate the scores across use cases for
each profile market. This effectively weighs each use case equally when scoring the profile markets and is
consistent with the scoring system used in the SMR market assessments performed for the IAEA. In the
following subsections, the results of the analysis for each of the profile markets are summarized. For each

77
market, the countries listed have the highest applicability for microreactor deployment to support
provision of carbon-free energy development. Complete rankings of all countries in each profile market
are provided in Appendix G.
7.2.2 Isolated Operations Global Profile Markets
As described in Section 6.1.1, this profile market targets relatively isolated and high-value operations
and facilities that require steady and resilient energy sources. The types of entities within this market are
exemplified by the four use cases included here. These are remote operations, military installations,
federal facilities, and university campuses. Table 20, below, shows the countries ranked in the highest
half of the countries analyzed in the assessment for this profile market.ddd
ddd Rankings in the medium and low groupings for this Profile Market are given in Appendix G.

78
Table 20. Highest ranked countries for isolated operations profile markets.
Nation Isolated Operations Profile Market Score
China 40
India 40
United States 40
France 39
South Africa 39
Poland 38
Mexico 37
Sweden 37
Chile 37
Canada 36
Japan 36
Czech Republic 35
Kenya 35
United Kingdom 33
Philippines 33
Indonesia 32
Mongolia 32
Korea, Republic of 31
Romania 31
Argentina 30
Turkey 29
Bangladesh 28
Croatia 28
Russia (Russian Federation) 26
Iran, Islamic Republic of 25
Slovenia 25
Finland 23
Morocco 23
Thailand 23
Yemen, Republic of 23
Bulgaria 22
These countries reflect the use cases that comprise this profile market. Highly ranked indicators
across these use cases include Local Cogeneration, Limited Access to Energy, Disaster Vulnerability, and
Reduce Imports/Diversify Energy Sources. Several of the most highly ranked countries, for example,
score highly in terms of having limited energy access, high levels of damage due to natural disasters, and
remote mining operations. These include China, India, Chile, and Mexico. Other countries, such as
France, Sweden, and Japan, do not rank high in terms of having Limited Access to Energy but have
relatively high levels of government facilities and university campuses. These also contribute to the high
rankings of the United States and Canada which, in addition to these factors, also rank highly in terms of
remote mining operations. Several other highly ranked countries have some combination of the above
factors as well as have high levels of imported energy or reliance on fossil fuels.

79
7.2.3 Distributed Energy Global Profile Markets
This profile market consists primarily of relatively small-scale users such as residential, businesses,
and municipalities that may be in relatively isolated regions, part of a distributed energy system such as
microgrids, and may need both electricity as well as cogeneration. These features are captured in the three
use cases: Small Rural Community, Rural Hub Community, and islands. These markets may have a high
reliance on fossil fuels, need increased reliability to promote economic development, and/or be subject to
an unreliable energy supply system due to disruptions from man-made or natural events. Table 21.
Highest ranked countries for distributed energy profile markets.
Nation Distributed Energy Profile Market Score
China 30
India 30
South Africa 30
United States 30
Indonesia 29
Kenya 29
Mexico 28
Sweden 28
Philippines 28
Japan 27
France 26
United Kingdom 26
Poland 26
Canada 25
Czech Republic 25
Chile 25
Korea, Republic of 23
Netherlands 23
Thailand 23
Romania 22
Bangladesh 21
Finland 20
Spain 20
Turkey 20
Sri Lanka 20
Slovakia (Slovak Republic) 19
Morocco 18
Belgium 17
Croatia 17
Namibia 17
Uganda 17
Jordan 16
, below, shows the countries ranked in the highest half of the countries analyzed in this profile
market.

80
Table 21. Highest ranked countries for distributed energy profile markets.
Nation Distributed Energy Profile Market Score
China 30
India 30
South Africa 30
United States 30
Indonesia 29
Kenya 29
Mexico 28
Sweden 28
Philippines 28
Japan 27
France 26
United Kingdom 26
Poland 26
Canada 25
Czech Republic 25
Chile 25
Korea, Republic of 23
Netherlands 23
Thailand 23
Romania 22
Bangladesh 21
Finland 20
Spain 20
Turkey 20
Sri Lanka 20
Slovakia (Slovak Republic) 19
Morocco 18
Belgium 17
Croatia 17
Namibia 17
Uganda 17
Jordan 16
The indicators deemed to have high relevance across the three use cases in this market are Dispersed
Energy, Local Energy Price Premiums, Limited Access to Local Capital, Limited Access to Energy,
Limited Access to Trades, Disaster Vulnerability, Reduce Imports/Diversify Energy Sources, and Balance
Renewables. The rankings for most of these countries above are reflective of a mix of these
characteristics. India, Japan, China, the Philippines, and Indonesia all score highly in the Islands Use
Case. The United States, United Kingdom Sweden, Canada, Kenya, Poland, and Mexico have numerous
small, relatively remote rural and rural hub communities, often reliant on fossil fuels or, in some cases,
distributed energy grids. In addition, several of the highly ranked countries in this profile market have
been increasing their use of renewable energy sources and this is rated as highly relevant across all use
cases.

81
7.2.4 Resilient Urban Global Profile Markets
Recent and ongoing migration in relatively rural areas to urban centers has created challenges for
energy provision to large numbers of people, especially at the outer edges of these cities. As discussed in
Section 6.1.3, the ability of renewables to meet growing energy demand in these areas is limited due to
the lack of infrastructure and space for solar and wind facilities. Further, where these urban centers are in
areas subject to disruptions from natural and man-made disasters, the need for stable and resilient energy
is key for the needed stability of energy supply to support the population and promote economic
development. These characteristics are captured by the Regional Utility and Urban Megacity Use Cases in
this profile market. Further, the need for energy stability is also critical for military installations and
government facilities, often located proximate to urban centers. As a result, these use cases are included
in this profile market. The countries ranked in the highest half of the countries analyzed in the assessment
for this profile market are listed in Table 22. Highest ranked countries for resilient urban profile markets.
Nation Resilient Urban Profile Market Score
China 20
India 20
Mexico 20
United States 20
Sweden 19
Chile 19
Poland 19
Canada 18
Japan 18
South Africa 18
Indonesia 18
France 17
Korea, Republic of 17
United Kingdom 17
Kenya 17
Mongolia 17
Czech Republic 16
Philippines 16
Bangladesh 15
Turkey 15
Argentina 14
Thailand 14
Iran, Islamic Republic of 13
Russia (Russian Federation) 13
Netherlands 12
Romania 12
Azerbaijan 12
Bolivia 12
Morocco 12
Brazil 11
United Arab Emirates 11

82
Namibia 11
.
Table 22. Highest ranked countries for resilient urban profile markets.
Nation Resilient Urban Profile Market Score
China 20
India 20
Mexico 20
United States 20
Sweden 19
Chile 19
Poland 19
Canada 18
Japan 18
South Africa 18
Indonesia 18
France 17
Korea, Republic of 17
United Kingdom 17
Kenya 17
Mongolia 17
Czech Republic 16
Philippines 16
Bangladesh 15
Turkey 15
Argentina 14
Thailand 14
Iran, Islamic Republic of 13
Russia (Russian Federation) 13
Netherlands 12
Romania 12
Azerbaijan 12
Bolivia 12
Morocco 12
Brazil 11
United Arab Emirates 11
Namibia 11

83
7.2.5 Disaster Relief Global Profile Markets
Across the globe, areas have been subject to economic damage, displacement of populations, and loss
of life due to natural hazards and disasters. These events have increased in frequency and severity due to
the ill effects stemming from climate change. In addition, climate change has worsened the frequency of
human conflicts due to migrating populations. Microreactors have a strong potential to reduce the damage
from the types of hazards by providing rapid response in the aftermath of such disasters with power for
post-disaster communications and recovery. Further, they could provide an important role in reducing loss
through their pre-deployment of hazard-prone areas and to provide energy for resettlement facilities. By
doing so, microreactors can provide new, stable, and resilient energy in these types of cases and, by so
doing, reduce displacement, mortality, and economic damage. The countries ranked in the highest half of
the countries analyzed in the assessment for this profile market are listed in Table 23. Highest ranked
countries for disaster relief profile markets.
Nation Disaster Relief Profile Market Score
China 10
Czech Republic 10
India 10
South Africa 10
United States 10
Kenya 10
Poland 10
Canada 9
France 9
Sweden 9
Chile 9
Indonesia 9
Philippines 9
Bangladesh 8
Finland 8
Japan 8
Mexico 8
Romania 8
United Kingdom 8
Korea, Republic of 7
Netherlands 7
Slovakia (Slovak Republic) 7
Croatia 7
Thailand 7
Uganda 7
Bulgaria 6
Slovenia 6
Spain 6
Azerbaijan 6
Yemen, Republic of 6
Argentina 5

84
below.
Table 23. Highest ranked countries for disaster relief profile markets.
Nation Disaster Relief Profile Market Score
China 10
Czech Republic 10
India 10
South Africa 10
United States 10
Kenya 10
Poland 10
Canada 9
France 9
Sweden 9
Chile 9
Indonesia 9
Philippines 9
Bangladesh 8
Finland 8
Japan 8
Mexico 8
Romania 8
United Kingdom 8
Korea, Republic of 7
Netherlands 7
Slovakia (Slovak Republic) 7
Croatia 7
Thailand 7
Uganda 7
Bulgaria 6
Slovenia 6
Spain 6
Azerbaijan 6
Yemen, Republic of 6
Argentina 5
The highly ranked countries here are like those that are highly ranked for the distributed energy
profile market. In both markets, several indicators have similar levels of relevance. The Dispersed
Energy/Remote/Locked, Local Energy Price Premiums, Limited Access to Local Capital, Limited Access
to Energy, Limited Access to Trades, Disaster Vulnerability, and Diversify Energy Sources are all rated as
highly relevant for both markets. The relatively isolated and vulnerable areas captured in the distributed
energy profile market are more likely to suffer damage from natural disasters. At the same time, however,
the measures used to assess the indicator for Disaster Vulnerability, economic damage, and number of
internally displaced persons due to natural hazards, also capture the characteristics of more densely
populated areas and/or those with high levels of physical capital. Thus, while countries with several
relatively small and isolated areas rank highly in the dispersed energy market, many of these areas are

85
also subject to disruptions due to natural disasters. At the same time, such countries also have large urban
areas vulnerable to hazards will also rank highly in the disaster relief profile market.
7.2.6 Marine Propulsion Global Profile Markets
Virtually all commercial marine transport is fueled by bunker fuels that have negative environmental
effects. Further, given the relatively low numbers of sources for this type of fuel, this is a relatively high
cost energy source. As described in Section 6.1.5, the energy requirements for large container ships are on
the order of 40 MW with reductions in the required power with reductions is ship size. Thus, direct
propulsion of ships in the global marine transportation industry is ideally suited for microreactors. The
use of economically viable microreactors would not only reduce greenhouse gas emissions but also free
up significant amounts of cargo space, currently occupied by fuel for diesel generators, and increase the
amount of cargo able to be transported within each ship. As described in Section 6.2.5, the most highly
rated indicators in this profile market are Remote/Locked, Local Energy Price Premiums, Local Disaster
Vulnerability, and Diversify Energy Sources. The countries ranked in the highest half of the countries
analyzed in the assessment for this profile market are shown in Table 24. Highest ranked countries for
marine propulsion profile markets.
Nation Marine Propulsion Profile Market Score
India 10
China 10
Poland 10
South Africa 10
United States 10
Philippines 10
Czech Republic 10
Kenya 9
Mexico 9
Indonesia 9
Bangladesh 9
Romania 9
Thailand 9
Canada 8
France 8
Japan 8
United Kingdom 8
Chile 8
Yemen, Republic of 8
Azerbaijan 7
Croatia 7
Korea, Republic of 7
Sweden 7
Uganda 7
Namibia 7
Morocco 6
Mongolia 6

86
Slovakia (Slovak
Republic) 6
Sri Lanka 6
Slovenia 6
Iran, Islamic Republic
of 6
.
Table 24. Highest ranked countries for marine propulsion profile markets.
Nation Marine Propulsion Profile Market Score
India 10
China 10
Poland 10
South Africa 10
United States 10
Philippines 10
Czech Republic 10
Kenya 9
Mexico 9
Indonesia 9
Bangladesh 9
Romania 9
Thailand 9
Canada 8
France 8
Japan 8
United Kingdom 8
Chile 8
Yemen, Republic of 8
Azerbaijan 7
Croatia 7
Korea, Republic of 7
Sweden 7
Uganda 7
Namibia 7
Morocco 6
Mongolia 6
Slovakia (Slovak
Republic) 6
Sri Lanka 6
Slovenia 6
Iran, Islamic Republic
of 6

87
The rankings of countries within this profile market are, for the most part, consistent with
expectations. Most of these countries have either many commercial ports overall and/or have very large
ports capable of handling many ships and much cargo. India, China, and the Philippines, for example,
have very large ports as well as hundreds of smaller commercial ports (with over 800 commercial ports in
the Philippines alone). Further, many of the countries highly ranked in this profile market ship a large
volume of exports to other countries. In addition, some countries serve as shipping hubs for other
countries in their region. Poland’s Port of Gdynia, for example, has ranked first or second in the number
of containers shopped on the Baltic Sea over recent years. The placement of Slovenia, Romania, and
Azerbaijan among the top-ranked countries in this profile market may seem surprising but each has
specialties in the type and amount of cargo shipped. Slovenia’s Port of Koper, for example, is a major
port for container and automobile shipments for the Mediterranean region. Romania has nearly 40 ports
that handle the majority of good shipped via the Mediterranean and the Black Sea.
These rankings of the nuclear power and emerging nuclear Countries by profile markets are a step
toward assessing the projected market potential for microreactors. This report now brings together the
analysis of countries via individual profile markets based on the assessment of profile markets within
each of these countries. Further, the country assessments are incorporated into the global regions used in
the United Nations Series M, No. 49 global regions. As noted above in Section 7.1, these regions are used
by the IAEA as a basis of projecting nuclear and renewable energy capacity projections. Similarly, this
report uses these regions as a framework for demand projections of for microreactors. The classification
of these global regions is briefly reviewed here.
7.2.7 Market Analysis for IAEA Global Regions
The Statistics Division of the UN groups all the nations on the globe into geographic regions for use
in its analysis, databases, and reports. Further, other agencies, such as the IAEA and IEA, use the same
classification for a variety of energy-related studies and publications. These are noted by the UN, “these
geographic regions are based on continental regions, which are further subdivided into sub-regions and
intermediary regions drawn as to obtain greater homogeneity in sizes of population, demographic
circumstances and accuracy of demographic statistics” (UN 2021). The 63 nuclear power and emerging
nuclear countries addressed here are listed by UN geographic region in Table 20 and Table 21.
Table 20. United Nations geographic regions and associated countries.
Northern America
Latin America and
the Caribbean
Northern,
Western, and
Southern
Europe Africa Oceana
Canada Argentina Belgium Algeria
United States Bolivia Croatia Egypt
Brazil Finland Ghana
Chile France Kenya
Cuba Netherlands Morocco
Ecuador Slovenia Namibia
Mexico Spain Niger
Paraguay Sweden Nigeria
Venezuela United Kingdom Sudan
South Africa
Tunisia
Uganda

88
Table 21. United Nations geographic regions and associated countries.
Eastern Europe Western Asia Southern Asia
Central and
Eastern Asia
South-Eastern
Asia
Belarus Armenia Bangladesh China Indonesia
Bulgaria Azerbaijan India Japan Laos
Czech Republic Jordan Iran Korea Philippines
Hungary Saudi Arabia Pakistan Mongolia Thailand
Poland Turkey Sri Lanka Tajikistan
Romania United Arab Emirates Uzbekistan
Russian Federation Yemen
Slovakia
Ukraine
In the following section, the top-down regional assessment of the projected growth in energy demand
and types of energy production technologies reviewed in Section 7.1 is brought together with the bottom-
up assessment of the countries most aligned with the needs for the characteristics and applications
provided by microreactors for the different types of global profile markets by UN geographic regions.
7.3 Integration of Top-Down and Bottom-Up Analysis
According to IAEA nuclear power projections for the high case for RDS#1 Energy, Electricity and
Nuclear Power Estimates for the Period up to 2050 (IAEA 2020), future nuclear demand is not
geographically uniform. Nuclear programs in the U.S. and Europe have marginal growth, whereas most
growth is in developing portions of the world. The first set of regions shown in Figure 21 with the lowest
growth projections are in North and South America, Europe (other than eastern portion), Africa, and
Oceania. The highest potential growth projections are in the regions that include Eastern Europe and all of
Asia, as shown in Figure 22. These projections do not discriminate by technology type and are generally
representative of the range of nuclear projections provided in Section 7.1.
Figure 21. Global regional nuclear capacity additions (IAEA 2020).
1 2 6 0 06 2 8 2 02 824
4 010 1750
11 16
No. America Latin Am., Caribbean No., West, and So. Europe Africa Oceania
GW
e
Total Nuclear Capacity Additions (2030-2050) By RegionLow 2030 High 2030 Low 2050 High 2050

89
Figure 22. Global regional nuclear capacity additions (IAEA 2020).
Based on the microreactor global market bottom-up assessment, the regional market scores shown in
Figure 23 and Figure 24 provide a contrast to the IAEA global regional nuclear capacity additions. The
bottom-up analysis suggests microreactor markets could be strong in Northern, Western and Southern
Europe, Latin America, and Africa. North America also shows some potential for demand. Cumulative
demands across Asian markets are strong as is the potential demand in Eastern Europe.
Figure 23. Global regional comparative profile market scores 1 of 2 (INL 2021).
Figure 24. Global regional comparative profile market scores 2 of 2 (INL 2021).
The strength across energy markets is also noted, where the isolated operations and distributed energy
markets show the most potential across all regions. The first deployments are expected to be in isolated
EII in uses requiring energy reliability and security. In isolated operation deployment, the following
aspects should be considered:
• Costs competitive with diesel generators.
• Minimal on-site personal and semi-autonomous controls.
• Transportable to areas with limited access and infrastructure.
• Reliable with high-capacity factors, resilience to disruptions.
14
57
1030
018
69
18
64
030
5430 30 24
55
119
50
150
64
Eastern Europe Western Asia Southern Asia Central and Eastern Asia South-Eastern Asia
GW
eTotal Nuclear Capacity Additions (2030-2050) By Region
Low 2030 High 2030 Low 2050 High 2050
76168
242184
55103
191 157
3893 107 93
19 33 66 5018 37 50 54
North America Latin America, Caribbean No., West, and So. Europe Africa Oceania
Re
lati
ve M
arke
t sc
ore
s
Microreactor Profile Market Scores By RegionIsolated Operations Distributed Energy Resilient Urban Disaster Relief Marine Propulsion
208127 120
16692
139 100 93 109 8688 71 62 87 5153 31 30 37 2750 32 34 40 30
Eastern Europe Western Asia Southern Asia Central and Eastern Asia South-Eastern Asia
Re
lati
ve M
arke
t sc
ore
s
Microreactor Profile Market Scores By RegionIsolated Operations Distributed Energy Resilient Urban Disaster Relief Marine Propulsion

90
• Operate independently from the electric grid to supply highly resilient power for critical loads.
• Long lived fuel with long refueling cycles.
• No off-site power needed and minimal on-site construction in remote applications.
• Compatibility with local microgrids supporting facility operations.
• Compatibility with energy end-uses that are controlled through remote operation centers.
In distributed energy applications, additional capabilities beyond those needed for isolated operations
should also be considered, including:
• Cost competitive in the local energy market.
• Ability to produce electricity and non-electric products.
• Flexible power conversion system for energy integration with wind and solar.
• Ability to scale to meet changing loads over time, at multiple voltage outputs.
• Enhanced security and safeguards for deployment in global applications.
• Compatibility with mini-grids supporting local and regional energy markets.
Beyond these initial markets, embedded energy systems with place-based applications could be
important to penetrate resilient urban markets. The design of these system will need to be additionally
hardened against disruptions due to man-caused or natural events. For disaster relief operations, the
ability to quickly mobilize with little support from existing infrastructures is important. For marine
propulsion, the compactness of the reactor and modularity is important to allow multiple units to be
combined to meet the power requirements of a wide range of sizes and types of transport vessels.
Designs for microreactors should be paced with future market uses so capabilities can evolve over
time. Not all capabilities are needed for the first units, but long-term design plans should consider how the
designs need to adapt to new requirements over time to support new markets.
8. REGULATORY AND PLANNING CONSIDERATIONS
As countries consider microreactors for existing or new nuclear program priorities, the mature nuclear
industry will need to adapt to novel regulatory and planning considerations with advanced nuclear
technology. Progress in this area can be expected to be defined by learning and information-sharing
across regulators, industry, labs, and universities.
NOTE: This report recognizes that use of the indicator framework which is outlined in the previous
sections has certain limitations, particularly with respect to evaluating qualitative conditions
like regulatory and planning aspects. Users should tailor the indicator framework for local
application with the understanding that qualitative assessment, such as of the following
considerations, entails separate, critical evaluation.
8.1 Regulatory Considerations
8.1.1 Licensing and Certification in the U.S.
For nuclear reactor licensing and certification in the U.S., existing processes are designed for large
NPPs or research and test reactors (see Box B for licensing approaches in the U.S.). Research and test
reactors are more like microreactors with respect to power level and possible types of risks. Nonetheless,
key distinctions exist which limit the suitability of research and test reactor rules for microreactors.
Distinctions include dose consequences, operation period and plant balance, accident scenarios (e.g., loss
of coolant and loss of power), and open vs. closed systems which do not test or experiment (NEI 2019b;

91
NRC 1996 and 2018). Rule changes are necessary to account for novel design aspects of advanced
nuclear technology, such as with microreactors and broader SMRs (NAP 2020).
To validate key design features, microreactor designs may be demonstrated at a DOE site as full-scale
prototypes (Palmieri et al 2021). Unlike the current fleet of conventional NPPs in the U.S., microreactors
could use fuels suited for non-LWR designs and non-aqueous coolants, as well as be operated with load-
following, black-start capabilities, transportability, automated control systems, and reduced staffing. Such
considerations will require explicit address since the NRC has not routinely dealt with such designs for a
commercial license (Palmieri et al. 2021).

92
8.1.2 Diverse Regulatory Considerations
For demonstration and
commercialization of microreactors,
regulatory review of microreactors must
account for factory fabrication and shipping
of reactors with the fuel intact, as well as
alternative pathways in which the technology
and fuel may be shipped separately. Specific
to fabrication that produces a fully-contained
microreactor (or nearly complete reactor)
within a factory, conditions for assembly can
be more fully controlled than is typically the
case with assembly conditions outside a
factory. Licensing will need to account more
fully for access, control measures, and
safeguard requirements for the factory floor
in ways that haven't been previously
factored.
The prospect of shipping fully-contained
reactors opens a whole new set of questions
for treaties and rule-refinement pertaining to
transit in international waters/airspace,
radiation protection controls, export
requirements, etc. Assuming U.S.
microreactors are licensed and deployed for
an international market, non-U.S. customers
and importing countries will need to meet
U.S. legal and export requirements in
addition to the import-country rules. General
U.S. requirements are currently embodied in
10 CFR 110 (n.d.) “Export and Import of
Nuclear Equipment and Material” and in
DOE’s rules within 10 CFR 810 (n.d.),
“Assistance to Foreign Atomic Energy
Activities” and are expected to require
elaboration (Black 2020).
The international community has
recognized the need for a harmonization of
licensing processes and practices for nuclear
technology (WNA 2020), especially for
transport. In line with this, long-standing
international agreements and practices are
expected to require revisions to address
microreactor technology. Examples of
agreements include the Convention for the
Physical Protection of Nuclear Material,
Nuclear Non-Proliferation Treaty, IAEA
safeguards, and bilateral Nuclear
Reactor licensing rules and rule-making in the US require
approval from the NRC, the DOE, or the DoD (Palmieri et
al, 2021; Black, 2020).
Commercial use in the U.S.
Two licensing approaches exist for standard commercial
operation of a nuclear reactor requiring approval by the
NRC:
Two-step licensing to secure a Construction Permit (CP) +
Operating License (OL), based on 10 CFR-Part 50. This
process has been used for operating NPPs in the US.
A combined process for the above steps to secure a
Combined Operating License (COL), based on 10 CFR-Part
52. This process was utilized for the AP1000 NPP that is
under construction at the Vogtle plant in Georgia (Palmieri
et al 2021; Black 2020).
Requirements in the 2019 Nuclear Energy Innovation and
Modernization Act (NEIMA) triggered the development of
a third licensing approach by the NRC, commonly referred
to as Part 53 for 10 CFR-Part 53. Specific to this new
licensing option, NEIMA directed the NRC to develop a
revised framework for advanced reactors by 2027. The
proposed new approach is reflected in the Licensing
Modernization Project which was revised and posted for
public comment in June 2020 (NRC, 2020; Palmieri et al,
2021).
Non-commercial use in the U.S.
Distinct from the above commercially-focused licensing, a
microreactor may be licensed by DOD or DOE for non-
commercial use: In accordance with the Atomic Energy
Act, Provision 91b, DOD licensing is applicable for a
reactor owned by DOD or its contractor. Licensing for the
DOD Pele Program reflects such approach (Palmieri et al,
2021; McMurray, 2020). DOE licensing is applicable for a
reactor owned by the DOE, its contractor, or is operated on
a DOE-controlled site and is not utilized for demonstration
of eventual commercial services. Licensing for the Versatile
Test Reactor and Advanced Test Reactor represents this
path (U.S. DOE n.d.).
BOX B. NUCLEAR REACTOR LICENSING IN THE U.S.

93
Cooperation Agreements. Additional security, safety, and safeguard address will similarly be required for
large-scale shipments of High-Assay Low-Enriched Uranium (HALEU) fuels up to 19.9% enrichment
which is not commonplace. New microreactor shipping and fuel transport packages will also need to be
developed, tested, and approved (Owusu et al. 2018; Bradford 2014).
Industry safety planning for operations and maintenance is focused on plant design features such as
passive cooling using natural forces to transfer decay heat (NEI 2019b); highly accident-tolerant fuel;
small thermal power outputs; low-power density for LWRs; high-thermal capacity of graphite structures;
and strongly negative temperature coefficients of reactivity (GAIN et al. 2019). New security and
safeguard scenarios for vandalism, terrorism, and non-proliferation, as well as to the capability for rapid
response from operational teams and external impact assessments will also need to be addressed,
particularly in conjunction with remote and underground siting, and for contexts reflecting different forms
and rigor of protection.
The development of codes and standards will be important to support new, non-LWR as well as LWR
designs of microreactors (see Section 2). This has significance for new materials, technologies, fuels, and
advanced manufacturing that may leverage 3D printing, artificial intelligence for data analysis, or supply
chain changes (Black 2020).
Because the scale of microreactor technology is much smaller than NPPs, emergency planning zones,
distances needed to meet dose-based regulatory criteria, and assembly space could be adjusted to align
with the rescaled size (Owusu et al. 2018). Broadly, physical security and access considerations will need
to account for critical qualitative determinations early in the decision analysis process as well as
throughout implementation and decommissioning. Designs, defense-in-depth analysis, and monitoring
will also need to adjust for altered security, safety, and safeguard needs.
The potential for semi-autonomous and what some see as potential for autonomous control introduces
more novel considerations for control room design, staffing, surveillance, maintenance, inspections/
inspectors together with the levels of safety and security thresholds. Those who conceive of remote and
semi-autonomous use, for instance, as well as utilization in forward military operations and other risk
scenarios must account for the security and control risks associated with clandestine purposes (Lyman
2019; Vitali et al 2018; Caves and Carus 2021; Waksman 2020; Mehta 2020). Importantly, economic
analysis that considers cost reductions, must recognize staffing, siting, surveillance, and fuel enrichment
choices are highly interconnected and cannot be made in isolation. Similarly, control room design,
maintenance and inspection are also closely linked and should not be independently optimized. Here,
security and safety by design approaches may address some of these concerns by front-loading several
risk mitigation factors and not leaving these for late implementation planning.
As industry seeks early regulatory guidance, for example, to focus the designs and potential business
decisions, regulators also need data and sufficient designs to inform testing and rulemaking guidance on
safety, safeguards, and security. A current hurdle for regulatory assessments is the lack of operational
data. Information might be available for proposed systems and technology that are already used in non-
nuclear facilities, such as data relating to heat pipes, supercritical CO2, and other potential components
(Samanta et al. 2019). Nonetheless, risk analysis will also need to account for differences in the operating
environment (Chandrasekaran, Lee, and Willis, 1985), plus adaptations will be necessary for the unique
operational life cycle and components of microreactors (Samanta et al. 2019). Novel equipment that has
not been previously manufactured or which has not been used by the nuclear industry will also require
new codes and standards for equipment performance, qualifications, and testing requirements (Samanta et
al. 2019).
To address the regulatory adaptations amidst ongoing learning, several measures are underway or
possible. The NRC and the Canadian Nuclear Safety Commission (CNSC) signed a memorandum of
collaboration (MOC) to partner on technical reviews of advanced reactor/SMR technologies (NRC 2019).
With this MOC, companies such as Terrestrial Energy, NuScale, X-Energy, and General Electric Hitachi

94
(GEH) are engaging with regulators (Teplinsky 2021). Cooperation might be expanded to other countries
and broadened for joint licensing reviews, and MOCs between laboratories to support licensing and
demonstration (Teplinsky 2021). For newcomer countries, another approach may be to accept the design
review by a competent regulator of another country. Naturally, this requires local buy-in of the external
authority’s legitimacy and rigor.
Knowledge exchanges are also currently carried out with cross-sectoral, technical meetings that
explore design-regulatory priorities, such as with the IAEA Small Modular Reactors Regulators Forum
(n.d.) or Gateway for Accelerated Nuclear (GAIN) Program (n.d.) (GAIN et al. 2019). Advanced nuclear
demonstration and deployment testing hubs, like the Nuclear Reactor Innovation Center (NRIC), also
facilitate a closing of key technology-regulatory gaps by supporting inventor-developers navigating the
permitting and regulatory pathways. As conceived, NRIC may provide a microreactor test-bed for a
“bounding” set of reactor types. By developing an approved plant parameter envelope that will feed into
the overall National Environmental Policy Act analysis, NRIC could provide a more plug-and-play ability
for demonstration projects that fit within the bounds of the permitting analysis.
In line with the global potential for microreactors, it is important to highlight licensing differences
can exist between mature and emerging markets. In mature markets, vendors may encounter different,
established regimes with varying requirements and licensing approaches. Design certification/approval is
unique to each jurisdiction and could entail years for deployment (Teplinsky 2021). Uncertainty of the
timelines and costs can be a barrier to market entry and investment. With emerging markets, nuclear
safety, security, and safeguard rules plus related regulation on radiation protection may be insufficient in
each location to support deployment of nuclear technology. Many emerging markets also do not have the
resources, local expertise, or institutional capacity to oversee nuclear development (Teplinsky 2021).
Currently, the IAEA provides guidance, standards, and case studies, but no harmonized approach to
licensing exists. Specific to radiation protection, the International Commission on Radiological Protection
also provides guidance and standards, but these will likely require adaptations for microreactor
technology. Recognizing microreactors may serve varied export markets representing a range of
regulatory readiness and cultures for safety, security and safeguards, security by design should also aim to
include new uses and exposures.
8.1.3 Additional Planning Considerations
Microreactor siting, operation and maintenance have distinct considerations for what applies to NPPs
and SMRs. Likewise, complex trade-offs will need to be weighed for local conditions.
Microreactors that may be located in off-grid locations for EII, such as pulp and paper or data centers
will have different socio-technical boundaries and sensitivities compared to reactors sited near population
centers for electrified public transit or that are used in mobile emergency response units. Remote regions,
such as Alaska which has high diesel fuel costs and weather-based impediments to fuel delivery, may be
more inclined to adopt microreactor technology (UAA 2020). Somewhat differently, new uses for
powering ice breaker ships and electrifying agricultural may encounter distinct needs and valuing of
social, environmental, and economic feasibility.
Standardization of microreactor technology is seen as an important way to learn and gain economies
of scale. From a regulatory standpoint, standardization allows for more robust control in a confined
environment. It can also reproduce a problem. Here, inspections will need to occur at the factory and final
facility site. Challenges also exist in scaling novel technology, as adopters typically want to see concrete
gains over the status quo, among other considerations, before selecting a new technology (Rodgers 2003).
In addition, the cost gains with economies of scale assume precisely large-scale adoption. Until a cost
competitive threshold is reached with scaled production, costs can be a barrier.
In the rapidly changing cyber-risk environment (Araújo and Pepper 2018; Subharwall et al. 2021),
there are favorable and unfavorable features to microreactor technology. Planned reliance primarily on

95
automated control systems and sensors provides a potentially vulnerable surface area for cyber-attack. At
the same time, learning in a rapidly changing cyber playing field can be more readily incorporated into
design refinements with modular production. However, planning that assumes self-contained modules are
shipped, installed underground, used for perhaps 10+ years, and then shipped for decommissioning and
may need to account for cyber updates of microreactors requiring adjustments at factor sites.
Decommissioning and decontamination costs reflect another planning consideration for different
national markets. In the U.S., nuclear projects must have sufficient funds in place before the initiation of
facility operations (Black et al. 2020). This threshold will likely be lower for microreactors, given their
scale. Decisions will also need to be made about insurance cost thresholds. In the U.S., the Price-
Anderson Act sets the liability limit. For each reactor site, as opposed to for reactor, NPP owners
currently pay an annual premium of $450 million in private insurance for off-site liability coverage (NRC
n.d.). Adaptations are expected for microreactor technology.
Given the smaller reactor footprint and technology changes of microreactor technology, EPZs and
distances required to meet dose-based regulatory criteria are areas for clarification. Critics note support
for reduced zones is based on models and assumptions that have not yet been tested (Union of Concerned
Scientists 2013). This is an area of regulation and institutional knowledge that remains unsettled.
International recommendations on EPZs (also called urgent protective action planning zones) for reactors
of 100–1000+ MWth indicate a radius of 5–30 km, and for reactors that are 2–10 MWth or 10–100 MWth,
recommendations are 0.5 km and 0.5–5 km, respectively (IAEA 2007). For microreactors without on-site
refueling capability, regulators should consider the establishment of an EPZ for any intermediate stop and
land-based maintenance facility used for the handling and the storage of the fuel assemblies (SMR
Regulators’ Forum 2018). For microreactors that may be sited in proximity to population centers,
regulators will need to consider some level of community emergency preparedness. Here, the same
microreactor design that is implemented in different countries may encounter different EPZ size
requirements, depending on dose criteria, policy factors, and public acceptance (SMR Regulators’ Forum
2018).
Microreactor deployment potential raises new areas for regulatory clarification, revised planning, and
further study. For instance, what are the natural limits for microreactor security and related correlations
between fuel enrichment, staff size, utilization of sensors, etc. How can security by design be best
integrated into novel design development? To what extent are vendors from different countries
accounting for this approach? What does this approach miss? How can advances in human factors
analysis inform and be informed by new scenarios for microreactor deployment? This report represents a
step to advance progress in these areas.
9. SUMMARY AND CONCLUSIONS
This report focuses on future, global microreactor markets and their potential for replacing fossil
sources and for complementing other low-carbon technologies, with regulatory considerations noted.
Microreactor design characteristics are compared to the performance needs of different market sectors.
Market deployment indicators that were originally developed for SMR markets are adapted for
microreactors to identify localized markets. A top-down analysis of emerging trends in global energy
markets including a range of possible demands for microreactors in 2030–2050 is developed. A bottom-
up analysis was performed, analyzing 63 countries that currently use nuclear power or that indicate
interest in developing a nuclear program. A framework for analyzing country market sectors for
microreactors is presented along with summaries ranking prospective markets and their geographical
distribution.
For microreactors to capture new market shares, some significant challenges must be overcome, and
an appropriate balance achieved between market demands, technology performance, costs, regulatory
compliance costs, and public acceptance. The novelty aspects of microreactors, competition for one or
more dominant designs, and limited operational data translate to uncertainty in the regulatory and

96
planning domain. Key questions exist with respect to the transport of microreactors and its fuel, among
other safety, security, and safeguard areas. Potential for remote and semi-autonomous use merits
additional scrutiny for cyber and physical risks. Knowledge exchanges through technical collaborations
and testing centers focus on some of these priorities.
In conclusion:
• Initial deployments of microreactors by 2030 have the potential to support energy markets not
available to large nuclear plants in traditional energy markets. Microreactors have potential to expand
nuclear power’s contribution in North America and Western Europe that otherwise show low future
growth. Mid-term deployments beginning around 2035 could expand microreactors to Eastern Europe
and in Asia where energy infrastructures are under development, and to support new nuclear markets
in emerging economies. Longer term deployment (2040–2050) could support urban markets and
megacities lacking access to energy and susceptible to climate change, disaster relief by replacing
portable diesel generators, and in future low-carbon shipping vessels.
• Based on analysis of low-carbon scenarios by the IPCC and others, microreactors could help close the
gap on zero carbon by 2050 by replacing fossil sources for electric and non-electric uses and assisting
the ramp up of variable renewable sources in the energy system. Filling these gaps could take
hundreds of microreactor units by 2040 and thousands by 2050.
• Microreactor technology has the potential to bolster decarbonization and forms of resilience strategies
for a variety of regions and applications. As research, development, and demonstration advance
across a wide range of designs, near-term questions require regulatory address with respect to
transporting microreactors and fuel as well as novel safety, security, and safeguards considerations.
Questions about scale changes to EPZ requires further consideration. Also, decisions about remote
and semi-autonomous use must evaluate security in terms of staffing, siting, surveillance, and fuel
enrichment which are highly interconnected and cannot be analyzed in isolation. Similarly, control
room design, maintenance and inspection are also closely linked and should not be independently
optimized. Cyber risks will require additional scrutiny since remote and semi-autonomous use are
positioning nuclear generation for novel settings.
• In terms of key learning across regulatory bodies and industry, several knowledge exchange
opportunities are possible or underway. These include current collaboration by the NRC and CNSC,
IAEA Small Modular Reactors Regulators Forum, GAIN Program, and advanced nuclear
demonstration and deployment testing with the NRIC.
• In basic market terms, for microreactors to achieve deep penetration in markets will require achieving
specific aggressive cost targets; however, they will not compete with centralized energy sources.
Consideration of costs beyond the demonstration units is necessary to insure producibility and
scalability for factory deployment.
Further understanding of the potential markets may be achieved through integrated studies that
evaluate the trade-offs between the required microreactor functionality to support emerging market uses,
the regulatory rigor needed for licensing, and understanding the value elements to monetize and
determine what is important in a “place-based” market.
10. REFERENCES
Abou-Jaoude, A., A. Foss, Y. Arafat, B. Dixon, 2021. “An Economics-by-Design Approach Applied to a
Heat Pipe Microreactor Concept”, Idaho National Laboratory, INL/EXT-21-01201.
Ahmed, S.J., J.D. Logarta, 2017. “Electricity-Sector Opportunity in the Philippines The Case for Wind-
and Solar-Powered Small Island Grids,” Institute for Energy Economics and Financial Analysis

97
https://ieefa.org/wp-content/uploads/2017/05/Electricity-Sector-Opportunity-in-the-Philippines_May-
2017.pdf
Araújo, K., S. Pepper, 2018. “Cyber-Nuclear Risk Assessment,” Technical Report, Brookhaven National
Laboratory, Upton, NY.
ARPA-E, 2020. “Transportable Modular Reactor,” ARPA-E Meitner Award webpage. https://arpa-
e.energy.gov/?q=slick-sheet-project/transportable-modular-reactor
ANS, 2021. “TerraPower’s Natrium demo is headed to Wyoming,” Nuclear News, June 2021.
https://www.ans.org/news/article-2958/terrapowers-natrium-demo-is-headed-to-wyoming/
Black, G., D. Shropshire, K. Araújo, 2020. “Small Modular Reactor Adoptions: Opportunities and
Challenges for Emerging Markets,” in: Ingersoll and Carelli (Eds.) The Handbook of Small Modular
Reactors. Elsevier-Woodhead Publishing, Cambridge, MA.
Black, R., 2020. “Licensing of Small Modular Reactors,” in: Ingersoll and Carelli (Eds.) The Handbook
of Small Modular Reactors. Elsevier-Woodhead Publishing, Cambridge, MA.
BloombergNEF, 2018. “Microgrid Control Systems Part II: Vendor Profiles,” Published on 29 August
2018.
BloombergNEF, 2019. “State of the Microgrid Market in 2019 Microgrids meeting multiple goals,” June
20, 2019.
BloombergNEF, 2020a. “Solar Power Is Taking Largest Slice of Minigrids Market,” July 09, 2020.
BloombergNEF, 2020b. “State of the Global Mini-grids Market Report 2020,” https://minigrids.org/wp-
content/uploads/2020/06/Mini-grids_Market_Report-20.pdf,
Bradford, A. 2014. “Fuel and Waste Considerations for SMRs and Advanced Reactors,” presentation at
ML1417, June 11, 2014.
Campbell, R., 2020. “UK announces funding for development of advanced modular nuclear reactors,”
Engineering News, https://www.engineeringnews.co.za/article/uk-announces-funding-for-
development-of-advanced-modular-nuclear-reactors-2020-07-13
Canadian Nuclear Laboratories, 2020. “CNL & USNC Partner on SMR Fuel Research,” CNL Press
Release https://www.globenewswire.com/news-release/2020/02/26/1991283/0/en/CNL-USNC-
Partner-on-SMR-Fuel-Research.html
Carlsson, J., D. Shropshire, A. van Heek, M. Fütterer, 2012. “Economic viability of small nuclear reactors
in future European cogeneration markets,” Energy Policy 43 pp. 396–406.
Caves, J., W. Carus, 2021. “The Future of Weapons of Mass Destruction: An Update, National
Intelligence University Presidential Scholar Paper,” February 2021, https://ni-u.edu/wp/wp-
content/uploads/2021/02/Future_of_WMD_Final.pdf
Chandrasekaran, T., J. Lee, C. Willis, 1985. “Calculation of Releases of Radioactive Materials in Gaseous
and Liquid Effluents from Pressurized Water Reactors,” NUREG 7-11, Rev 1, Div. of Sys
Integration, Office of Nuclear Reactor Regulation, U.S. NRC, Wash, DC. April 1985.
Deign, J., 2020. “Why Cities Are the Growth Market for African Minigrids,” Green Tech Media.
https://www.greentechmedia.com/articles/read/why-cities-are-the-growth-market-for-african-
minigrids
Department of Energy, 2021 https://www.energy.gov/ne/nuclear-reactor-technologies/versatile-test-
reactor, Accessed June 1, 2021.
Edson, N. et al., 2016. “Market and Technical Assessment of Micro Nuclear Reactors,” Nuvia Ltd.
Energy Sector Management Assistance Program (ESMAP), 2019. “Mini Grids for Half a Billion People:
Market Outlook and Handbook for Decision Makers,” ESMAP Technical Report;014/19. World
Bank, Washington, DC. © World Bank. https://openknowledge.worldbank.org/handle/10986/31926
License: CC BY 3.0 IGO

98
Englert, D., A. Losos, C. Raucci, T. Smith, 2021. “The Potential of Zero-Carbon Bunker Fuels in
Developing Countries,” World Bank, Washington, DC. © World Bank. April 2021.
https://openknowledge.worldbank.org/handle/10986/35435 License: CC BY 3.0 IGO.
Farrell, J., 2011. “The Challenge of Reconciling a Centralized v. Decentralized Electricity System,” ILSR,
Institute for Local Self-Reliance, Oct.17, 2011. https://ilsr.org/challenge-reconciling-centralized-v-
decentralized-electricity-system/
Filippone, C. et al., 2020. “Transportable Modular Reactor by Balance of Plant Elimination,” HolosGen
presentation for ARPA-E. https://arpa-
e.energy.gov/sites/default/files/HolosGen_Nuclear_Project_Presentation_HolosGen_public.pdf
Forsberg, C., A. Foss, 2021. “Markets and Economic Requirements for Fission Batteries and Other
Nuclear Systems,” MIT CANES/INL, MIT-ANP-TR-191, March 2021.
GAIN (n.d.). https://gain.inl.gov/SitePages/What%20is%20GAIN.aspx, Accessed May 25, 2021.
GAIN et al, Micro-Reactor Workshop, June 18-19, 2019. Idaho National Laboratory, Idaho Falls, ID,
https://gain.inl.gov/SitePages/Workshops.aspx.
Galford, C., 2021. DailyEnergyInsider. Accessed on June 2021: PG&E swaps traditional electric poles,
wires for first remote microgrid in high fire-threat area–Daily Energy Insider.
Green Car Congress, 2018. “ARPA-E awarding up to $24M to 10 projects to support advanced nuclear
power plants,” https://www.greencarcongress.com/2018/06/20180604-arpae.html
Herzog, K., 2015. “Remote Alaskan villages move from diesel to wind power,”
https://grist.org/article/remote-alaskan-villages-move-from-diesel-to-wind-power
Hofste, R.W., P. Reig, L. Schleifer, 2019. “17 Countries, Home to One-Quarter of the World’s
Population, Face Extremely High Water Stress,” World Resources Institute.
https://www.wri.org/insights/17-countries-home-one-quarter-worlds-population-face-extremely-high-
water-stress
IAEA, 2007. “Arrangements for Preparedness for a Nuclear or Radiological Emergency,” SG-GS-G2.1,
International Atomic Energy Agency, Vienna, Austria.
IAEA, 2018. “Advances in Small Modular Reactor Technology Development, A Supplement to: IAEA
Advanced Reactors Information System (ARIS)” 2018 Edition.
https://aris.iaea.org/Publications/SMR-Book_2018.pdf
IAEA, 2019. “Deployment Indicators for Small Modular Reactors, Methodology, Analysis of Key
Factors and Case Studies,” IAEA-TECDOC-1854.
IAEA, 2020a. “Advances in Small Modular Reactor Technology Developments, A Supplement to: IAEA
Advanced Reactors Information System (ARIS),” 2020 Edition, https://aris.iaea.org/
IAEA, 2020b. “Reference Data Series No. 1 (RDS#1), Energy, Electricity and Nuclear Power Estimates
for the Period up to 2050,” IAEA-RDS-1/40, ISBN 978-92-0-118120-6, ISSN 1011-2642.
IAEA, 2021. “Small Modular Reactors Regulators Forum (n.d.),” https://www.iaea.org/topics/small-
modular-reactors/smr-regulators-forum, Accessed May 25, 2021.
IEA, 2020. “World Energy Outlook 2020,” ISBN 978-92-64-44923-7, ISSN 2072-5302,
www.iea.org/weo.
Ingersol, D., M. Carelli, 2021. “Handbook of Small Modular Nuclear Reactors,” Elsevier. ISBN: 978-0-
12-82916-2.
IPCC, 2018. “SR1.5 Special Report, Global Warming of 1.5C, Section 4. Strengthening and
Implementing the Global Response and Supplementary Material 2.SM.1.3” https://www.ipcc.ch/sr15/
IRENA, 2019. “Innovation landscape brief: Renewable mini-grids,” International Renewable Energy
Agency, Abu Dhabi. https://www.irena.org/-

99
/media/Files/IRENA/Agency/Publication/2019/Sep/IRENA_Renewable_mini-
grids_2019.pdf?la=en&hash=CFE9676B470A96F7A974CB619889F5810A06043E
Jeerh, G., M. Zhang, S. Tao, 2021. “Recent Progress in Ammonia Fuel Cells and their Potential
Applications,” Journal of Materials Chemistry A, 9:2, pp. 727–752.
King, M., L. Huntzinger, T. Nguyen, 2011. “Feasibility of Nuclear Power on U.S. Military installations,”
CRM D0023932.A5/2REV. https://www.cna.org/CNA_files/PDF/D0023932.A5.pdf
Kishore, et al. 2018. “Mortality in Puerto Rico after Hurricane Maria,” New England Journal of Medicine,
379 pp. 162–170.
Lyman, E., 2019. “The Pentagon Wants to Boldly Go Where No Nuclear Reactor has Gone Before. It
Won’t Work, Bulletin of Atomic Scientists,” February 22, 2019, https://thebulletin.org/2019/02/the-
pentagon-wants-to-boldly-go-where-no-nuclear-reactor-has-gone-before-it-wont-work/
McMurray, N., 2020. “One of World’s Largest Energy Consumers Embracing Advanced Nuclear,”
March 10, 2020, https://clearpath.org/our-take/one-of-worlds-largest-energy-consumers-embracing-
advanced-nuclear/
Mehta, A., 2020. “Pentagon awards contracts to design mobile nuclear reactor,” Defense News, March
2020, https://www.defensenews.com/smr/nuclear-arsenal/2020/03/09/pentagon-to-award-mobile-
nuclear-reactor-contracts-this-week/
McMurray, N., 2020. “One of World’s Largest Energy Consumers Embracing Advanced Nuclear,”
https://clearpath.org/our-take/one-of-worlds-largest-energy-consumers-embracing-advanced-nuclear/
NDAA, 2019. National Defense Authorization Act, https://www.congress.gov/bill/115th-congress/house-
bill/5515
Nuclear Alternative Project (NAP), 2020. “Preliminary Feasibility Study for Small Modular Reactors and
Microreactors for Puerto Rico,” Report No. 20-0001 Rev 0, May 11, 2020.
https://www.nuclearalternativeproject.org/work
Nuclear Energy Agency (NEA), 2016. “Small Modular Reactors: Nuclear Energy Market Potential for
Near-term Deployment,” OECD Publishing, Paris, www.oecd-nea.org/ndd/pubs/2016/7213-smrs.pdf.
Nuclear Energy Agency (NEA), 2019. “The Costs of Decarbonisation: System Costs with High Shares of
Nuclear and Renewables,” OECD 2019, NEA No. 7299.
Nuclear Energy Agency (NEA), 2021. “Small Modular Reactors: Challenges and Opportunities,” OECD
Publishing, Paris, https://www.oecd-nea.org/jcms/pl_57979/small-modular-reactors-challenges-and-
opportunities
Nuclear Engineering International, 2019. “Micro Modular Reactor moves forward in Canada,”
https://www.neimagazine.com/features/featuremicro-modular-reactor-moves-forward-in-canada-
7481285
Nuclear Energy Institute (NEI), 2019a. “Cost Competitiveness of Micro-Reactors for Remote Markets,”
White Paper, April 2019, https://www.nei.org/resources/reports-briefs/cost-competitiveness-micro-
reactors-remote-markets
Nuclear Energy Institute (NEI), 2019b. “Micro-reactor Regulatory Issues,” White Paper, Nov 13, 2019,
https://www.nei.org/CorporateSite/media/filefolder/resources/reports-and-briefs/NEI-White-Paper-
Micro-Reactor-Regulatory-Issues.pdf
Nuclear Energy Institute (NEI), 2018. “Roadmap for the Deployment of Micro-Reactors for U.S.
Department of Defense Domestic Installations.”
NRC, 1996. “Guidelines for Preparing and Reviewing Applications for the Licensing of Non- Power
Reactors,” NUREG-1537, https://www.nrc.gov/reading-rm/doc-collections/nuregs/staff/sr1537/
100
NRC, 2014. “Standard Review Plan for the Review of Safety Analysis Reports for Nuclear Power
Plants,” NUREG-0800 (n.d.).
NRC, 2018. “Applications for Nuclear Power Plants,” Regulatory Guide 1.206, Revision 1,
https://www.nrc.gov/docs/ML1813/ML18131A181.pdf
NRC, 2020a. “Regulatory Review of Micro-Reactors – Initial Considerations,” Feb. 5, 2020.
NRC, 2020b. “Guidance for a Technology-Inclusive, Risk-Informed, and Performance-Based
Methodology to Inform the Licensing Basis and Content of Applications for Licenses, Certifications,
and Approvals for Non-Light Water Reactors,” 85 FR 35339.
NRC, (n.d.). “Backgrounder on Nuclear Insurance and Disaster Relief,” https://www.nrc.gov/reading-
rm/doc-collections/fact-sheets/nuclear-insurance.html, Accessed June 3, 2021.
NRC Staff, 2018. “Options and Recommendations for Physical Security for Advanced Reactors,” August
1, 2018, SECY-18-0076. https://www.federalregister.gov/documents/2020/06/09/2020-
12402/guidance-for-a-technology-inclusive-risk-informed-and-performance-based-methodology-to-
inform-the
NRC and CNSC, 2019. “Sign Historic Memorandum to Enhance Technical Reviews of Advanced/Small
Modular Reactor Technologies,” News, August 15, 2019, https://www.nrc.gov/reading-rm/doc-
collections/news/2019/19-037.pdf
Owusu, D., M. Holbrook, P. Sabharwall, S. Bragg-Sitton, 2018. “Regulatory and Licensing Strategy for
Microreactor Technology,” INL/EXT-18-51111, Idaho National Laboratory.
Palmieri, T., M. Corradini, P. Wilson, 2021. “Analysis of the Case for Federal Support of Micro-Scale
Nuclear Reactors to Provide Secure Power at U.S. Government Installations,” University of
Wisconsin-Madison, Institute for Nuclear Energy Systems.
Patel, S., 2020. “OPG Becomes First Utility to Snag Ownership Stake in Nuclear Microreactor Project,”
Power. https://www.powermag.com/opg-becomes-first-utility-to-snag-ownership-stake-in-nuclear-
microreactor-project
POWER, 2020. “The Quest for Next-Generation Nuclear Fuels,” https://www.powermag.com/the-quest-
for-next-generation-nuclear-fuels
PR Newswire, 2020. “Global First Power, Ultra Safe Nuclear Corporation and Ontario Power Generation
Form Joint Venture to Own, Operate Micro Modular Reactor Project at Chalk River,”
https://www.prnewswire.com/news-releases/global-first-power-ultra-safe-nuclear-corporation-and-
ontario-power-generation-form-joint-venture-to-own-operate-micro-modular-reactor-project-at-chalk-
river-301072936.html
Renewable and Sustainable Energy Review, 2021. “Prospects for Nuclear Microreactors: A Review of the
Technology, Decision Analysis and Regulatory Considerations,” revised paper submitted for
publication.
Reuters, 2021. “Singapore port authority launches $90 mln decarbonization fund,” Accessed May 2021:
https://www.reuters.com/article/singapore-shipping/singapore-port-authority-launches-90-mln-
decarbonisation-fund-idUSL1N2ME0FR
Ritchie, H., M. Roser, 2019. "Natural Disasters". Published online at OurWorldInData.org.
https://ourworldindata.org/natural-disasters
Rodgers, E., 2003. “Diffusion of Innovation” (5th Edition). Simon and Schuster, Boston, MA.
SaskPower, 2021. “Feasibility of Small Modular Reactor, Development and Deployment in Canada,”
prepared by SaskPower, Energie NB Power, Bruce Power and Ontario Power Generation.
SBIR-STTR, 2020. “Ultra Safe Nuclear Corporation: Company Information,”
https://www.sbir.gov/sbc/ultra-safe-nuclear-corporation
101
Shropshire, D., et al, 2012. “Benefits and cost implications from integrating small flexible nuclear
reactors with off-shore wind farms in a virtual power plant,” Energy Policy, pp. 558–573.
SMR Regulators’ Forum, 2018. “Pilot Project Report: Report from Working Group on Emergency
Planning Zone,” IAEA https://www.iaea.org/sites/default/files/18/01/smr-rf-report-appendix-iv-
29012018.pdf
Sabharwall, P., J. Gibb, C. Ritter, K. Araújo, A. Gupta, I. Ferguson, R. Fisher, Y. Ballout (2021).
Cybersecurity for Microreactors in Advanced Energy Systems, Cyber Security.
Teplinsky, E., 2021. “Getting Policies and Regulations Right for Advancing Technology Deployment:
Harmonization and Facilitation of SMR Licensing,” IAEA Virtual Workshop on the Economics of
Emerging Reactor Concepts, including Micro and Small Modular Reactors, June 4, 2021.
Third Way, 2020. “Mapping the Global Market for Advanced,” September 22, 2020.
https://www.thirdway.org/
UAA, 2011. “Small Scale Modular Nuclear Power: an option for Alaska?” University of Alaska, Alaska
Center for Energy and Power and the Institute for Social and Economic Research.
https://acep.uaf.edu/media/147559/Small-Scale-Modular-Nuclear-Power-an-option-for-Alaska-2011-
ACEP-and-ISER.pdf
UAA, 2020a. “Customer Discovery and Perception” University of Alaska, Center for Economic
Development.
https://static1.squarespace.com/static/59f6b60bcf81e02892fd0261/t/60189afcbc397811525aca24/161
2225286635/Customer+Discover+and+Perception+Analysis.pdf
UAA, 2020b. “Use Case Analysis: Executive Summary,” University of Alaska, Center for Economic
Development.
https://static1.squarespace.com/static/59f6b60bcf81e02892fd0261/t/60189a8fc18e871112eff45b/1612
225177349/Use+Case+Analysis_Executive+Summary.pdf
UK Department for Business, Energy & Industrial Strategy, 2018. “Advanced Modular Reactor (AMR)
Feasibility and Development (F&D) Project,” Abstracts from the Applicant Organisations’ Proposals.
UNDRR, 2019. "Global assessment report on disaster risk reduction."
https://www.undrr.org/publication/global-assessment-report-disaster-risk-reduction-2019.
UN DESA, 2017a. “World population projected to reach 9.8 billion in 2050, and 11.2 billion in 2100,”
United Nations Department of Economic and Social Affairs.
https://www.un.org/development/desa/en/news/population/world-population-prospects-2017.html.
UN DESA, 2017b. “World population projected to reach 9.8 billion in 2050, and 11.2 billion in 2100,”
https://www.un.org/development/desa/en/news/population/world-population-prospects-2017.html
UN DESA, 2018a. “Majority of the world’s cities highly exposed to disasters, UN DESA warns on World
Cities Day,” United Nations Department of Economic and Social Affairs.
https://www.un.org/development/desa/en/news/population/world-cities-day-2018.html.
UN DESA, 2018b. “68% of the world population projected to live in urban areas by 2050, says UN,”
United Nations Department of Economic and Social Affairs.
https://www.un.org/development/desa/en/news/population/2018-revision-of-world-urbanization-
prospects.html
US NRC, 2020. “Aurora–Oklo Application,” https://www.nrc.gov/reactors/new-reactors/col/aurora-
oklo.html
UxC, 2020. “Global Nuclear Market Assessment Based on IPCC Global Warming of 1.5° C Report,”
https://www.nei.org/resources/reports-briefs/uxc-global-nuclear-market-assessment-report

102
Vitali, J., J. Lamothe, V. Peoples, K. McCabe, 2018. “Study on the Mobile Use of Nuclear Power Plants
for Ground Operations,” October 26, 2018, Deputy Chief of Staff, U.S. Army,
https://apps.dtic.mil/dtic/tr/fulltext/u2/1064604.pdf.
Waksman, J., 2020. “Project Pele Overview: Mobile Nuclear Power for Future DOD Needs,” GAIN,
March 2020, https://gain.inl.gov/GAINEPRINEI_MicroreactorProgramVirtualWorkshopPres/Day-
2%20Presentations/Day-2-am.02-Nichols_PeleProgOverviewPublicMarch2020,19Aug2020.pdf
WNA, 2020. “Harmonization of Reactor Design Evaluation and Licensing: Lessons Learned from
Transport,” Report No. 2020/012.
WNA, 2021. “Small Nuclear Power Reactors,” https://www.world-nuclear.org/information-
library/nuclear-fuel-cycle/nuclear-power-reactors/small-nuclear-power-reactors.aspx
WNN, 2019. “U-Battery SMR moves to next stage of Canadian assessment,” World Nuclear News,
https://www.world-nuclear-news.org/Articles/U-Battery-SMR-moves-to-next-stage-of-Canadian-asse

103
Page intentionally left blank

104
Appendix A
Benchmarking Deployment Indicators
This section is provided to provide additional information about the SMR benchmarking deployment
indicators described in Section 4. These indicators are not used directly in this study but are provided for
reference purposes. More information on the indicators may also be found in the IAEA report
Deployment Indicators for Small Modular Reactors: Methodology, Analysis of Key Factors, and Case
Studies (IAEA Tech-Doc 1854 2018).
National Energy Demand
This category assesses the overall growth of energy demand within a country. The three SMR
indicators are viewed as benchmarking indicators for microreactors in that they convey information about
general conditions within a country but are not specific indicators of demand for microreactors. The first
of these, Growth of Economic Activity (GDP GWTH), indicates high rates of economic growth may
correspond to an increase of new energy production, including both SMR and microreactor adoption. eee
Countries are ranked according to their growth rate of real GDP during the preceding 10-year period.
Strong economic growth is reflected by increased economic activity, including income, employment, and
domestic production, and may correspond to an increase in energy demand and increased ability to
finance new energy sources. Because several developing countries with relatively small overall GDP, but
high rates of economic growth, have expressed interest in nuclear development programs, the growth in
real GDP was used to assess likely future energy demand rather than measures of national GDP or per-
capita GDP.
More direct assessments of energy demand are given by the benchmarking indicators growth rates of
primary energy consumption (GRPEC) and per-capita energy consumption (PC-EC). GRPEC measures
the change in the demand for energy over time by constructing the annual growth rates of primary energy
consumption over the previous 10-year period. Countries are ranked according to the growth rate of
energy demand with the view that countries with higher rates of energy consumption are more likely to
seek new energy production means unless efficiencies are introduced. Similarly, the indicator PC-EC
assesses the demand conditions of energy markets by ranking countries on the basis PC-EC rather than
overall growth rates of energy demand with the view that high rates of PC-EC suggest a country may seek
new sources of energy production, absent of efficiency measures.
The SMR benchmarking indicators for national energy demand are relevant at a national level for
new nuclear energy technologies that require significant capital costs, financing, infrastructures, and other
conditions. The indicators in this category, Growth of Economic Activity, the Growth Rate of Primary
Energy Consumption, and PC-EC, are all often positively correlated with an increased demand for new
energy sources at a national level and are likely to be more applicable to larger energy production
facilities than for microreactor deployment within a country. As a result, these are not included as
microreactor deployment indicators. In the Third Way (2020) study, electricity production and population
were used as indicators of national energy demand.
eee Notably, greater efficiency will delink the level of association between energy consumption and GDP.

105
Financial and Economic Sufficiency
The indicators for national energy demand incorporate the growth rate of a nation’s economy and
potential energy demand rather than the ability of countries to support investments in new energy sources.
For SMRs, financial and economic sufficiency is assessed with the three indicators in the
Financial/Economic Sufficiency category. The indicator, Ability to Support New Investments (GDP/PC-
GDP), ranks countries based on real GDP, the standard measure of the size of a nation’s economy. It also
includes per-capita GDP, the standard to compare the average level of economic well-being across
countries. For both SMR indicators, countries are ranked with higher levels of each indicator being
associated with potentially increased demand and ability to support new energy sources. Another SMR
indicator, Fitness for Investment (CREDIT), measures the ability of countries to support new energy
development. Countries with lower external debt and higher credit ratings will have greater ability to
finance such projects and are more likely to obtain lower interest rates which, given the high capital costs
of nuclear energy projects, will reduce their financing costs. Therefore, low levels of external debt and
high ratings in international credit markets are conducive to SMR deployment. The last SMR indicator in
this category, Openness to International Trade (FDI/TRADE) measures the openness of a country to
international trade and Foreign Direct Investment (FDI). FDI measures the net inflows of foreign capital
for a country, and TRADE measures the level of international trade as a percentage of GDP. Relatively
high rankings for each of these indicators signifies not only receptivity of a country to foreign investment
but also the readiness on the part of foreign investors to make investments in new capital projects in a
country. Given the cost of new nuclear facilities and the likelihood that these will be imported for most
countries, high rankings for each of these are expected to correlate with increased SMR deployment.
The three SMR benchmarking indicators in the Financial/Economic Sufficiency measure the size of a
country’s economy, its ability to obtain credit via global financial markets, and its openness to imports.
Of these, a country’s GDP and per-capita GDP are relevant for SMRs under the assumption the size of a
nation’s economy must be large enough to support costly new energy development programs. Similar
indicators were used in the Third Way (2020) study, which employed data on GDP as well as gross
national income (GNI) and per-capita GNI as a measure of the size and growth of nations’ economies.
Similarly, the benchmarking indicator, Fitness for Investment (CREDIT), measures a country’s credit
worthiness in global financial markets and is included in the SMR benchmark indicators under the
assumption relatively large amounts of financing will be required for new energy development projects
within a country. Of note in the study by Black et al. (2015), a minimum level GDP and per-capita GDP
were used as necessary conditions for SMR deployment, along with a minimum electric grid capacity.
These factors are not applicable to microreactors and, as a result, no minimum levels for a country’s
economic size, credit worthiness, or electric capacity are specified as necessary conditions for
consideration in this report. It is noted here one necessary condition in the Third Way (2020) study is
population size, with countries having populations less than 1 million excluded from further
consideration. Given the size of microreactors relative to other advanced nuclear technologies, countries
were not excluded from consideration in the present report based on population size.
Some SMR indicators used for benchmarking in previous studies are considered here but are not
included as part of the quantitative assessment process. The indicator in the first of these categories is the
Openness to International Trade indicator, measured by the levels of FDI in a country, and included as an
SMR indicator as a proxy for the openness of a country’s economy. For many emerging markets, both
SMRs and microreactors will likely be imported. Therefore, countries with high trade barriers and low
levels of FDI are loosely estimated to have lower market potential for these energy technologies. The
countries designated as nuclear power countries by the IAEA are viewed here as having met this
benchmarking condition on the grounds of their already having nuclear power capabilities. Of these
nations, the country with lowest level of FDI is Armenia, with a net inflow of 254 million USD for 2019
(World Bank FDI Databank 2021). This is significantly lower than the rest of the Nuclear Power
106
Countries.fff Of the 31 countries listed as Emerging Nuclear Energy Countries (WNA 2020), shown in
Table 6, three countries have significantly lower levels than this. Bolivia, Namibia, and Yemen all have
negative levels of net FDI inflow. It is also noted here Venezuela has a low level of net FDI inflows,
although it is somewhat higher than Armenia. Although this report does not consider any necessary
conditions for microreactor deployment, the investment environment in these countries should be
considered when evaluating potential markets for microreactors and are discussed as part of the
quantitative evaluation of potential microreactor markets.
Physical Infrastructure Sufficiency
The three SMR indicators in this category assess the capability of a country to support relatively large
new energy facilities. The SMR indicator Electric Grid Capacity (GRID) assesses whether a country’s
electric grid is of sufficient size for SMR deployment given the capacity recommendations of the IAEA.
This forms a barrier for SMR deployment for several small countries but, after the recommended
threshold is passed, increased grid capacity is associated with an increased ability to accept SMRs.
Similarly, the SMR indicator Infrastructure Conditions (INFRA) measures the transportation,
communications, and electrical distribution infrastructure to assess the technological conditions within a
country to support SMR deployment. Finally, the Land Availability (LAND) indicator assesses the
amount of land for new energy projects proximal to utility or grid systems. Given the siting requirements
for NPPs, low levels of land availability are associated with a lower potential for SMR deployment.
These indicators need to be modified for microreactors. For example, the SMR indicator in this
category, Electric Grid Capacity (GRID), is omitted here. The grid requirements for large power plants or
SMRs are not applicable given the small electrical output of microreactors. Similarly, the SMR indicator
Land Availability (LAND) is also omitted because of the small size dramatically reduced spacing
requirements for microreactors compared to large NPPs, fossil fuel plants, and large wind or solar
installations.
The SMR indicator Infrastructure Conditions (INFRA) is modified here and termed Limited Access
to Energy (LAE). This microreactor-specific indicator relates to the local access to existing energy
transmission and distribution sources to support basic societal needs for clean and sustainable sources of
energy. A new microreactor indicator in this category is Limited Access to Trades/QA (TRADES/QA).
This indicator represents the capacity for skilled, qualified trades and the supply chain needed to support
construction, operations, and quality assurance. Large nuclear and fossil fuel power facilities require the
availability of a skilled labor force and a supply chain for initial construction as well as ongoing operation
and maintenance activities over the life of the facility. Given their off-site manufacturing and ability to
operate independently, microreactors are well suited to areas with low levels of skilled labor force
availability and limited supply chain. With reasoning similar to that for the above Local Access to Energy
indicator, a low rating for the microreactor indicator Limited Access to Trades/QA (TRADES/QA) is
deemed to be favorable for microreactor deployment given their simpler designs that limit on-site
construction activities and limited supply chain needs.
Climate Change Motivation
One of the motivators for increasing low-carbon energy production is to support a country’s
decarbonization goals by reducing fossil fuel usage and reducing greenhouse gas emissions. The
indicators in this category assess these motivations. The SMR indicator Reduce CO2 Emissions Per
Capita (CO2) is aimed at assessing a county’s level of greenhouse gas emissions. Countries with high
levels of carbon emissions on a per-capita basis are likely to have relatively high levels of carbon
emissions in general and are more likely to be incentivized to adopt low-carbon energy sources.
fff FDI for Armenia is less than half of the amount for Iran, the next lowest of the Nuclear Power Countries in terms of FDI.

107
Similarly, countries with a relatively high reliance on fossil fuels for energy production may be more
likely to adopt SMRs for future energy development strategies. Thus, the SMR indicator Reduce Fossil
Fuel- Energy Consumption (FOSSFUEL/OGC) measures the percentage of oil, coal and natural gas used
for energy production with high scores for this indicator signifying conditions favorable to SMR
deployment. For microreactors, this indicator is modified and termed Reduce Energy Imports/Diversify
Energy Sources.
Finally, the SMR indicator Achieve NDC Carbon Reduction Goals (NDC) uses the Nationally
Determined Contributions (NDC) registry of carbon reduction commitments as part of the UN
Framework Convention on Climate Change. Countries with more aggressive climate change mitigation
goals are assessed to be more likely to pursue SMRs as part of their energy production strategy. The
motivation to reduce carbon emissions to address carbon reduction goals is addressed for microreactors in
the Balance Intermittent Renewables microreactor indicator. A discussion of the role of a country’s NDC
carbon reduction goals is included in the country evaluation of microreactor potential in Section 7.2.
Energy Supply Surety Motivation
The energy supply surety motivation category focuses on the risks related to energy security.
Increasing the level of domestically produced energy can increase the level of energy surety within a
country. The SMR indicator Use Uranium Resources (URAN) is employed for those countries with
demonstrated uranium resources that are likely to be economically viable to extract over the short- and
medium-term and measures the uranium resources in a country. Countries with such domestic uranium
deposits are more likely to engage in nuclear development programs such as the deployment of SMRs.
However, this indicator is omitted here as this is not deemed to be a significant motivator for microreactor
usage.
108
Appendix B
Value Elements
The Emerging Energy Market Analysis Initiativeggg supports multivariate, multidisciplinary value
analyses for each profile market to create a baseline understanding of deployment considerations and to
quantify the potential value for similar markets. Many attributes of “value” may be monetized to provide
a cost-basis comparison, but some attributes are not conducive to quantification. The value of a market
application lies at the complex intersection of system attributes that address the various market needs.
Examples of system attributes that might influence value differently in various profile market contexts
include, but are not limited to:
• Availability (timeline for development)
• Affordability (capital finance, operations costs) and maintainability
• Avoided monetary cost of fossil fuel electric power
• Avoided monetary cost of fuel for space heat
• Economic development potential
• Benefits of additional energy use
• Human health benefits from reduced fossil fuel and wood combustion
• Avoided carbon emissions
• Environmental benefits of reduced fossil fuel supply chain activity
• Modularity of deployment
• Simplicity, adaptability, and scalability
• Safety and security
• Deployment
• Operational flexibility
• Resilience to disruption
• Energy price stability
• Community acceptance (culturally consistent with values)
• Self-determination/local control.
ggg Refer to: http://www.ema.inl.gov
109
Appendix C
Indicators and Data Sources
This appendix defines the data sources assigned to each of the deployment indicators. The country’s
level and regional results from this analysis are provided in Section 7.2.
Indicator 1: Local Economic Growth Trends
The yearly percent change in GDP was examined for the nation in question from 2010 to 2015. The
five values for each nation were then averaged, and that value was used as a single representative value to
reflect the local economic growth the nation was experiencing. Each nation’s average GDP value was
then pooled into a single set that included nations considered “nuclear power countries” as well as nations
considered “emerging nuclear energy nations” where a decile ranking across all nations was performed
and a score or “rank” ranging from 1–10 was assigned to each nation with a score of one reflecting
average GDP growth that fell at or below the 10th percentile of this pool and a score of 10 reflecting
average GDP growth that was greater than the 90th percentile of this pool. A similar process was
employed with a set only inclusive nations considered “nuclear power countries” as well as a set only
inclusive of nations considered “emerging nuclear energy countries.” Data on the yearly percentage
change in GDP was taken from the World Bank. Following this process, nations where reliable data was
unable to be found were automatically assigned the lowest possible score—note these nations were not
included in the sets when performing decile rankings, and the bottom score was assigned only after all
other scores were tabulated.
Source: https://data.worldbank.org/indicator/NY.GDP.MKTP.KD.ZG?view=chart
Indicator 2: Dispersed Energy/Remote/Locked
The 2019 rural population as a percentage of the total national population for the nation in question
was used as a single reflective value of the most recent/current need for energy stemming from peoples
distanced from normal “energy hubs,” such as large urban centers. The continued barriers that exist in
bringing “traditional” energy sources to these people as well as barriers that hinder migration to urban
centers/necessitate the use of the rural landscape acted as cause to examine solely the most recent figures.
As with the previous indicator, three separate scoring systems were used, all based on decile rankings.
The first set examined all nations, the second and third sets were inclusive of only “nuclear power
countries” or “emerging nuclear energy countries”, respectively. A score of one reflects a rural population
as a percentage of the national population that falls at or below the 10th percentile of the sample set in
question; a score of 10 reflects a rural population as a percentage of the national population that is greater
than the 90th percentile of the sample set in question. Rural population percentage values were taken from
the World Bank. Following this process, nations where reliable data was unable to be found were
automatically assigned the lowest possible score—note these nations were not included in the sets when
performing decile rankings, and the bottom score was assigned only after all other scores were tabulated.
Source: https://data.worldbank.org/indicator/SP.RUR.TOTL.ZS?view=chart

110
Indicator 3: Local Cogeneration
Already analyzed decile-ranking values were pulled from the work of Rubel et al. to reflect district
heating potential for the reactors. Unlike the previous indicators, the decile values found through this
work were considered usable for all three sets in question—“nuclear power countries,” “emerging nuclear
energy countries,” and the set composed of all nations. Nations without an available score from this
source were assigned the lowest possible score.
Source: Rubel, F., K. Brugger, K. Haslinger, I. Auer, 2017. “The climate of the European Alps: Shift of
very high resolution Köppen-Geiger climate zones 1800–2100,” Meteorol. Z., 26, pp.115–125.
Indicator 4: Local Energy Intensive Industries
Four separate industries were chosen to be reflective of EII that were likely be found to an
appreciable enough degree across the nations being examined – steel production, iron ore production, oil
processing, and chemical production. World Population Review provided 2021 national data on steel
production (in terms of millions of metric tons); BP Statistical Review of World Energy 2020 was used to
examine national oil refining capacity from 2010–2019 (in terms of thousands of barrels per day); Index
Mundi was used for aggregative data on 2012 national iron ore production taken from the U.S. Geological
Survey (USGS) Minerals Resources Program (in terms of million metric tons); and Chemiewirtschaft in
Zahlen 2020 was used for 2019 national chemical production (in terms of revenue, billions of euros). Due
to the extensive difficulty in finding standardized figures that may accurately reflect the energy required
and utilized with regards to the production of one good vs. another (say, steel vs. oil), a consistent and
credible energy discrepancy between the industries could not be established and information was not
found to be available. For this reason, the production data found was summed together and summed value
was representative of the totality of EII within the nation in question. As with previous indicators, three
separate sets were created—one consisting solely of “nuclear power countries,” one consisting solely of
“emerging nuclear energy countries,” and one consisting of all nations—and a decile-ranking process as
previously described was performed. A score of one would reflect a summed energy intensive industry
value that fell at or below the 10th percentile of the countries analyzed, and a score of 10 would reflect a
summed energy intensive industry value that was greater than the 90th percentile value of the nuclear and
newcomer nuclear countries. Following this process, nations where reliable data was unable to be found
were automatically assigned the lowest possible score—note these nations were not included in the sets
when performing decile rankings, and the bottom score was assigned only after all other scores were
tabulated.
Sources:
Steel Production: https://worldpopulationreview.com/country-rankings/steel-production-by-country
Oil Refining Capacity - BP Statistical Review of World Energy 2020, p. 29
Iron Ore Prod: https://www.indexmundi.com/minerals/?product=iron%20ore&graph=production
Chemical Production - Chemiewirtschaft in Zahlen 2020, pp. 120-121, https://www.vci.de/vci-online/die-
branche/zahlen-berichte/chemical-industry-in-figures-online.jsp
Indicator 5: Local Energy Price Premiums/Seasonal
Current national electricity prices (kWh, USD) and diesel prices (liter, USD) were tabulated for each
nation. Data used was taken in early May 2021, and prices were found through Global Petrol Prices
(please note information is updated weekly). Nations were placed into sets as before (“nuclear power
countries,” “emerging nuclear energy countries,” and all nations), and the decile scoring process was
performed on each set separately for each energy source. Each set corresponding to a specific energy
source was then compared to its sister set from the alternate energy source, and the higher score was
ultimately used as representative of the local energy price premiums the nation was experiencing. (For
example, the decile-based score stemming from electricity prices assigned to a nation within the

111
“emerging nuclear energy Countries” set was then compared with the decile based score stemming from
diesel prices that the same nation received within the same set. After comparison, the higher score was
used.) Following this process, nations where reliable data was unable to be found were automatically
assigned the lowest possible score – note that these nations were not included in the sets when performing
decile rankings and that the bottom score was assigned only after all other scores were tabulated.
Sources:
Electricity Prices - https://www.globalpetrolprices.com/electricity_prices/
Diesel Prices - https://www.globalpetrolprices.com/diesel_prices/
Indicator 6: Limited Access to Local Capital
The Global Competitiveness Report 2017 – 2018 was used to reflect each nation’s access to local
capital by examining the report’s listed score (ranging from 1-7) assigned to each nation’s financial
market development (listed under the eighth pillar for each nation). These financial market development
scores were tabulated and the decile scoring process was used on the three nation sets that have been
previously mentioned. A score of 1 would reflect a comparatively low financial market development
score as reported in the GCR (at or below the 10th percentile for the set in question) while a score of 10
would reflect a comparatively high score as reported by the GCR (greater than the 90th percentile for the
set in question). Following this process, nations where reliable data was unable to be found were
automatically assigned the lowest possible score – note that these nations were not included in the sets
when performing decile rankings and that the bottom score was assigned only after all other scores were
tabulated.
Source: The Global Competitiveness Report 2017-2018 http://www3.weforum.org/docs/GCR2017-
2018/05FullReport/TheGlobalCompetitivenessReport2017%E2%80%932018.pdf
Indicator 7: Limited Access to Energy
The 2018 total population count and the 2018 percentage of the total population that had access to
energy were examined for each nation. These values were then used to calculate the number of persons in
each nation that did not have access to energy in 2018. This calculated figure was then considered a
reflective value on the most recent count of people that did not have access to energy for each nation.
Three sets as previously detailed were then created (“Nuclear Power Countries”, “Emerging Nuclear
Energy Countries”, and the set composed of all nations being examined) were then created and the decile
scoring system was employed as previously described. A nation receiving a score of 1 would reflect a
nation that has a number of persons without access to energy as being at or below the 10th percentile for
the set in question, while a score of 10 would reflect a nation with a number of persons without access to
energy being greater than the 90th percentile for the set in question. The data to perform this decile scoring
was taken from the World Bank.
Additionally, The Global Competitiveness Report 2017-2018 was used to examine each nation’s
quality of electricity score (as assigned by the GCR; see 2.07 under Infrastructure). These assigned quality
of electricity scores were then used to perform a similar decile scoring system with each nation. The two
found scores for each nation – the decile score stemming from the number of individuals without energy
and the decile score stemming from the nation’s quality of electricity – were then averaged to obtain a
final score for each nation to be used as a reflective measure of the nation’s limited access to energy. For
each contributing factor of the overall indicator’s score, following the initial set up of the decile scoring
system and after properly assigning each nation its decile score based on the information available,
nations that did not have any data available were assigned the lowest possible decile score.

112
Sources:
Total National Pop: https://data.worldbank.org/indicator/SP.POP.TOTL
Pop (%) w/ Access to Energy: https://data.worldbank.org/indicator/EG.ELC.ACCS.ZS?view=chart
Quality of Elec. - The Global Competitiveness Report 2017–2018:
http://www3.weforum.org/docs/GCR2017-
2018/05FullReport/TheGlobalCompetitivenessReport2017%E2%80%932018.pdf
Indicator 8: Local Access to Trades/QA
Three separate contributing factors were used to find a reflective value of each nation’s local access
to trades—the nation’s local availability of specialized training services, the nation’s local supplier
quantity, and the nation’s local supplier quality. The Global Competitiveness Report 2017–2018 assigned
each nation a score on each of these factors (5.07, 11.01, and 11.02, respectively), and the decile scoring
system as previously detailed was employed for each nation and each set of factors (as previously
detailed). These contributing factor decile scores were then respectively weighted by a ratio of 2:1:1 to
reach a final decile score value for each set that was representative of each nation’s local access to trades.
Nations that did not have information available for a contributing factor had the lowest possible score
assigned, as an assumption, to that factor following all other nations being properly scored.hhh
Source: The Global Competitiveness Report 2017–2018: http://www3.weforum.org/docs/GCR2017-
2018/05FullReport/TheGlobalCompetitivenessReport2017%E2%80%932018.pdf
Indicator 9: Climate Change/Disaster Vulnerability
The internally number of displaced persons due to natural disasters was examined for each nation and
each nation displaced persons number was used for the decile scoring system as previously detailed. Note
most of the data examines each nation for 2017, but there are also several nations where 2017 data was
not available. When this occurred, the nearest year data was used – nations where 2017 data was not used
are detailed below along with their collection year.iii A decile score of one would reflect a nation having a
displaced persons number at or below 10th percentile of the set in question, while a score of 10 would
reflect a nation with a displaced persons number greater than the 90th percentile for the set in question.
2016: Algeria, Egypt, Romania, Turkey, and Ukraine
2015: Mongolia, Sweden
2014: Morocco
2013: Czech Republic, Finland
2012: Azerbaijan
2010: Poland
Additionally, the direct economic loss (in USD) due to natural disasters in 2018 was examined for
each nation and a decile scoring system was performed as previously detailed. Please note much of the
data examines each nation for 2018, but there are several nations where 2018 data was unavailable. When
this occurred, the nearest year data was used – nations where 2018 data was not used are detailed below
along with their collection year. A decile score of one would reflect a nation that experienced an
hhh Finetuning of this indicator at a local level is highly encouraged, since aptitude for specialized training is qualitative and not
well-captured in quantitative data sets.
iii As with the training/education levels of the workforce indicator, this one is also very rudimentary and local finetuning is highly
encouraged. Using the number of people displaced in the most recent reported disaster year does not account for the fact that
extreme weather events are increasingly occurring out of step with historical trends.
113
economic loss at or below the 10th percentile for the set in question, while a decile score of 10 would
reflect a nation that experienced an economic loss above the 90th percentile for the set in question.
2017: Argentina, Armenia, Chile, Croatia, Czech Republic, Egypt, Finland, France, Jordan, Kenya, South
Korea, and Mongolia
2016: South Africa
2015: Bolivia and Venezuela
2014: Turkey
2012: Laos
2011: Iran
2010: Yemen
The decile scores found for each nation across each under the respective data detailed—displaced
people and economic loss—were then compared and the higher score was ultimately assigned as the
representative score for the nation under this indicator. For either data set being examined, if a nation did
not have data available then the lowest possible score was assigned to it following the properly performed
decile scoring of all other nations.
All data used here was taken from Our World in Data.
Sources:
Displaced Persons: https://ourworldindata.org/natural-disasters
Economic Loss: https://ourworldindata.org/grapher/direct-disaster-economic-loss?tab=table
Indicator 10: Diversify Energy Sources/Reduce Imports
Each nation’s energy use by source portfolio was examined, and three energy sources were selected
as being representative of fossil fuel sources – coal, natural gas, and oil. The combined percent makeup of
these three sources for each nation’s energy portfolio was then used to perform a decile scoring method
across three sets as previously described. A decile score of one would reflect a nation that has a percent
composition of its energy portfolio stemming from fossil fuels being at or below the 10th percentile of the
set in question, while a score of 10 would reflect a nation that has a percent composition of its energy
portfolio stemming from fossil fuels being greater than the 90th percentile for the set in question. The most
recently available data was heavily mixed between several years. Each nation along with the
corresponding data’s collection year are listed below.
2019: Brazil, Canada, Chile, Czech Republic, Finland, France, Hungary, Japan, Korea (South), Lithuania,
Mexico, Netherlands, Poland, Slovakia, Slovenia, Spain, Sweden, Turkey, United Kingdom, and
United States.
2018: Algeria, Argentina, Armenia, Azerbaijan, Bangladesh, Belarus, Bolivia, Bulgaria, China, Croatia,
Cuba, Ecuador, Egypt, Ghana, India, Indonesia, Iran, Jordan, Kazakhstan, Kenya, Laos, Mongolia,
Morocco, Namibia, Niger, Nigeria, Pakistan, Paraguay, Philippines, Poland, Romania, Russia, Saudi
Arabia, Sri Lanka, South Africa, Sudan, Taiwan, Tajikistan, Thailand, Tunisia, Ukraine, United Arab
Emirates, Uzbekistan, Venezuela, and Yemen.
Source:
IEA: https://www.iea.org/countries
114
Indicator 11: Balance Intermittent Renewables/Scalability
The percent composition of energy stemming from renewable sources (wind, solar, etc.) as part of
each nation’s energy portfolio was examined. The values underwent a decile scoring method across three
sets as previously described. A decile score of one reflects a nation with a percent energy composition
stemming from renewable sources being at or below the 10th percentile for the set in question, while a
decile score of 10 reflects a nation with a percent energy composition stemming from renewables being
greater than the 90th percentile for the set in question. Each nation along with its corresponding year of
collection is detailed below.
2019: Brazil, Canada, Chile, Czech Republic, Finland, France, Hungary, Japan, Korea (South), Lithuania,
Mexico, Netherlands, Poland, Slovakia, Slovenia, Spain, Sweden, Turkey, United Kingdom, and
United States.
2018: Algeria, Argentina, Armenia, Azerbaijan, Bangladesh, Belarus, Bolivia, Bulgaria, China, Croatia,
Cuba, Ecuador, Egypt, Ghana, India, Indonesia, Iran, Jordan, Kazakhstan, Kenya, Laos, Mongolia,
Morocco, Namibia, Niger, Nigeria, Pakistan, Paraguay, Philippines, Poland, Romania, Russia, Saudi
Arabia, Sri Lanka, South Africa, Sudan, Taiwan, Tajikistan, Thailand, Tunisia, Ukraine, United Arab
Emirates, Uzbekistan, Venezuela, and Yemen.
Source: IEA: https://www.iea.org/countries

115
Appendix D
Smart Grids
Smart grids, along with demand-side measures, are tools to help balance grids and are important to
the integration of VRE sources, although they can also introduce added cyber risk. To make grids
“smart”, they require upgrades by digitizing them along with adding switching equipment, transformers,
meters, and other crucial components. In the United States and the EU, roughly one-fifth of current
networks may need to be replaced or digitalized if the “smart approach” is favored. The majority (60%) of
global line replacements and new lines are needed in emerging market and developing economies, with
China alone accounting for a third of what is needed (over 7 million km). The replacements and new lines
are an order of magnitude greater in distribution systems than for transmission as shown in Figure D-1.
Figure D-1. Length of new and replaced electricity network lines by selected region, 2019–2030
(IEA 2020).

116
Appendix E
System Inertia
Markets for inertia will increase as wind and solar PV capacities increase shares in the global energy
mix. These sources typically connect to the grid through direct current (DC) to alternating current (AC)
inverters and therefore do not contribute to power system inertia. Power system inertia is the ability of a
power system to oppose changes in system frequency due to resistance from a rotating mass, such as the
rotor of a synchronous generator. Even though wind farms use consists of rotating machines, they are
electrically decoupled from the grid frequency using an inverter. An undesirable split may occur when a
single synchronized electrical grid separates into two synchronized electrical grids following a large
disturbance.
According to BNEF, beyond two-thirds penetration of inverter-based generation at any time can
introduce key stability concerns. Smaller grids, such as the UK and Texas, are particularly susceptible but
larger grids, such as continental Europe will start to see issues, such as the risk of system splits, as the
share of decentralized energy rises. In BNEF’s Energy Transition Scenario shown in Figure E-1,
production from inverter-based generation rises to 74% in the United Kingdom and to 79% in Texas by
2050. Country achievement of net-zero goals will push this higher and sooner.
Figure E-1. Share of inverter-based capacity Source: BloombergNEF (2020a).

117
Appendix F
Factory Production Learning Basis
From Section 7.1.10, learning rates to achieve cost targets from 2030 to 2050 are assumed here to be
like those for commercial rooftop solar PV during the 10-year period of 2010 to 2020 of 70%. This
represents a cost reduction from $0.50/kWh (unit 10) to $0.15/kWh (unit 10,000). The cost declines are
shown for different PV markets in Figure F-1. This acceleration of cost reductions is unprecedented in
nuclear builds but assumes that factory-built units and large order books would provide the scale needed
for mass deployment. There are similarities of microreactors to SpaceX Falcon 9 rockets that are
manufactured under precision requirements, launched under harsh environmental conditions, and
recovered and reused in new operations.
Source:
NREL: https://www.nrel.gov/news/program/2021/documenting-a-decade-of-cost-declines-for-pv-
systems.html#:~:text=%E2%80%9CA%20significant%20portion%20of%20the,Senior%20Financial
%20Analyst%20David%20Feldman
Figure F-1. Cost Declines in PV solar systems (NREL 2021).

118
Appendix G
Global Profile Markets Scoring for All Nuclear Power Countries and Emerging Nuclear Countries
This appendix provides tables with the rankings of all nuclear power and emerging nuclear countries
for each global profile market. Also reference Section 7.2 for further details.
Table G1. Ranking of all countries for isolated operations profile markets.
Nation Isolated Operations Profile Market Score
China 40
India 40
United States 40
France 39
South Africa 39
Poland 38
Mexico 37
Sweden 37
Chile 37
Canada 36
Japan 36
Czech Republic 35
Kenya 35
United Kingdom 33
Philippines 33
Indonesia 32
Mongolia 32
Korea, Republic of 31
Romania 31
Argentina 30
Turkey 29
Bangladesh 28
Croatia 28
Russia (Russian Federation) 26
Iran, Islamic Republic of 25
Slovenia 25
Finland 23
Morocco 23
Thailand 23
Yemen, Republic of 23
Bulgaria 22

119
Netherlands 22
Spain 22
Azerbaijan 22
Brazil 20
Slovakia (Slovak Republic) 20
Bolivia 19
Jordan 19
Namibia 18
Uganda 18
Ukraine 17
Tajikistan 16
Sri Lanka 15
Armenia 13
Belgium 13
Hungary 13
Tunisia 13
Pakistan 12
United Arab Emirates 12
Uzbekistan 11
Ecuador 10
Egypt (Egypt, Arab Rep.) 9
Saudi Arabia 9
Algeria 8
Cuba 7
Ghana 7
Belarus 6
Nigeria 6
Laos (Lao, PDR) 4
Niger 4
Paraguay 4
Sudan 4
Venezuela 4
Table G2. Ranking of all countries for distributed energy profile markets.
Nation Distributed Energy Profile Market Score
China 30
India 30
South Africa 30
United States 30
Indonesia 29
Kenya 29

120
Mexico 28
Sweden 28
Philippines 28
Japan 27
France 26
United Kingdom 26
Poland 26
Canada 25
Czech Republic 25
Chile 25
Korea, Republic of 23
Netherlands 23
Thailand 23
Romania 22
Bangladesh 21
Finland 20
Spain 20
Turkey 20
Sri Lanka 20
Slovakia (Slovak Republic) 19
Morocco 18
Belgium 17
Croatia 17
Namibia 17
Uganda 17
Jordan 16
Mongolia 16
Yemen, Republic of 16
Brazil 15
Azerbaijan 15
Slovenia 14
United Arab Emirates 14
Bulgaria 13
Russia (Russian Federation) 13
Ghana 12
Iran, Islamic Republic of 11
Pakistan 11
Argentina 10
Armenia 10
Hungary 10
Egypt (Egypt, Arab Rep.) 9

121
Saudi Arabia 9
Tajikistan 9
Tunisia 9
Ukraine 8
Bolivia 8
Nigeria 7
Ecuador 6
Laos (Lao, PDR) 6
Cuba 5
Uzbekistan 4
Belarus 3
Algeria 3
Niger 3
Paraguay 3
Sudan 3
Venezuela 3
Table G3. Ranking of all countries for resilient urban profile markets.
Nation Resilient Urban Profile Market Score
China 20
India 20
Mexico 20
United States 20
Sweden 19
Chile 19
Poland 19
Canada 18
Japan 18
South Africa 18
Indonesia 18
France 17
Korea, Republic of 17
United Kingdom 17
Kenya 17
Mongolia 17
Czech Republic 16
Philippines 16
Bangladesh 15
Turkey 15
Argentina 14
Thailand 14

122
Iran, Islamic Republic of 13
Russia (Russian Federation) 13
Netherlands 12
Romania 12
Azerbaijan 12
Bolivia 12
Morocco 12
Brazil 11
United Arab Emirates 11
Namibia 11
Saudi Arabia 11
Finland 10
Slovakia (Slovak Republic) 10
Spain 10
Uganda 10
Croatia 9
Jordan 9
Sri Lanka 9
Uzbekistan 8
Armenia 7
Slovenia 7
Tajikistan 7
Belgium 6
Bulgaria 6
Ukraine 6
Cuba 6
Ecuador 6
Egypt (Egypt, Arab Rep.) 6
Yemen, Republic of 6
Pakistan 5
Ghana 5
Hungary 4
Algeria 4
Tunisia 4
Laos (Lao, PDR) 3
Paraguay 3
Belarus 2
Niger 2
Nigeria 2
Sudan 2
Venezuela 2

123
Table G4. Ranking of all countries for disaster relief profile markets.
Nation Disaster Relief Profile Market Score
China 10
Czech Republic 10
India 10
South Africa 10
United States 10
Kenya 10
Poland 10
Canada 9
France 9
Sweden 9
Chile 9
Indonesia 9
Philippines 9
Bangladesh 8
Finland 8
Japan 8
Mexico 8
Romania 8
United Kingdom 8
Korea, Republic of 7
Netherlands 7
Slovakia (Slovak Republic) 7
Croatia 7
Thailand 7
Uganda 7
Bulgaria 6
Slovenia 6
Spain 6
Azerbaijan 6
Yemen, Republic of 6
Argentina 5
Belgium 5
Turkey 5
Mongolia 5
Morocco 5
Namibia 5
Sri Lanka 5
Tajikistan 5
Armenia 4

124
Hungary 4
Pakistan 4
Russia (Russian Federation) 4
United Arab Emirates 4
Jordan 4
Brazil 3
Iran, Islamic Republic of 3
Ukraine 3
Bolivia 3
Ghana 3
Tunisia 3
Ecuador 2
Egypt (Egypt, Arab Rep.) 2
Laos (Lao, PDR) 2
Nigeria 2
Saudi Arabia 2
Uzbekistan 2
Belarus 1
Algeria 1
Cuba 1
Niger 1
Paraguay 1
Sudan 1
Venezuela 1
Table G5. Ranking of all countries for marine propulsion profile markets.
Nation Marine Propulsion Profile Market Score
India 10
China 10
Poland 10
South Africa 10
United States 10
Philippines 10
Czech Republic 10
Kenya 9
Mexico 9
Indonesia 9
Bangladesh 9
Romania 9
Thailand 9
Canada 8

125
France 8
Japan 8
United Kingdom 8
Chile 8
Yemen, Republic of 8
Azerbaijan 7
Croatia 7
Korea, Republic of 7
Sweden 7
Uganda 7
Namibia 7
Morocco 6
Mongolia 6
Slovakia (Slovak Republic) 6
Sri Lanka 6
Slovenia 6
Iran, Islamic Republic of 6
Bolivia 5
Egypt (Egypt, Arab Rep.) 5
Netherlands 5
Russia (Russian Federation) 5
Uzbekistan 5
Turkey 5
Argentina 5
Spain 4
Finland 4
Bulgaria 4
Tajikistan 4
United Arab Emirates 4
Armenia 4
Ecuador 3
Pakistan 3
Cuba 3
Hungary 3
Tunisia 3
Jordan 2
Laos (Lao, PDR) 2
Ukraine 2
Ghana 2
Algeria 2
Brazil 2

126
Saudi Arabia 2
Niger 1
Nigeria 1
Belgium 1
Sudan 1
Belarus 1
Paraguay 1
Venezuela 1