global health 2015 proceedings - thinkmind
TRANSCRIPT
GLOBAL HEALTH 2015
The Fourth International Conference on Global Health Challenges
ISBN: 978-1-61208-424-4
July 19 - 24, 2015
Nice, France
GLOBAL HEALTH 2015 Editors
Hassan Khachfe, Lebanese International University, Lebanon
Matthieu-P. Schapranow, Hasso Plattner Institute, Germany
1 / 101

GLOBAL HEALTH 2015
Forward
The Fourth International Conference on Global Health Challenges (GLOBAL HEALTH 2015),held between July 19-24, 2015 in Nice, France, continued a series of events taking a globalperspective on population health, from national to cross-country approaches, multiplatformtechnologies, from drug design to medicine accessibility, everything under mobile, ubiquitous,and personalized characteristics of new age population.
Recent advances in technology and computational science influenced a large spectrum ofbranches in approaching population health. Despite significant progresses, many challengesexist, including health informatics, cross-country platforms interoperability, system and lawsharmonization, protection of health data, practical solutions, accessibility to health services,and many others. Along with technological progress, personalized medicine, ambient assistanceand pervasive health complement patient needs. A combination of classical and information-driven approach is developing now, where diagnosis systems, data protection mechanisms,remote assistance and hospital-processes are converging.
The conference had the following tracks:
Trends and Practice
Challenges
Fundamentals
Technology
Medical Systems and Technologies
Similar to previous editions, this event attracted excellent contributions and activeparticipation from all over the world. We were very pleased to receive top qualitycontributions.
We take here the opportunity to warmly thank all the members of the GLOBAL HEALTH2015 technical program committee, as well as the numerous reviewers. The creation of such ahigh quality conference program would not have been possible without their involvement. Wealso kindly thank all the authors that dedicated much of their time and effort to contribute toGLOBAL HEALTH 2015. We truly believe that, thanks to all these efforts, the final conferenceprogram consisted of top quality contributions.
Also, this event could not have been a reality without the support of many individuals,organizations and sponsors. We also gratefully thank the members of the GLOBAL HEALTH 2015organizing committee for their help in handling the logistics and for their work that made thisprofessional meeting a success.
We hope that GLOBAL HEALTH 2015 was a successful international forum for the exchangeof ideas and results between academia and industry and to promote further progress in thearea of global health challenges. We also hope that Nice, France, provided a pleasant
2 / 101

environment during the conference and everyone saved some time to enjoy the charm of thecity.
GLOBAL HEALTH 2015 Chairs
GLOBAL HEALTH Steering Committee
Hassan Khachfe, Lebanese International University, LebanonShunji Shimizu, Tokyo University of Science, Suwa, JapanSten Hanke, IPN Instituto Pedro Nunes, Portugal | AIT Austrian Institute of Technology GmbH,AustriaMichael Bremseth, Winthrop University, USAJean-Pierre Cordeau, McGill University Health Centre, CanadaIvan Evgeniev, TU Sofia, BulgariaMatthieu-P. Schapranow, Hasso Plattner Institute, Germany
GLOBAL HEALTH Technology Advisory Committee
Marike Hettinga, Windesheim University of Applied Sciences, NetherlandsShirley Coyle, Centre for Sensor Web Technologies / Dublin City University, IrelandVasa Curcin, Imperial College London, UKAnna Cysewska-Sobusiak, Poznan University of Technology, PolandKevin Daimi, University of Detroit Mercy, USARavi Janardan, University of Minnesota-Twin Cities, USAJose M. Juarez, University of Murcia, SpainJochen Meyer, OFFIS Institute for Computer Science, GermanyVesselin Gueorguiev, TU Sofia, BulgariaMiki Sirola, Aalto University, FinlandDaniel Steffen, German Research Center for Artificial Intelligence (DFKI) GmbH - Kaiserslautern,GermanyMaria Taboada Iglesias, University of Santiago de Compostela, SpainJari Veijalainen, University of Jyvaskyla, FinlandPierangelo Veltri, University Magna Graecia of Catanzaro, ItalyBrijesh Verma, Central Queensland University, AustraliaLiangjiang Wang, Clemson University - Greenwood, USAHans C. Ossebaard, National Institute for Public Health and the Environment - Bilthoven, TheNetherlands
GLOBAL HEALTH Public/Government/Research Advisory Committee
Christopher Mayer, AIT Austrian Institute of Technology GmbH, AustriaJoão Quintas, Instituto Pedro Nunes, PortugalYoshikazu Seki, National Institute of Advanced Industrial Science and Technology (AIST) -Ibaraki, Japan
3 / 101

Hrvoje Belani, Croatian Health Insurance Fund - Zagreb, CroatiaStefan J. Darmoni, Rouen University Hospital, FranceChih-Lin Chi, University of Minnesota-Twin Cities, USASiddhartha Jonnalagadda, Northwestern University, USABin Song, Oracle, Inc., USAEgon L. van den Broek, TNO Technical Sciences - Delft | University of Twente - Enschede |Radboud University Medical Center Nijmegen - Nijmegen, The NetherlandsZhongming Zhao, Vanderbilt University / Medical Center, USAHua Xu, Vanderbilt University/School of Medicine, The Netherlands
4 / 101

GLOBAL HEALTH 2015
Committee
GLOBAL HEALTH Steering Committee
Hassan Khachfe, Lebanese International University, LebanonShunji Shimizu, Tokyo University of Science, Suwa, JapanSten Hanke, IPN Instituto Pedro Nunes, Portugal | AIT Austrian Institute of Technology GmbH,AustriaMichael Bremseth, Winthrop University, USAJean-Pierre Cordeau, McGill University Health Centre, CanadaIvan Evgeniev, TU Sofia, BulgariaMatthieu-P. Schapranow, Hasso Plattner Institute, Germany
GLOBAL HEALTH Technology Advisory Committee
Marike Hettinga, Windesheim University of Applied Sciences, NetherlandsShirley Coyle, Centre for Sensor Web Technologies / Dublin City University, IrelandVasa Curcin, Imperial College London, UKAnna Cysewska-Sobusiak, Poznan University of Technology, PolandKevin Daimi, University of Detroit Mercy, USARavi Janardan, University of Minnesota-Twin Cities, USAJose M. Juarez, University of Murcia, SpainJochen Meyer, OFFIS Institute for Computer Science, GermanyVesselin Gueorguiev, TU Sofia, BulgariaMiki Sirola, Aalto University, FinlandDaniel Steffen, German Research Center for Artificial Intelligence (DFKI) GmbH - Kaiserslautern,GermanyMaria Taboada Iglesias, University of Santiago de Compostela, SpainJari Veijalainen, University of Jyvaskyla, FinlandPierangelo Veltri, University Magna Graecia of Catanzaro, ItalyBrijesh Verma, Central Queensland University, AustraliaLiangjiang Wang, Clemson University - Greenwood, USAHans C. Ossebaard, National Institute for Public Health and the Environment - Bilthoven, TheNetherlands
GLOBAL HEALTH Public/Government/Research Advisory Committee
Christopher Mayer, AIT Austrian Institute of Technology GmbH, AustriaJoão Quintas, Instituto Pedro Nunes, Portugal
5 / 101

Yoshikazu Seki, National Institute of Advanced Industrial Science and Technology (AIST) -Ibaraki, JapanHrvoje Belani, Croatian Health Insurance Fund - Zagreb, CroatiaStefan J. Darmoni, Rouen University Hospital, FranceChih-Lin Chi, University of Minnesota-Twin Cities, USASiddhartha Jonnalagadda, Northwestern University, USABin Song, Oracle, Inc., USAEgon L. van den Broek, TNO Technical Sciences - Delft | University of Twente - Enschede |Radboud University Medical Center Nijmegen - Nijmegen, The NetherlandsZhongming Zhao, Vanderbilt University / Medical Center, USAHua Xu, Vanderbilt University/School of Medicine, The Netherlands
GLOBAL HEALTH 2015 Technical Program Committee
Charlie Abela, University of Malta - Msida, MaltaSachiyo Aburatani, Computational Biology Research Center - National Institute of AdvancedIndustrial Science and Technology, JapanEsko Alasaarela, University of Oulu, FinlandGiner Alor Hernández, Instituto Tecnológico de Orizaba - Veracruz, MéxicoThierry Badard, Centre for Research in Geomatics - Laval University, CanadaHrvoje Belani, Croatian Health Insurance Fund - Zagreb, CroatiaVeselka Boeva, Technical University of Sofia, BulgariaMounir Bousbia-Salah, Badji Mokhtar University - Annaba, AlgeriaPamela Briggs, School of Life Sciences / Northumbria University, UKSabin-Corneliu Buraga, "A. I. Cuza" University, RomaniaRita Casadio, Biocomputing Group - University of Bologna, ItalyBolin Chen, University of Saskatchewan, CanadaDechang Chen, Uniformed Services University of the Health Sciences - Bethesda, USAPo-Hsun Cheng, National Kaohsiung Normal University, TaiwanChih-Lin Chi, University of Minnesota-Twin Cities, USAJim Cimino, University of Alabama at Birmingham, USAMeyrick Chow, Tung Wah College, Hong KongDiane Cook, Washington State University, USAMichel Cotsaftis, LACSC/ECE - Paris, FranceShirley Coyle, Centre for Sensor Web Technologies / Dublin City University, IrelandVasa Curcin, Imperial College London, UKAnna Cysewska-Sobusiak, Poznan University of Technology, PolandKevin Daimi, University of Detroit Mercy, USAStefan J. Darmoni, Rouen University Hospital, FranceLucio Tommaso De Paolis, University of Salento, ItalyM. Jamal Deen, McMaster University - Hamilton, CanadaWolfgang Deiters, Fraunhofer Institute for Software and Systems Engineering ISST, GermanySteven A. Demurjian, University of Connecticut, USAGayo Diallo, University of Bordeaux, France
6 / 101

Elton Domnori, Epoka University - Tirana, AlbaniaJulie Doyle, Dundalk Institute of Technology - Dundalk, IrelandYe Duan, University of Missouri - Columbia, USAMarwan Dwairy, Cross-Cultural Researcher - Nazerat Ellit, IsraelHans-Dieter Ehrich, Technische Universität Braunschweig, GermanyZakaria Elberrichi, Djillali Liabes University, AlgeriaFrank Emmert-Streib, Tampere University of Technology, FinlandPaul Fergus, Liverpool John Moores University, UKAleksandra Fucic, Institute for Medical Research and Occupational Health - Zagreb, CroatiaXiaohing Gao, Middlesex University, UKNuno M. Garcia, Lusophone University of Humanities and Technologies - Lisbon, PortugalBela Genge, Petru Maior University of Tg. Mures, RomaniaHassan Ghasemzadeh, Washington State University, USASylvain Giroux, Université de Sherbrooke, CanadaDavid Greenhalgh, University of Strathclyde, ScotlandYi-Ke Guo, Imperial College London, UKKasper Hallenborg, The Maersk Mc-Kinney Moller Institute, DenmarkMartha Harrell, Institute of Mathematical Physics (IMP) - Williamsburg, USAHarry Stewart Hochheiser, University of Pittsburgh, USAVasant Honavar, Iowa State University - Ames, USAJun (Luke) Huan, The university of Kansas, USAChun-Hsi Huang, University of Connecticut, USAKun Huang, Ohio State University, USAHamidah Ibrahim, Universiti Putra, MalaysiaYoshiro Imai, Kagawa University, JapanIvan Evgeniev Ivanov, Technical University of Sofia, BulgariaRavi Janardan, University of Minnesota-Twin Cities, USASiddhartha Jonnalagadda, Northwestern University, USAJose M. Juarez, University of Murcia, SpainMehmed Kantardzic, University of Louisville, USAAyten Karataş, Istanbul Technical University, TurkeyAnastasia N. Kastania, Athens University of Economics and Business, GreeceOkba Kazar, Biskra University, AlgeriaHassan M. Khachfe, Lebanese International University, LebanonFrank Klawonn, Helmholtz Centre for Infection Research - Braunschweig, GermanyPeter Kokol, University of Maribor, SloveniaAntonio Lanatà, University of Pisa, ItalyLenka Lhotska, Czech Technical University in Prague, Czech RepublicTao Li, Florida International University, USAYaohang Li, Old Dominion University, USAMarius George Linguraru, Sheikh Zayed Institute for Pediatric Surgical Innovation, USAIgor Ljubi, University College for Applied Computer Engineering - Zagreb, CroatiaSamia Loucif, ALHOSN University, UAEEmilio Luque, University Autonoma of Barcelona (UAB), Spain
7 / 101

Zhiyuan Luo, Royal, Royal Holloway University of London, UKMalika Mahoui, IUPUI - Indianapolis, USAStefano Mariani, Politecnico di Milano, ItalyElio Masciari, ICAR-CNR, ItalyMassimiliano Masi, Tiani “Spirit” GmbH, AustriaChristopher Mayer, AIT Austrian Institute of Technology GmbH, AustriaJochen Meyer, OFFIS Institute for Computer Science, GermanyChristo El Morr, York University, CanadaRadha Nagarajan, University of Arkansas for Medical Sciences, USAKazumi Nakamatsu, University of Hyogo, JapanHongbo Ni, Northwestern Polytechnical University, ChinaBrendan O’Flynn, Tyndall National Institute, IrelandMichael Ochs, The College of New Jersey, USACarlos Oberdan Rolim, Federal University of Rio Grande do Sul (UFRGS), BrazilChika Oshima, Japan Society for the Promotion of Science / Faculty of Medicine - SagaUniversity, JapanJulien Penders, imec / Holst Centre, The NetherlandsGeorge Perry, The University of Texas at San Antonio, USACinzia Pizzi, University of Padova, ItalyMiodrag Potkonjak, University of California - Los Angeles, USADavid Riaño, Universitat Rovira i Virgili, SpainCarsten Röcker, RWTH Aachen University, GermanyAlejandro Rodríguez González, Centre for Biotechnology and Plant Genomics - UPM-INIA, SpainMarcos A. Rodrigues, Sheffield Hallam University, UKSeyed Ali Rokni, Washington State University, USAAlan Ruttenberg, School of Dental Medicine - University at Buffalo, USASaqib Saeed, Bahria University Islamabad, PakistanMaytham Safar, Focus Consultancy, KuwaitAntonio J. Salazar E., Institute for Systems and Computer Engineering - Biomedical ResearchCenter, PortugalAbdel-Badeeh M. Salem, Ain Shams University - Cairo, EgyptNickolas S. Sapidis, University of Western Macedonia, GreeceMajid Sarrafzadeh, UCLA, USAMatthieu-P. Schapranow, Hasso Plattner Institute, GermanyBettina Schnor, Potsdam University, GermanyShunji Shimizu, Tokyo University of Science - Suwa, JapanJatinder Singh, University of Cambridge, UKMiki Sirola, Aalto University, FinlandBin Song, Oracle, Inc., USANathalie Souf, Institut de Recherche en Informatique de Toulouse (IRIT), FranceDaniel Steffen, German Research Center for Artificial Intelligence (DFKI) GmbH - Kaiserslautern,GermanyMaria Taboada, University of Santiago de Compostela, SpainAdel Taweel, King's College London, UK
8 / 101

Dimitar Tcharaktchiev, Medical University - Sofia, BulgariaChrisa Tsinaraki, European Union - Joint Research Center (JRC), ItalyAlexey Tsymbal, Siemens AG, GermanyHayato Uchida, University of Hyogo, JapanLorna Uden, Staffordshire University, UKUgo Vaccaro, University of Salerno, ItalyAristides Vagelatos, Computer Technology Institute and Press "Diophantus", GreeceEgon L. van den Broek, TNO Technical Sciences - Delft | University of Twente - Enschede |Radboud University Medical Center Nijmegen - Nijmegen, The NetherlandsJari Veijalainen, University of Jyvaskyla, FinlandPierangelo Veltri, University Magna Graecia of Catanzaro, ItalyBrijesh Verma, Central Queensland University, AustraliaLiangjiang Wang, Clemson University - Greenwood, USAChunhua Weng, Columbia University, USAHua Xu, Vanderbilt University/School of Medicine, The NetherlandsMingjing Yang, University of Ulster, UKJuan Ye, University of St Andrews, UKYanbin Yin, University of Georgia, USAWang Yu-Ping, Tulane University - New Orleans, USAConstantin-Bala Zamfirescu, "Lucian Blaga" Univ. of Sibiu, RomaniaErliang Zeng, University of South Dakota, USAZhongming Zhao, Vanderbilt University / Medical Center, USAJie Zheng, Perelman School of Medicine - University of Pennsylvania, USAWei Zhong, University of South Carolina Upstate - Spartanburg, USAQiang Zhu, University of Michigan, USABin Zhou, University of Maryland, Baltimore County, USA
9 / 101

Copyright Information
For your reference, this is the text governing the copyright release for material published by IARIA.
The copyright release is a transfer of publication rights, which allows IARIA and its partners to drive the
dissemination of the published material. This allows IARIA to give articles increased visibility via
distribution, inclusion in libraries, and arrangements for submission to indexes.
I, the undersigned, declare that the article is original, and that I represent the authors of this article in
the copyright release matters. If this work has been done as work-for-hire, I have obtained all necessary
clearances to execute a copyright release. I hereby irrevocably transfer exclusive copyright for this
material to IARIA. I give IARIA permission or reproduce the work in any media format such as, but not
limited to, print, digital, or electronic. I give IARIA permission to distribute the materials without
restriction to any institutions or individuals. I give IARIA permission to submit the work for inclusion in
article repositories as IARIA sees fit.
I, the undersigned, declare that to the best of my knowledge, the article is does not contain libelous or
otherwise unlawful contents or invading the right of privacy or infringing on a proprietary right.
Following the copyright release, any circulated version of the article must bear the copyright notice and
any header and footer information that IARIA applies to the published article.
IARIA grants royalty-free permission to the authors to disseminate the work, under the above
provisions, for any academic, commercial, or industrial use. IARIA grants royalty-free permission to any
individuals or institutions to make the article available electronically, online, or in print.
IARIA acknowledges that rights to any algorithm, process, procedure, apparatus, or articles of
manufacture remain with the authors and their employers.
I, the undersigned, understand that IARIA will not be liable, in contract, tort (including, without
limitation, negligence), pre-contract or other representations (other than fraudulent
misrepresentations) or otherwise in connection with the publication of my work.
Exception to the above is made for work-for-hire performed while employed by the government. In that
case, copyright to the material remains with the said government. The rightful owners (authors and
government entity) grant unlimited and unrestricted permission to IARIA, IARIA's contractors, and
IARIA's partners to further distribute the work.
10 / 101

Table of Contents
Health Communication and Information Exchange in a Vascular Surgery Patient TrajectoryHeidi Gilstad
1
Emerging Issues in Medical and Engineering Ethics: The Case of Reverse Paternalism in LebanonSarah Hammoud, Zahraa Shahrour, Ali Hage-Diab, Hassan Khachfe, and Bassam Hussein
7
Privacy-Preserving Online Monitoring Framework for e-Health ApplicationsYouna Jung
18
Systematic Review of Obesogenic Environmental Determinants of Diet and the Implications of ObesityPrevention and Intervention EffortsAngela Chang, Matthew T. Liu, and Peter J. Schulz
25
Challenges of Comparing Medication eHealth Services in the Nordic CountriesHeidi Gilstad, Arild Faxvaag, Christian Nohr, Sidsel Villumsen, Jarmo Reponen, Hege Andreassen, Lars Jervall,Thomas Pehrsson, Maarit Kangas, Gudrun Audur Hardardottir, Sabine Koch, and Hannele Hypponen
33
Brain Activity Estimation with Precise Motor Measurements of Visual Synchronization Task of HandsKyota Aoki and Hisanori Hotta
39
A Finger Movement Evaluation Device to Monitor the Use of Paretic Hand During Daily Life ActivitiesBilal Debs, Eliane Mousallem, Ali Hage-Diab, Mohamad Hajj-Hassan, Hassan Khachfe, Soha Saleh, Nour El-Hoda Saleh, Ahmad Rifaii Sarraj, and Houssam Yassine
45
Management System of Medical Equipment in HospitalsMohammad Rammal, Ahmad Jaffal, Hassan Khachfe, and Mohamad Hajj-Hassan
50
Automatic Measurement of Pronation/Supination, Flexion/Extension and Abduction/Adduction Motion of HumanLimbs using Wearable Inertial and Magnetic SensorsIrvin Hussein Lopez-Nava, Francisco Marquez-Aquino, Angelica Munoz-Melendez, David Carrillo-Lopez, andHector Simon Vargas-Martinez
55
Personalize Systems for Psychological Evaluation Performance and Vigilance MonitoringRadka Jeziorska, Vilem Novak, Katerina Panackova, and Marek Penhaker
61
IT-Aided Business Process Enabling Real-time Analysis of Candidates for Clinical TrialsMatthieu-P. Schapranow, Cindy Perscheid, and Hasso Plattner
67
Understanding the Social Dynamics of Twitter, Facebook and Diabetes.co.uk and Their Value Implications forPatients and Health ResearchersJoanna Taylor, Claudia Pagliari, and Miles Osborne
74
1 / 2 11 / 101

A Semantic Reasoning Engine for Lifestyle Profiling in Support of Personalised CoachingSara Mikolajczak, Tom Ruette, Elena Tsiporkova, Milena Angelova, and Veselka Boeva
79
Detection and Classification of the Basic Emotions Using a Multimodal Approach for Emotions DetectionChaka Kone, Cecile Belleudy, Imen Tayari Meftah, and Nhan Le-Thanh
84
Powered by TCPDF (www.tcpdf.org)
2 / 2 12 / 101
Health Communication and Information Exchange in a Vascular Surgery Patient Trajectory
Heidi Gilstad Department of Neuroscience
Norwegian University of Science and Technology, NTNU Trondheim, Norway
[email protected] Abstract. Health communication and information exchange is important in public health. Despite the fact that adequate health information is a patient right according to Norwegian law, complaints from patients to the authorities on lack of information and communication are frequent. The purpose of the paper is to discuss health communication and health information exchange for patients undergoing vascular surgery for abdominal aorta aneurism (AAA), with particular focus on the communicative practices in a typical patient trajectory for this cohort. Both verbal communication and written information exchanged through health information systems during the patient trajectory are included in the data. The project is theoretically and analytically inspired by linguistic and discourse analytical perspectives on information and communication about health.
Keywords- Health information exchange; health communication; digital health; patient trajectory; aorta aneurism.
I. INTRODUCTION Health communication is important in public health [1].
Information exchange and health communication is essential for patients’ confidence in the healthcare services. Trust is a basic premise for good patient care, and is an important patient right in Norway. The Patient Rights Act [2] is specifically designed to "promote trust between the patient and healthcare services, to promote social security and respect for the individual patient and the user's life, integrity and human dignity". However, the feedback from patients and clients demonstrates that information exchange and health communication are areas for improvement. Also the Ombudsman and the authorities emphasize that communication needs to be improved [3].
Structuring patient care in patient trajectories is a strategic move to make patient care predictable for patients. A patient trajectory is “the chronological chain of events that concerns the individual patients with different healthcare systems”[4]. Good patient trajectories are characterized by the fact that these events are put together in a rational and coordinated way to meet different patient needs. Central Norway Regional Health emphasizes in its strategy that: “the treatment course should be predictable, coherent and
effective for patients and their families" [5]. The glue in the patient trajectory is the health communication and information exchange between health professionals and patients. A predictable patient trajectory for patients requires that information exchange and health communication between healthcare providers and the patient is adequate at all levels, both in primary and specialist health services.
Health communication and information exchange is complex in modern healthcare organizations that are technology-intensive and consists of professionals with different roles and tasks. The healthcare sector is an arena that is constituted by different communication practices, such as oral conversations (doctor-patient conversations, expert talks, the head-staff conversations), written texts (invitation letters, information letters, discharge summaries, procedures). The use of medical technologies and information and communication technology tools with different purposes (X-rays, ultrasound, imaging systems, patient administrative systems, ePrescription, curve solutions, welfare technologies) is extensive.
Good communication between individuals and among participants in multidisciplinary medical teams is essential for the diagnosis to be correct, for the treatment to be relevant and for the information to be maintained. The introduction of ICT systems, medical technologies and welfare technologies lead to organizational and practical work changes. These changes challenge established communicative practices. Preferably, changes in communicative practices should result in improvements in information processing and dissemination, precision in diagnosis and effectiveness of treatment. Unfortunately, we have seen examples that it rather can result in ambiguity, confusion and resistance in terms of application and dissemination.
A successful introduction of new technologies such as ICT, medical technologies and welfare technologies requires knowledge of the communicative practices that technologies will help to address. Therefore, mapping studies of communicative practices through a patient trajectory are required. Examining the single-case studies may enable us to
1Copyright (c) IARIA, 2015. ISBN: 978-1-61208-424-4
GLOBAL HEALTH 2015 : The Fourth International Conference on Global Health Challenges
13 / 101

understand what improves or degrades the established practices.
The objective of this paper is to discuss health communication and information exchange in the chain of activity types in patient trajectories for patients undergoing surgery for AAA. The goal is to map and describe the activity types during a patient trajectory, from hospitalization and surgery to discharge. The research questions are:
1) What characterizes the chain of activity types in a typical patient trajectory? 2) Who are the participants in the activity types? 3) Which are the communicative practices in the activity types?
Section II offers a discussion about the theoretical perspectives of the study. Section III presents the methodological approach. The results are presented in Section IV, and discussed in Section V.
II. THEORETICAL PERSPECTIVES The theoretical and analytical approach in this project is
discourse analysis, which offers concepts and tools for describing communicative practices at different levels. Traditionally the concept of discourse is understood as language use in oral or written communication in a social context. Candlin [6] points out that oral and written language has a constructive and dynamic role when it comes to structuring knowledge, as well as for structuring social and institutional practices in which knowledge is created and used. Discourses influence, and are influenced by social practices, and are consequently constructing and reproducing the social interaction. Since discourse is part of the social interaction it is culturally dependent.
Healthcare consists of discourses in continuous development, and because of the many divergent discourses, conflicts and misunderstandings may occur. Discourse analysis can help to identify the mechanisms in the social practices, and to interpret discursive structures, social roles, social identities, social behaviour and social practices.There are different approaches to discourse analysis depending on what you want to study. Through activity analysis this project focuses on describing the activity type, and on structural, interactional and thematic mapping of the consultations [7] [8]. Activity types are examples of patterns of the communicative situation, and are referred to as a "script" or "form" of the type of activity [9]. An activity type is a description of a communication situation. An activity type can be described by focusing on the following issues: 1) the participants 2) the goals and tasks, 3) the phases, 4) the roles and responsibilities of the participants, and 5) the contextual framework (time, space and artefact) [10] [16]. A structural mapping of an activity type includes an identification of communicative markers for defining the focused incident phases. For example, Byrne and Long [11]
proposed the following phases in the doctor-patient conversation in primary care: 1) relate to the patient, 2) uncover the cause of the patient's attendance, 3) conduct verbal and / or physical examination of the patient's condition, 4) determine the treatment or more examinations and finally 5) the completion of the consultation. Each of these phases of the consultation can be subdivided into smaller communicative elements. An interactional mapping focuses on the communicative relations between the participants in the activity type. Through activity analysis we may reveal aspects of the interaction between the actors in the different phases. Moreover, the thematic mapping reveals what issues are at focus in the activity type. This type of analysis may provide both an overview, and the details of what characterizes the discourse and social practice. In this paper, when studying a chain of activity types in a patient trajectory, the focus is on identifying the types of communicative practices and the participants.
III. METHODOLOGY The discourse analytical approach in this project required
an ethnographic and problem-oriented approach. We studied communication in the context in which it normally occurs. To identify relevant empirical data, the researcher conducted a pilot project where she observed selected clinical departments at a hospital in Norway. The purpose of the pilot project was to get an impression of the institutional practices, and the communicative practices at the department. The researcher participated during surgery and clinical encounters, and made field notes. After an overall strategic, technical and practical assessment, the section for vascular surgery was selected as the primary empirical field for data collection of communicative practices in patient trajectories. The cohort consisted of patients with abdominal aorta aneurism (AAA) that would go through either Conventional open (OR) surgery, or an Endovascular Aneurysm Repair (EVAR) surgery [12].
The study is based on participant observation in the empirical field. The researcher followed 10 patients from admission to the hospital, through all the communicative practices that they attended, until they were discharged from the hospital. Exploratory and interpretive methods are useful to promote knowledge of predefined or open research questions [13]. The purpose of this approach is to gain detailed knowledge about what actually happens during health consultations. The researcher has experience with field analysis in general and activity analysis in particular [14]. During the fieldwork and the participatory observation at a large hospital in Norway, the researcher made detailed observation notes and transcripts of the talk of the patients and the healthcare professionals. Additional data was electronic patient records notes and other written material. The purpose of this broad data collection was to gain insights about the whole chain of verbal and written communicative practices between health professionals involved in the treatment of the individual patients.
2Copyright (c) IARIA, 2015. ISBN: 978-1-61208-424-4
GLOBAL HEALTH 2015 : The Fourth International Conference on Global Health Challenges
14 / 101

IV. RESULTS This section offers a presentation of the results from the
study, focusing on 1) the chain of activity types in a typical patient trajectory for AAA, 2) the participants involved in the different activity types and 3) the communicative practices.
A. The chain of activity types in a typical patient trajectory During the pilot project, and in discussions with the head
of the department, the researcher identified the following chain of activity types in a typical patient trajectory for patients that are going through AAA surgery:
Figure 1. Example of the chain of activity types in a typical patient trajectory for AAA surgery
The patient experiences symptoms, and consults the general practitioner (GP). AAA is a condition occasionally without symptoms, and is often identified by chance in other consultations. The GP consults the patient locally, and subsequently refers to a polyclinic consultation at the hospital. A consultation with a specialist reveals whether it should be further investigated for possible surgery, or if the patient can be followed up by the GP. The specialist also decides if the patients should be admitted and prepared for Conventional open (OR) surgery, or an Endovascular Aneurysm Repair (EVAR) surgery. The surgical assessment is done at the pre-surgical polyclinic, where a nurse, a surgeon, an anaesthesiologist, consults the patient. The surgeon present in the pre-surgical polyclinic ideally also performs the surgery. After the surgery is performed, the patient is transferred to the recovery unit for observation, and subsequently moved to the ward for care. The patients often go through several days of convalescence before going home. Throughout the course of the patient trajectory, several communicative practices occur both orally and written, such as the doctor-patient conversations, the professional conversations in one-to-one relationship or team, as well as written referrals, information circulars, notes, patient orientation, discharge summaries, and electronic patient records and health information systems. This identification of the activity types in the ideal patient trajectory was useful in order to understand the complexity of when health communication and information exchange occurs during the patient trajectory. However, as we shall
see in the subsequent section, the chain of activity types is even more complex.
The fieldwork of this study starts when the patient presents at the hospital for a pre-surgical polyclinic consultation. The patient trajectories of OR surgery differ from those during an EVAR surgery, due to differences in participant structure and types of communicative practices.
a) Participants in the different activity types The participant structure [15] refers to how the
organization of interaction in large group work, small group work, pair work or individual work. The distinction is relevant for how we evaluate the social interaction and the distribution of verbal contributions during the activity. One activity type, for example the surgical intervention, would have different participants and thus another participant structure than other activity types, for example the consultation between the doctor and the patient. The accepted norms, roles and verbal contributions are related to the participant structure. An identification of the participant structure in the respective activity types requires an identification of the participants in the activity types.
The observation of the OR versus EVAR-patients showed several participants in each of the phases of the patient trajectory respectively pre-surgery, surgery and post-surgery.
Pre-surgery TABLE I PARTICIPANTS IN THE PRE-SURGERY PHASE
Basic activity types and participants
Participants basic activity types
Additional crew for OR
Additional crew for EVAR
Additional partici-pants
Admission meeting and instructions
Patient and Nurse 1
Physio-therapist
Radiological pre-procedure planning team
Nursing student Doctor student Bloodtest
Patient and Nurse 2
Information meeting about surgical procedure
Patient and Surgeon
Information and examination about medication
Patient and Anesthesiologist
The basic crew in the pre-surgical activity types for
both types of surgery includes: a coordinating nurse who receives the patient in the vascular surgery ward, and who forwards him to the blood test department, where he communicates with the blood test nurse. When the patient returns to the ward, he is called in for consultations with respectively a nurse (who takes personal information notes for the record), a surgeon who explains briefly what will happen during surgery and an anaesthesiologist (who considers allergies, medicines and explains about the aesthetic procedure.) The pre-surgery activity types for the
3Copyright (c) IARIA, 2015. ISBN: 978-1-61208-424-4
GLOBAL HEALTH 2015 : The Fourth International Conference on Global Health Challenges
15 / 101

OR surgery include the physiotherapist, while the pre-surgery activity types specific for the EVAR surgery may include a consultation with the radiologist.
Additional professionals in the pre-surgery activity types are the students training to be doctors or nurses. All these activity types include different kinds of communicative practices, such as talk, reading electronic patient record, writing in electronic patient record and occasionally also referring to medical imaging or simple drawings to illustrate the medical condition.
Surgery
The participants present during surgery differ between the OR and the EVAR.
TABLE II PARTICIPANTS DURING SURGERY
Basic activity types and participants
Participants basic activity types
Additional crew for OR
Additional crew for EVAR
Additional partici-pants
Surgical activity
Patient Anesthesiologist Anesthesiology nurse 2 Vascular surgeons 4 Operation nurses
Inter-ventional radiologist Radiology nurses (two)
Doctor student 1 Doctor student 2
In addition to the basic crew, the EVAR surgery involves a radiologist and two radiologist nurses. The surgery activity type is a complex interdisciplinary team communication, and a large number of communicative practices are involved, such as talk across professional boundaries, reading and writing diagnostic information and observations in different databases (according to the professional task, for example the anaesthesiologist registers in one database, whereas the surgeon registers in another and the nurses in the third database).
Post-surgery
TABLE III PARTICIPANTS IN THE POST-SURGERY PHASE. Basic activity types and participants
Participants basic activity types
Additional crew for OR
Addi-tional crew for EVAR
Addi-tional partici-pants
Transfer of patient from operation room to intensive care
Operation nurses (same as during surgery)
Physio-therapist
Nurse student
Intensive care patient and nurses Intensive care patient and doctor Recovery
patient and nurses
Recovery
patient and doctor
Surveillance
patient and nurse 1
Surveillance
Patient and nurse 2
Ward patient and nurses Ward
patient and doctors
The post-surgery crew concerned with the patient after the OR consist of several health care professionals, both in the intensive care unit, the recovery unit and in the ward. Since the patient usually is in the ward for several days post-surgery, he experiences the change of guards as the surveillance crew and the ward crew change 3 times in 24 hours.
Table 2, 3 and 4 illustrate that the chain of activity types is actually more complex than identified in the pilot project (see section A), and that a large number of healthcare professionals are involved during both the OR and the EVAR patient trajectories.
b) Identifying communicative practices
The communicative practices referred to here are the different types of interactional activities, be they verbal or written that concern the patients.
The communicative practices have different characteristics: 1) where the patient is explicitly involved, 2) between healthcare professionals within the department 3) healthcare professionals within the department and “satellite professionals”, such as the anaesthesiologist, the physiotherapist, etc., and 4) healthcare professionals across departments (surgery, recovery, and ward).
Pre-surgery
Based on our observations, we have identified numerous communicative practices in pre surgery.
TABLE IV COMMUNICATIVE PRACTICES PRE-SURGERY
Communicative practice including patient
Communicative practice between professionals in the same department
Communicative practices with “satellite professionals”
Communicative practices with other departments or organizations
Admission meeting and instructions, Patient and Nurse 1, talk and writing nursing summary
ICT-based written information exchange through different systems and written paper record Inter-professional meetings
Nurse-physiotherapist talk Surgeon-anesthesiologist talk Surgeon-radiologist talk
ICT-based written information exchange through different systems (Doculive, Picis, operation planner)
Blood test, Patient and Nurse 2, talk Information meeting about surgical procedure, Patient and Surgeon, talk and drawing Information and examination about medication, Patient and Anesthesiologist, talk and medication list
4Copyright (c) IARIA, 2015. ISBN: 978-1-61208-424-4
GLOBAL HEALTH 2015 : The Fourth International Conference on Global Health Challenges
16 / 101

In the pre surgery phase, numerous communicative practices take place concerning the patient. The patient is involved in consultations, and will be able to influence the communication, through questions and information. Moreover, there are communicative practices where the patient is not involved, and where information is exchanged, discussed and decisions are being made about the patient. TABLE V COMMUNICATIVE PRACTICES DURING SURGERY
Communicative practice including patient
Communicative practice between professionals in the same department
Communicative practices with “satellite professionals”
Communicative practices with other departments or organizations
Patient -nurse 1,2,3 talk Patient - surgeon 1 and 2 talk Patient- anesthesiologist talk etc.
Surgical checklist, interprofessional team-communication during surgery, use of visualization technologies,
Surgeon-surgeon 2 talk Surgeon- nurse 1,2,3 talk Surgeon- radiologist Surgeon-anesthesiologist talk etc.
ICT-based written information exchange through different systems (Doculive, Picis, operation planner)
During surgery of OR, the patient receives full anesthesia. He is unconscious, and is only involved in talk before going into anesthesia and after wakening post-surgery. Contrarily, during EVAR, the anesthetic is local, and the patient is involved in talk. The nurses, surgeons and radiologists can communicate with the patient, and the patient is an eavesdropper to the professional talk. TABLE VI COMMUNICATIVE PRACTICES POST-SURGERY
Communicative practice including patient
Communicative practice between professionals in the same department
Communicative practices with “satellite professionals”
Communicative practices with other departments or organizations
Patient-intensive care nurses talk Patient-intensive care doctors talk Patient- recovery nurses talk Patient- ward nurses talk Patient-physiotherapist talk
ICT-based written information exchange through different systems (Doculive, Picis), team discussions
ICT-based information exchange through different systems (Doculive, Picis), nurse summary, clinical notes/patient summary, discharge letter, medication list etc
In the post-surgery phase, the patients that have undergone OR wake up, and are immediately drawn into communication with the anesthetics doctors and nurses for them to check his state of consciousness. In the intensive care, the patients are tired, but are still approached communicatively by the nurses, the surgeon and the intensive care doctor with information about the operation. Reports where given from patients that did not understand any of the communication in the intensive care due to drowsiness.
Table 5, 6 and 7 give an indication of the communicative practices in the respective patient trajectories. There is a large number of communicative practices during the
trajectory, be they verbal practices (talk) of written practices (ICT or paper based), each with different characteristics.
V. DISCUSSION The identification of the chain of activity types in a
typical patient trajectory enables us to get an overview of all the activities that concern the patient during his stay at the hospital. In this paper we saw that a patient trajectory in AAA from identification of symptoms (Figure 1) only gives a very general overview of the activities that will concern the patient that has to go through the surgery. A narrow look at the activity types taking place at the hospital between admission and discharge from the hospital, illustrates that the patient takes part in many activities, with a lot of participants with different tasks who are communicating in different ways and with the use of different tools.
The identification of the participants in the different activity types gives an idea of the social organisation, work tasks, norms and roles in the activity types while the identification of the communicative practices in the activity types helps us to pinpoint how information is transferred from one participant to the next in the trajectory. Information is likely to be missed and misunderstood during such a chain of complex communicative practices. In addition, the complexity of participants and communicative practises is likely to influence the patient’s possibility for informed decision making, as she has not access to all information. The mapping of the complexity of health communication and information exchange in the patient trajectory suggests that patient involvement and decision making, as emphasised in the user centred perspective, and manifested by the for example the slogan No decision about me, without me!, may be difficult to obtain.
Identifying these three structural elements (activity type, participants and communicative practices) in actual patient trajectories can be useful both from a patient centred-, a clinical- and an administrative perspective.
In general, the identification of these elements is useful for pinpointing where and when communicative challenges may and do occur between patients and healthcare professionals or between healthcare professionals of different disciplines. From an administrative level, an identification of activity types, participants and communicative practices are tools for making the trajectory more efficient.
Once the structural elements are identified, we can study the activity more closely, by analysing how and what the participants are communicating about. In the two following papers, the focus will be on respectively interactional mapping and thematic mapping of selected activity types in the AAA patient trajectory.
ACKNOWLEDGMENT Thanks to the Operation Room of the Future (FOR) at the St.Olavs Hospital, Norway for facilitating the study.
5Copyright (c) IARIA, 2015. ISBN: 978-1-61208-424-4
GLOBAL HEALTH 2015 : The Fourth International Conference on Global Health Challenges
17 / 101

REFERENCES [1] Rimal, Rajiv N & Lapinski, Maria K (2009) Bulletin of the World
Health Organization; 87:247-247. [2] The Patient Rights Act/ Pasient- og brukerrettighetsloven (1999):
http://lovdata.no/dokument/NL/lov/1999-07-02-63 [3] White paper no. 10, 2012-2013). St.meld. 10, (2012-2013):
http://www.regjeringen.no/nb/dep/hod/dok/regpubl/stmeld/2012-2013/meld-st-10-20122013.html?id=709025
[4] The Coordination Reform (2009) Samhandlingsreformen (2009): http://www.regjeringen.no/nb/dep/hod/dok/regpubl/stmeld/2008-2009/stmeld-nr-47-2008-2009-.html?id=567201
[5] Central Norway Regional Health (Strategy 2020), Strategi 2020 Helse Midt-Norge: http://www.helse-midt.no/no/Aktuelt/Strategi-2020/100385/
[6] Candlin, C. (1997): General Editors Preface in Gunnarsson, Linell and Nordberg (eds) The Construction of Professional Discourse, Pearson Education, Addison Wesley Longman Limited, New York.
[7] Sarangi, S. (2005) Activity analysis in professional discourse settings: the framing of risk and responsibility in genetic counselling. Hermès 41: 111-120.
[8] Sarangi, S. (2010) Practising discourse analysis in healthcare settings. In I. Bourgeault, R. DeVries & R. Dingwall (eds). Qualitative Methods in Health Research. London: Sage.
[9] Goffman, E. (1981) Forms of Talk. Philadelphia, USA: University of Pennsylvania Press
[10] Roberts, C. and Sarangi, S. (2005) Theme-Oriented Discourse Analysis of medical encounters. Medical Education 39, 632-640.
[11] Byrne, P. S. & Long, B. E. L. (1976) Doctors talking to patients: a study of the verbal behaviour of general practitioners consulting in their surgeries. London: The Royal College of General Practitioners.
[12] Brattheim, B.J. (2013) "The Trans-Hospital: Multidisciplinary Care to Patients with Abdominal Aortic Aneurysm. Evidence-based practice in collaborative teams" PhD at NTNU
[13] Patton, M. Q. (2002) Qualitative Research and Evaluation Methods 3 edition. London/New Dehli: Sage Publications, Inc.
[14] Gilstad, H (2012) Obstetric ultrasound expertise as manifest in encounters between midwives and pregnant women. A case study from KwaZulu-Natal.. Trondheim: NTNU 2012 (ISBN 978-82-471-3468-9);Volum 96.310 s. Doktoravhandlinger ved NTNU(96) NTNU
[15] Phillips 1983. Discourse Analysis as Theory and Method. Sage Publications.
[16] Linell, P. 1998. Approaching Dialogue. Talk, interaction and contexts in dialogical perspectives. Amsterdam: John Benjamin’s Publishing Company
6Copyright (c) IARIA, 2015. ISBN: 978-1-61208-424-4
GLOBAL HEALTH 2015 : The Fourth International Conference on Global Health Challenges
18 / 101

Emerging Issues in Medical and Engineering Ethics:
The Case of Reverse Paternalism in Lebanon
Sarah Hammoud, Zahraa Shahrour, Ali Hage-Diab
Department of Biomedical Engineering
Lebanese International University
Beirut, Lebanon
11031556; [email protected],
Hassan Khachfe
Center for Quality Assurance, Institutional Assessment &
Scientific Research (QAIASR)
Lebanese International University
Beirut, Lebanon
Bassam Hussein
Department of Industrial Engineering
Lebanese International University
Beirut, Lebanon
Abstract— There are different occupations and professions in
almost every society, and despite all the ethical frameworks
that govern professions by professional ethics, it is widely
noticed that there are still challenges facing each profession.
One of those ethical challenges is related to paternalism.
Paternalism is the act of interfering with a person’s autonomy
by making decisions for them claiming that it is “for their own
good”. In a developing country like Lebanon, an ethical
dilemma is commonly noticed in the field of medicine but not
commonly discussed in the literature. This dilemma will be
termed and defined for the first time as reverse paternalism.
Reverse paternalism refers to the act of sacrificing one’s
autonomy and self-determination and giving another person or
group the right for making decisions on their behalf. People
are considered moral agents and some are giving up their
autonomy and rights for making decisions to medical
practitioners because “they know better”. The main focus of
this paper is therefore on reverse paternalism that will be
investigated as an ethical dilemma being faced in Lebanon.
What exactly is reverse paternalism? Are there regulations
that restrict such kind of paternalism? How do medical
practitioners act in such situations? And to what extent is there
auditing over what happens in hospitals, private clinics,
medical centers and institutions? Our aim is to shed the light
on this ethical dilemma and highlight how serious and wide
spread it has become, by providing statistical data we have
collected. We will also provide recommendations based on
cases showing the adverse ramifications of reverse paternalism
on society.
Keywords—medical ethics; engineering ethics; medicine;
paternalism; reverse paternalism.
I. INTRODUCTION
We live in a world that is divided into groups of distinct
fields related to disciplines of different schools. People get
education and major in different fields to become
professionals and enter the world of employment. Doctors,
scientists, professors, lawyers, teachers, engineers, etc., find
themselves in situations where important decisions have to
be made, and because they are the ones “who know better”,
their decisions have to be right, especially when other
people depend on them. Governmental morals are often
incomplete without personal morals. Three types of
moralities or ethics have arisen, namely, common morality,
personal morality, and professional ethics [1]. Each country
classifies various occupations as being a profession or not.
Engineering for example is considered a profession in our
society and therefore needs a set of standards to be adopted
by professionals. Each profession should include a basic
methodology for deciding what is morally right and what is
morally wrong in one’s professional conduct to qualify
whether an action is right or wrong. This normative ethics
and principles leads to the codes of ethics that demonstrate
the accountabilities and duties of each profession and when
these codes are followed, the field flourishes and brings
changes to the field and the world as well. But what happens
if these codes are not taken into consideration and
professionals act outside the ethical frameworks that govern
their behavior? And who is affected by such unethical acts?
Despite of all these normative ethics and standards, it is
widely noticed that there are still challenges facing each
profession. As Biomedical Engineers, one of the
professional obligations that governs our personal practice is
to regard responsibility toward the rights and the health of
patients and since the doctor-patient relationship is an
example of a relationship between individuals which is
ruled by ethical behavior, we found that it is important to
shed light on one of the ethical challenges that faces this
7Copyright (c) IARIA, 2015. ISBN: 978-1-61208-424-4
GLOBAL HEALTH 2015 : The Fourth International Conference on Global Health Challenges
19 / 101

relationship which is the long-practiced paternalism.
Paternalism is the act of interfering with a person’s
autonomy by making decisions for them claiming that it is
“for their own good” [2].
Paternalism is problematic because the definition of a
patient’s best interests used by a paternalistic approach is
too narrow, because such best interests should not be
determined by the medical facts alone but the patient’s
views and judgments should be taken into consideration
also. It has become evident that doctors often act in a
paternalistic way about their patients claiming to do so
because they “know better”. In a developing country like
Lebanon, various medical practices lack a successful shared
decision-making because of the physicians’ attitudes and
irresponsibility on one hand and the patients’ lack of
education, fear, laziness and the inability to make a serious
decision on the other hand. But what is really interesting
that paternalism nowadays is encouraged by the patients
themselves; in other words, paternalism is being reversed
and moral agents, such as patients, customers etc. are giving
up their autonomy either intentionally or unintentionally.
This ethical dilemma is commonly noticed in the field of
medicine, and will be termed and defined for the first time
as reverse paternalism. This paper will provide a small
background about ethics, and discuss paternalism and the
possible causes of reverse paternalism. Patients were
surveyed with a questionnaire designed to identify the
extent of reverse paternalism tendencies. Hence, a definition
and some possible solutions will be proposed. Medical
reverse paternalism is one of the ethical cases that
specifically apply to biomedical engineering, but all types of
engineering in general as well. This is the first time that this
ethical issue is being identified, quantified, discussed and
assigned of being a real problem and factor in various fields
such as medical diagnosis and treatment in Lebanon. Our
aim is not only to gather data of the extent of reverse
paternalism in Lebanon, but also try to understand how to
raise the awareness of patients for their treatment choice
rights. This is implemented by distributing a questionnaire
with very direct questions related to reverse paternalism.
In Section II, we will define ethics and their
contributions to religion and culture, to give an idea about
the influence of religious and cultural ethical aspects on
decision-making processes of people. In Section III, ethics
will be explained and defined according to their types in the
fields of bioethics, engineering ethics and medical ethics, as
well as biomedical engineering ethics. Section IV will be
about the scope of this paper, which is reverse paternalism.
In this section, the link between paternalism and reverse
paternalism will be explained. It will also be defined for the
first time given a title and explanation of the importance of
engineers contributing to this dilemma. It will also highlight
the relation between biomedical engineers and ethical
dilemmas that are found in medical practices, and the
importance of taking responsibility for what happens with
patients in medical practices. Section V is an explanation of
the concept of informed consent that is obligatory in
medical practices for patients to know what exactly will be
done during certain treatments. Section VI provides a clear
explanation of how a decision-making process between
patients and doctors should be done, in addition to a
comparison to how it is done in Lebanon, in our
observation. Section VII includes the survey that was done
by distributing a questionnaire and collecting data, in
addition to a presentation of the results of our investigation.
Finally, Section VIII is a conclusion of what we have
hypothesized and the outcome of whether reverse
paternalism is an ethical challenge in Lebanon or not.
II. WHERE IS ETHICS FOUND?
Ethics is a group of principles, values, rules and
regulations, beliefs, morals and rules of conduct [1]. This
group organizes goals and actions for the achievement of the
most important values one can have. This means that any
flaw in behavior might mislead one from the path of being
ethical. Ethics can be described as being a system of moral
principles that differentiate between what is right and what
is wrong. In other words, ethics is a norm of conduct that
recommends concepts of acceptable and unacceptable
behavior.
All cultures have systems of health beliefs to explain
what might be the cause of a certain illness, the way it can
be treated and who will be involved in it. Culture specific
values have high influence on patient roles and expectations.
It often specifies how much information is desired, how
death/dying will be managed, sorrow patterns, gender
family roles, and processes for decision-making [3].
Therefore, each culture brings its own views and values to
the healthcare system which alters healthcare beliefs, health
practices, and of course the nature of the doctor-patient
relationship. Cultures differ mainly between developed and
under-developed countries. Developed countries adopt a
shared decision-making process between the patient and the
doctor, where the patient receives all the information,
support and education that is needed and asked for by the
patient. Whereas developing countries rather lack that kind
of relationship and consultations between patients and their
doctors.
Ethics can be seen as the base of religions, though it is
explained and may be even seen from different perspectives
in various religions. Since religion has very high impact on
how most of the people live, behave and how they do not
behave, then ethics must be applied to tell whether this act is
right or wrong. However, each religion has another opinion
of how to clarify ethical principles. Lebanon is known to
have the most religiously diverse society in the Middle East,
hence it is important to address the issue of Reverse
Paternalism from a religious point of view. By approaching
this case, Christianity and Islam will be considered rather
generally. We find that Western Christian Civilization, and
specifically American medicine, is founded upon Biblical
8Copyright (c) IARIA, 2015. ISBN: 978-1-61208-424-4
GLOBAL HEALTH 2015 : The Fourth International Conference on Global Health Challenges
20 / 101

ethics and the tradition of the Greco-Roman Heritage. These
are based on several principles such as the presence of
moral codes and moral justifications, the doctor-patient
relationship, in addition to moral integrity etc. Life in all its
forms has a very high status in Islam, and human life is one
of the most sacred creatures of God. It must therefore be
respected, appreciated and protected. Islamic law is called
the Shari’a and is not the same as Islamic ethics, since in
Islam everything has to be checked twice, first if it is against
legal standards and second against moral standards [4].
There is an absolute harmony between Islamic law and
morality, but they have still different objectives, meaning
that they might differ in their prescriptions.
III. THE MAIN TYPES OF ETHICS
Our study mainly concerns ethics in biomedical
engineering, which is the intersection between bioethics,
medical ethics, and engineering ethics. In order to
understand the relationship and contributions of these fields
with one another a brief overview of each is provided.
A. Bioethics, Medical Ethics, and Engineering Ethics
Bioethics is an activity; it is a shared, reflective
examination of ethical issues in health care, health science,
and health policy [5]. It defines the basic ethical values for
the conduct of biomedical and behavioral research involving
human and non-human subjects.
Medical ethics is a system of morals and principles
being applied to situations that are specific to the medical
world and the practice of medicine. Ethical principles are
mainly: autonomy, beneficence, justice and non-maleficence
[6].
Engineering ethics stands for the set of ethical standards
and principles ruling the behavior of engineers in their title
role as professionals. In other words, an engineer should be
devoted to the protection of public health, safety, and well-
being [1].
B. Biomedical Engineering Ethics
Biomedical engineering is the application of engineering
principles and techniques to medicine and biology. Each
profession is ought to include a basic methodology for
deciding what is morally right and what is morally wrong in
one’s professional conduct. Ethics is considered to be the
central concept to biomedical engineers, since its principles
guide them to recognize ethical problems and attempt to
solve them. This is why there is a code of ethics that
emphasize the major principles of a biomedical engineer
being followed and respected. But what is a principle?
A principle is used as a basis for ethical reasoning by
guiding a specific action or behavior. Autonomy,
Beneficence, Non-maleficence, and justice are the main
principles biomedical engineering ethics is based on [6].
IV. REVERSING THE TIDE OF MEDICAL PATERNALISM
Every time the state of a person is interfered with
another person’s autonomy, it is a case of paternalism,
which of course is claimed to be of benefit for the person
who “knows less” than the one acting paternalistic. This act
is often justified and thereby wrapped in a more attractive
appearance as providing protection and hence the best for
the other person. A significant kind of autonomy is the one
that exists as a counterweight to the medical profession’s
long-practiced paternalism. Today, the principle of patient
autonomy and self-determination has emerged as the
dominant ethos in health care, threatening in many instances
to totally eclipse the principle of medical beneficence [7].
The typical doctor-patient relationship, where the physician
acts paternalistically towards their patient and takes
decisions for them and very often not even explains why
and how the decision was taken. In their opinion, there is no
need to explain, because the patient either would not
understand it, or does not need to know about it. There are
many reasons that may have led to this situation that we find
in these days, especially in Lebanon.
What makes it such a serious and dangerous case is that
patients do not even notice how they are being used and are
losing their autonomy because a doctor just decided that this
pregnant woman cannot give birth naturally and needs to
undergo a caesarean operation instead. This woman of
course believes it because in the end she thinks that her
doctor is just doing what is right and best for her and her
baby and this is all she cares about. But what this woman
does not know is that very often it is not her that benefits
from this operation, but her doctor. It is a common
knowledge in Lebanon that there are many doctors that can
be considered more as businessmen rather than physicians
that once took the Hippocratic oath. What matters is how
much they benefit instead of acting according to the
principles that seek for beneficence, non-maleficence, and
justice for the patients.
Because people behave according to their culture and
religion, a doctor should at least be aware of what those tell
the patient to do. Is mere knowledge enough to justify the
limitations that patients are subjected to on their liberty or
violations of their autonomy? And is it even morally
defensible to act paternalistically in the sake of preventing
harm and providing welfare and benefit? At first thought
one might think of course it is, but the real problem that is
addressed here is that such acts are done without taking the
patient’s opinion into consideration, neither does the doctor
explain what might be the side effects of certain decisions.
People can be paternalistic. Institutes can be
paternalistic. Motivations can be paternalistic. Acts can be
paternalistic. Reasons can be reasons of paternalism.
Paternalism is found everywhere. But does this completely
incapacitate our ability to make our decisions and choices?
Does giving up our right to choose become a habit? The real
problem exists when people, in particular patients,
9Copyright (c) IARIA, 2015. ISBN: 978-1-61208-424-4
GLOBAL HEALTH 2015 : The Fourth International Conference on Global Health Challenges
21 / 101

proactively give up their autonomy by themselves and leave
all the decisions to the physician, again, because “they know
better”. Many of those may be too old to take certain
decisions, and others might just not understand what will
happen thereby, diminishing their rights to choose.
Whenever a patient asks his/her doctor to prescribe
whatever medicine or medical intervention that the doctor
sees fit, we have a case of Reverse Paternalism. Whenever a
patient refuses to choose a treatment procedure among other
procedures and trusts the doctor to choose for him, we have
a case of Reverse Paternalism. Whenever a patient is
advised to perform a medical image in a specific laboratory
assigned by a doctor and does not question the doctor’s
recommendation, we have a case of Reverse Paternalism.
Therefore, these acts feed the tide of paternalism to give rise
to an emerging ethical dilemma termed as Reverse
Paternalism, which is the act of sacrificing one’s autonomy
and self-determination and giving another person or group
the right for making decisions for them. The patient allows
the physician to do what is best for them, and this way
taking life-based decisions for them. What this patient might
not have thought about is that this doctor might misdiagnose
a case and make mistakes. Who is to blame in such cases?
How honest is this doctor and to what extent might he/she
be saying the truth?
There are numerous reasons that push patients into
giving up their autonomy and let their physician choose for
them. Though most of these reasons neither justify nor solve
the dilemma of reverse paternalism. Yes, there are many
cases one could think of where reverse paternalism is the
right thing to do, but there will never be certainty to that the
physician’s interest is only their patient and their health. So,
to what extent can doctors be trusted?
The least this patient can ask for is information. There is
a whole protocol to be followed if a patient must undergo a
surgery. The physician is ought to take enough time in order
to explain why the surgery has to be done, who will be
doing it, where is it going to happen, what the consequences
and side-effects might be, if there are other choices, and
what might happen if this surgery was not performed.
Images and explanations with simple terminology should be
used in order to make sure that the patient has understood
everything and can now decide and choose. This patient
must be a moral agent and the physician must try as much as
possible not to act paternalistically and abide by the rules of
professional medicine. Paternalism induces power
imbalance between health professionals and patients. The
professional should be the expert in the area of diagnostic
information, treatment options and possibilities. But the
patient is also an equally valid expert, with specialist
knowledge in her or his own personal concerns, history,
family roots, philosophy and way of life. The expertise that
the professional brings to the consultation is not merely
technical [8]. This kind of paternalism is most commonly
present in the field of medicine, and directly related to
biomedical engineering in particular, and engineering in
general.
As Biomedical engineers, it is our obligation to conduct
responsibility towards the rights and safety of patients that
are part of this issue. For this reason, we find it important to
shed light on this challenge of reverse paternalism, and
inform people about the importance of remaining their
moral agency. It is important to find out how frequent a
successful shared decision-making process is in a
developing country like Lebanon, in order to investigate the
reasons behind this ethical dilemma. This dilemma
interferes with decisions taken by engineers who work in the
medical field. Biomedical engineers are engaged in a range
of interactions, which includes interactions with patients as
well as doctors. We noticed in our society that there is a
clinical dependence of patients in their decision-making
process on the opinions of their doctors. Some patients tend
to trust their doctors to an extent that made the doctor-
patient relationship crossing the boundary of professional
ethics.
Biomedical engineers are responsible agents in their
respective profession, which means that they must act in the
interest of the patients and use their knowledge and skills to
benefit them and inform and alert them when it is needed.
Because biomedical engineers are engaged to deal with
medical devices and equipment in hospitals and health care
facilities, then they have responsibilities towards the life and
safety of patients. One example that reveals the issue is
when a doctor prescribes MRI or CT scan at a specified
medical laboratory for a patient for no clinical reason, only
for the benefit of the doctor or to benefit the medical
laboratory and the patient accepts and trusts their doctor and
allows them to make decisions on his/her behalf. Here, the
biomedical engineer can either accept that kind of behavior
and even make use of the patient’s dependence and
ignorance, or encourage legislations regarding this issue and
educate the patients and alert them about the hazards of
Figure 1. Diagram Illustration of the interaction of a Clinical/Biomedical
engineer [9].
10Copyright (c) IARIA, 2015. ISBN: 978-1-61208-424-4
GLOBAL HEALTH 2015 : The Fourth International Conference on Global Health Challenges
22 / 101
radiations and the technical implications of any medical
procedure/treatment and strive to protect the patients and
their rights and educate them about the importance of
getting involved about decisions regarding their treatment.
As engineers, we are expected to satisfy the standard of
care by holding paramount the safety and health of the
public. As biomedical engineers, we must act in patient-
centered manners and apply engineering principles in
managing medical systems and devices in the patient
setting. Thereby, we are obliged to regard responsibility
towards the health and safety of patients. Figure 1 illustrates
the interaction between a clinical/biomedical engineer and
other parties. This not only verifies that a biomedical
engineer is involved in all decision-making processes with
all kinds of departments, in any healthcare facility, but it
also highlights the fact that patients are prioritized. Our role
as biomedical engineers is patient-centered and this is
another reason for us to approach this ethical dilemma with
high interest. The current patient-doctor relationship that is
presented in our society has triggered our sense of
responsibility; where we identified an emerging ethical
dilemma concerning this relationship where we think that
some patients themselves are encouraging the act of medical
paternalism, which is long practiced by doctors in the
medical field.
V. INFORMED CONSENTS IN MEDICINE AND
ENGINEERING
Let us take a closer look at this principle and explain its
importance. As mentioned previously, moral agents have
the autonomy to make decisions on their own, and
differentiate between right and wrong. A patient has
therefore the capacity to act intentionally with a full
understanding, and without influence of a free and voluntary
act. It is the basis for the practice of an “Informed Consent”.
It is very important to shed light on what an informed
consent is because it has become evident that many people
do not even know of its existence. An informed consent is a
process for getting a patient’s permission before being
subjected to a certain healthcare intervention. In other
words, when a patient is diagnosed to undergo a surgery or
receive therapy, the physician is obliged to get the patient’s
permission. This is done by providing them with a
document that contains all the information the patient has to
know before taking the decision of permission or not. It
comprises a clear appreciation and understanding of all the
relevant facts, implications, and consequences of the
specific therapy or surgery. Certainly, no information
should be kept from the patient so that they are able to form
a rational decision and to avoid severe ethical issues arising
from the lack of sufficient data. If a patient is not able to
take any decision due to mental disability, sleep deprivation,
Alzheimer’s disease, or being in a coma, or immaturity, then
another individual is certified to give consent on their behalf
such as parents, siblings, or legal guardians of a child.
Sometimes the consent is divided into an information
component, and a consent component. The information
component refers to disclosure of information and
comprehension of what is disclosed giving the patient the
chance to consider its content in his/her decision-making.
The consent component refers to both that his decision is a
voluntary decision and that permission is given to proceed.
Note that informed is collected according to guidelines from
the fields of medical ethics and research ethics.
In Lebanon, many patients that have undergone
surgeries or treatments, sound surprised when hearing the
word “informed consent”, which implies that they most
probably have never seen one and thereby permission was
taken only orally if not paternalistically. The informed
consent is not only a must for patients, but also a protection
for physicians. It is evidence that the patient agrees to what
will happen to them, and what might happen if they did not
undergo this surgery or therapy. Not only has the patient
the right for an informed consent, but also the physicians
and doctors. Many practitioners believe however that
patients may thus be better served if efforts are directed
instead to finding ways of minimizing hard paternalism
without too great a compromise on patient’s freedom [7].
This argument is yet to be validated from an ethical
perspective.
VI. DECISION-MAKING PROCESS
Decision-making process is the process of selecting a
belief or a course of action among various alternative
choices. Taking the doctor-patient relationship as an
example to illustrate this process, seven main steps will be
explained in order to highlight the importance of the
informed consent that is part of this process [10]:
1) Identify decision to be made
2) Gather relevant information
3) Identify alternatives
4) Weigh evidence
5) Choose among alternatives
6) Take action
7) Review decision and consequences
Doctors have the medical knowledge that makes them
superior to patients in decision-making. They do know best
in the sense that they have more scientific and medical
information concerning injuries and diseases and their
elimination and elevation more that the patients have.
Therefore, patients are advised to surrender to this epistemic
authority. This issue raises various ethical and social
questions that should be taken into account. There are many
patients that do want to know and gain knowledge about
their diagnosis or treatment, but the main challenge is about
the patients that show no interest to shared decision making.
Patients are now quite aware of how the process of decision-
making is done. Table I illustrates a comparison between
11Copyright (c) IARIA, 2015. ISBN: 978-1-61208-424-4
GLOBAL HEALTH 2015 : The Fourth International Conference on Global Health Challenges
23 / 101
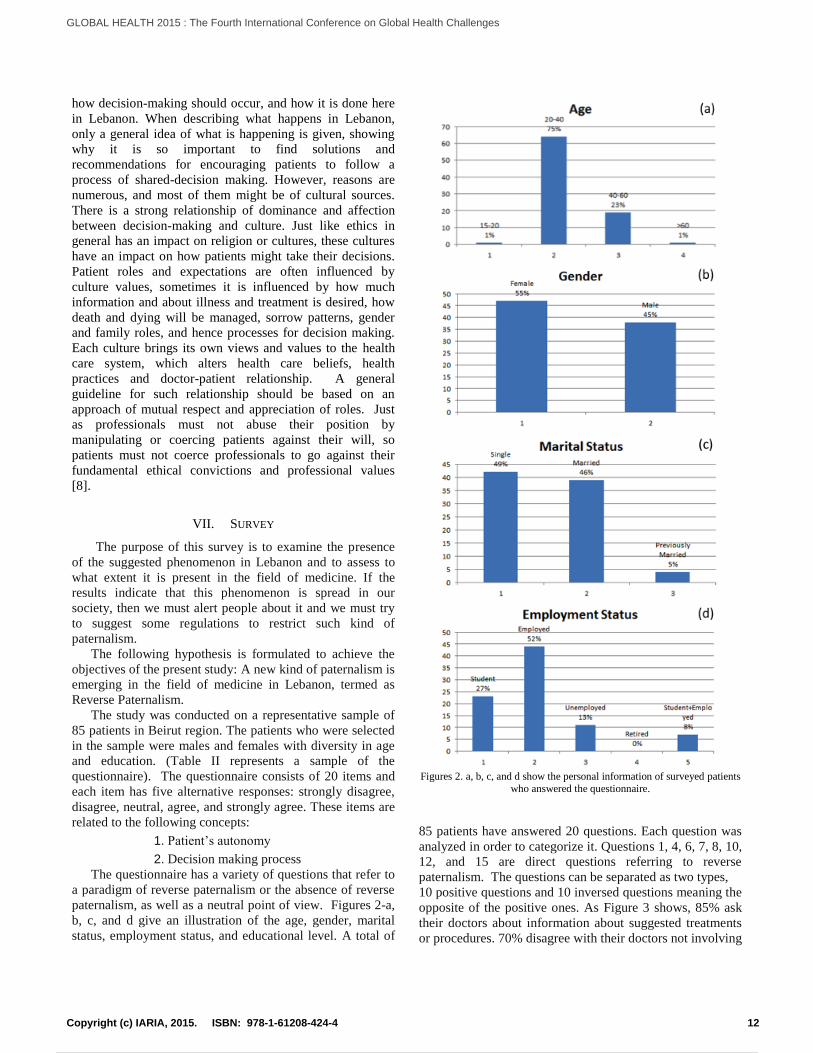
how decision-making should occur, and how it is done here
in Lebanon. When describing what happens in Lebanon,
only a general idea of what is happening is given, showing
why it is so important to find solutions and
recommendations for encouraging patients to follow a
process of shared-decision making. However, reasons are
numerous, and most of them might be of cultural sources.
There is a strong relationship of dominance and affection
between decision-making and culture. Just like ethics in
general has an impact on religion or cultures, these cultures
have an impact on how patients might take their decisions.
Patient roles and expectations are often influenced by
culture values, sometimes it is influenced by how much
information and about illness and treatment is desired, how
death and dying will be managed, sorrow patterns, gender
and family roles, and hence processes for decision making.
Each culture brings its own views and values to the health
care system, which alters health care beliefs, health
practices and doctor-patient relationship. A general
guideline for such relationship should be based on an
approach of mutual respect and appreciation of roles. Just
as professionals must not abuse their position by
manipulating or coercing patients against their will, so
patients must not coerce professionals to go against their
fundamental ethical convictions and professional values
[8].
VII. SURVEY
The purpose of this survey is to examine the presence
of the suggested phenomenon in Lebanon and to assess to
what extent it is present in the field of medicine. If the
results indicate that this phenomenon is spread in our
society, then we must alert people about it and we must try
to suggest some regulations to restrict such kind of
paternalism.
The following hypothesis is formulated to achieve the
objectives of the present study: A new kind of paternalism is
emerging in the field of medicine in Lebanon, termed as
Reverse Paternalism.
The study was conducted on a representative sample of
85 patients in Beirut region. The patients who were selected
in the sample were males and females with diversity in age
and education. (Table II represents a sample of the
questionnaire). The questionnaire consists of 20 items and
each item has five alternative responses: strongly disagree,
disagree, neutral, agree, and strongly agree. These items are
related to the following concepts:
1. Patient’s autonomy
2. Decision making process
The questionnaire has a variety of questions that refer to
a paradigm of reverse paternalism or the absence of reverse
paternalism, as well as a neutral point of view. Figures 2-a,
b, c, and d give an illustration of the age, gender, marital
status, employment status, and educational level. A total of
85 patients have answered 20 questions. Each question was
analyzed in order to categorize it. Questions 1, 4, 6, 7, 8, 10,
12, and 15 are direct questions referring to reverse
paternalism. The questions can be separated as two types,
10 positive questions and 10 inversed questions meaning the
opposite of the positive ones. As Figure 3 shows, 85% ask
their doctors about information about suggested treatments
or procedures. 70% disagree with their doctors not involving
Figures 2. a, b, c, and d show the personal information of surveyed patients
who answered the questionnaire.
12Copyright (c) IARIA, 2015. ISBN: 978-1-61208-424-4
GLOBAL HEALTH 2015 : The Fourth International Conference on Global Health Challenges
24 / 101

Figure 3. Illustration of how many patients ask for information.
Figure 4. Patients’ disagreement on not being involved in decision-making
processes.
Figure 5. Patients say that they have a successful shared-decision making
process with their doctors.
Figure 6. Patients wanting their doctor to choose and decide on their behalf.
Figure 7. The percentage of patients who find it ethically permissible for
doctors to act paternalistically.
Figure 8. Patients refuse to let their doctors choose on their behalf.
13Copyright (c) IARIA, 2015. ISBN: 978-1-61208-424-4
GLOBAL HEALTH 2015 : The Fourth International Conference on Global Health Challenges
25 / 101

them in decisions about their treatments (Figure 4). Only
53% do not allow their doctors to choose on their behalf,
19% have a neutral opinion, which means that 28% allow
their doctors to take decisions for them (Figure 5). Figure 6
illustrates how 38% agree that it is ethically permissible for
doctors to act paternalistically with their patients. When
asked if they refuse to let their doctors to take decisions on
their behalf, 44% disagreed (Figure 7).
As most of the results indicate the existence of weak
reverse paternalism, we took a closer look at the age and
educational status of those who showed tendency towards
reverse paternalism. Some of the patients that are in the age
range of 40-60 years have a lower educational level, due to
the complications of war Lebanon has faced, also showing
tendency towards reversing paternalism. We chose a patient
to ask about his last visit to a Doctor. This patient was a
married, employed male of age between 40-60 years of age
with an elementary educational level. He was asked about
how much he trusts his Doctor and how much he believes in
what he prescribes as treatments. He agreed on telling us
what his problem was and what was prescribed, and when
we asked him if he knows what each drug is for he said no
and responded: “ He is a very good Doctor and I am sure he
knows what is best for me and what to prescribe for me to
get better.” Again, we took a closer look at the questionnaire
this patient had filled, and noticed that they do not quite
match the way he really acted.
VIII. CONCLUSION
Who is to blame? When patients give up their autonomy
in the thought of having someone more educated and
professional taking decisions for them? Who is to blame if
that person did not do what is most beneficial for the
patient? Reverse paternalism appear to be a serious issue in
developing countries. However, it has not been defined yet
because people have not acknowledged it till now, even
though it has become a common knowledge in the medical
practice. This is due to the absence of the regulations
specific to reverse paternalism that can restrict the
physicians’ unethical behavior towards patients. Physicians
who are supposed to be committed to the Oath they made
are making use of some patients’ dependence and lack of
education for their own interests, with the absence of ethical
concepts or regulations. In Lebanon, medical practitioners
lack the sense of responsibility due to the lack of auditing
and supervision over what happens in hospitals/clinics.
A good test for their responsibility is the question “Do
physicians commit to ethical or legal standards when there
is no supervision?” and it seems that most doctors fail this
test!
Our intentions were not only to get numbers and
percentages of people who really are reversing paternalism
or not, but as mentioned previously in the introduction, the
questions were direct on purpose. Some of the questions
were answered as how patients should act, but do not really
act like in real life. This does not mean that the results are
far from reality, because patients were very honest, but it
rose awareness and may even prevent patients from not only
reversing paternalism, but also reduce the long-term
practiced paternalism. Now, surveyed patients may think
twice about how to undergo the process of shared-decision
making. As engineers, it is our responsibility to alert people,
inform them about problems and challenges they might face
and advise in order to help them avoid harm. Since numbers
are still not very high, reverse paternalism might be just at
its beginning to increase, and our aim is to reduce and
prevent this ethical issue from happening.
Recommendations must be provided to control this
ethical dilemma. Ethical guidance that governs the behavior
of doctors and patients in cases of Reverse Paternalism
should be developed. Highlighting the importance of
consent before any medical intervention is another
recommendation. Moreover, we recommend organizing at
least one meeting before any operation where the patient
consults and gets all the information needed. In order to
raise that issue and let people know that they do not have to
give up their right of autonomy, medical practitioners
should teach people to ask!
REFERENCES
[1] Harris, C. E., Pritchard, M. and Rabins, M., Engineering
Ethics Concepts & Cases, California: Wadsworth-Cengage
Learning Belmont, 2009.
[2] Enderle, J. D. and Bronzino, J. D., (Eds), Introduction to
Biomedical Engineering, Academic Press, 2012.
[3] Spector, R. E., Cultural Diversity in Health and Illness, New
Jersey: Pearson Prentice Hall Upper Saddle River, 2004.
[4] Shomali, M. A., ‘Islamic bioethics: a general scheme”,
Medical Ethics and History of Medicine, 2008.
[5] Sugarman, J., 20 Common Problems: Ethics in Primary Care,
New York: McGraw-Hill Professional Publishing, 2000.
[6] Beauchamp, T. L. and Childress J. F., Principles of
Biomedical Ethics, Oxford, UK: Oxford University Press,
2001.
[7] Chinn, J. J., “Doctor-Patient Relationship: From Medical
Paternalism to Enhanced Autonomy”, Singapore Medical
Journal, vol. 43, no. 3, pp. 152-155, 2002.
[8] Wyatt, J., “Medical Paternalism and the Fetus”, Journal of
Medical Ethics, vol. 27, no. 2, pp. ii15-ii20, 2001.
[9] Dyro, J., Clinical Engineering Handbook, Academic Press,
2004.
[10] Schwenk, C. R., “Cognitive Simplification Process in
Strategic Decision-Making”, Strategic Management Journal,
vol. 5, no. 2, pp. 111-128, 2006.
14Copyright (c) IARIA, 2015. ISBN: 978-1-61208-424-4
GLOBAL HEALTH 2015 : The Fourth International Conference on Global Health Challenges
26 / 101

TABLE I. THE DECISION MAKING PROCESS.
Process steps Description of each step Application of each step in Lebanon
Identify decision to
be made
Go through an internal process of trying to define clearly
the nature of the decision you must make.
Patients realize that there is a decision to be
made but instead of going through an internal
process, they immediately ask their physicians
for advices and what to do.
Gather relevant
information
Most decisions require collecting pertinent information.
The real trick in this step is to know what information is
needed the best sources of this information, and how to
go about getting it. Some information must be sought
from within you through a process of self-assessment;
other information must be sought from outside yourself-
from books, people, and a variety of other sources. This
step, therefore, involves both internal and external
“work”.
Many people do now know where to look for
information or whom to ask. Others try to get
information from people with similar
experiences instead of researching properly. The
process of self-assessment is sometimes not
clear to certain patients.
Identify
alternatives
Through the process of collecting information you will
probably identify several possible paths of action, or
alternatives. You may also use your imagination and
information to construct new alternatives. In this step of
the decision-making process, you will list all possible
and desirable alternatives.
Many patients ask their physicians for
alternatives, but do not know where to look for
information other than their healthcare
practitioners, which is the same problem found
in step 2.
Weigh evidence You draw on your information and emotions to imagine
what it would be like if you carried out each of the
alternatives to the end. You must evaluate whether the
need identified in Step 1 would be helped or solved
through the use of each alternative. In going through this
difficult internal process, you begin to favor certain
alternatives, which appear to have higher potential for
reaching your goal. Eventually you are able to place the
alternatives in priority order, based upon your own value
system.
The challenge in this step is that many patients
do not even reach this step. But helping them
reach this point would make it easier for them to
be able to imagine themselves in certain
situations.
Choose among
alternatives
Once you have weighed all the evidence, you are ready
to select the alternative, which seems to be best suited to
you. You may even choose a combination of
alternatives.
What is done here, is that most patients only take
into account the alternatives their physicians
have told them, so when left with a number of
alternatives they are lost when confronting
decisions on their own. (Only if physicians
haven’t been paternalistic when implying what
alternative to choose).
Take action You now take some positive action, which begins to
implement the alternative you chose in Step 5.
This is where patients return to reverse
paternalism and let their health care practitioners
choose what alternative to choose and
implement.
Review decisions
and consequences
In the last step you experience the results of your
decision and evaluate whether or not it has “solved” the
need you identified in Step 1. If it has, you may stay
with this decision for some period of time. If the
decision has not resolved the identified need, you may
repeat certain steps of the process in order to make a
new decision. You may, for example, gather more
detailed or somewhat different information or discover
additional alternatives on which to base your decision
This depends on what type of decision was
made. If the decision has not resolved the
identified need, if a surgery has not been
successful, patients often blame their physicians.
These physicians however, have been told to
decide for them, which is why shared-decision
making is of highest importance.
15Copyright (c) IARIA, 2015. ISBN: 978-1-61208-424-4
GLOBAL HEALTH 2015 : The Fourth International Conference on Global Health Challenges
27 / 101

TABLE II. PATIENT QUESTIONNAIRE
Answer questions as they relate to you.
Check the box(es) that are most applicable to you.
8) About You
a) 1. Your Age
-20
-40
-60
b) 2. Your Gender
c) 3. Your Marital Status
Single
d) 4. Your Employment status
e) 5. Your Educational level
16Copyright (c) IARIA, 2015. ISBN: 978-1-61208-424-4
GLOBAL HEALTH 2015 : The Fourth International Conference on Global Health Challenges
28 / 101

9) Doctor-patient Relationship
Please complete the following questionnaire by circling the appropriate answer.
Strongly
Disagree
Disagree
Neutral
Agree
Strongly
Agree
I never ask my doctor for information about a suggested
treatment/procedure
1 2 3 4 5
I seek multiple opinions before selecting a surgery/treatment 1 2 3 4 5
I’m confident that my doctor provides me the best treatment 1 2 3 4 5
I don’t want my doctor to involve me in decisions about my
treatment
1 2 3 4 5
I have a successful shared-decision making relationship with
my doctor
1 2 3 4 5
I want my doctor to choose on my behalf 1 2 3 4 5
Doctors know best for patient and they have to decide for
them
1 2 3 4 5
It is ethically permissible for patients to allow doctors to act
paternalistically
1 2 3 4 5
In critical cases I prefer my doctor to choose on my behalf 1 2 3 4 5
I trust my doctor in everything he says because he is well-
known to be the best in his/her field
1 2 3 4 5
I always ask my doctor for information about a suggested
treatment/procedure
1 2 3 4 5
It is not necessary to seek multiple opinions before selecting a
surgery/treatment
1 2 3 4 5
I don’t trust my doctor’s ability to provide the best treatment
for me
1 2 3 4 5
I want my doctor to involve me in decisions about my
treatment
1 2 3 4 5
My doctor-patient relationship lack a successful shared-
decision making process
1 2 3 4 5
I refuse to let my doctor choose on my behalf 1 2 3 4 5
Even though doctors know better, they don’t have the right
to choose for patients
1 2 3 4 5
It is not ethically permissible for patients to allow doctors to
act paternalistically
1 2 3 4 5
I prefer to take all my medical decisions by myself 1 2 3 4 5
I don’t trust my doctor completely just because he is known
to be the best in his/her field
1 2 3 4 5
17Copyright (c) IARIA, 2015. ISBN: 978-1-61208-424-4
GLOBAL HEALTH 2015 : The Fourth International Conference on Global Health Challenges
29 / 101

Privacy-Preserving Online Monitoring Framework for e-Health Applications
Youna JungDepartment of Computing and Information Sciences
Virginia Military InstituteLexington, Virginia, United States
e-mail: [email protected]
Abstract— Many e-health applications track how they are used by patients to enable and validate their effectiveness. While online monitoring can improve the accuracy and quality of e-health applications, there is the potential of serious privacy violations. As e-health applications use online monitoring services, sensitive health data could be exposed to not only the healthcare providers but also the monitoring service providers against wishes of a user. To prevent privacy loss during online monitoring, in this paper, we propose a privacy-preserving online monitoring framework, in short PPoM, that helps providers and users of e-health applications specify their own policies and enforce user privacy policies in systematic manner. To support medical staff and users who do not have enough knowledge and skills on Information Technologies (IT), the PPoM framework provides intuitive and automatic tools that enable non-IT administrators and users to generate privacy policies, enable administrators to automatically insert monitoring code into their e-health applications, and control outgoing messages sent from users’ browsers.
Keywords-e-health application; online monitoring; privacy protection; framework.
I. INTRODUCTION
Online monitoring and analytics are essential techniques to evaluate and enhance the performance of online applications. They help the online service providers improve the usability of their applications by collecting user/usage data and analyzing the performance of applications [1][2]. In general, there are three different approaches to online user monitoring: 1) log file analysis on the server side, 2) proxy-based monitoring, and 3) use of monitoring scripts provided by online monitoring/ analytics services on the client side [3]. In this paper, we focus on the third approach because it is widely used and requires less time and effort to collect, analyze, and visualize user/usage data.
Online monitoring and analytics services, such as Google Analytics [4] and Adobe Analytics [5] have been widely used in a variety of online application areas, such as e-health [6], e-commerce [7], information retrieval [8], and so on. These monitoring/analytics services enable the tracking and recording of user actions and characteristics, such as mouse clicks, frequency of use of an application, time spent in a particular page, media viewed, page navigation sequences, content entered into a textbox, location information, whether a mobile device is being used, and so on.
Among various online application areas, we focus on the healthcare and wellness domains because e-health
applications are becoming ingrained into the everyday life of many people. According to Eysenbach [9], e-health is an emerging field at the intersection of medical informatics, public health and business, referring to health services andinformation delivered or enhanced through the Internet and related technologies. It is an umbrella term that includes a variety of online healthcare applications and systems that use information technologies, such as e-Learning for healthcare, e-Diagnosis, e-Prescribing and online health interventions. By using advanced information technologies, including electronic data management and rich interaction skills, e-health applications are capable of 1) providing personalized services, 2) reducing healthcare cost, 3) ensuring easy access regardless of time and place, 4) ensuring consistent quality of services over time, 5) enabling automated data collection/analysis, and 6) demonstrating the potential for having more honest self-reporting by patients [11]. Many e-health applications have been used for online healthcare education [10], healthcare research [11] and recruitment of its participants [12], collecting healthcare data for research or national healthcare purposes, and conducting healthcare interventions to facilitate disease prevention, disease self-management, and health promotion [13].
Most e-health applications provide several of the following functionalities: 1) self-assessment or self-profiling to recognize individuals’ health-related status and in turn provide personalized messages and/or healthcare services, 2) continuous communication with patients/users using interactive tools such as online trackers, and 3) wide dissemination of information related to health and safety, presented in text and/or multimedia format. To accomplish the purposes of e-health applications, on one hand, detailed monitoring is critical to confirm that e-health applications are used correctly and to validate their efficacy. In order to do so, e-health applications must collect detailed, and often identifiable, user data including health information. On the other hand, the protection of user privacy is however critical since e-health applications often deal with very sensitive private data, including health status, medical records, and family health histories. Control over the sharing of this information is of the utmost importance and urgency because indiscriminate monitoring, if inconsiderate of user privacy, may result in private health data being used for unwanted purposes and/or shared with unknown people [1][14][15]. In case of e-health applications, even generic usage data can be damaging if disclosed. For example, disclosure of the login frequency into an online treatment application for substance
18Copyright (c) IARIA, 2015. ISBN: 978-1-61208-424-4
GLOBAL HEALTH 2015 : The Fourth International Conference on Global Health Challenges
30 / 101

abuse can unintentionally reveal a user’s medical status. Consequently, it is urgent and critical for research to examine how we can simultaneously achieve these two important yet opposing goals -- monitoring identifiable user data while protecting user privacy.
To enable e-health applications to conduct trustworthy user monitoring without concern for loss of privacy, in this paper, we propose a new Privacy-Preserving online Monitoring (PPoM) framework. In the PPoM framework, online monitoring services collect user/usage data based on users’ policies and users can verify user/usage data being monitored and strictly enforce user policies on the client side. The rest of this paper is organized as follows. In Section II, the requirements for secure online monitoring in e-health applications are identified. In Section III, PPoM framework is proposed and the overall architecture is described. For better understand of practical use, in Section IV, operation flows and example use cases are described in detail. In Section V, evaluation plans are presented. Section VI reports on the related work. The conclusions and future work are presented in Section VII.
II. LIMITATIONS AND REQUIREMENTS
A. Limitations
Existing online monitoring approaches on e-health applications have two major problems, as follows:
1) Lack of systemactic methods to verify and enforce privacy policies mutually agreed by users and providers: To protect user privacy during online monitoring, a user needs to specify his/her preference in data disclosure while the administrators of an e-health application specify their privacy policy describing what kinds of user data might be monitored, what those data are used for, who those data will be shared with, and how user data are maintained. Users and administrators can specify their policies using policy languages such as P3P [19] and WS-XACML [20]. Once a user agrees to an application’s policies, the enforcement of agreed policies has been primarily relied on the honor system [16] within the application without any external verification process. To ensure user privacy, the federal Health Insurance Portability and Accountability Act (HIPAA) [17] stipulates that a healthcare component must not disclose protected health information to another component (HIPAA 164.105.(a)(ii)) with only a few exceptions (HIPAA 164.512). However, it is difficult to expose violations of HIPAA regulations within e-health applications in existing approach. If a provider embeds monitoring code and/or third-party data-collecting ads in its webpages, private data can easily be released regardless of users’ wishes. Although this is an obvious violation of HIPAA rules, there are no solutions to systematically detect the application’s fraud and prevent user data from undesirable use and disclosure.
To protect user privacy from undesirable use, some online applications anonymize/de-identify user data by
deleting identifiers in original data but such anonymized data can often be re-identified/de-anonymized [18]. It is hence not enough to hide user identifiers and we need a new method not to share critical information based on user preferences. In addition, anonymization might not be applicable to some e-health applications that require identifiable user data for personalized services. Without a strong enforcement method,many users are unlikely to consent to online monitoring.
2) Need for professional IT knowledge and skills: At present, professional IT knowledge is needed for developing e-health applications with appropriate privacy-preserving monitoring. For example, to specify privacy policies of an e-health application, an application administrator must understand privacy policy languages, such as P3P [19] or WS-XACML [20] and be able to precisely specify the application’s policy in that language. In addition, to use an online monitoring service, the administrator must understand the client-side monitoring code (e.g., in JavaScript), and be able to manually insert privacy-preserving code into the original source code (possibly using different languages) for each web object or webpage being monitored. Hence, administrators of e-health applications need to understand at least one language to integrate privacy-preserving monitoring into applications. This is however an impractical expectation for many non-IT administrators, such as doctors, nurses, health educators and communicators. Not only for non-IT clinical staff who manage e-health applications but also for average users who use e-health applications, it is difficult to exactly specify privacy policies and enable their applications/browsers to protect user privacy. The lack of IT knowledge of administrators and users of e-health applications significantly increases the need for easy-to-use tools for a privacy-preserving framework.
B. Requirements
Towards trustworthy and highly usable online monitoring in e-health applications, the following requirements should be satisfied:
1) For strict enforcement of user privacy policies· Online monitoring services that are aware of user
privacy policies rather than application policies.· Verification methods to ensure that an application
complies with policies mutually agreed by providers and users on user side.
· Enforcement methods to protect user privacy on user side in case of privacy violation during online monitoring.
2) For practical use by non-IT users and staff· User-friendly interfaces to intuitively specify privacy
policies and monitoring objects.· Automatic generation of privacy policies for e-health
applications.· Automatic conversion of existing e-health
applications to privacy-preserving applications in which privacy-aware monitoring code is embedded.
19Copyright (c) IARIA, 2015. ISBN: 978-1-61208-424-4
GLOBAL HEALTH 2015 : The Fourth International Conference on Global Health Challenges
31 / 101

Figure 1. Overall architecture of PPoM framework.
III. OVERALL ARCHITECTURE
To fulfill the requirements described above, in this paper, we propose a new PPoM framework that rigorously protects user privacy by referring user policies and enforcing them on user side. For convenient and easy adoption by e-health application providers, PPoM includes easy-to-use tools for users and providers. The overall architecture of PPoM framework is shown in Figure 1. The detailed descriptions for each component are following:
A. PPoM Service
The problems of existing online monitoring services are twofold. First, users are forced to choose between two options: opt-in or opt-out, and not allowed to choose data to be monitored in fine-grained level. Second, user data are collected based on the decision of providers. Once a user gives consent to monitoring (opt-in), all user activities on the web objects in which monitoring code is embedded are captured regardless of users’ privacy preferences. None of existing services considers users’ privacy preferences during monitoring.
To address the issue of ignorance of user preferences during monitoring, we propose a PPoM service that gathers only authorized user/usage data that users allow to monitor. By specifying privacy policies, users determine which data can be monitored. User policies will be then enforced by a trustworthy third-party monitoring service, the PPoM service. Using the PPoM service, e-health applications can guarantee effective protection of user privacy by providing a way to enforce user policies in a systematic manner rather than simply providing a written agreement. The concrete enforcement framework assists both monitoring services and e-health applications in building better reputations and accelerates active participation in e-health applications without concerns about privacy leakage. In addition, it can be used to compel and enable e-health applications to obey HIPAA regulations.
B. Privacy-Preserving User Browser
If an e-health application is trustworthy and both users and administrators can correctly specify their own policies, then existing approach may be able to guarantee secure online monitoring. However, this protection presumes the
application’s honesty and the user’s ability to specify privacy policies precisely. Let us assume that an e-health application publishes untrusted policies that differ from its actual monitoring behavior. Once user’s policies and the application’s policies are matched, a user will start interaction with the dishonest application and his browser will send unconsented data to the application.
However, user privacy must be protected even if a user is exposed to untrustworthy parties, such as indiscriminate monitoring/analytics services that conduct online monitoring in violation of user privacy, naïve applications that do not have their own privacy policies or dishonest applications that write and/or enforce their policies dishonestly. To address the above security requirement, we propose a PPoM-enabled web browser (in short, PPoM browser) as a user-side protection. For easy adoption, we plan to implement a browser extension that enables existing browsers (e.g., Explorer and Chrome) to perform following tasks:
1) It presents all user data being monitored by online monitoring service(s) in web pages: A PPoM browser displays all monitoring data and recipients of data on the screen by analysing source code of web pages.
2) It allows a user to decide which usage and his/her data can be disclosed: A PPoM browser inspects data types, data values, and destinations of all outgoing message according to user policies. If it detects malicious monitoring that violates user policies, it alerts a user to unauthorized monitoring. For example, if the user decides to disclose his/her medical history to a first-party (e.g., an e-health application website), then a PPoM browser only allows outgoing messages to the e-health application and blocks other messages to other entities (such as ad companies or social networking sites) even if the application does not have its own privacy policy or inserts monitoring code to collect his/her medical history data.
3) It refines the user’s privacy policies based on updated user preferences: If a user’ privacy policies are naïve or incorrect, the proposed approach based on user policies cannot protect user privacy successfully. However, It is very difficult for average users to specify precise privacy policies because it is hard to understand the correlation between description of user data in privacy
Application Converter
4b
2b
3
6
5
Privacy-Preserving Online Monitoring Tool (PPoMT)
Application-specific Monitoring
Code
Privacy Policy Generator
2a4a
Policy Miner
In-pageSelector
AP
PPoMBrowser
Privacy-aware Monitoring
APIs
UP
7a
page
Privacy-Preserving Online Monitoring Service
e-HealthApplication
ApplicationAdministrator
1
User
MonitoringCode Generator
PPoMBrowser
7b
20Copyright (c) IARIA, 2015. ISBN: 978-1-61208-424-4
GLOBAL HEALTH 2015 : The Fourth International Conference on Global Health Challenges
32 / 101

policies and web objects in web pages. To enhance the proposed PPoM framework, a PPoM browser allows users to refine their preferred policies by intuitively selecting what user/usage data can be monitored in web pages.
C. Privacy-Preserving Online Monitoring Tool
As pointed out in Section II. A, it is difficult for non-IT administrators to have professional IT knowledge and skills that necessary for trustworthy online monitoring. In this paper, we propose the PPoM Tools (PPoMT) to help health professionals. PPoMT enables non-IT clinical staff to specify privacy policies for their healthcare applications, and/or to easily convert their applications into privacy-preserving applications that analyze user/usage data without violating user privacy. While motivated by the needs of non-IT administrators, this tool could also improve the efficiency of developers who are required to insert monitoring code into their applications. The PPoMT consists of four individual tools: the In-page Selector, the Monitoring Code Generator, the Privacy Policy Generator, and the Application Converter. The detailed explanations for each tool are following:
1) In-page Selector: It is a server-side software module that is capable of generating modified webpages that have user-friendly interfaces for selection of web objects to be monitored and corresponding policies and delivering user selections to the Privacy Policy Generator and the Monitoring Code Generator. It sends modified webpages to the PPoM browser of an administrator. By clicking on web objects that are displayed in the PPoM browser (e.g., a button, link, text, image, or video), the administrator can select which objects to monitor without any IT knowledge and skills. Additionally, he can declare corresponding privacy policies.
2) Monitoring Code Generator: It generates privacy-aware monitoring code by receiving an administrator’s selection on monitoring objects and associated privacy policies from the In-page Selector. The generated code will be varied depending on monitoring services.
3) Privacy Policy Generator: It helps non-IT administrators who may be unfamiliar with online privacy policy languages publish privacy policies for their own applications. Using the Policy Miner, it derives the privacy policies for a given application by analyzing all monitoring objects and corresponding privacy policies that are selected by the administrator.
4) Application Converter: It helps non-IT administrators to update source code of an existing application by assisting them in inserting the privacy-aware monitoring code generated by the Monitoring Code Generator. Once the code modifications are made, an administrator needs to deploy the modified source code in their server.
IV. PRIVACY-PRESERVING MONITORING USING PPOM
In this section, we explain how PPoM protects user privacy during online monitoring and supports non-IT administrators and users by describing operation flows and example use cases from the point of view of administrators and users.
A. For online healthcare providers
Let us assume that Alice, a medical doctor, administrates an e-health application that assesses the impact to people following exposure to traumatic events. To trace patients’ activities and collect health-related data, Alice wants to conduct online monitoring on her applications, but it is impossible for her to use existing online monitoring services due to lack of IT-related knowledge.
E-health Application(Administrator)
Monitoring Service
In-page Selectoradds check boxes and drop-down lists to web objects in pages
Establish a service agreement
Establish a service agreement
Request a monitoring service
Mutual agreements
PPoM-enabled application
PPoMT
OR
Monitoring Code Generator creates privacy-aware monitoring code
Application Converter transforms an existing application to an PPoM-enabled application Updated source code
Insert the privacy-aware monitoring
code into an application
Privacy Policy Generator creates the policies of an application (AP)
AP
AP
S
S´
Application policies (AP)
An administrator selects objects to
be monitored and corresponding
policies through his PPoM browser
Application-specific privacy-aware monitoring code
Original source code
S´
(1)
(2a)
(2b)
(4)
(3)
(5)
Figure 2. Operation flow of administrators of e-health applications in PPoM.
21Copyright (c) IARIA, 2015. ISBN: 978-1-61208-424-4
GLOBAL HEALTH 2015 : The Fourth International Conference on Global Health Challenges
33 / 101

If she uses the PPoMT, she can easily transform her application into a monitoring-enabled application without any IT knowledge. For better understanding, let us look at its operational flow in detail. First, she needs to upload the source code of her application or enter the URL(s) of the application’s webpage(s). Second, she selects objects to be monitored through the user-friendly interfaces generated by the In-page Selector, and specifies corresponding privacy policies (Figure 1.(1) and Figure 2.(2)). Third, her selections are delivered to the Policy Generator (Figure 1.(2a) and 2.(2a)) and the Monitoring Code Generator (Figure 1.(2b) and Figure 2.(2b)). Forth, the Privacy Policy Generator then creates the applications’ policies by analyzing selected monitoring data and policies, while the Application Converter (which enables the application to perform privacy-preserving monitoring by inserting monitoring code generated by the Monitoring Code Generator into the original source code (Figure 1.(3) and Figure 2.(4)) produces the updated source code. Fifth, Alice deploys the created application policies (Figure 1.(4a) and Figure 2.(3)) and the updated source code in the application server (Figure 1.(4b) and Figure 2.(5)).
B. For Users
Let us assume that Bob is one of Alice’s patients. Alice recommends Bob to use her e-health application every week to assess his mental and physical health but he hesitates to use the application due to privacy concern. If Bob uses the PPoM browser, he may want to use an e-health application without privacy loss. Towards this, Bob is first required tospecify his own privacy policies and store his policies in his browser before using an e-health application (Figure 3.(1)). His PPoM browser then compares his privacy policies and application policies when he enters a url of Alice’s application (Figure 3.(2)). If they match, the application server sends PPoM-enabled pages which privacy-aware monitoring code is embed in (Figure 1.(5)(6) and Figure 3.(3)). As he interacts with the application, the PPoM browser displays all user/usage data being monitored to enable users to verify privacy protection during online monitoring (Figure 3.(4)). If there is no privacy violation, the privacy-aware monitoring code collects only authorized user data according to policies of him specified by him for the sake of himself (Figure 1.(7a)(7b) and Figure 3.(5)). To ensure enforcement of user policies, his PPoM browser blocks outgoing messages that violate his privacy policies on the user side (Figure 3.(6)).
User PPoM Browser E-health Application(Administrator)
Privacy-PreservingMonitoring Service
User privacy-preserving online monitoring
Check if an application's policies match with user
policies
Render a page with user data being monitored in privacy-preserving mode
Generate user policies
IF not match, stop the interaction
UPUP
Check if match with
the intended preference
Refine user policies with fine-grained user selection
UP´
Negotiate with the application using the refined user policies
Check outgoing user data
IF match, request a page
IF m
atc
h,
star
t in
tera
ctio
n
IF not match
IF violate user policies, block outgoing msg
IF not violate user policies, send user data
User policies (UP)
Request an application's policyEnter a URL
User data
AP
IF succeed
(1)
(2)
(3)
(4)
(5)
(6)
Figure 3. Operation flow of users in PPoM.
22Copyright (c) IARIA, 2015. ISBN: 978-1-61208-424-4
GLOBAL HEALTH 2015 : The Fourth International Conference on Global Health Challenges
34 / 101

V. EVALUATION PLAN
To evaluate the performance of the proposed privacy-preserving monitoring service, we will calculate the ratio of the number of all monitoring data (a+c in Table I) to the number of unauthorized but collected data (c in Table I). In addition, we will also test the successful blockade ratio of the number of messages containing unauthorized data (g+h in Table II) to the number of blocked messages among them (gin Table II). We will plan to test the developed tool, PPoMT, by comparing a user’s selections of monitorable data and corresponding privacy preferences with monitoring scripts or source code that generated by PPoMT. To evaluate the correctness of the generated privacy policies, we will create a variety of anticipated privacy policies, use PPoMT to generate privacy policies, and compare the resulting policies with the anticipated policies.
TABLE I. USER DATA MONITORED BY THE PROPOSED PRIVACY-PRESERVING MONITORING SERVICE
Monitored Not monitored
Allowed a b
Not allowed c d
TABLE II. OUTGOING MESSAGES FROM A PROPOSED USER AGENT
Sent Blocked
Allowed e f
Not allowed g h
VI. RELATED WORK
A. Provider-side privacy protection for online monitoring
To guarantee secure user monitoring, a few methods have been proposed by providers of online applications and monitoring services. Some third-party advertising companies have voluntarily begun to insert an ‘Adchoices’ icon into their ads to increase user awareness of online tracking. However, it has been found that the icon was not very effective at making users aware of tracking occurrences [21]. As a middleware approach, Privad [22][23] is proposed to conceal a user’s activities from an advertising network by interposing an anonymizing proxy between the browser and the ad network. However, the adoption of a proxy-based middleware may not be a feasible solution to small-size e-health applications because of its huge overhead requirements. In addition, it is useless if an e-health application requires identifiable user data to analyze performance of applications at the individual level.
B. User-side privacy protection for online monitoring
1) Browser-based approaches: To protect user privacy in user side, browser-based approaches have been proposed. Adnostic [24], a browser extension, is capable of behavioral profiling and targeting in users’ browsers to select effective ads while not sending user data to third-party ad companies. RePriv [25] enables browsers to conduct user interest
mining and only share the resulting encapsulated interests with third-parties. Both Adnostic and RePriv have only focused on targeted advertising and/or personalization but have not considered online monitoring services. As a simple solution to indiscriminate online monitoring, using opt-out cookies and/or a blocked-application list have been recommended. Opt-out cookies are, however, fragile because they can be easily disabled or deleted by a third party [26][27]. Setting a block list in a browser can effectively block malicious applications but currently this approach blocks any listed application in its entirety and does not support fine-grained blocking at the data level.
2) Policy-based approaches: As a policy-based protection approach, Privacy Bird [28] has been proposed. It is a P3P user agent that reads P3P policies of online applications and lets users know whether the application policies and user preferences are matched. If policies are not matched, a bird icon turns red. A user can get information by clicking on a red bird icon. However, Privacy Bird is only able to check the acceptability of application’s P3P policies, so users cannot check all user data monitored at the application’s data level.
VII. CONCLUSION AND FUTURE WORK
The lack of reliable and effective methods of privacy protection has been the biggest obstacle to the growth of e-Health applications. Without a suitable solution, people keep hesitating to use e-Health applications, even though those applications help users access healthcare services in easy and convenient way at the reduced cost. To address the privacy protection issue above, in this paper, we proposed the PPoMframework that protects user privacy in both the application side and the user side so that secure online monitoring can be guaranteed in the entire process of online monitoring. We believe that PPoM accelerates practical use of e-health applications. Towards this goal, a few challenges need to be pursued in the future:
· Development of the privacy policies to specify preferences on healthcare data in fine-grained level.
· Development of a privacy-preserving monitoring service that protects user privacy based on user policies.
· Development of the PPoM browser and tools. · Performance tests on the other individual
components and an integrated component and a field test associated with actual clinical trials.
· Development of a threat model for PPoM and security test using a threat model.
REFERENCES
[1] J. R. Mayer and J. C. Mitchell, “Third-Party Web Tracking: Policy and Technology,” Proc. IEEE Symp. on Security and Privacy (SP '12), IEEE Press, 2012, pp. 413-427, 2012, doi=10.1109/SP.
[2] B. A. Schroeder, “On-line monitoring: A tutorial,” IEEE Computer, vol. 28, no. 6, pp. 72-78, 1995.
23Copyright (c) IARIA, 2015. ISBN: 978-1-61208-424-4
GLOBAL HEALTH 2015 : The Fourth International Conference on Global Health Challenges
35 / 101

[3] N. Schmucker, “Web Tracking,” SNET2 Seminar Paper (Online),2011. http://www.snet.tu-berlin.de/fileadmin/fg220/courses/SS11/snet -project/web-tracking_schmuecker.pdf [retrieved: June, 2015].
[4] Google Analytics. http://www.google.com/analytics/index.html[retrieved: June, 2015].
[5] Adobe Analytics. http://www.adobe.com/sea/solutions/digital-analytics.html [retrieved: June, 2015].
[6] M. N. K. Boulos et al., “CAALYX: a new generation of location-based services in healthcare,” Int. J. Health. Geogr., vol. 6, no. 1,March 2007, pp. 1-6, doi:10.1186/1476-072X-6-9.
[7] C. Hoelscher and H. Dietrich, “E-Commerce Personalization and Real-Time Site Monitoring,” in Designing personalized user experiences in eCommerce, Kluwer Academic Publishers, 2004, pp. 95-117.
[8] C. L. Borgman, S. G. Hirsh, and J. Hiller, “Rethinking online monitoring methods for information retrieval systems: from search product to search process,” J. Assoc. Inf. Sci. Technol., vol. 47, no. 7, pp. 568-583, July 1996.
[9] G. Eysenbach, “What is e-health?,” J. Med. Internet. Res., vol.3, no.2, 2001.
[10] J. M. Bernhardt and J. Hubley, “Health education and the Internet: the beginning of a revolution,” Health. Educ. Res., vol. 16, no. 6, pp. 643-645, 2001.
[11] E. M. Daley, R. J. McDermott, K. R. B. McCormack, and M. J. Kittleson, “Conducting web-based survey research: a lesson in internet designs,” Am. J. Health. Behav., vol. 27, no. 2, pp. 116-24, Mar-Apr 2003.
[12] D. F. Duncan, J. B. White, and T. Nicholson, “Using Internet-based Surveys to Reach Hidden Populations: Case of Nonabusive Illicit Drug Users,” Am. J. Health. Behav., vol. 27, issue 3, pp. 208-218, May-Jun 2003.
[13] K. E. Evers, “eHealth promotion: the use of the Internet for health promotion,” Am. J. Health. Behav., vol. 20, issue 4, pp. 1-7, Mar-Apr 2006.
[14] M. Bilenko and M. Richardson, “Predictive client-side profiles for personalized advertising,” Proc. ACM SIGKDD conf. on Knowledge discovery and data mining (KDD '11), ACM New York, 2011, pp. 413-421.
[15] A. McDonald and L. F. Cranor, “Beliefs and Behaviors: Internet Users' Understanding of Behavioral Advertising,” TPRC 2010 Social Science Research Network (SSRN), August 16, 2010, pp. 1-31, http://ssrn.com/abstract=1989092.
[16] Wikipedia, “The Honor System,” http://en.wikipedia.org/wiki/Honor _system [retrieved: June, 2015].
[17] U.S. Department of Health and Human Services Office for Civil Rights, “HIPAA Administrative Simplification Regulation Text, 45 CFR Parts 160, 162, and 164 amended through March 26,” 2013, pp. 1-115, http://www.hhs.gov/ocr/privacy/hipaa/administrative/privacyrule/adminsimpregtext.pdf.
[18] P. Ohm, “Broken Promises of Privacy: Responding to the Surprising Failure of Anonymization,” UCLA Law Review, vol. 57, pp. 1701-2010, August 2009.
[19] P3P 1.1. http://www.w3.org/TR/P3P11/ [retrieved: June, 2015].
[20] WS-XACML 1.0. http://xml.coverpages.org/Anderson-WS-XACML v10.pdf [retrieved: June, 2015].
[21] M. Hastak and M. J. Culnan, “Online Behavioral Advertising “Icon” Study,” Future of Privacy Forum (online), 2010, http://www.futureofprivacy.org/2010/02/15/online-behavioral-advertising-icon-study [retrieved: June, 2015].
[22] S. Guha, B. Cheng, and P. Francis, “Privad: practical privacy in online advertising,” Proc. USENIX conf. on Networked systems design and implementation (NSDI'11), USA, 2011, pp. 169-182.
[23] A. Reznichenko, S. Guha, and P. Francis, “Auctions in do-not-track compliant internet advertising,” Proc. ACM conf. on Computer and communications security (CCS '11), New York, 2011, pp. 667-676, doi=10.1145/2046707.2046782.
[24] V. Toubiana, H. Nissenbaum, A. Narayanan, S. Barocas, and D. Boneh, “Adnostic: Privacy Preserving Targeted Advertising,” Proc. Symp. on Network and Distributed System Security, March 2010, pp. 1-21.
[25] M. Fredrikson and B. Livshits, “REPRIV: Re-Envisioning In-Browser Privacy,” Proc. IEEE Symp. on Security and Privacy, May 2011, pp. 1-15.
[26] P. Leon et al., “Why Johnny can't opt out: a usability evaluation of tools to limit online behavioral advertising,” Proc. ACM Conf. on Human Factors in Computing Systems (CHI '12), USA, 2012, pp. 589-598, doi=10.1145/2207676.2207759.
[27] M. Ayenson, D. J. Wambach, A. Soltani, N. Good, and C. J. Hoofnagle, “Flash cookies and privacy II: Now with HTML5 and etag respawning,” Social Science Research Network, July 2011, http://dx.doi.org/10.2139/ssrn.1898390.
[28] Privacy Bird, http://www.privacybird.org [retrieved: June, 2015].
24Copyright (c) IARIA, 2015. ISBN: 978-1-61208-424-4
GLOBAL HEALTH 2015 : The Fourth International Conference on Global Health Challenges
36 / 101

Systematic Review of Obesogenic Environmental Determinants of Diet and the Implications of Obesity Prevention and Intervention Efforts
Angela Chang/University of Macau Department of Communication
Macau, China, SAR Lugano University
Institute of Communication and Health Lugano, Switzerland
e-mail: [email protected]
Matthew T. Liu/University of Macau Department of Management and Marketing,
Macau, China, SAR e-mail: [email protected]
Peter J. Schulz/Lugano University Institute of Communication and Health
Lugano, Switzerland e-mail: [email protected]
Abstract— The environment plays a crucial role in the development of obesity. Obesity rates continue to escalate, bringing into question the efficacy of prevention, intervention, and treatment efforts. This paper identifies the previous research examining obesogenic environmental factors and sets out to determine whether physical, social, cultural, and economic environmental factors are associated with obesogenic dietary behaviors. The study searched five databases for full-text English articles, of which 103 were included in the literature review. The selection was based on keywords searching, peer-reviewed publications, stated research methodology, strategic analysis, and substantial increments in knowledge. One of the results showed an increasing pace of urbanization, media influence, and advertising emphasis on unhealthy food are associated with obesogenic dietary behavior. The discussion focuses on the most susceptible factors for obesity and the implications for future research in communities with a dense population. The objective of addressing the obesity epidemic is to employ strategies to curtail sugar use, restrict marketing efforts of unhealthy food, and increase the availability of healthy food.
Keywords-obesogenic; food environment; advertising; diet study; prevention
I. INTRODUCTION
Research has shown increasing attention on how the environment affects population health [1] [2]. Considerable studies have evidenced that population obesity was a product of the environment 30 years ago, and environmental changes are associated with epidemic obesity rates in all age groups [3] [4]. The influence of environmental stimuli on obesity prevalence must be affected to some extent by people’s dietary and physical activity behavior, which ultimately leads to an imbalance in energy intake and thus to obesity [5] [6].
The obesogenic environment is defined as an environment that influences or promotes obesity in individuals or populations, which constitutes all surroundings, opportunities, or life conditions that lead to obesity [7]. The problem of the dramatic increase in obesity is complex, and may involve factors related to socioeconomic status, personal preferences, family habits, physical factors, and perhaps genetics. The theoretical framework from the consumer socialization perspective suggests that factors influencing food choice operate at four
distinct levels: individual (psychological, biological, and behavioral factors), interpersonal (family, friends, and peer networks), community (accessibility, school policy, and local facilities), and societal (mass media, advertising, social and cultural norms, production and distribution systems, and pricing policies) [9] [30] [39].
Prior reviews of the obesogenic environment literature indicated that modern sedentary activities promote the overconsumption of food, thus causing weight gain [11] [22]. However, empirical study remains lacking in terms of an appropriately designed research investigating associations of environmental factors with individuals’ attitudes, genetics, and societal development. Insight probably can be gained by improving theory and methods of research [8] [29]. This study focuses on the measurement and evaluation of the obesogenic environment. Obesogenic food environments are considered to facilitate high energy intake by increasing access to stores that promote unhealthy food choices. In Section 2, three research questions are discussed and systematic review method is adopted to identify the previous research in the literature in relation to obesity and the food environment.
II. QUESTIONS AND METHODS
RQ.1 What is the previous research focus on the measurement and evaluation of the obesogenic environment?
RQ2. What risk factors, such as the physical, social, cultural, and economic environment, are associated with obesogenic dietary behaviors?
RQ3. How to use obesity prevention and intervention to decrease obesity?
Systematic review is a method often used to investigate a broad set of literature related to environments linked to obesity study [20] [21] [24]. The coding category was adopted from previous studies and included the publication year, author(s), affiliated organization, country, study design, main environmental determinants, scale of the geographical study, postulated relationship of specific risk factors (i.e., physical, social, cultural, and economic environment; individual, interpersonal, population, and global level), and analysis between the environment and weight status [22] [32]. The inclusion criteria and procedure are discussed in the followings section.
25Copyright (c) IARIA, 2015. ISBN: 978-1-61208-424-4
GLOBAL HEALTH 2015 : The Fourth International Conference on Global Health Challenges
37 / 101

Inclusion criteria A comprehensive scholarly and multi-disciplinary full
text databases including Academic Search Complete [51], Health Reference Center [52], Medline [6] [24], Springer Link[53], and Proquest Medical Library [22] [32] were searched for studies published from 2004 onward in full-text English articles. This study included only peer-reviewed articles that present advances in assessment methods, analytical result, up-to-date research studies or substantial increments in knowledge examining obesogenic environmental factors and evidence. A systematic study was recommended to assess at least one environmental factor. The search terms such as “diet study” and either “obesogenic,” “intervention,” “prevention,” “obesity,” “food marketing,” “food advertising,” or “mass communication campaign” were included. The researchers screened 3,139 de-duplicated records, of which 103 met the inclusion and exclusion criteria. Inter-rater percentage agreement between reviewers and Cohen’s kappa coefficients were calculated: Academic Search Complete, 90% and 0.213; Health Reference Center, 92% and 0.392; Medline, 95% and 0.421; Springer Link, 89% and 0.316; and Proquest Medical Library, 91% and 0.396, respectively. All disagreement in coding was discussed and consensus was reached by the coders and authors. In Section 3, the research findings are reported by answering the three research questions.
III. RESEARCH FINDINGS
A total of 99 journal articles and 4 book chapters were included in this study. The distribution of the publication year for the obesogenic environmental studies has been increased steady. Two articles were published in the year of 2004 and 20 publications were found in 2014. The publication of obesogenic environmental studies has increased and the prolific years were 2014 (n = 20, 19%), followed by the years of 2010 (n = 14, 14%), 2013 (n = 12, 12%), and 2006 (n = 12, 12%).
Examining the authors’ nationality of affiliated organization indicates the diversity of journal contributors. Authors’ affiliated organization from European countries were the main source of evidence (n = 58, 52%), followed by America (n = 33, 29%), Oceania (n = 10, 9%), and Asia (n = 8, 7%). Specifically, the nationalities of the authors’ affiliated organization were mostly American (n = 29, 26%), followed by British (n = 20, 18%) and Finnish, Norwegian, Swedish, and Australian with the same number of papers published (n = 8, 6%).
Table 1 illustrates the research methods used for the previous research published related to obesogenic environment determinants of diet. The most frequently used survey method was experiment (n = 36, 35%), followed by questionnaire (n = 19, 18%), review (systematic and scoping, n = 19, 19%), and mixed qualitative and quantitative method (n = 12, 12%). The previous 19 review studies only recruited publications with human as the subject of research. However, in this study, the result found 15 studies adopted mice or white swine for experiment to examine and improve the potential interactive effects of diet, exercise, and genetic
background. These studies suggest that physiological reactions may not merely increase in response to obesity but may also have a direct causal role in obesity and biological resistance. Another four research methods such as content analysis, interview, observation, and focus group were used with a relatively low percentage in obesogenic environment study. We also discovered that a large proportion of articles omitted crucial information on their methodology (n = 13, 13%), population description (n = 14, 14%), and sample size (n = 31, 30%).
TABLE 1 RESEARCH METHOD USED FOR THE 103 STUDIES RELATED TO OBESOGENIC ENVIRONMENT DETERMINANTS OF DIET
Method Frequency Percentage
experiment 36 35%
Questionnaire 19 18%
systematic review 10 10%
scoping review 9 9%
mixed method 12 12%
content analysis 2 2%
Observation 1 1%
Interview 1 1%
focus group 0 0%
Unclear 13 13%
Subtotal 103 100% Table 2 presents a summary of 14 selected studies with
advances in assessment methods that specifies risk factors, such as physical, social, cultural, and economic environment, associated with obesogenic dietary behaviors. The most susceptible factors for obesity according to obesogenic studies confirm the importance of the societal development of urbanization, media influence, and marketing activities (n = 11, 38%), followed by specific cultural food diet (n = 9, 31%), physical activity and habit (n = 7, 24%), and product-related factors (n = 2, 7%). The effects of eating habits and preferences have been investigated at several levels with substantial increments in knowledge by five studies listed in Table 2 [13] [15] [17] [18] [44].
Table 3 summarizes the solutions to increasing obesity proposed by eight studies. The method of diet intervention and policy restriction for television advertising is shown. Intervention (n = 6, 75%) and prevention (n = 2, 25%) efforts such as diet and physical activity are indicated while regulation of food industry and treatment of obese population lacks equal research attention. In Section 4, the discussion was extracted from the included studies emphasizing the food environment, marketing efforts, and prevention and intervention efforts from communication and marketing perspectives regarding an unhealthy food environment.
26Copyright (c) IARIA, 2015. ISBN: 978-1-61208-424-4
GLOBAL HEALTH 2015 : The Fourth International Conference on Global Health Challenges
38 / 101

TABLE 2 SUMMARY OF EXISTING STUDIES SPECIFYING RISK FACTOS OF PHYSICAL, SOCIAL, CULTURAL, AND ECONOMIC ENVIRONMENT
Author (Year) Objective/Aim Population description
Sample description
Conclusion related to risk factors
1 Murphy, M. & Mercer, J. G. (2013) [44]
The aim of this review is to bring together existing knowledge of how food components affect anxiety at various stages of development, while highlighting some major gaps in our current understanding.
n/a n/a Assembled from study of preclinical models of diet challenge from gestation to adult life, supports the role of dieting as an important connection between psychology, physiology, and behaviour. Analogous processes in the human population in our current obesogenic environment are likely to contribute to individual and societal challenges in this area.
2 Hoek, J. & Gendall, P. (2006) [25]
To examine an alternative means of framing the debate and explore the role advertising plays in reinforcing behavior patterns.
n/a n/a In addressing obesity, policymakers have directed their efforts primarily at creating more informed individuals, without first having created a regulatory environment that will support social marketing and education programs.
3 Jääskeläinen A. et al. (2014) [5]
To study prevalence of stress-related eating and its association with overweight, obesity, abdominal obesity, dietary and other health behaviors at the age of 16.
n/a 3,598 girls and 3,347 boys
Stress-related eating is highly prevalent among 16-year-old girls and is associated with obesity as well as adverse dietary and other health behaviors among both genders, but intrauterine conditions are seemingly uninvolved.
4 Feng, J., et al. (2010) [20]
The aim is to give an overview of the wider environmental determinants of diet such as the national food supply, food availability and accessibility in different settings and economic food environment in relation to socio-economic status.
n/a 87 papers There was very little similarity in methods and approaches which prevented estimation of pooled effects. The great heterogeneity across studies limits what can be learned from this body of evidence.
5 Firk, S. F. L., Penney, T. L., & McHugh, T. L. F. (2009) [21]
This presents a major challenge towards our understanding of environmental research for obesity, and the development of a desperately needed contextualized evidence base to support action and policies for curbing this epidemic.
n/a 146 primary studies
Gaps in the literature were clearly identified at the level of the macro-environment, and the political and economic micro-environments, highlighting key areas where further research is warranted if we are to more fully understand the role of the obesogenic environment.
6 Giskes, K., et al. (2011) [22]
This study examined whether physical, social, cultural and economic environmental factors are associated with obesogenic dietary behaviors and overweight/obesity among adults.
n/a 28 papers Associations between the environment and weight status are more consistent than that seen between the environment and dietary behaviour. The environment may play an important role in the development of overweight/obesity, however the dietary mechanisms that contribute to this remain unclear and the physical activity environment may also play an important role in weight gain and obesity.
7 Adair, L. S. & Popkin, B. M. (2005) [18]
To examine the extent to which child dietary patterns and trends are changing globally.
Nationally or regionally representative data from 4 countries
25,247 Participants from USA, 4,253 from Philippines, 4,758 from Russia, and 7,417 from China
This research suggests that globalization of the fast food and nutrition transition. However, the contribution of fast food and soft drinks to the diet of children remains relatively small in China, Russia, and Philippines. Other modern food sectors are beginning to affect child eating patterns in several countries undergoing.
8 Ambler, T. (2006) [37]
This paper reviews previous research on the extent and nature of food promotion to children and the effect and promotion has on children’s food knowledge, preferences and behaviour. It intends to ascertain reliability that appear to have been drawn by the UK Food Standards Agency for national policy making.
n/a Hasting’s study
The paper's first conclusion is that considering the effect of branded food and drink promotions outside their socio-economic and cultural context is unreliable. Second, while there are promotional effects at the brand level, these do not extend to product category level, still less overall diet, where the evidence is thin at best.
27Copyright (c) IARIA, 2015. ISBN: 978-1-61208-424-4
GLOBAL HEALTH 2015 : The Fourth International Conference on Global Health Challenges
39 / 101

9 Chang, A. (2013) [15]
This study conducted a comparative analysis of the media and food environment in China to determine a method to combat childhood obesity.
n/a 46 brands with 489 television commercials
Preschool children can demonstrate an understanding of cultural dietary rules. Young children, even at three years of age, can recognize and implement cultural rules regarding appropriate food choices for meals. Although children of all ages are affected by advertising, those between seven and eleven years of age are most likely to be targeted and persuaded by advertising.
10 Chandon, P. & Wansink, B. (2012) [13]
The review begins with an examination of the multiple ways in which 1) food pricing strategies and 2) marketing communication (including branding and food claims) bias food consumption. It then describes the effects of newer and less conspicuous marketing actions, focusing on 3) packaging (including the effects of package design and package-based claims) and 4) the eating environment (including the availability, salience, and convenience of food).
n/a Updating two existing reviews
To summarize how food marketing has made us fat, it is most likely through increased access to continuously cheaper, bigger, and tastier calorie-dense food. Throughout, this review underscores the promising opportunities that food manufacturers and retailers have to make profitable “win-win” adjustments to help consumers eat better.
11 Drewnowski, A., et al. (2014) [15]
To compare the associations between food environment at the individual level, socioeconomic status (SES) and obesity rates in two cities: Seattle and Paris.
n/a 7,290 participants
Lower SES was linked to higher obesity risk in both Paris and Seattle, despite differences in urban form, the food environments and in the respective systems of health care. Cross-country comparisons can provide new insights into the social determinants of weight and health.
12 Edwards, J., Engstrom, K. & Hartwell, J. H. (2005) [17]
The purpose of this paper is to consider the facts from a food service perspective, the role and relevance of portion size, product bundling and all you can eat buffets in the current debate on overweight and obesity.
n/a n/a The causes of overweight and obesity are multifactorial, complex and in many areas not particularly well researched. In many instances it seems almost as if the consumer and food service operator, through the media and government, are blaming each other for the current situation, and then expecting the other to somehow find a solution.
13 McMullan, J. & Keeney, S. (2014)
This article reviews the previously published literature on the social and environmental factors which influence children (aged 3–5 years) to be obese/overweight and the accuracy of parental perceptions.
Studies published between 1995-2013 on childhood obesity and environment, and socioeconomic status.
n/a Obesity levels are on the increase in today’s society and habits are being passed from parents to children, with family lifestyle choices often influencing this health condition. The results confirm the available research does not allow robust identification of ways in which that physical environment influences adult weight status.
14 Goris, J. M. et al., (2009) [23]
To estimate the contribution of television (TV) food advertising to the prevalence of obesity among 6–11-year-old children in Australia, Great Britain (England and Scotland only), Italy, The Netherlands, Sweden and the United States.
Data of 6-11-year-old children in six Western countries.
n/a The contribution of TV advertising of foods and drinks to the prevalence of childhood obesity differs distinctly by country.
28Copyright (c) IARIA, 2015. ISBN: 978-1-61208-424-4
GLOBAL HEALTH 2015 : The Fourth International Conference on Global Health Challenges
40 / 101

TABLE 3 SUMMARY OF STUDIES IN PROVIDING SOLUTIONS TO INCREASING OBESITY THROUGH PREVENTION AND INTERVENTION
Author (Year) Objective/Aim Population description
Sample Size (n=)
Conclusion of prevention and/or treatment
1 Maynard, M., et al. (2009)
This exploratory study assesses the feasibility, efficacy and cultural acceptability of child- and family-based interventions to reduce risk factors for childhood and adolescent obesity among ethnic minorities.
n/a 44 children The emergent findings suggest that while the school setting may be better for the main implementation of healthy lifestyle interventions, places of worship provide valuable opportunities for family and culturally specific support for implementation.
2 Brown, T. & Summerbell, C. (2009)
To determine the effectiveness of school-based interventions that focus on changing dietary intake and physical activity levels to prevent childhood obesity.
n/a 38 studies The finding suggests to combine diet and physical activity school-based interventions to help prevent children becoming overweight in the long term.
3 Hammarstrm, A. et al. (2014)
The aim of this study is to explore barriers and facilitators to weight-loss experienced by participants in a diet intervention for middle-aged to older women in the general population in Northern Sweden.
Middle-aged to older women to a weight-lose program
24 women It is important to include drop-outs from diet interventions in order to fully understand barriers to weight-loss. A gender-relational approach can bring new insights into understanding experiences of barriers to weight-loss.
4 Garcia-Calzon, S. A. et al. (2014) [48]
The aim of this study is to assess the relationship between telomere length (TL) and changes in adiposity indices after a 5-year nutritional intervention.
Women (60–80 years) & men (55–80 years) with no previously history of cardiovascular disease, but at high cardiovascular risk
521 participants
The research suggests that TL is inversely associated with changes in obesity parameters. The assessment of TL can provide further insights for biological pathways leading to adiposity.
5 Doyle-Baker, P. K. et al. (2011)
The biochemical evaluation of a health intervention program investigates the impact of progressive exercise intensity in overweight and obese children.
Overweight and obese male (M) and female (F) children (aged 5-10) in Canada
25 children
The high-intensity exercise within a comprehensive health program includes nutrition education improves the lipid and physiological health profiles of obese children.
6 Zambrano E., Mart´ınez-Samayoa1, P. M., Rodr´ıguez-Gonz´alez1, G. L., & Nathanielsz, P.W. (2010)
This paper discusses whether maternal obesity-induced programming outcomes are reversible by altered dietary intake commencing before conception.
female rats n/a Obesity involving women of reproductive years is increasing dramatically in both developing and developed nations. This study shows reversibility of adverse metabolic effects of maternal obesity on offspring metabolic phenotype.
7 Birch L. L. & Anzman, B. L. (2010) [3]
The article provides examples of learning paradigms— familiarization and associative and observational learning—that present opportunities for parents and caregivers to restructure children’s environments in early life, increasing the likelihood of healthy weight-status outcomes in the context of the current obesogenic environment.
n/a n/a This study uses a developmental perspective and argues that this probabilistic outcome is not predetermined. Effective early preventive interventions are urgently needed to address the obesity epidemic among all segments of the population, but especially among groups at highest risk of childhood obesity.
8 Edmond, S.(2006) [164]
To ensure that the public policy objectives are met without unnecessarily and unjustifiably damaging the broadcast and advertising industries.
n/a n/a Government’s report on obesity is important in leading healthier and more active lifestyles. The advertising industry wants to work in partnership with the government, and other stakeholders, to ensure that it gets the balance right between consumer concerns and business needs.
29Copyright (c) IARIA, 2015. ISBN: 978-1-61208-424-4
GLOBAL HEALTH 2015 : The Fourth International Conference on Global Health Challenges
41 / 101

IV. DISCUSSION
With an estimated 2.1 billion people overweight globally, tackling obesity is one of the most serious challenges, requiring a societal and systems change in our approach to food, lifestyle, and the environments [41].
A. Food Environments British researchers concluded that food retail access in
urban areas does not have a profound or prolonged effect on dietary patterns [19]. However, for the Chinese community, vending machines, mini grocery shops, convenience stores, and supermarkets were all found to sell large quantities of sweetened beverages, snacks, or high-calorie, high-fat, and low-nutrient food [28] [38]. This food supply led to the association of unhealthy food products and obesity. The patterns of food product types lacked the elements of delivering essential food groups and correct dietary information [34]. The literature tends to indicate that consumers in all age groups are likely offered and encouraged to choose a diet with super-saturated fat and excessive salt. In addition, the research showed the importance of urban–rural differences and the contribution of fast food and soft drinks in children’s diets [12] [18]. Although snacks and drinks remained relatively insignificant in the total diet of most people, the researchers emphasized that the globalization of the fast food and other local or modern food sectors is affecting our eating patterns and exposes us to the threat of nutrition transition towards higher-fat diets in all regions of the world [34] [38].
B. Marketing Efforts toward Obesity Several studies examined the array of food products
available on television and concluded that fast food restaurants, sweetened soft drinks, and sweetened cereals consistently dominate television food advertising. The identified patterns of food product types are commonly associated with unhealthy diets [42] [43]. For example, the exposure of sampled youth to 100 TV ads for sugar-sweetened soft drinks was associated with a 9.4% increase in their consumption of soft drinks [10]. Thus, advertising has been accused to be a catalyst in problems of obesity for some age groups and in some countries [15] [23] [37]. For marketing efforts related to obesity research, sufficient studies have shown an association between promotional activity and children’s food knowledge, preferences, and their choices of daily snacks at playtime [13] [16] [25] [26] [33] [36] [40]. These studies have supported the notion that children’s age is a critical factor in the influence of advertising, especially in regard to nutrient imbalance diets.
C. Preventions and Interventions in Increasing Obesity The intake of fruit, 100% juice, and vegetable and regular
physical activity are advised to be healthy behaviors related to obesity prevention at the individual level [31]. The emphasis of parental control may be another possible
solution. The portrayal of family togetherness and parents’ role is effective for promoting a healthy eating environment, and also helps in regulating children from over-engaging in sedentary activities. For example, a survey [28] indicated that Chinese parental influence, especially the father’s role modelling, is significantly related to attraction toward physical activity in overweight children. For boys, both the father’s and mother’s influence is strong. Parenting style such as role modelling and encouragement can positively influence an overweight child’s physical activity involvement.
Furthermore, modifying the larger context and the microenvironment associated with health education for knowledge of nutrient dense diets is crucial. It is argued that school environments should provide access to healthy food and help reduce exposure to cues that encourage overeating or underactivity [15] [33]. At the community level, the solution to increasing obesity by employing interactive and mass media campaigns to change health behavior for health promotion is proven to be effective [24]. The goals of public awareness campaigns are to increase the awareness of the obesogenic environment, improve access to a healthy diet, and tackle obesity problems. In Section 5, the limitation and suggestions for future research are included in the conclusion.
V. CONCLUSION
This review provides a systematic and objective process for collecting knowledge applied to diet-related behavior in an obesogenic environment. The reviews of 203 previous studies showed that few investigations of environmental associations have been replicated, and that most studies used weak research designs and non-validated self-report measures.
Medical studies have found that certain people have an increased risk for obesity, for example, minority ethnic children [45], 16-year-old girls with stress-related eating [5], truck drivers with insufficient sleep and older than 40 years [46], adults at least 22 years old with abnormal blood pressure [47], women (60–80 years old) or men (55–80 years old) at high cardiovascular risk but without previously documented history of cardiovascular disease [48], and infants associated with maternal obesity [49].
The present paper contributes to elucidating the role of obesogenic environmental factors by proposing a possible pathway linking obesogenic environmental determinants of diet and obesity prevention and treatment. Potential relevant factors such as political policy and regulation [50] and mental status to diet [44] have also been evaluated because of the complexity of the task. The objective of addressing the obesity epidemic was to employ strategies to curtail sugar use, restrict marketing efforts, and increase the availability of healthy food.
As the number of published obesogenic research grows, we hope to see direct effects on health and wellbeing and
30Copyright (c) IARIA, 2015. ISBN: 978-1-61208-424-4
GLOBAL HEALTH 2015 : The Fourth International Conference on Global Health Challenges
42 / 101

indirect benefits from increased support from related research. There are no large pediatric randomized trials and very few published papers in treatment of obesity. One of the limitations in this study was the publication bias in the sampled database. There was substantial heterogeneity among studies with respect to study samples, interventions, and outcomes. There is a need to develop refined tools and indicators to monitor environmental changes on the basis of the amount of data available in the scientific literature and the potential for intervention.
There is an improvement in the following area. First, the research focus on the measurement and evaluation of the obesogenic environment has been led by Western countries. Further study in the rest of the world with highly dense populations should be conducted for comparison in the global obesogenic environment.
Second, the solutions for ensuring individuals’ responsibility in achieving and maintaining a healthy weight from early life throughout their school years and into adulthood remain unclear. The relatively weak empirical evidence implies the absence of causal relationships between environmental factors and individuals’ diet. A longitudinal approach would provide more robust evidence concerning the links among media use, diet behavior, and obesity prevention and treatment.
Third, a lack of appropriate research design exists in the previous studies, which may have reduced the validity of the results. Abundant previous review studies have used indirect methods to assess the environment and excluded nonhuman subjects from their analyses [20]. Future studies should adopt a rigorous methodological design to assist in providing strong evidence for the complex association of obesogenic environmental determinants of diet.
To determine the casual relations between food intake and the obesogenic environment, the influence of interactive, social, mass, or community-based media should be examined. Raising public awareness of obesogenic environmental determinants of unhealthy diet is a costly and complex endeavor. As public awareness campaigns become increasingly sophisticated, additional studies would help to evaluate the success of campaigns, tracking changes in attitudes and behaviors of people with obesity.
ACKNOWLEDGMENT
This research was supported by grant from the University of Macau MYRG2015-0060-FSS & MYRG2015-00123-FSS.
REFERENCES [1] K. Edwards, “Defining and mapping obesogenic environment for
children,” In A. A. Lake, T. G. Townshend and Alvanides, S (Eds.), Obesogenic environment: Complexities, perceptions, and objective measures, Iowa, Wiley-Blackwell Publication, 2010, pp.63-80.
[2] A. A. Rooney, A. L. Boyles, M. S. Wolfe, J. R. Bucher, and K. A. Thayer, “Systematic review and evidence integration for literature-based environmental health science assessments,” Environmental Health Perspectives, vol.122, no.7, 2014, pp.711-718.
[3] L. L. Birch and S. L. Anzman, “Leaning to eat in an obesogenic environment: A developmental systems perspective on childhood obesity.” Society for Research in Child Development vol.4, no.2, 2010, pp. 138-143.
[4] K. Ball, D. Crawford, A. Timperio, and J. Samon, “Eating behaviors and the food environment. In Lake,” A. A., Townshend, T. G. & Alvanides, S (Eds.), Obesogenic environment: Complexities, perceptions, and objective measures, Iowa, Wiley-Blackwell Publication, 2010, pp. 149-164.
[5] A. Jääskeläinen, et al., “Stress-related eating, obesity and associated behavioural traits in adolescents: a prospective population-based cohort study,” BMC Public Health, vol.14, no.321, 2014, pp. 1471-2458.
[6] J. McMullan and S. Keeney, “A review of the literature on the social and environmental factors which influence children (aged 3-5 years) to be obese/overweight and the accuracy of parental perceptions,” Health Education Journal, vol.73, no.2, 2014, pp.159-165.
[7] B. Swinburn, G. Eggar and F. Raza, “Dissecting obesogenic environments: the development and application of a framework for identifying and prioritizing environmental interventions for obesity,” American Journal of Preventive Medicine, vol.29, 1999, pp.563-570.
[8] J. Brug, F. J. van Lenthe, and S. P. J. Kremers, “Revisiting Kurt Lewin. How to Gain Insight into environmental correlatesof obesogenic behaviors,” American Journal of Preventive Medicine, vol.31, no.6, 2006, pp.525-529.
[9] A. Drewnowski, et al., “Food environment and socioeconomic status influence obesity rates in Seattle and in Paris,” International Journal of Obesity, vol.38, no.2, 2014, pp.306-314, doi:10.1038/ijo.2013.97.
[10] T. Andreyeva, I. R. Kelly, and J. Harris, “Exposure to food advertising on television: Associations with children’s fast food and soft drink consumption and obesity,” Economics and Human Biology, vol. 9, 2011, pp. 221-233.
[11] J. P. Chaput, L. Klingenberg, A. Astrup and A. M. Sjodin, “Modern sedentary activities promote overconsumption of food in our current obesogenic environment,” Obesity reviews, vol.12, 2011, pp.12-20.
[12] K. Chan, “Chinese children’s perceptions of advertising and brands: An urban rural comparison,” Journal of Consumer Marketing, vol.25, no.2, 2008, pp.74-84.
[13] P. Chandon and B. Wansink, “Does food marketing need to make us fat? A review and solutions,” Nutrition Reviews, vol.70, no.10, 2012, pp.571-593.
[14] P. B. Crawford, “The role of public policy in addressing the pediatric obesity Epidemic,” Handbook of Childhood and Adolescent Obesity, Elissa Jelalian and Rick G. Steele (eds.), New York, NY: Springer, 2008, pp.371-386.
[15] A. Chang, “Advertising and Childhood Obesity in China,” In C. Okigbo (Ed.), Strategic Urban Health Communication, New York: Springer, 2014, pp.211-219.
[16] S. Edmond, “Advertising to children: A changing media landscape,” Young Consumers, vol.3, 2006, pp.8–12.
[17] J. Edwards, K. Engstrom and J. H. Hartwell, “Overweight, obesity and the food service industry,” Food Service Technology, vol.5, 2005, pp.85–94.
[18] L. Adair and B. M. Popkin, “Are children’s eating patterns being transformed globally?” Public Health and Public Policy, vol.13, no.7, 2005, pp. 1281–1299.
[19] L. S. Elinder and M. Jansson, “Obesogenic environments-aspects on measurement and indicators,” Public Health Nutrition, vol.12, no.3, 2008, pp.307-315.
[20] J. Feng, et a., “The built environment and obesity: A systematic review of the epidemiologic evidence,” Health & Place, vol.16, no.2, 2010, pp.175-190, doi:10.1016/j.healthplace.2009.09.008.
[21] S. F. L. Firk, T. L. Penney and T. L. F. McHugh, “Characterizing the obesogenic environment: The state of the evidence with directions for future research,” Obesity review, vol.11, 2009, pp.109-117.
31Copyright (c) IARIA, 2015. ISBN: 978-1-61208-424-4
GLOBAL HEALTH 2015 : The Fourth International Conference on Global Health Challenges
43 / 101
[22] K. Giskes, F. van Lenth, M. Avendano-Pabon and J. Brug, “A systematic review of environmental factors and obesogenic dietary intakes among adults: Are we getting closer to understanding obesogenic environment?” Obesity Review, vol.12, 2011, pp.95-106.
[23] J. M. Goris, S. Petersen, E. Stamatakis and J. L. Veerman, “Television food advertising and the prevalence of childhood overweight and obesity: A multicountry comparison,” Public Health Nutrition, vol.13, no.7, 2009, pp.1003–1012.
[24] V. L. Hendry, E. Almiron-Roig, P. Monsivais, S. Jebb, S. E. G. Neelon, S. Griffin and D. Ogilvie, “Interventions to promote healthy eating: A systematic scoping review of regulatory approaches,” The Lancet, vol.45, 2013.
[25] J. Hoek and P. Gendall, “Advertising and obesity: a behavioral perspective,” Journal of Health Communication, vol.11, 2006, pp.409-423, doi: 10.1080/10810730600671888.
[26] I. Barlovic, “Obesity, advertising to kids, and social marketing,” Young Consumers, vol. 3, 2006, pp. 26–34. [27]D. Kunkel, “Predicting a renaissance for children and advertising research,” International Journal of Advertising, 2000, pp.401–405.
[28] P. W. C. Lau, A. Lee and L. Ransdell, “Parenting style and cultural influences on overweight children’s attraction to physical activity,” Obesity, vol.15, no.9, 2007, pp.2293-2302.
[29] L. A. Lytle, “Measuring the food environment state of the science,” American Journal of Preventive Medicine, vol.36, no.4, 2009, pp.134-144.
[30] S. Livingstone and E. J. Helsper, “Does advertising literacy mediate the effects of advertising on children? A critical examination of two linked research literatures in relation to obesity and food choice,” Journal of Communication, vol.56, 2006, pp.506–584.
[31] A. S. Lu, et al., “Interactive media for childhood obesity prevention,” Health Communication, vol.25, 2010, pp. 581-582, doi:10.108/10410236.2010.496827.
[32] J. D. Mackenbach, et al., “Obesogenic environments: a systematic review of the association between the physical environment and adult weight status, the SPOTLIGHT project,” BMC Public Health, vol.14, 2014, pp.233.
[33] E. Bridges and R. A. Briesch, “The ‘nag factor’ and children’s product categories,” International Journal of Advertising, vol.25, no.2, 2006, pp.157–187.
[34] Y. S. Moon, “How food ads communicate ‘health’ with children: A content analysis of Korean television commercials,” Asian Journal of Communication, vol.20, no.4, 2010, pp.456-476.
[35] T. A. Nicklas, E. T. Goh, L. S. Goodell, D. S. Acuff, R. Reiher, R. Buday and A. Ottenbacher, “Impact of commercials on food preferences of low-income, minority preschoolers,” Journal of Nutrition Education and Behavior, vol.43, no.1, 2011, pp.35–41.
[36] A. Pettersson and C. Fjellstrom, “Responsible marketing to children and their families.” Young Consumers, vol.3, 2006, pp.13–18.
[37] T. Ambler, “Does the UK promotion of food and drink to children contribute to their obesity?” International Journal of Advertising, vol.25, no. 2, 2006, pp. 137–156.
[38] A. Chang, “Promoting foods to overweight people? – an assessment of the advertising and availability of unhealthy food in China,” The International Journal of Communication and Health, vol.2, 2013, pp.49-57.
[39] M. A Wakefield, B. Loken and R. C. Hornik, “Use of mass media campaigns to change health behaviour,” The Lancet, vol.376, 2010, pp.1261–71.
[40] F. J. Zimmerman and S. V. Sandhya, “The effects of food advertising and cognitive load on food choices,” BMC Public Health, vol.14, no.342, 2014, pp.1471-2458.
[41] Editorial, “Managing the tide of childhood obesity,” The Lancet, Vol. 385, June 20, 2015, pp. 2434.
[42] R. Warren, et al., “Food and beverage advertising on US television: A comparison of child-targeted versus general audience commercials,” Journal of Broadcast Electron Media, vol.52, no.2, 2008, pp.231–246.
[43] D. Kunkel and W. Gantz, “Children’s television advertising in the multi-channel environment,” Journal of Communication, vol.42, no.3, 1992, pp.134-152.
[44] M. Murphy and J. G. Mercer, “Diet-regulated anxiety,” International Journal of Endocrinology, vol. 2013, 2013, pp.1-9.
[45] M. J. Maynard, B. Graham, E. Rawlings, A. Anderson, and S. Harding, “Developing obesity prevention interventions among minority ethnic children in schools and places of worship: The DEAL (DiEt and Active Living) study,” BMC Public Health, vol.9, no. 480, 22009, pp.11, doi:10.1186/1471-2458-9-480.
[46] C. R. C. Moreno, F. M. Louzada, L. R. Teixeira, F. Borges, and G. Lorenzi‐Filho, G., "Short sleep is associated with obesity among truck drivers,” Chronobiology International: The Journal of Biological & Medical Rhythm Research, vol23, no6., 2006, pp.1295-1303, doi:10.1080/07420520601089521.
[47] F. Hikmat and L. Appel., Effects of the DASH diet on blood pressure in patients with and without metabolic syndrome: results from the DASH trial,” Journal of Human Hypertension, vol, 28, 2014, pp.170-175.
[48] S. Garcia-Calzon, et al., “Longitudinal association of telomere length and obesity indices in an intervention study with a Mediterranean diet:the PREDIMED-NAVARRA trialet,” International Jounral of Obesity, vol. 38, 2014, pp.177-182, doi:10.1038/ijo.2013.68
[49] J. D. Galley, M. Bailey, D. C. K. Dush, S. Schoppe-Sullivan, L. M. Christian, “Obesity is associated with alterations in the gut microbiome in toddlers,” PLOSONE, vos.9, no. 11, 2014, pp.14.
[50] M. Roberts et al., “Compliance with children’s television food advertising regulations in Australia,” BMC Public Health, vol. 12, no. 846, 2012, pp.7, doi:10.1186/1471-2458-12-846.
[51] R. Baskin, B. Hill, F. N., Jacka, A. O’Neil, and H. Skouteris, “The association between diet quality and mental health during the perinatal period. A systematic review,” Appetite, vol. 91, 2015, pp. 41-47, doi:10.1016/j.appet.2015.03.017.
[52] D. X. Wang and D. Stewart, “The implementation and effectiveness of school-based nutrition promotion programmes using a health-promoting schools approach: a systematic review,” Public Health Nutrition, vol. 16, no.6, 2012, pp. 1082-1100, doi: 10.1017/S1368980012003497.
[53] D. González, A. Nazmi and C. G. Victora, “Childhood poverty and abdominal obesity in adulthood: a systematic review,” Review, vol.25, Sup 3, 2009, pp.427-440.
32Copyright (c) IARIA, 2015. ISBN: 978-1-61208-424-4
GLOBAL HEALTH 2015 : The Fourth International Conference on Global Health Challenges
44 / 101

Challenges of Comparing Medication eHealth Services in the Nordic Countries
Heidi Gilstad and Arild Faxvaag Health Informatics Research Group, Dept. of Neuroscience Norwegian University of Science and Technology, NTNU
Trondheim, Norway [email protected] and [email protected]
Christian Nøhr and Sidsel Villumsen Dept. of Development and Planning
Aalborg University Aalborg, Denmark
[email protected] and [email protected]
Jarmo Reponen FinnTelemedicum, Dept. of Medical Technology
University of Oulu. and Raahe Hospital Oulu, Finland
Hege Andreassen Norwegian Centre for Integrated Care & Telemedicine
Tromsø, Norway [email protected]
Lars Jervall and Thomas Pehrsson Center for eHealth in Sweden (CeHis)
Stockholm, Sweden [email protected] and [email protected]
Maarit Kangas FinnTelemedicum, Dept. of Medical Technology
University of Oulu Oulu, Finland
Guðrún Audur Harðardóttir Dept. of Health Information Management
Directorate of Health Reykjavik, Iceland
Sabine Koch Health Informatics Centre
Karolinska Institutet Stockholm, Sweden [email protected]
Hannele Hypponen Dept. of Information
National Institute for Health and Welfare Helsinki, Finland
Abstract— A prescription and medication service that is optimised to protect against unnecessary harm is an essential component of a safer healthcare system. To this means, the Nordic countries have put considerable efforts in digitizing their prescription and dispensing processes and making medication eHealth services available for clinicians, pharmacists and patients. As these e-services are being established and applied, there is a need to monitor and learn from their use. This paper reports from a sub-study of a larger activity on developing indicators for monitoring eHealth services in the Nordic countries. We describe different medication eHealth services and compare their availabiliy to professionals and patients in the Nordic countries. We found that an ePrescription service is available for clinicians and patients in all Nordic countries, but services that enable
renewal or viewing of prescriptions by patients are not commonly available yet. A major challenge when comparing medication eHealth services is the fact that definitions of indicators vary between countries.
Keywords- Medication data, ePrescription, medication list, indicator
33Copyright (c) IARIA, 2015. ISBN: 978-1-61208-424-4
GLOBAL HEALTH 2015 : The Fourth International Conference on Global Health Challenges
45 / 101

I. INTRODUCTION
Access to information about medication is crucial for high quality healthcare and patient safety [1]. Viewing an up-to-date list of current medications is a prerequisite when prescribing a new drug, administering medications or assessing potential side effects, decreasing errors when dispensing medications, for preventing medication errors and adverse drug events in the healthcare system [2], as well as for control of financial aspects for prescription products. From the patient’s perspective, having an updated list of their medications is an effective means of ensuring that the health professionals they encounter on their path through the health system are kept aware of some of the most important aspects of their health.
Most nations now devote large resources in digitizing their healthcare systems and in building eHealth services for care professionals and patients. As such services have been built and taken into use, there is a need for monitoring and assessing the use of such services for mutual learning and improvement [3]. What characterizes eHealth services that are available at a national level in the Nordic countries and how are these being used? These are some of the questions that a Nordic eHealth Research Network (NeRN) has posed in an inter-Nordic collaboration on developing indicators for monitoring eHealth. NeRN is a research group [4] reporting to the eHealth group of the Nordic Council of Ministers, and is working with development, testing and assessment of a common set of indicators for monitoring eHealth in the Nordic countries (Finland, Sweden, Norway, Iceland and Denmark), plus Greenland, the Faroe Islands and Åland.
Medication eHealth services include different e-services related to medication management for patients, pharmacists and care professionals. A central element of medication eHealth services is the electronic recording of prescriptions. The representations of prescriptions can be described as involving three different characteristics: Prescription as assigning a right, Prescription as a withdrawal action (Dispensing) and Prescription as an administered action, i.e., the patient has taken the medicine. As such, the decision to medicate, prescribing, dispensing and administering medicine, are different aspects of a Medication eHealth service in form of an ePrescription service, see Figure 1. The decision to medicate is the first step, where the health professional decides when and how the patient should be medicated. ePrescribing is the electronic prescribing of medicine by a health professional to a patient and making it available to a pharmacy, where the medicine can be dispensed and picked up by the patient. The prescription is a signed artifact (document) that describes the medication and how it shall be taken. It gives the patient the right to pick up the medication at the pharmacy and use it according to the description. In hospital settings, the health pofessional does not need to perform the actual prescription and can go directly from deciding to medicate to dispensing of the medicine, as shown in Figure 1. Dispensing is the retrieval
of a prescription and the dispensing of the medicine to the patient. The patient consequently administers the medication, when consuming it. The medication list is the overview of the medications that are prescribed and dispensed to the patient. An eMedication list service allows for both patients and professionals to access it.
Figure 1 illustrates worktasks related to medication, and the storage of data related to each task. The decision of medication is noted in a Medication Management System (MMS) by the health professional. Outside hospitals a prescription can be issued on a sheet of paper, telephoned to a pharmacy or sent as an electronic order to a prescription server, where it can be accessed by pharmacies. When a drug is dispensed at a hospital is will be documented in the MMS, if it is dispensed at a pharmacy,it will be documented in a pharmacy system – in some countries at a national level. Health professionals store information about the administration of drugs in a MMS.
Figure 1. Overview of the process of a prescription from
decision to medicate to administration of the medicine and where the data is stored in a medication eHealth service.
This paper addresses the issue of availability of eHealth services related to medication and offers a comparison of the availability for patients and healthcare professionals in the Nordic countries. The following research question guides the work presented in this paper:
What is the availability of ePrescription and eMedication list services in the Nordic countries?
The research question encompasses information from indicators identified by NeRN and is divided into following sub-questions for cross country comparison:
• Is an ePrescription service available?
• Does a national electronic medication list comprise prescribed and dispensed medication available?
• Is it possible for patients to renew their prescriptions electronically?
• Is it possible for patients to view their ePrescriptions?
Section II describes the methods used in the project. Section III offers a presentation of the results, and Section
34Copyright (c) IARIA, 2015. ISBN: 978-1-61208-424-4
GLOBAL HEALTH 2015 : The Fourth International Conference on Global Health Challenges
46 / 101

IV includes the discussion. Section V comprises concluding remarks.
II. METHODS
The indicators used in this study were derived from a rating survey performed in 2013, constructed on the basis of national survey questionnaires in the Nordic countries, an OECD model survey developed in 2012, eHealth policy analysis performed in 2013 and variables presented in the eHealth evaluation literature [5].
Data about the indicators for ePrescription and eMedication list services arise from discussions in a series of workshops with participants from all the Nordic countries arranged by the NeRN and a summary of the national survey questionnaires in the Nordic countries performed from 2010-2014 [6]. The results are presented as proportion of public healthcare organisations having the functionality within each of the Nordic countries.
III. RESULTS
When presenting the results, the sub-questions are addressed separately.
A. Availability of a national ePrescription service
The indicator is identical to an OECD indicator, but measured at a national level.
Figure 2. Availability of an ePrescription service.
Figure 2 shows that by the end of May, 2014, all the Nordic countries have a national ePrescription service in place. In Finland, Denmark, Iceland and Sweden, ePrescription is available at a national level, i.e., at all public hospitals within the country, for all GP´s, and at every pharmacy in the country. In Finland, the roll-out of ePresciption to the private sector is currently on its way. In Norway, all pharmacies, general practitioners, private specialists and emergency doctors, all (non-hospital) doctors
allowed to prescribe drugs have access to ePrescription, and soon also dentists.
B. Availability of a national electronic medication list of prescribed and dispensed medication
The indicator, which is identical to the OECD indicator, measures the availability of information about medication that has been previously prescribed, or dispensed at another institution. However, the contents of this indicator vary in the Nordic countries. A national list of prescribed and dispensed medication is not necessarily the same as the patient´s current medication list, since for example the medication dispensed while admitted to a hospital or purchased without a prescription may not be included.
Figure 3. Availability of national electronic medication list.
Figure 3 shows the availability of national electronic
medication lists in the Nordic countries. In Denmark, the medication list has been 100% available since 2010, including all types of prescriptions made outside hospitals as well as all medications dispensed both in and outside the hospital.
In Finland, the national prescription database shows prescribed and dispensed medication, but not those administered during hospital stay. Patients can preclude health professionals from accessing the data. The national list of prescriptions does not include prescriptions on paper or prescriptions that have been made by phone, nor prescriptions related to social care. From 2015, the national KANTA-system will generate a comprehensive list of current medication for the patient from the prescription database and data from individual electronic patient record (EPR) systems, including medication administered during hospital stay.
In Iceland, the availability of the national list of prescribed and dispensed medicine is 100%, since 2014, and includes all ePrescriptions, both prescribed and dispensed, as well as some paper and telephone prescriptions. All paper
35Copyright (c) IARIA, 2015. ISBN: 978-1-61208-424-4
GLOBAL HEALTH 2015 : The Fourth International Conference on Global Health Challenges
47 / 101

and telephone prescriptions will be available in 2015. As in Finland, the medication list does not include the medication administered during hospital stay.
In Norway, a national medication list is to be found in the “Kjernejournal” (Summary care record), and it may also be accessed via the national portal “helsenorge.no”. “Kjernejournal” is running as (in 2014) a pilot implementation in two regions. “Kjernejournal” will contain a list of the medicines the patient has been prescribed (both ePrescriptions and paper prescriptions) in Norwegian pharmacies. Medicines the patient purchased without a prescription, received at an emergency department, hospital / nursing home or purchased abroad will not appear. Prescriptions that have been dispensed are stored in the “Kjernejournal” for three years.
In Sweden, the list of medications that have been dispensed to the patient has been available since 2012. The patient decides if the doctor is allowed to see the information in the database. A consent is needed from the patient. Very few patients i.e., 3-4.000 patients out of 9 million actually choose to hide their information,
C. Availability of electronic medication renewal
This indicator shows the availability of services that enable electronic medication renewal at the national level. The indicator is identical to the OECD indicator.
Figure 4. Availability of electronic medication renewal.
Figure 4 shows the availability of electronic medication renewal services in the Nordic countries. In Denmark, there is 100% availability of electronic medication renewal in primary care at a national level.
In Finland, this is currently an organizational activity. The patient needs to contact the pharmacy or primary health care centre to ask for a renewal, although many
organizations provide an electronic web portal to mediate the request.
In Iceland, only a few health care institutions offered this service in 2014. However, this is currently being implemented and is expected to be at a national level before end of 2015.
In Norway, this service has not been established at the national level. General practitioners can offer service functionalities for patients depending on what portal provider they have chosen.
In Sweden, electronic medication renewal has been available since 2012 in the national service "My healthcare contacts (MVK)". MVK is a citizen web portal that enables secure communication between patient/ consumer/ customer and healthcare and longterm care. The patient can book and rebook appointments, renew prescriptions, order a copy of his patient record and in some county councils also access it.
D. Availability of electronic viewing of patient’s own prescriptions
This indicator concerns electronic services that enable patients to view their own medication data. We present data for services at a national level. The indicator is identical to the OECD indicator.
Figure 5. Availability of patients’ viewing electronically of own
medication data
Figure 5 shows the availability of patients` viewing electronically of own medication data. In Denmark, patients have had the opportunity to view their own medication data covering the past two years since 2009. In the beginning, it only enabled viewing of prescriptions made outside hospitals. Since 2013, viewings of prescriptions made by hospital physicians have been included.
In Finland, all patients now have access to all prescriptions.
36Copyright (c) IARIA, 2015. ISBN: 978-1-61208-424-4
GLOBAL HEALTH 2015 : The Fourth International Conference on Global Health Challenges
48 / 101
This service did not exist in Iceland until November 2014. Currently, it only includes ePrescribed medications. However, plans are already underway to enhance these services to include also paper- and telephone prescribed medication.
Norway established this service in 2012-2013 via “My prescriptions” in helsenorge.no, but the service currently only enables viewing of the most recent prescriptions made by GPs.
In Sweden this service has been available since 2012 as a national service through “My healthcare contacts” (MVK).
Availability for patients viewing of medication data that (public/private sector) professionals have prescribed is a feature of national health information systems in the Nordic countries.
IV. DISCUSSION
The Nordic countries seem relatively homogeneous and comparable in terms of political system, infrastructure, culture, and educational, social- and healthcare systems; however providing comparable indicators from surveys across the Nordic countries involves a number of challenges. The samples of the survey varied: in Denmark, a representative sample of clinical end users participated whereas in the other countries leaders in health care institutions were approached. The survey questions were formulated in the language of the respective countries, and the time and frequency of the surveys varied. Detailed discussions of these differences settled most of the variance they introduced, and the results obtained on the medication issues were quite comparable.
Comparable e-services are the ePrescription services and the list of prescribed medicines, i.e., the proportion of public and/or private organizations where prescribed medicine outside the own organization, are available in all the Nordic countries. Although ePrescription is available it is still possible to issue prescriptions on paper or by telephoning the pharmacy. This proportion has not been measured but it is assumed that it is neglectable given the high number of prescriptions made electronically.
The ePrescription services are well established and mature in some countries, while in other countries they are still in a pilot phase. The availability of a National list of prescribed and dispensed medication has also by 2014 reached a level of saturation. In Denmark, this service has been available for some years. Although the service is available in all countries the architecture of the systems behind the services differ significantly, but a detailed analysis of these differences has not been targeted in this study. A special feature for patients to hide specific medications is available in all countries for similar ethical reasons.
The availability of an e-service to renew medication is not available in all countries. In Denmark, and Sweden, the service has been available for some years, however it is implemented in different ways. In Denmark, this service was implemented for all patients to use as part of the agreement between the general practitioners and the regions who pay them fee for service. In Sweden, the service is available to all citizens through a national portal. In other countries this service is available only through dedicated organizations.
The service that enables patients to view their own prescriptions has been implemented in all countries.
However, when going into detail about the content of the indicators, the NeRN group realized that characteristics of the indicators varied between the respective countries.
The availability of a national ePrescription service was saturated, but the content measured was different between the Nordic countries. In the definitions of the indicators, the fact whether the medication was prescribed, dispensed or administered was not clearly specified, or the data was not available because the question was not asked specifically in the surveys. It became apparent that the content of ePrescriptions and the measurements of them varied between the countries making detailed explanation in the presentation of the results necessary for each indicator and each country.
Another point which makes comparison difficult is the fact that ePrescription does not cover paper-based prescriptions per se, which are regulated in another way than electronic prescriptions. It has different consequences in the respective countries. In Denmark, for instance the paper-based prescriptions will be synchronized with the overview of the patient’s own prescriptions once the medicine has been dispensed in a pharmacy. A related issue is that while ePrescriptions are 1-1 prescribed and dispensed medication, where the paper based prescription can hold more drugs on the same piece of paper.
The e-services in this paper more specifically referred to as the medication eHealth service, may have different scopes, i.e., intended coverage area. While some e-services are accessible at a national level, others are either limited geographically to a regional level, administratively to the hospitals or the organizations, or to specific roles, for example to healthcare professionals and not to patients. The focus in this study is the availability of medication eHealth services at a national level and availability at a more granular level was therefore not presented.
V. CONCLUSION
The study showed that the availability of patients’ prescription information and ePrescriptions made available to any pharmacy is realized via the national ePrescription systems in each Nordic country. Moreover, the availability
37Copyright (c) IARIA, 2015. ISBN: 978-1-61208-424-4
GLOBAL HEALTH 2015 : The Fourth International Conference on Global Health Challenges
49 / 101

of medication renewal requests as well as the availability of electronic viewing of patients’ own prescriptions is comprehensive on national level in some countries (Sweden, Denmark and Iceland). Patients’ access to view their prescription data electronically is also broad. However, the NeRN findings demonstrated that the services are realized differently in the respective countries and also definitions of indicators vary between countries hampering comparison.
ACKNOWLEDGMENT Our gratitude goes to the eHealth Group of the Nordic
Ministry of Health who supports the work of the Nordic eHealth Research Network in our efforts to define common indicators for monitoring eHealth in the Nordic countries.
REFERENCES [1] D. M. Benjamin, “Reducing Medication Errors and Increasing
Patient Safety: Case Studies in Clinical Pharmacology”. The Journal of Clinical Pharmacology. Blackwell Publishing Ltd, 2013.
[2] G.E. Karagiannis, L. Tzachani, B. R. M. Manning, V. G. Stamatopoulos, M. Roughton, A. A. Lazakidou, M. Petridou, D. Iliopoulou, M. L Rigby “Patient-Generated EHR Input System Trials: An Analysis of Perceived Benefits Across a Range of Disease Groups” in eds D.D. Koutsouris and A.A. Lazakidou R, “Concepts and Trends in Healthcare Information Systems”. Springer Link, 2014.
[3] The European Federation of Medical Informatics: “Working Group Proposal, adopted by the EFMI board”, http://iig.umit.at/efmi/, 2002.
[4] H. Hyppönen, A. Faxvaag, H. Gilstad, G.A. Hardardottir, L. Jerlvall, M. Kangas, S. Koch, C. Nøhr, T. Pehrsson, J. Reponen, A. Walldius, V. Vimarlund. “Nordic eHealth Indicators: Organization of Research, First Results and Plan for the Future”. Stud Health Technol Inform 192:273-7, 2013.
[5] J. Adler-Milstein, E. Ronchi, G. R. Cohen,
Laura A. Pannella
Winn,
A. K. Jha 2014: “Benchmarking health IT among OECD countries: better data for better policy”. J Am Med Inform Assoc 2014;21:111–116. doi:10.1136/amiajnl-2013-001710
[6] H. Hyppönen, M. Kangas, J. Reponen, C. Nøhr, S. Villumsen, S. Koch, G.A. Hardardottir, H. Gilstad, L. Jerlvall, T. Pehrsson, A. Faxvaag, H. Andreassen, B. Brattheim V. Vimarlund and J. Kaipio. “Nordic eHealth Benchmarking: Status 2014”. TemaNord 2015:539, Nordic Council of Ministers, Copenhagen, Denmark. (www.norden.org/en/publications) Accessed July 2015.
38Copyright (c) IARIA, 2015. ISBN: 978-1-61208-424-4
GLOBAL HEALTH 2015 : The Fourth International Conference on Global Health Challenges
50 / 101

Brain Activity Estimation with Precise Motor Measurements ofVisual Synchronization Task of Hands
Kyota Aoki
Department of Information ScienceGraduate School of Engineering, Utsunomiya University
Utsunomiya, [email protected]
Hisanori HottaDepartment of Information Science
Graduate School of Engineering, Utsunomiya UniversityUtsunomiya, Japan
Abstract— Visual synchronization tasks are difficult. We needintensive brain activity for completing visual synchronizationtasks. Recently, we can measure the precise movement of ahuman with cheap and easy to use sensors. We propose amethod to estimate the total brain activity using the precisemeasurement of the motor of a human body. This papermeasures the movement of hands of a human synchronizingthe example movement presented on a display. With theFourier analysis of the movements, we propose to measure thesynchronization of hands. This measure helps to detect a smallchange of the brain activity that might be indicative of braindiseases. As a result, the measure helps to detect a smallsymptom of brain diseases.
Keywords-motor measurement; cerebral dysfunction.
I. INTRODUCTION
There are many motor tasks that measure the abilities ofmotor functions of a human. They are the Purdue pegboardtask, a seal affixation task, a tray carrying task, etc. [1][2][3].These tasks estimate the ability of a motor function of ahuman based on the results of the tasks. There is noobservation of the process of the tasks.
There are also some synchronization tasks used tomeasure human abilities. For example, they aresynchronization of finger taps with periodically flashing visual stimuli and synchronization with an auditorymetronome. In these tasks, the timing between the stimuliand the tapping is measured. There is no observation of theprocess of the tapping [4][5][6][7][8][9][10].
Recently, many cheap and easy measurement methodsfor the movements of a human body have been developed.For instance, some of these sensors include Kinect sensor,and Leap motion sensor [11][12]. There are manyapplications that use those sensors for controlling computers.For instance, there are many video games that use thosesensors for controlling an avatar in the games [13].
Many researchers report that many kinds of braindisorder affect motor functions. In this paper, we propose amethod measuring motor functions that are reflections ofmany brain functions. If we can measure the motor functionsthat reflect all the brain functions, the measurement reflectsthe total brain activity. As a result, in case of any braindisorder, the measurement of motor functions will revealsome symptom about the disorder.
The human hands are the parts of a body that can makethe most complex movements. This paper proposes a methodthat measures the precise movements of hands synchronizingthe movements of hands on a display. The synchronizationneeds visual perception of the displayed hands’ images andprecise control of the arm muscles.
We can now precisely measure the movement of hands.This paper proposes a new synchronization task and theevaluation method. The resulting measure is very sensitive.With this measure, we can observe the developments of themotor function and infer on brain activity.
First, we discuss the synchronized hands’ movementswith visual presentation. Then, this paper proposes theoutline of the proposed observation system for visualsynchronization of hands’ motions. Next, we show ourimplementation of the observation system. Then, we discussthe brain function estimation method using the measuredvisual synchronization. Next, we show our experimentalresults and conclude this work.
II. VISUAL SYNCHRONIZATION TASK
There are many motor tasks that intend to measure themotor function of a human. However, most of these tasksmeasure the results of the tasks. There are some tasks thatmeasure the synchronization between a finger tap andstimuli. With human observations, it is difficult to measurethe process of synchronizing movements. Now, we can use aKinect sensor and a Leap Motion sensor. Those sensors
MotorGeneration
MuscularSensation
SightMotor
RecognitionExample
Video
Figure 1. Relations among brain functions for performing theproposed synchronization task.
39Copyright (c) IARIA, 2015. ISBN: 978-1-61208-424-4
GLOBAL HEALTH 2015 : The Fourth International Conference on Global Health Challenges
51 / 101

measure the three-dimensional movements of a human body.With these sensors, we can measure the precise movementsof a human body.
We can synchronize our movements with each other. Forinstance, in playing a dance, dancers can synchronize theirmovements with each other. A synchronization of movementis more difficult work than a simple imitation of movement.To generate synchronized movements, we need to observethe motion to be synchronized. We need to generate themotion to be similar to the motion synchronized. We need toobserve the generated motion synchronizing the originalmotion. We need to estimate the divergence between theoriginal motion synchronized and the motion synchronizingthe original motion. We need to control the speed of themotion synchronizing. These functions make the feedbackloop. However, for compensating our brain’s processingdelay, we need to estimate the delay itself and makefeedforward.
This processing loop is shown in Fig. 1. For estimatingthe total brain function, we need to include all the functionsof a brain. The visual synchronization task includes visionand motor functions. The vision includes not only the staticsight, but also the dynamic sight.
The visual synchronization is more difficult than audiosynchronization. So, we observe the wider brain functionswith the visual synchronization tasks than the audiosynchronization tasks.
Our proposed visual synchronization task is thesynchronization between the position of stimuli on a displayand the position of hands. Our synchronization task is not thesynchronization between the timing of stimuli and the timingof action. The measurement of timing is only one scalarvalue. In our proposed synchronization task, themeasurements of positions between the stimuli and the handsare the sequence of a triple of the position of the stimuli andthe ones of both hands.
III. VISUAL SYNCHRONIZATION OBSERVATION SYSTEM
Classical synchronization tasks measure the timingbetween the result of action and the stimuli. We observe theprocess of synchronization between the stimuli and themotion.
A. Stimuli
For the motor task, we select the rotation of both hands.Rotation is a difficult movement of a hand. For analyzing thesynchronization easily, we make the stimuli follow a precisesine curve. If stimuli form a precise sine curve, we easilyevaluate the observed motion comparing with the sine curve.Fig. 2 shows the sequence of stimuli. The images areproposed on display with a constant interval from top tobottom. And then, they are proposed from bottom to top.These two sequences make one cycle of the stimuli of hands’motion. In the stimuli images, the right hand and the lefthand are the same. The right one is the mirror image of theleft one.
B. Stimuli generation
Our stimuli are a displayed video of both hands’ rotation.However, in a normal video, it is difficult to control preciselythe motion of hands in the video to follow the sine curve. Itis also difficult to evaluate the synchronization between thestimuli and the motions of hands. We propose the stimuligeneration method that displays a proper image at the precisetiming.
Figure 2. Stimuli Images.
40Copyright (c) IARIA, 2015. ISBN: 978-1-61208-424-4
GLOBAL HEALTH 2015 : The Fourth International Conference on Global Health Challenges
52 / 101

C. Hands’ rotation measurement
We use the Leap motion sensor for measuring theposition and the pose of both hands [12]. With the Leapmotion sensor, the measurements are not performed at afixed interval. However, the Leap motion sensor measuresthe position and the pose of hands about 120 times within asecond. We determine the precise position and pose at every1/100 S with interpolating linearly between two adjacentmeasurements.
D. Synchronization measure
We define the synchronization measure using FFT (FastFourier Transform) results of the estimated poses of bothhands in each cycle. If a subject makes completesynchronization to the stimuli, the resulting pose of bothhands follow a complete sine curve. As a result, at everycycle of the rotation of hands, the result of FFT has a zerovalue at the second term or higher terms. We define themeasure as (1). This measure increases with the amount ofthe difference from ideal sine curve.
(1) In (1), t is the number of terms. is the absolute value
of the x-th term of the result of FFT. is the power of thelowest frequency. This represents a one cycle of a hand’srotation. If the rotation of a hand follows the stimuli imagesprecisely, the carries all powers of the hand’s rotation.Other terms carry no power. In the case, the measure in (1) is0.
is a value that represents the average of poses. This isnot included in (1). As a result, this measure does not dependthe absolute poses of hands.
We call this measure as Non-Smoothness-Measure(NSM). This measure may span from 0 to infinite.
Our proposed system observes two hands. So at everycycle, we have two NSMs.
IV. IMPLEMENTATION OF THE PROPOSED SYTEM THAT
MEASURES VISUAL SYNCHRONIZATION
A. System Overview
The visual synchronization measurement system has twomajor parts. One part displays the intended hand’s motion,and the other part measures the position and the pose ofhands with the Leap motion sensor. These two main partsmust work smoothly. The stimuli must be updated at precise
timing. The measurements of the position and the pose ofhands must continue without interruption. To perform theserequirements, our proposed implementation has two mainprocesses. One process works to display stimuli images, andthe other records the position and the pose of hands.
We use Python and Pyglet for implementing the system[14]. Pyglet is an object-oriented programming interface fordeveloping games and other visually-rich applications [15].
B. Stimuli Image
For creating stimuli images, we recorded the hands’rotation images with the measured hands’ positions andposes. Then, we selected the images that fit for the sine curve.The selected sequence of hands’ images fits for the sinecurve.
C. Stimuli Image Presentation
With the progress of time, our proposed system selectsthe most proper image and proposes on a display. Thisstimuli image presentation takes a one process. There is nointervention from other processes, for instance, hands’rotations measurement.
D. Hands’ Rotations Measurement
We use the Leap-Motion-Sensor for measuring the handsposes. To measure the pose of hands, we can use attachedtype sensors. The attached type sensors have enoughaccuracy and measuring speed. However, we need longersetup time. This prevents the easy and fast measurement. Thesensor measures the pose of hands at each 1/100 S. Themeasurement includes the positions and the poses of bothhands. The measured record has about 700 KB in 25 second.The system must record all data without loss. This measuringshares a one process. As a result, there is no interventionfrom the Stimuli image presentation. The sensor works inenough speed.
V. EXPERIMENTS AND DISCUSSIONS
We made two types of experiments. One experimentelucidates the distributions among normal people. The otherdoes the changes on a person.
A. Experiments Setup
From the pre-experiments, the speed of the hands’rotation is best at one cycle per second. Subjects need about10 S to synchronize their movements of hands to theproposed motion images. As a result, one session of anexperiment needs at least 11 S. For getting reliable results,we decide that the length of a session is 25 cycles ofrotations. This means that one session needs 25 S. Beforestarting a session, we instruct a subject to synchronize theirhands to the displayed hands’ images.
B. Session Non-Smoothness Measure
At each session, we have 25 cycles’ measurements. As aresult, we have 25 pairs of NSMs (Non-SmoothnessMeasure). Our observation shows that a subject needs about10 S for synchronizing to the proposed images. So, we
Figure 3. The distribution of the pairs of session NSM and averageNSM.
Session
NSM
Average NSM
41Copyright (c) IARIA, 2015. ISBN: 978-1-61208-424-4
GLOBAL HEALTH 2015 : The Fourth International Conference on Global Health Challenges
53 / 101

exclude first 10 cycles. As a result, at each session, we havea sequence of 15 pairs of NSMs.
At a single cycle, there may be some distributions. Weselect three continuous cycles’ average of NSMs to evaluatethe synchronization. At each session, we select the minimumof three continuous cycles’ averages of NSMs as the NSMfor the session at each hand. The NSM is computed at eachhand. We have two points that the average of continuousthree NSMs is the smallest. At each point, we have a pair ofthe averages of continuous NSMs. They are the average
NSMs of the left and right hands. As a result, we have fouraverage NSMs.
A pair has the average NSM at left hand and the averageNSM at right hand, when the average NSM of the left handis minimum. And, another pair has the average NSM at lefthand and the average NSM at right hand, when the averageNSM of the right hand is minimum. From the four NSMs,we decide that the session’s NSM is the minimum of all fourNSMs.
TABLE I. EXPERIMENTAL RESULTS OF NORMAL PEOPLE.
Cycle numberwhere the NSM is
the smallest.
NSMs at the cyclewhere the Right hand
NSM is the small
NSMs at the cyclewhere the left hand
NSM is the small
SessionNSM
AverageNSM
AverageNSM|-Session
NSM
Subject Right Left Right Left Right Left
M 22 7 8 0.31 0.36 0.32 0.32 0.31 0.33 0.02
M 24 1 5 0.24 0.83 0.26 0.24 0.24 0.40 0.15
M 24 7 1 0.37 0.33 0.40 0.32 0.32 0.35 0.03
M 27 2 6 0.31 0.36 0.32 0.29 0.29 0.32 0.03
M 20 2 2 0.43 0.51 0.43 0.51 0.43 0.47 0.04
M 20 0 9 0.44 0.51 0.47 0.50 0.44 0.48 0.04
M 24 8 3 0.31 0.32 0.39 0.27 0.27 0.32 0.06
M 27 11 11 0.29 0.39 0.29 0.39 0.29 0.34 0.05
M 19 9 0 0.39 0.38 0.47 0.37 0.37 0.40 0.04
M 19 4 4 0.62 0.56 0.62 0.56 0.56 0.59 0.03
F 19 8 9 0.39 0.44 0.44 0.42 0.39 0.42 0.03
F 19 9 7 0.43 0.43 0.47 0.40 0.40 0.43 0.04
M 27 2 10 0.22 0.35 0.28 0.27 0.22 0.28 0.06
F 20 1 1 0.22 0.25 0.22 0.25 0.22 0.23 0.01
M 21 6 0 0.29 0.35 0.31 0.33 0.29 0.32 0.03
M 21 2 0 0.26 0.41 0.34 0.32 0.26 0.33 0.07
M 20 1 2 0.27 0.43 0.29 0.39 0.27 0.34 0.08
M 20 8 8 0.38 0.41 0.38 0.41 0.38 0.39 0.01
F 21 1 2 0.29 0.31 0.29 0.30 0.29 0.30 0.01
F 21 8 0 0.34 0.32 0.38 0.25 0.25 0.32 0.07
M 20 7 6 0.21 0.35 0.23 0.30 0.21 0.27 0.06
M 20 8 8 0.30 0.37 0.30 0.37 0.30 0.33 0.03
M 20 0 0 0.33 0.37 0.33 0.37 0.33 0.35 0.02
M 20 7 8 0.30 0.34 0.34 0.31 0.30 0.32 0.02
M 18 10 9 0.46 0.39 0.49 0.36 0.36 0.42 0.06
M 18 0 6 0.55 1.62 1.13 0.56 0.55 0.97 0.42
M 20 2 2 0.58 0.60 0.58 0.60 0.58 0.59 0.01
M 20 3 5 0.53 0.53 0.57 0.50 0.50 0.53 0.03
M 19 5 5 0.42 0.39 0.42 0.39 0.39 0.40 0.01
M 19 10 10 0.54 0.41 0.54 0.41 0.41 0.48 0.06
M 25 6 0 1.06 1.17 1.49 0.42 0.42 1.03 0.62
Average 5.00 4.74 0.39 0.48 0.44 0.38 0.35 0.42 0.072
Normal distribution 3.45 3.58 0.16 0.27 0.25 0.10 0.10 0.17 0.123
M 58 0 0 2.43 2.43 2.43 2.43 2.43 2.43 0.0
42Copyright (c) IARIA, 2015. ISBN: 978-1-61208-424-4
GLOBAL HEALTH 2015 : The Fourth International Conference on Global Health Challenges
54 / 101

C. Distribution on Normal adult people
There are 19 subjects whose ages span from 18years old to 27 years old. They include three females.
Fig. 3 shows the relation between the sessionNSM and the average NSM. In many cases, theaverage NSM and the session NSM have linearrelation.
Each subject tries two sessions. There are 38sessions. However, at some sessions rotationmeasurements fail. As a result, we have 31 validsessions of normal subjects. Table I shows 31 validsessions’ NSMs and one subject who declaresweakness in sport. In the subject column, Mrepresents a male. The number is the age. The ‘Right’is the position where the right hand’s NSM isminimum. The ‘Left’ is the position where the lefthand’s NSM is minimum. The ‘Right/R’ stands forthe NSM of the right hand at the position where theright hand’s NSM is minimum. The ‘Left/R’ standsfor the NSM of the left hand at the position where theright hand’s NSM is minimum. The ‘Right/L’ andthe ‘Left/L’ do respectively.
The average is 0.35. The normal distribution is0.10. The distribution is small. The range of NSMunder 1.0 include over 0.9999999999. In most of thesessions, the session NSM and the average NSM arenearly same. However, at two sessions, they aredifferent. We can conclude that the session NSM andthe average NSM are nearly same in a normal person.If the average NSM and the session NSM aredifferent, there may be a problem at the measurementor the subject.
D. Subject weak in sports
We have one subject who declares his weaknessin sports. The last raw in Table I shows NSM of asubject who is weak in sports. The session NSM isvery large, and it differs from the average ofNSMs of the normal people.
E. Personal diurnal variation
With two subjects, we observe the diurnalvariations. They are 25 years old and 27 years-oldmales. In this experiment, we measure theperformance at every 30-minute interval from 9:00 to18:00. Table II and Table III show the experimentalresults. There are some missing data. Figure 3 andFig. 4 shows the session NSMs in time series. In thefigures, the linear estimation form and are shown.Their linear approximation shows a little increase inthe time course. This may show the accumulation offatigue. However, the is lower than 0.5. Thenumber of experiments is not large enough forconcluding. In the afternoon, the two subjects show alarge increase of the NMS. At the time, they may bea little sleepy. At the time, the brain activity may be alittle lower than a normal state.
The averages are 0.30 and 0.31. The normaldistributions are 0.07 and 0.04. The diurnal variation
TABLE II. DIURNAL VARIATION
Time Right LeftRight/
RLeft/R
Right/L
Left/LSessionNSM
9 9 2 0.21 0.30 0.27 0.26 0.21
9.5 - - - - - - -
10 9 4 0.26 0.31 0.34 0.30 0.26
10.5 9 9 0.29 0.29 0.29 0.29 0.29
11 4 2 0.39 0.31 0.42 0.27 0.27
11.5 5 0 0.28 0.73 0.33 0.36 0.28
12 0 9 0.35 0.46 0.45 0.38 0.35
12.5 - - - - - - -
13 6 3 0.29 0.39 0.32 0.32 0.29
13.5 1 0 0.30 0.35 0.31 0.32 0.30
14 4 2 0.72 0.65 1.54 0.37 0.37
14.5 4 5 0.32 0.35 0.33 0.33 0.32
15 1 0 0.31 0.36 0.34 0.35 0.31
15.5 2 7 0.31 0.87 0.33 0.36 0.31
16 3 3 0.31 0.36 0.31 0.36 0.31
16.5 8 4 0.32 0.43 0.46 0.37 0.32
17 0 7 0.31 0.42 0.38 0.42 0.31
17.5 - - - - - - -
18 9 7 0.30 0.40 0.35 0.34 0.30
Average 0.33 0.44 0.42 0.34 0.30
Normal distribution 0.11 0.16 0.29 0.04 0.04
TABLE III. DIURNAL VARIATION
Time Right LeftRight/
RLeft/R
Right/L
Left/LSessionNSM
9 0 6 0.27 0.32 0.38 0.27 0.27
9.5 - - - - - - -
10.5 7 0 0.31 0.34 0.39 0.32 0.31
11 3 1 0.25 0.38 0.28 0.31 0.25
11.5 0 0 0.32 0.36 0.32 0.36 0.32
12 8 7 0.22 0.40 0.23 0.33 0.22
12.5 - - - - - - -
13 10 10 0.46 0.45 0.46 0.45 0.45
13.5 11 11 0.49 0.46 0.49 0.46 0.46
14 1 1 0.30 0.27 0.30 0.27 0.27
14.5 - - - - - - -
15 - - - - - - -
15.5 3 5 0.33 0.28 0.34 0.27 0.27
16 7 7 0.90 1.10 0.90 1.10 0.90
16.5 8 8 0.32 0.28 0.32 0.28 0.28
17 8 4 0.33 0.91 0.34 0.34 0.33
17.5 6 6 0.32 0.34 0.32 0.34 0.32
18 1 12 0.30 0.37 0.40 0.32 0.30
Average 0.36 0.44 0.38 0.38 0.31
Normal distribution 0.16 0.23 0.15 0.20 0.07
43Copyright (c) IARIA, 2015. ISBN: 978-1-61208-424-4
GLOBAL HEALTH 2015 : The Fourth International Conference on Global Health Challenges
55 / 101

of a person is smaller than the inter-individual variation. As a
result, we have the reliable NSM of a person with a smallnumber of trials.
F. Discussions about Brain Activity
In subsection D, the NSMs of healthy peoples convergeson 0.35. In subsection E, the diurnal variation is smaller thanthe inter-individual variation.
If the NSM is large, there is a problem of the motorfunctions. The cause of the problem may not only be thedisorder about brain functions, but also be the disorder aboutnerves, muscles, etc. Our proposed method cannot find thecause of the motor disorder. However, if there is no changein the functions about nerves, muscles, etc., the increase ofthe NSM shows the disorder about the brain.
If we have the NSMs about a person in a long term, theincrease of the NSM shows the new disorder about brainfunction.
VI. CONCLUSION
The pair of the proposed synchronization task and theevaluating method enable to measure the precise
performance of the motor function of hands. The task is easyto perform. For instance, it needs merely 25 S. The proposedNon-Smoothness Measure has enough power ofdiscrimination between normal people and people that hassome motor problems.
This NSM can be used for evaluate the development ofthe motor function of children. This NSM detects very smalldisorder of the brain activity. For normal people, the NSMsconcentrate on a small range. The personal diurnal variationis small enough for detecting small disorder of brain activity.We will perform larger scale experiments in the next step.
ACKNOWLEDGMENT
This work is supported with JSPS25330405.
REFERENCES
[1] Lafayette Instrument, “Purdue Pegboard Test”,http://www.lafayetteevaluation.com/product_detail.asp?ItemID=159,retrieved 2015/07/07.
[2] Shogo Hirata, Yoshio Kitajima, Tomio Hosobuchi, Mitsuru Kokubun,“The speed and accuracy of fine motor actions in children withintellectual disabilities,” Bulletin of Tokyo Gakugei University, 59,pp. 263-267, 2008.
[3] Mitsuru Kokubun, “ARE CHILDREN WITH DOWN SYNDROMELESS CAREFUL IN PERFORMING A TRAY-CARRYING TASKTHAN CHILDREN WITH OTHER TYPES OF MENTALRETARDATION?” Perceptual and Motor Skills, 88:3c , pp. 1173-1176, 1999.
[4] Michael J. Hove, John R. Iversen, Allen Zhang, Bruno H. Repp,“Synchronization with competing visual and auditoryrhythms:
bouncing ball meets metronome,” Psychological Research,77, pp. 388–398, 2013.
[5] Yoshimori Sugano, Mirjam Keetels, Jean Vroomen,“The BuildUp and Transfer of Sensorimotor Temporal RecalibrationMeasured via a Synchronization Task,” Front Psychol. 2012; 3: 246, doi: 10.3389/fpsyg.2012.00246, 2012.
[6] Vanessa Krause, Bettina Pollok, Alfons Schnitzler, “Perception inaction: The impact of sensory information on sensorimotorsynchronization in musicians and non-musicians,” Acta Psychologica,Volume 133, Issue 1, pp. 28–37, January 2010.
[7] Jehee Lee, Jinxiang Chai, Paul S. A. Reitsma, “Interactive Control ofAvatars Animated with Human Motion Data,” ACM Transactions onGraphics (TOG). ACM pp. 491-500, 2002.
[8] Sarah Vercruysse, et al, “Freezing in Parkinson's disease: aspatiotemporal motor disorder beyond gait,” Movement Disorders,27(2), pp. 254-263, 2012
[9] Maurice A. Smith, Jason Brandt, Reza Shadmehr, “Motor disorder inHuntington's disease begins as a dysfunction in error feedbackcontrol,” Nature, 403, pp. 544549, (3 February 2000).
[10] Katya Rubia, Anna B. Smith, Michael J. Brammer, Brian Toone, EricTaylor, “Abnormal Brain Activation During Inhibition and Error
Detection in MedicationNaive Adolescents With ADHD,” AmPsychiatric Assocvolume, 162, 6, pp. 10671075, June 2005.
[11] Microsoft, “Kinect for Windows,” https://www.microsoft.com/en-us/kinectforwindows/, retrieved 2015/0707.
[12] 8Leap Motion, “Leap Motion SDK,”https://developer.leapmotion.com/, retrieved at 20150317.
[13] Microsoftstore, “Kinect,” http://www.microsoftstore.com/store/msusa/en_US/list/Kinect/categoryID.64752700, retrieved 2015/07/08.
[14] Python, “Python,” https://www.python.org/, retrieved 2015/03/17.
[15] pyglet, “pyglet,” http://www.pyglet.org/, retrieved 2015/03/10
Figure 4. Personal diurnal variation of subject 1.
Figure 5. Personal diurnal variation of subject 2.
44Copyright (c) IARIA, 2015. ISBN: 978-1-61208-424-4
GLOBAL HEALTH 2015 : The Fourth International Conference on Global Health Challenges
56 / 101

A Finger Movement Evaluation Device to Monitor the Use of Paretic Hand During
Daily Life Activities
Bilal Debs, Eliane Mousallem, Ali Hage-Diab,
Mohamad Hajj-Hassan, Hassan Khachfe, Soha Saleh
Department of Biomedical Engineering
Lebanese International University
Beirut, Lebanon 30710021; [email protected]; ali.hagediab;
mohamad.hajjhassan; hassan.khachfe; [email protected]
Nour El-Hoda Saleh, Ahmad Rifaii Sarraj
Department of Physical Therapy
Lebanese University
Beirut, Lebanon [email protected]; [email protected]
Houssam Yassine
Sciences et Techniques des Activites Physiques et Sportives (STAPS)
Claude-Bernard University Lyon 1
Lyon, France [email protected]
Abstract— Hand movement tracking devices are important
to monitor impaired hand function during daily activities.
The study presented in this paper investigates the feasibility
of using a hand glove device to monitor the use of paretic
hand in daily life. A Finger Movement Evaluation Device
(FMED) was developed for this purpose and it was tested on
six stroke subjects who used it for two days. FMED records
the flexion angle of two metacarpophalangeal (MCP) joints
(for example, index and middle MCP joints). A
questionnaire was used to evaluate subjects’ acceptance of
FMED. Data collected by FMED were analyzed to calculate
the ratio of finger movement episodes during the day and
amount of movement as a sum of individual movement
episodes. Results showed a high satisfaction of patients and
the ability to acquire quantitative information about the
quality of movement while using the device; these results
concluded that FMED is a promising tool to monitor the use
of impaired hand in real life whether as a regular routine
test or as part of a home based therapy set up.
Keywords- hand glove devices; movement impairmemt;
stroke
I. INTRODUCTION
Stroke is the major cause of neurological disability all over the world [1]. However, upper extremity (UE) motor impairment, specifically hand paresis, is the most disabling and persisting residual impairment after this event [2], and it is evident that it limits basic activities of daily living [3]. For this reason, the role of stroke rehabilitation is to promote the independence in daily life activities [4]. Moreover, the use of outcome measures (OMs) in neurological physical therapy is essential to evaluate the improvement of function during rehabilitation [5]. So, an essential issue in the assessment after stroke is to determine how much the impairment of upper extremity is the source of loss of function, and if the selected
rehabilitation intervention improves the activities of daily life of stroke survivors.
Numerous standardized clinical measures are available for clinicians to evaluate UE function after stroke. Yet, these measures are rarely used in clinical practice because of time constraints, high level of difficulty, lack of equipment, and lack of knowledge regarding OMs [6]. Besides, most of these measures do not collect information about the use of UE in the Activities of Daily Living (ADLs) and they do not provide clinicians with quantitative and objective information about patients' use of impaired limb during the day [7]; thus, they do not reflect how the patients interact in their daily life and their real world [8]. The use of assessment tools at home and community is essential to evaluate the UE function during daily activities in order to improve therapeutic intervention and avoid having patients stop using the impaired limb due to pain or absence of confidence and eventually losing the ability to use it due to the learned non-use phenomena [9].
Wearable measurement devices and home monitoring devices provide clinicians with additional assessment opportunities like collecting hand posture and movement data as individuals perform daily activities outside the clinic [10]. Despite their importance in measuring fingers' range of motion during dynamic tasks [11], different limitations exist; they are expensive, heavy and uncomfortable to be worn in daily life outside the clinic [12, 13] , and do not provide long term monitoring [12].
Preliminary research in the area of hand glove devices has focused primarily on testing protocols that evaluated glove devices characteristics [10-12, 14-17] and none of them has explored the use of these devices to monitor the impaired UE function during daily life.
This article describes the design of a low cost device for the assessment of finger’s movement during daily activities. Section II describes the device design and implementation, Section III describes the feasibility study
45Copyright (c) IARIA, 2015. ISBN: 978-1-61208-424-4
GLOBAL HEALTH 2015 : The Fourth International Conference on Global Health Challenges
57 / 101

methodology. Sections IV elaborates on the results and discussion, followed by conclusion in Section V.
II. METHODS
A. Finger Movement Evaluation Device (FMED)
The Finger Movement Evaluation Device (FMED) was designed to act as an offline electronic goniometer that measures finger flexion angle of 2 joints simultaneously. It includes two bending sensors (SpectraSymbol®, UT, USA) that can be placed on two fingers' MCP joints (for example index and middle fingers) at a time using VelcroTM. Only 2 joints are tracked in order to reduce the cost of the device letting the user focus on two fingers at a time with the flexibility in choosing which joints to track.
Figure 1 illustrates the main parts of the device. A voltage regulator circuit was implemented to down regulate the power from a 12V (6500 mAh) rechargeable battery to 5V. A dc-dc converter was implemented before the voltage regulator to convert 12V to 7V in order to avoid too much heat dissipation in case of using the voltage regulator to down-regulate from 12 to 5V. A charged battery (12V, 6500 mAh) can power the device for more than 48 hours.
The microcontroller (ATmega2560) reads input from the bending sensors through a voltage divider signal conditioning circuit. This is a low-power complementary metal–oxide–semiconductor (CMOS) 8-bit microcontroller that supports a real Read-While-Write Programming mechanism. The microcontroller processes the data, and saves the values of each joint on an SD card in real time. The raw data are saved on the SD (Secured Digital) card in addition to the fractionation angle (difference in angle between the two joints). This device also gives patients a real-time feedback of their movement using a set of light emitting diodes (LEDs) indicating the level of fingers movement flexion with increments of 10º (10º, 20º, 30º, 40º, 50º, 60º, 70º, 80º, 90º) and fractionation with increments of 5º (5º, 10º, 15º, 20º, 25º). The main electronics of the device was chosen to be surface mounted in order to reduce the size and weight of the device. FMED weighs 1.3 kg with battery. Figure 2 shows FMED worn by a volunteer.
B. Collected Data
As mentioned in the last section, the device saves the values of the variation of angles for sensors 1 and 2 (for example, index and middle finger flexion angles) and the individuation (difference between angles recorded by sensor 1 and sensor 2) versus time. A customized Matlab® algorithm was written to process these data. The first processing step was to calculate differences between adjacent elements of the dataset in order to detect movement episodes (change in flexion and individual angles). A threshold of 2º was used to count the episodes of movement (flexion angle exceeding a 2º predefined threshold). The ration of counted samples over whole dataset provided the Ratio of Movement (RaOM) values of each finger.
The other parameter that was calculated is related to the mean of difference in the angle between the two fingers (individual finger movement). Episodes or consecutive samples where there was a difference in flexion between index and middle fingers were reported. These episodes were counted to derive the Integral of Individuated Movement (IIM) episodes value. This value indicates how much the subject was moving the index finger independent of the middle finger and vice versa. IIM reflects how much the patient is capable of controlling one finger independent of the other during executing a functional task. The parameters (RaOM and IIM) calculated based on the recorded data were used as the main outcomes of FMED to effectively quantify the amount of movement during the day.
III. FEASIBILITY STUDY
A. Recruitment
Subjects with stroke were recruited from multiple rehabilitation centers in Beirut, Lebanon. Six individuals, with a clinical diagnosis of stroke in the chronic phase (3
males and 3 females, mean age 49.33±8.1, > 6 months
post-stroke) participated in the study. Subjects were included because they had residual
upper extremity impairments (Upper extremity Fugl-Meyer [FM] scores, with a range of (45-56)/66; and with mean flexion fingers ROM ± 1 standard deviation: 73.3 ± 7.4 degrees).
Inclusion criteria was chosen to give a nearly homogenous group of subjects between 40-60 years, with similar representation of both sexes, and approximately same degree of hand function deficit. The participants signed informed consents approved by the Lebanese University, school of health ethical review board.
B. Feasibility Testing Protocol
The first step in the procedure was to meet the subjects to inform them about the study, the device, and train them to use it at home. Patients wore the glove at home for two days. In the first day, they were requested to wear the glove in the impaired hand and use it like they usually do
Figure 1: Main components of FMED
46Copyright (c) IARIA, 2015. ISBN: 978-1-61208-424-4
GLOBAL HEALTH 2015 : The Fourth International Conference on Global Health Challenges
58 / 101

during daily activities, and remove it before sleeping. In the second day morning, they received a call from the study personnel and they were asked to wear the glove and to do specific activities by their impaired hand during the day in addition to their daily routine. The research team did not supervise the patient at home; however, the device recorded the data of movement of the patient on the SD card. The following day, FMED was collected from subjects, each subject filled the user feedback questionnaire, and the data saved on the SD card were collected for offline analysis.
Acceptance of the device and patient’s feedback was evaluated based on a user feedback questionnaire [12], and an open-ended discussion, performed after using the device for two days. The participants were supposed to answer a list of 11 question by a scale of 1 to 7. 1 means strongly disagree and 7 means strongly agree, and 4 means neutral. The study personnel were mainly interested to know if the device was comfortable or not, and if it was effective in engaging the subjects in doing more home daily activities. The recorded data were inspected for quality, and movement quality parameters (RaOM and IIM) were calculated in order to inspect if these parameters change in the second day after the study personnel has asked the participants to do extra exercising.
IV. RESULTS AND DISCUSSION
The following section presents the results of the user
feedback questionnaire and the recorded data. Table I lists the questionnaire questions and the mean of responses on each question and the results of the t-test performed between the mean of responses of each question and a hypothesized mean of 4 [neutral score]. Results show a significant difference from the neutral score (p<0.001). In the open ended discussion, subjects expressed high
satisfaction and reported that the visual feedback by the LEDs was engaging and motivating to move the impaired hand more than usual. They also expressed their willingness to use FMED at home for a therapeutic intervention because of being passionate to intensify their hand use during daily activities.
Figure 3:RaOM results for both fingers in days 1 and 2.
Figure 2: Prototype of FMED worn by a volunteer.
TABLE I. USER FEEDBACK QUESTIONNAIRE RESULTS
Question Average SD t-value p-value
I felt comfortable as the glove was put on 6.33 0.82 7.0
< 0.001
I did not feel like my fingers were put into any uncomfortable position as the glove was put on 6.33 1.21 4.7
I felt any restriction to movement with this glove is similar to other gloves I have worn 6.67 0.52 12.6
I would feel comfortable wearing this glove in public 6.67 0.52 12.6
I felt comfortable performing the activities in this study 6.50 0.84 7.3
I feel I can do most of my daily activities (except those involving water) while wearing this glove 6.67 0.52 12.6
The glove did not feel too tight (it did not make my hands or fingers tingle) 6.83 0.41 17.0
I feel like I can bend my fingers just like I can without wearing the glove 6.83 0.41 17.0
The glove did not feel too hot or too cold 6.50 1.22 5.0
I did not feel like my fingers were put into any uncomfortable position as the glove was removed 6.33 1.03 5.5
I felt comfortable as the glove was removed 6.33 0.82 7.0
Average 6.55 0.20
47Copyright (c) IARIA, 2015. ISBN: 978-1-61208-424-4
GLOBAL HEALTH 2015 : The Fourth International Conference on Global Health Challenges
59 / 101

It should be noted here that the activity initially
reported on day 1 might not faithfully reflect the regular activity of the participants without using the device; while wearing FMED subjects might be moving more than they usually do knowing that they are being watched. This is known as the Howethorne effect [18]. However, the participants are stroke survivors and they have movement impairments. Thus, the Howethorne effect will not increase the movement score beyond subject's true functional capability although it might increase the amount of his or her movement in comparison to regular days. This brings us back to another argument which says that it is helpful if these individuals with movement impairments felt they are watched so they move more according to their functional capability. In addition, being watched and by getting positive visual feedback of their movement (like the feedback by the LEDs in FMED), they will get better engaged in daily life functional activities, more than they averagely do. This is believed to be helpful in avoiding the learned non-use phenomena in stroke survivors where the less they use their impaired limb the harder it gets for them to recover their motor skills due to brain remodeling over time[9].
V. CONCLUSION AND FUTURE WORK
FMED allows clinicians to evaluate the improvement of hand function in the context of home environment. It can be a useful tool to complement the role of standardized outcome measures by assessing the hand use in real life so that clinicians are not limited to the clinical setting. The high rate of acceptance of FMED by the participants in this study and high enthusiasm of patients to using it for therapy, especially due to the presence of visual feedback suggests the need to test the usability of FMED in a home-based rehabilitation therapy intervention especially that it can be produced with a very low cost (~$100). Low cost, user friendly, and low weight, are the main advantages of FMED in comparison to other hand motion tracking gloves that are available in the market in addition to the presence of visual feedback setup which allows FMED to be useful as a therapeutic tool not just as movement recording device. In the future, additional testing will be done to evaluate FMED as a tool to evaluate the use of impaired hand during home-based therapy.
ACKNOWLEDGMENT
We would like to thank the subjects who participated in the study.
REFERENCES
[1] G. R. Williams, "Incidence and characteristics of total
stroke in the United States," BMC Neurol, vol. 1, p. 2,
Dec 18 2001.
[2] A. Turolla, M. Dam, L. Ventura, P. Tonin, M.
Agostini, C. Zucconi, et al., "Virtual reality for the
rehabilitation of the upper limb motor function after
stroke: a prospective controlled trial," J Neuroeng
Rehabil, vol. 10, p. 85, 2013.
[3] R. Goulding, D. Thompson, and C. Beech, "Caring for
patients with hemiplegia in an arm following a stroke,"
Br J Nurs, vol. 13, pp. 534-9, May 13-26 2004.
[4] J. C. Chen and F. Z. Shaw, "Progress in sensorimotor
rehabilitative physical therapy programs for stroke
patients," World J Clin Cases, vol. 2, pp. 316-26, Aug
16 2014.
[5] K. Potter, G. D. Fulk, Y. Salem, and J. Sullivan,
"Outcome measures in neurological physical therapy
practice: part I. Making sound decisions," J Neurol
Phys Ther, vol. 35, pp. 57-64, Jun 2011.
[6] D. U. Jette, J. Halbert, C. Iverson, E. Miceli, and P.
Shah, "Use of standardized outcome measures in
physical therapist practice: perceptions and
applications," Phys Ther, vol. 89, pp. 125-35, Feb
2009.
[7] D. Rand, J. J. Eng, P. F. Tang, J. S. Jeng, and C. Hung,
"How active are people with stroke?: use of
accelerometers to assess physical activity," Stroke, vol.
40, pp. 163-8, Jan 2009.
[8] R. G. Navarathnam, I. Y. Wang, D. Thomas, and P. L.
Klineberg, "Evaluation of the transcutaneous electrical
nerve stimulator for postoperative analgesia following
cardiac surgery," Anaesth Intensive Care, vol. 12, pp.
345-50, Nov 1984.
[9] R. P. Allred, S. Y. Kim, and T. A. Jones, "Use it and/or
lose it-experience effects on brain remodeling across
time after stroke," Front Hum Neurosci, vol. 8, p. 379,
2014.
[10] L. K. Simone, N. Sundarrajan, E. P. Elovic, X. Luo, Y.
Jia, and D. G. Kamper, "Measuring finger flexion and
activity trends over a 25 hour period using a low cost
wireless device," Conf Proc IEEE Eng Med Biol Soc,
vol. 1, pp. 6281-4, 2006.
[11] L. Dipietro, A. M. Sabatini, and P. Dario, "Evaluation
of an instrumented glove for hand-movement
acquisition," J Rehabil Res Dev, vol. 40, pp. 179-89,
Mar-Apr 2003.
[12] L. K. Simone, N. Sundarrajan, X. Luo, Y. Jia, and D.
G. Kamper, "A low cost instrumented glove for
extended monitoring and functional hand assessment,"
J Neurosci Methods, vol. 160, pp. 335-48, Mar 15
2007.
[13] S. Wise, W. Gardner, E. Sabelman, E. Valainis, Y.
Wong, K. Glass, et al., "Evaluation of a fiber optic
glove for semi-automated goniometric measurements,"
J Rehabil Res Dev, vol. 27, pp. 411-24, Fall 1990.
Figure 4: IIM results in days 1 and 2.
48Copyright (c) IARIA, 2015. ISBN: 978-1-61208-424-4
GLOBAL HEALTH 2015 : The Fourth International Conference on Global Health Challenges
60 / 101
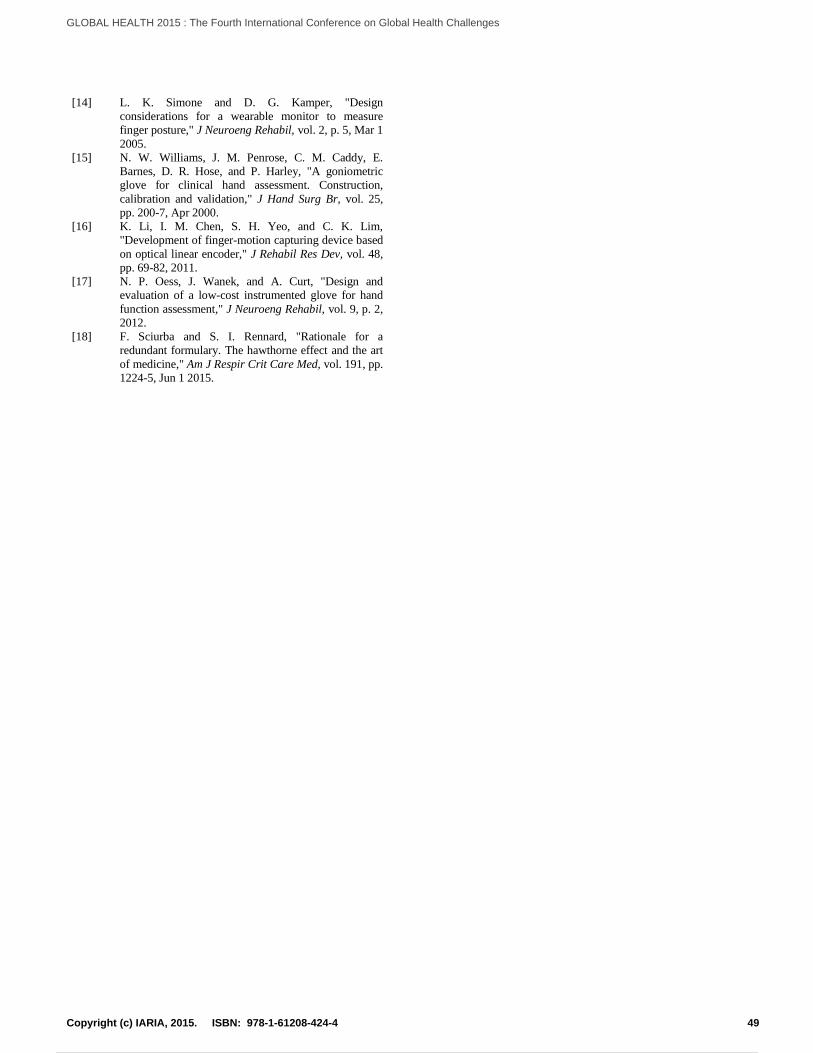
[14] L. K. Simone and D. G. Kamper, "Design
considerations for a wearable monitor to measure
finger posture," J Neuroeng Rehabil, vol. 2, p. 5, Mar 1
2005.
[15] N. W. Williams, J. M. Penrose, C. M. Caddy, E.
Barnes, D. R. Hose, and P. Harley, "A goniometric
glove for clinical hand assessment. Construction,
calibration and validation," J Hand Surg Br, vol. 25,
pp. 200-7, Apr 2000.
[16] K. Li, I. M. Chen, S. H. Yeo, and C. K. Lim,
"Development of finger-motion capturing device based
on optical linear encoder," J Rehabil Res Dev, vol. 48,
pp. 69-82, 2011.
[17] N. P. Oess, J. Wanek, and A. Curt, "Design and
evaluation of a low-cost instrumented glove for hand
function assessment," J Neuroeng Rehabil, vol. 9, p. 2,
2012.
[18] F. Sciurba and S. I. Rennard, "Rationale for a
redundant formulary. The hawthorne effect and the art
of medicine," Am J Respir Crit Care Med, vol. 191, pp.
1224-5, Jun 1 2015.
49Copyright (c) IARIA, 2015. ISBN: 978-1-61208-424-4
GLOBAL HEALTH 2015 : The Fourth International Conference on Global Health Challenges
61 / 101

Management System of Medical Equipment in Hospitals
M. Rammal, A. Jaffal, Mohamad Hajj-Hassan
Dept. of Biomedical Engineering
Lebanese International University
Beirut, Lebanon
31110078; [email protected],
Hassan M. Khachfe
Center for Quality Assurance, Institutional
Assessment, & Scientific Research
Lebanese International University
Beirut, Lebanon
Abstract— In the hospital, the management of medical
equipment is a series of activities from budget planning to
equipment disposing. The overall activities focus on issues such
as quality, safety, performance, cost, and profit. An efficient
and effective management system is necessary for supervising
these goals. The main problem faced in most of the Lebanese
hospitals is the over load that is applied from both paper work
and maintenance issues at the same time, resulting in
department breakdown and/or limitations. In this paper, we
show an equipment service life-cycle model applied in these
activities for in-house clinical engineering department, beside
an in-house cycle management, in addition to a tool of
communication with the other departments in the hospital.
Some information systems were built by the management
system and the information of management operations in
clinical engineering department can be systematically collected
and revealed at different life-cycle stages by these systems.
Through the management system, we can easily integrate the
management activities and improve medical care quality and
patient’s safety.
Keywords-Management system;communication;in-house
cycle management.
I. INTRODUCTION
Nowadays, the healthcare sector is indispensible to us in
order to maintaine a healthy life away from desease, but it is
very expensive. Hospitals, private or public, tend to ensure
the health service in every region on the Lebanese ground.
Various departments are present in each hospital that work
together to guarantee the safety of the patient beside the
appropriate medication and therapy. Depending on the
patient’s case, he/she will be transferred to one of the
departments and will remain there as long as necessaryto
complete treatment. Departments within the hospital are
divided into therapeutic, diagnostic, and service departments
[1]. Every part in the hospital is related to another, thus
linked together to form a strong chain to make sure that the
patient is better in his stay and nothing is missed in his
therapeutic period. Our concern is in the service sector, and
especially in the Biomedical Department which is
responsible for all the pieces of equipment in the hospital,
their history, specifications, failure, and cost. This is very
important in order to insure quality health survice to the
incoming patients.
Working as a biomedical engineer in a hospital requires
being able to handle multiple tasks in parallel, such as
technical issues and following up with different companies,
as well as managing paperwork. Problems are found in the
management part which is the result of hundreds or
thousands of papers on the engineer’s desk each month.
Papers consist of maintenance requests, transfer forms,
preventive maintenance requests, discard forms, etc.
The work mentioned increases the load on the
biomedical engineer who is probably the only one in the
department doing everything as a one man show. Paper
work take a lot of time and disperses the process of
parallelism mentioned previously [2]. On the other hand,
each three years, the biomedical engineering department
should be prepared with all these necessary data following
the Accreditation standards to be submitted to the Ministry
of Health. For that, all the requirements mentioned before
should be available and well organized at any time. And here is the importance of having a management
system that can control the cycle of this work between the departments and the biomedical department, and a tool that can be used to apply this management system [3].
The main goal of the proposed project is to develop a
management system that can organize the work pathway
between the main department which is the Biomedical, and
the secondary parts which are the hospital departments
(Emergency, Operating Room, Intensive Care, etc.). What
we mean by a management system is actually a process that
is controlled by the biomedical engineer to stay in contact
and updated with the secondary departments, which
provides an improved quality of healthcare delivered to the
patients. The system is ridden by a tool which is a software
divided into a server user and active users. The main
server/program is the biomedical engineer in the hospital.
Active users represent the departments found in the hospital.
Users can send maintenance requests, write transfer forms,
and apply a request for preventive maintenance or exams for
the staff. Each department, when using the program, is
restricted to the machines found in this department [4]. On
the other hand, the server can manage everything in all the
departments due to a database that consist of the history of
biomedical equipment. The server can also send
recommendations and actions to the requests sent. In
addition, the engineer can enter all the data that belongs to
each machine which result in a history record of each
50Copyright (c) IARIA, 2015. ISBN: 978-1-61208-424-4
GLOBAL HEALTH 2015 : The Fourth International Conference on Global Health Challenges
62 / 101
equipment from the moment bought reaching the discard
phase. Policies, procedures, and instructions of use are also
available in the software. Several processes (depreciation
value, repeated failure, etc.) will be implemented in the
program to help the engineer in some decisions he might
take.
Using this tool, the management system can be applied
easily upon controlling and gathering all the required data
beside tracking equipment, counting repeated failures and
taking critical decisions concerning hospital improvement
which is directly related to the patient’s safety and the
quality of the delivered healthcare services.
The following section (section II) will shed lights on
structure of the Lebanese hospitals with the biomedical
engineering’s tasks. Section III will cover the system design
and implementation. Results and discussion are stated in
section IV. Finally, the conclusion is set in section V.
II. HOSPITALS IN LEBANON
Hospitals in Lebanon are mainly divided into public and
private. Each hospital has its own divisions. Departments
within the hospital follow one of the three classes:
Therapeutic, diagnostic, or service. The Biomedical
department is one of the service departments that are not
only connected to all the other hospital departments, but
also to external parties such as companies and agencies.
The biomedical engineering departments should deliver
continuous learning about the proper use of medical
equipment to the doctors and nurses; communicate with the
vendors, hospital administration, third party payers, and
leasing agencies to take the right decision about the cost,
technical requirements, reliability, and future planning. On
the other hand, biomedical engineering department should
communicate with the hospital environment section to take
care of waste management, power, cabling, maintenance,
and safety.
Also, the department should insure the safety and
accepted medical practices to overcome the regulation
agencies. All of these connections are part of the daily tasks
of the biomedical department to ensure the quality of
healthcare delivered to the patient.
The connections shown in figure 1 are essential to
provide the best hospital environment with good equipment
management, active department’s communication,
following defined procedures of purchasing and
maintenance, etc., which all result in maximizing healthcare
quality and ensuring patient’s satisfaction.
All the mentioned tasks beside the paper work form a
huge responsibility on the biomedical engineer in the
hospital.
Since all these tasks, beside the paper work, are related, it
becomes essential to have a computer based management
system to facilitate the inter-communication between the
biomedical engineering department and all the other
departments to save the time consumed on paper work and
helps in decision making.
III. SYSTEM DESIGN AND IMPLEMENTATION
A Hospital Management System is a way for making the
management inside the hospital paperless. This includes the
clinical, back office, and generic management of all
activities. It integrates the entire resources of a hospital into
one integrated software application. The most important
benefits that the biomedical engineering department gains
from this management system are: minimizing manpower
requirements, instant information retrieval, and timely
treatment decisions.
It’s a well know fact that there is no common hospital
management system applied worldwide [6]. Each country
has a certain system applied in some of its hospitals based
on the country’s conditions and standards from one side,
and the hospital’s profession, level, and type from the other
side.
An existing management system in Michigan is based on
dividing the biomedical department and the hospital
equipment into several subdivisions [7]. Also, the
management system applied in New Delhi defines the
maintenance categories, as well as defining the function and
the troubleshooting process of various medical equipment
[8]. In Kenyan hospitals, a software is developed and
installed in each department to identify the equipment fault
and reports the possible personnel to handle it [9].
Our management system for the Lebanese hospitals
should consist of:
A. Number of Staff:
The number of staff varies according to the number of beds in the hospital as shown in table I.
According to the number of beds within the hospital, the number of staff can be easily calculated such that every 100 beds need one biomedical engineer and one biomedical technician [7] [8].
Figure 1.Connections of the biomedical department with inner and outer
hospital environment [5].
51Copyright (c) IARIA, 2015. ISBN: 978-1-61208-424-4
GLOBAL HEALTH 2015 : The Fourth International Conference on Global Health Challenges
63 / 101

TABLE I. Number of biomedical engineering staff with the corresponding
number of beds.
B. Roles and Responsibilities:
Biomedical Technician: Different tasks are assigned to the biomedical technician in the biomedical engineering department. He is the biomedical engineer’s assistant, responsible for daily checkup mainly for the life support equipment such as defibrillators, anesthesia machines, etc., to make sure that everything is normal and ready for functioning. Checking the medical gases, such as oxygen, nitrogen, and compressed air to ensure the volume and pressure of each is also one of the biomedical technician’s tasks. On the other hand, the technician should follow up the temperature in some of the departments like Cath Lab, CT scan, MRI, etc… and the level of Reverse Osmosis (RO) water and the corresponding Total Dissolved Substances (TDS) and make sure the normal functioning of the autoclaves as well.
Biomedical Engineer: The Biomedical engineer should set the maintenance schedule that is composed of two parts: Planed Preventive Maintenance (PPM), and Corrective Maintenance (CM), to guarantee the efficiency and accuracy beside the normal function of medical equipment in the hospital. Moreover, the engineer is responsible for the stocks that contains the spare parts and stand by items and check for the missing/needed ones to order them. Designing new department, equipment installation, meeting with companies, and new equipment planning are also tasks assigned for the biomedical engineer in the hospital.
Software: The software is the tool for applying the hospital management system. It is developed using vb.net language. The software is based on
Administrator-Client Inter-phase [9]. The administrator is the biomedical engineering department, whereas the client may be any other department within the hospital. In figure 2, the front page of the administrator’s software is shown.
The biomedical department represents the head of the management system software. The other departments are the clients in this software. The software consists of:
- List of Equipment: It lists the medical equipment found in each department with the corresponding details about the location room, serial number, hospital code, model, brand, purchasing date, price, and the availability of the operating manual. Also, a list of the discarded equipment/accessory in each department is available. Figure 3 illustrates the list of equipment found in the ground floor of the hospital with all the corresponding details that can be seen by both the engineering and the relative department.
- Requests: Requests are divided into maintenance requests and transfer requests. The administrator (Biomedical Department) receives requests sent from any other department. The maintenance request contains all the information about the equipment in addition to the failure date, time, type, description, expected maintenance duration, current status, finish date, and accessories needed. The transfer request consists of all the information about the equipment in addition to time, date, and duration of transfer, and the targeted location beside the reason of transfer.
- PM Schedule: Figure 4 shows the PM schedule set by the biomedical engineering department. PM schedule is divided into internal (In-house), and external (company) preventive maintenance. The
Figure 2.The front page of the administrator’s (Biomedical Department)
software.
Figure 3.The ground floor's list of equipment software layout.
52Copyright (c) IARIA, 2015. ISBN: 978-1-61208-424-4
GLOBAL HEALTH 2015 : The Fourth International Conference on Global Health Challenges
64 / 101
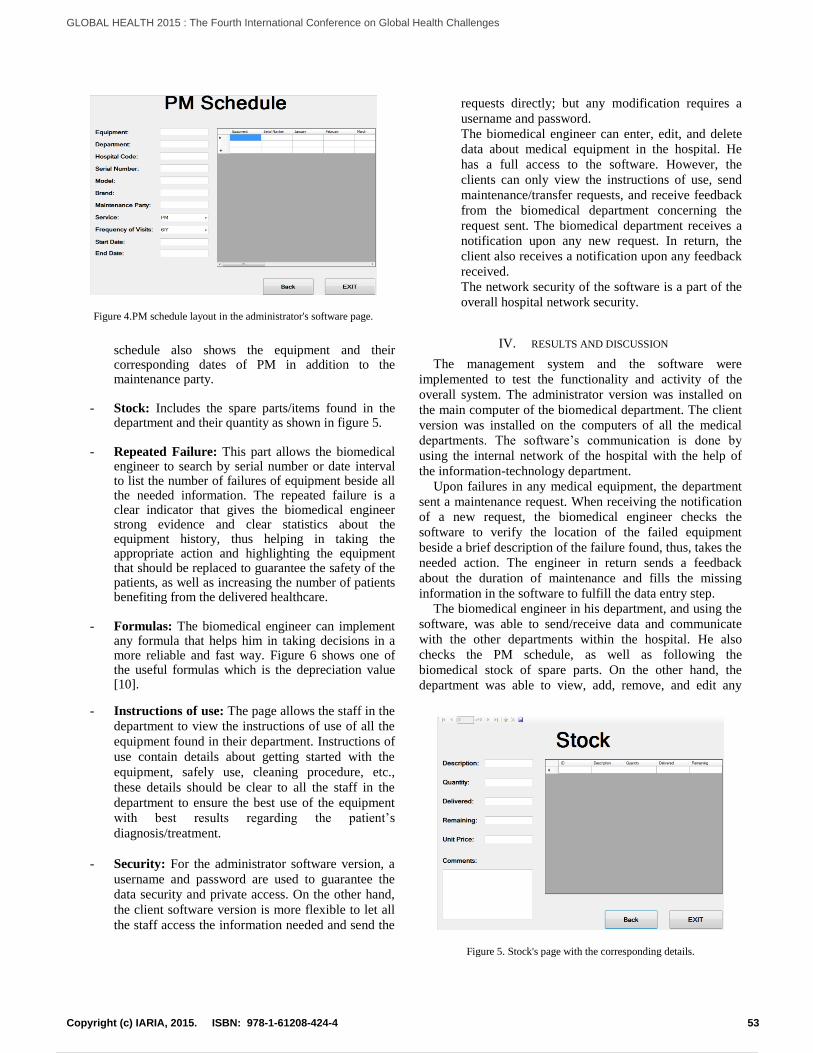
schedule also shows the equipment and their corresponding dates of PM in addition to the maintenance party.
- Stock: Includes the spare parts/items found in the
department and their quantity as shown in figure 5.
- Repeated Failure: This part allows the biomedical engineer to search by serial number or date interval to list the number of failures of equipment beside all the needed information. The repeated failure is a clear indicator that gives the biomedical engineer strong evidence and clear statistics about the equipment history, thus helping in taking the appropriate action and highlighting the equipment that should be replaced to guarantee the safety of the patients, as well as increasing the number of patients benefiting from the delivered healthcare.
- Formulas: The biomedical engineer can implement
any formula that helps him in taking decisions in a more reliable and fast way. Figure 6 shows one of the useful formulas which is the depreciation value [10].
- Instructions of use: The page allows the staff in the
department to view the instructions of use of all the
equipment found in their department. Instructions of
use contain details about getting started with the
equipment, safely use, cleaning procedure, etc.,
these details should be clear to all the staff in the
department to ensure the best use of the equipment
with best results regarding the patient’s
diagnosis/treatment.
- Security: For the administrator software version, a
username and password are used to guarantee the
data security and private access. On the other hand,
the client software version is more flexible to let all
the staff access the information needed and send the
requests directly; but any modification requires a
username and password.
The biomedical engineer can enter, edit, and delete
data about medical equipment in the hospital. He
has a full access to the software. However, the
clients can only view the instructions of use, send
maintenance/transfer requests, and receive feedback
from the biomedical department concerning the
request sent. The biomedical department receives a
notification upon any new request. In return, the
client also receives a notification upon any feedback
received.
The network security of the software is a part of the
overall hospital network security.
IV. RESULTS AND DISCUSSION
The management system and the software were
implemented to test the functionality and activity of the
overall system. The administrator version was installed on
the main computer of the biomedical department. The client
version was installed on the computers of all the medical
departments. The software’s communication is done by
using the internal network of the hospital with the help of
the information-technology department.
Upon failures in any medical equipment, the department
sent a maintenance request. When receiving the notification
of a new request, the biomedical engineer checks the
software to verify the location of the failed equipment
beside a brief description of the failure found, thus, takes the
needed action. The engineer in return sends a feedback
about the duration of maintenance and fills the missing
information in the software to fulfill the data entry step.
The biomedical engineer in his department, and using the
software, was able to send/receive data and communicate
with the other departments within the hospital. He also
checks the PM schedule, as well as following the
biomedical stock of spare parts. On the other hand, the
department was able to view, add, remove, and edit any
Figure 4.PM schedule layout in the administrator's software page.
Figure 5. Stock's page with the corresponding details.
53Copyright (c) IARIA, 2015. ISBN: 978-1-61208-424-4
GLOBAL HEALTH 2015 : The Fourth International Conference on Global Health Challenges
65 / 101

equipment with its details using the list of equipment part in
the software.
Things were better using the software. Time was saved in
a great way with less paper work and reduction of over tasks
that were due the responsibilities of the biomedical
department.
The most important thing was that everything was ready
for the accreditation that is done by the Lebanese Ministry
of Health approximately each three years.
As a result, the management system and the software
achieved the mentioned tasks and diminish the problem
stated at the beginning of this paper in a computerized way
based on databases and inter-communication between the
biomedical and other hospital departments.
V. CONCLUSION
The implementation of this management system in the
Lebanese hospitals can ensure the proper functioning of the
biomedical department in the hospital since it saves time,
archive data, helps in decision making, and make reviewing
the medical equipment history easy. Besides, the system
activates the inter-communication between the biomedical
department and the other departments, sets the work
pathway, and organizes all the data that the biomedical
engineer needs.
REFERENCES
[1] P. Debra Ferenc, Understanding Hospital Billing and Coding,
Third Edition, 2014J. Clerk Maxwell and A Treatise on Electricity and Magnetism, 3rd ed., vol. 2. Oxford: Clarendon, 1892, pp.68–73.
[2] Holleman, L. Warren, Cofta-Woerpel, M. Ludmila, Gritz, and R. Ellen, “Stress and Morale of Academic Biomedical Scientists”.
[3] World Congress on Medical Physics and Biomedical Engineering, Beijing, China, IFMBE Proceedings 2013, Volume 39, May 26-31, 2012, pp 799-802.
[4] Kevin McGowan, Analytical Sciences, Inc, “Using Visual Basic® to Customize a Set of SAS® reports”, Paper 164-27
[5] Hari Balasubramanian On delays in access to care in American hospitals, Monday, March 17, 2014 M. Young, The Technical Writer’s Handbook. Mill Valley, CA: University Science, 1989.
[6] Abdo Jurjus, Focal Point for Health Research MOPH, “Health Research in Lebanon: a country report”, Cairo, June 2000
[7] Jennifer Nolan, Chair, Equipment Management Committee, “The university of Michigan hospital and health centers equipment management plan”, 2010
[8] Ministry of Health and Family Welfare, “Medical Equipment Maintenance Manual”, New Delhi, October 2010.
[9] David Mutia, John Kihium, and Stephen Maranga, “Developing an In-house Computerized Maintenance”, Kenya, 2012, No 3, Vol 2.
[10] Birittani Sponaugle, JUNE 3, 2014, “Depreciation Expense: Caluculate and Understand Fixed Asset Value”.
Figure 6.Depreciation value is one of the implemented formulas in the
software.
54Copyright (c) IARIA, 2015. ISBN: 978-1-61208-424-4
GLOBAL HEALTH 2015 : The Fourth International Conference on Global Health Challenges
66 / 101

Automatic Measurement of Pronation/Supination, Flexion/Extension
and Abduction/Adduction Motion of Human Limbs using
Wearable Inertial and Magnetic Sensors
Irvin Hussein Lopez-Nava1, Francisco Marquez-Aquino1,2, Angelica Munoz-Melendez1,David Carrillo-Lopez1, and Hector Simon Vargas-Martınez2
1Instituto Nacional de Astrofısica, Optica y ElectronicaLuis Enrique Erro 1, Tonantzintla, Pue. Mexico
2Universidad Popular Autonoma del Estado de Puebla21 Sur 1103, 72410 Puebla, Pue. Mexico,
Emails: hussein, fmarquez, munoz, [email protected]@upaep.mx
Abstract—This research deals with the design and program-ming of devices for measuring automatically human motion usingportable and low-cost technologies. The movements studied in thisresearch are pronation/supination, flexion/extension and abduc-tion/adduction of the upper and lower limb, which are requiredfor a number of activities of daily living. A home-made attitudeand heading reference system based on inertial and magneticsensor is presented. It was compared with a similar deviceavailable in the market, and with respect to a video-camera basedsystem used as gold standard. An experimental platform wasalso built for controlling and replicating experiments. The resultsobtained by the proposed device are competitive and promisingwith a general performance comparable to a commercial device.
Keywords- ubiquitous healthcare; real-time medical datacollection; systems for measuring tissue parameters.
I. INTRODUCTION
This research focuses on designing automatic methodsand technologies for long-term and continuous monitoringof human motion related to functional activities of dailyliving, namely pronation/supination flexion/extension and ab-duction/adduction of upper and lower limbs.
The pronation/supination describes the motion of a radioul-nar articulation such as the wrist and comprise the pronationor internal rotation, and the supination or external rotation,palm-down and palm-up for the wrist, respectively. The flex-ion/extension describes the motion around a hinge joint such asthe elbow and comprise the flexion, a bending movement thatreduces the angle between the segments linked by the joint,and the extension or straightening movement that increases theangle between the linked segments. The abduction/adductiondescribes the motion away and towards a midline, such as theaxis of the body, it comprises the abduction or movement ofarms or legs, for instance, out to the side, and the adductionor movement to bring the limbs back in.
The movements of pronation/supination andflexion/extension are required for a number of activitiesof daily living such as feeding, handwriting, typing, pickingup and holding objects, just to mention examples involving
the upper limb [1], whereas abduction/adduction of the lowerlimb plays an important role in activities such as walkingand running. In general, these movements are importantwhen assessing functional abilities, determining therapeuticintervention or athletic programs for enhancing skills, andare also relevant signs for neuromotor development andneuromotor function associated with aging [2].
The measurement of pronation/supination,flexion/extension and abduction/adduction for assessingfunctional abilities relies commonly on both, goniometricmeasurements and the observation of physicians and trainedtherapists, that do not ensure a uniform assessment.
Nowadays, portable inertial and magnetic sensors as well aspowerful, inexpensive and tiny micro-processors enable the de-velopment of wearable technologies for measuring movementrelated to functional abilities on a long-term and continuousbasis. Also, these conditions offer a unique opportunity toreach broad segments of the population. These devices areknown as Attitude and Heading Reference Systems (AHRS).
It is worth to mention that commercial AHRS present twomain drawbacks. First, they are developed as black boxes,offering limited possibilities for extending or adapting themto user’s needs. And second, commercial AHRS are usuallygeneral-purpose devices that are not specifically intended formeasuring human motion. Therefore, we strongly believe thatdeveloping a home-made AHRS is a way to overcome theselimitations.
This article describes the design of a home-made AHRS(HM-AHRS) using inertial and magnetic sensors. The HM-AHRS is programmed to automatically estimate its orientationfrom which a joint angle is deduced. It was evaluated usinga set of tests of pronation/supination, flexion/extension andabduction/adduction movements. A specific platform for con-ducting these tests was built. Eight people participated in thetests; they worn both our HM-AHRS and a commercial AHRS,a LPMS-B device (LP-research, Japan). Simultaneously, move-ments of individuals were tracked by a video-camera basedsystem. Our HM-AHRS obtained competitive results.
55Copyright (c) IARIA, 2015. ISBN: 978-1-61208-424-4
GLOBAL HEALTH 2015 : The Fourth International Conference on Global Health Challenges
67 / 101

The main contribution of this research is the implementa-tion of an AHRS device from the scratch with a performancecomparable to a commercial AHRS in the measurement ofhuman motion, namely pronation/supination, flexion/extensionand abduction/adduction of upper and lower limbs. This is achallenging problem and it also poses issues such as the lackof external references, the deformation and stress of soft tissue,and the noise and drift that usually affect inertial sensors.
The rest of this paper is organized as follows: Section IIrevises the most significant related work. Section III describesthe design, implementation and programming of our HM-AHRS. Section IV presents and discusses the results that wereobtained. Finally, Section V gives concluding remarks andsome perspectives of this research.
II. RELATED WORK
In this section we briefly revise significant related work.Lee et al. [3] designed an array of accelerometer-based
nodes to measure flexion/extension of upper limb. Their de-vice is tested first on a programmable rotary stage and thencompared to an electro-mechanical goniometer in experimentsinvolving one individual. The power consumption of the nodesand communication issues are also investigated in this research.Namely, the latency of a system comprising various nodes formeasuring simultaneously multiple joints is calculated withinteresting results.
El-Gohary and McNames [4] combined two inertial mea-surement units containing each one a triaxial accelerometer anda triaxial gyroscope, and kinematic models to control roboticmanipulators to estimate human joint angles. The proposedmethod was tested for pronation/supination movement of theforearm, abduction/adduction movement of the shoulder, andflexion/extension of the elbow, using eight subjects performingnormal and fast movement. Also, it was evaluated against anoptical reference system with good results. A similar solutionwas studied by Zhou et al. [5].
Zhang et al. [6] focused on the problems of inertial driftand acceleration interference that affect inertial and magneticsensors. They proposed schemes for filtering and data fusion,and conducted tests for tracking motion of upper limb us-ing an array of three units of triaxial inertial and magneticsensors. The outcome of the proposed method in representedas quaternions, that are directly compared to the outcome ofa reference system, a BTS SMART-D optical motion tracker(BTS BioEngineering, Italy) involving one individual.
Kaneko et al. [2] developed a portable evaluation systemfor pronation/supination movement of the forearm using fourwireless inertial sensors. From the obtained measurements ref-erence curves for both, neuromotor development for childrenand changes in neuromotor function for adults are obtained.Even though the cited system has been extensively tested, withseveral hundreds of subjects, any alternative device or systemis considered to compare its performance.
Bonroy et al. [7] developed a brace to measure flex-ion/extension movement of the knee using two accelerometersand one inductive sensor for static and dynamic measurement,respectively. These measurements are used to classify physicalactivities of ten healthy subjects, such as walking, ascendingand descending of stairs, and fast locomotion. Previously, the
system was compared against a Vicon optical motion capturesystem (Vicon Motion Systems, UK) with competitive results.However, the authors focused on classifying activities basedon pattern detection in form of peaks.
Lambrecht and Kirsch [8] implemented an AHRS moduleusing inertial and magnetic sensors. Two variations of AHRSwere tested, one relying only on inertial sensors and onerelying on both inertial and magnetic sensors, and comparedagainst an active-marker motion capture system, OptotrakCertus (NDI, Canada). The range of movements tested in thisresearch is wide and comprises seven degrees of freedom ofupper limb, i.e., azimuth, elevation and internal rotation ofshoulder; elbow flexion; forearm pronation; and flexion anddeviation of wrist. The results that were obtained are verygood, however tests were conducted using only one individual.
In contrast to previous work, four important features of oursystem can be highlighted: (1) it relies only on one inertialand magnetic measurement unit; (2) the same method is usedto measure pronation/supination, flexion/extension and abduc-tion/adduction of upper and lower limbs; (3) its performanceis compared with an analog device and with respect to agold standard based on a video-camera tracking system; and(4) it was tested with a group of people, in this case eightindividuals.
III. MEASUREMENT OF PRONATION/SUPINATION,FLEXION/EXTENSION AND ABDUCTION/ADDUCTION
This section is divided into two parts. The first one providestechnical details of the instruments used in this researchand describes also the experimental settings. The second onesummarizes the methods and algorithms that were programedin our HM-AHRS.
A. Setup
This part describes the physical components and conditionsof the experiments conducted for our research.
1) Measurement Instruments: Two different devices AHRSwere used, our HM-AHRS and a LMPS-B. A video-camerabased system to calculate ground truth values was also used.Both AHRS devices as well as the video-camera based systemoperate with a sampling rate of 50 Hz. In all the experimentsdescribed in this research both devices AHRS were wornsimultaneously by the subjects, and meanwhile the experimentswere recorded by the video-camera based system. More spec-ifications of these instruments are detailed below.
• HM-AHRS. The Home-Made Attitude and HeadingReference System comprises an ArduIMU v3 (3DRobotics, USA) with three different MEMS sensors(3-axis gyroscope, 3-axis accelerometer and 3-axismagnetometer), on-board Atmega328 microprocessorrunning at 16MHz, bluetooth RN-42 communicationmodule for distances up to 20m, and a lithium batteryof 3.7V at 1000mAh. The approximate weight of HM-AHRS is 35g.
• LPMS-B. The LP-Research Motion Sensor Bluetoothversion is a miniature wireless inertial measurementunit (IMU) / attitude and heading reference system(AHRS). This device includes three different MEMS
56Copyright (c) IARIA, 2015. ISBN: 978-1-61208-424-4
GLOBAL HEALTH 2015 : The Fourth International Conference on Global Health Challenges
68 / 101

sensors: 3-axis gyroscope, 3-axis accelerometer and 3-axis magnetometer. Its communication distance scopeis 18m, it has a lithium battery of 3.7V at 800mAh,and it weights 34g.
• Video-camera based system. The video system con-sists of both, video-camera and tracker software. Thevideo-camera is a Nikon D5200 with 24.1MP CMOSsensor and Full HD (1900×1080p) video recording.The tracker software is a free video analysis andmodeling tool built on the Open Source Physics (OSP)Java framework, able to track a visual mark andcalculate its orientation with respect to a given axis.
2) Experimental settings: To perform pronation/supination,flexion/extension and abduction/adduction tests, an experimen-tal platform was designed and built. It consists of a translucentrectangular frame of 80×80cm and a weight of 3kg, with arotatory circular plate in the middle with visual marks andlimit stops (see Figure 1(a)). These stops can be manuallyadjusted and set on arcs of 30 and 60 degrees. Additionally,the rotatory plate has three handles for short frontal (prona-tion/supination test of forearm), short lateral (flexion/extensiontest of forearm and shank) and large lateral (flexion/extensionand abduction/adduction tests of arm and thigh) movements,as illustrated in Figures 1(b), 1(c), 1(d).
A sketch of the general setup involving the measurementinstruments and the experimental platform used in our researchis given in Figure 2. It is important to notice that all estimationsare made locally by AHRS devices, and the server is only incharge of data acquisition for further comparison.
B. Methods
1) Subjects and conditions: Eight asymptomatic subjectsparticipated in the tests, 6 men and 2 women, with a meanage of 27.3 (±5.07) years, and a height of 1.69 (±0.08) m.All subjects gave their informed consent to participate in theseexperiments.
Both AHRS devices were placed on the forearms of testsubjects using an adjustable elastic band with axes manuallyaligned previously using a mechanical goniometer. To neutral-ize the movement of the shoulder a belt attached to the bodyat the level of the breast was used.
Since both devices are wireless there is no need of addi-tional cables that might obstruct the movement of the limbs.
Each subject performed two sets of movements for these:pronation/supination of the forearm; flexion/extension of fore-arm and arm; flexion/extension of thigh and shank; abduc-tion/adduction of the arm and thigh.
For the first set of movements involving upper limb, sub-jects were asked to repeat systematic movements within an arcof 60 degrees at normal speed, and for those involving lowerlimb, subjects were asked to repeat systematic movementswithin an arc of 30 degrees at normal speed. For the secondset of all sort of movements, subjects were asked to performfreely movements at their own pace. These movements wereperformed by the subjects in random order.
Since all the instruments utilized to measure angles operateindependently, a post-processing for synchronizing datasetswas applied. A controlled start time for each instrument was
(a) Experimental platform
(b) Pronation/Supination test
(c) Flexion/Extension test
(d) Abduction/Adduction test
Figure 1. Details of the experimental platform and measured move-ments.
57Copyright (c) IARIA, 2015. ISBN: 978-1-61208-424-4
GLOBAL HEALTH 2015 : The Fourth International Conference on Global Health Challenges
69 / 101

Figure 2. Setup of experiments.
established, for aligning independent signals in function oftime; the start time was also used to adjust the initial magnitudeof the instruments, 90 degrees for pronation/supination and 0degrees for flexion/extension and abduction/adduction tests.
2) Algorithm: Inertial and magnetic sensors comprised inAHSR devices calculate linear acceleration, angular velocityand magnetic fields. Even though calculating angles from thesevalues is possible, by applying for instance a straightforwardintegration of multiple readings of linear acceleration, theresulting value is subject to inaccuracy, specially over longperiods of time. In effect, these sensors produce highly vari-able signals and they are susceptible to noise, for instanceaccelerometers and gyroscopes are affected by drift whereasmagnetometers are affected by magnetized objects.
To the previously mentioned technical limitations of thesensors of AHRS devices, two issues that increase the com-plexity of the problem of measuring pronation/supination,flexion/extension and abduction/adduction motion must be alsoconsidered. The first one is tracking moving objects withoutany external reference to which the system can be tied. And thesecond is measuring motion of objects affected by deformationand stress of soft tissue.
For these reasons, algorithms for AHRS devices typicallycombine evidences provided by both, inertial and magneticsensors, to improve the accuracy of estimations, and applyself-calibration and filters to reduce or compensate noise. Thisis also the way in which our AHRS has been programmed,which is based on complementary filtering.
Our algorithm is divided into three main stages: (1) cal-ibration, (2) estimation, and (3) correction. The algorithm issketched in Figure 3 and the main stages are described below.
• Calibration. For calibrating inertial sensors they mustbe exposed to various situations and then measure theactual error.In our case, the calibration of the accelerometer isdone in this way, the sensor is moved gently in allpossible orientations. For each axis, the maximumand minimum values from the obtained readings areidentified, a range and the mean of the range aredetermined from these thresholds. Next, the error oroffset is calculated by subtracting the mean to theknown value of gravity, that is 1g. Once calculatedthe offset it will be subtracted from the raw readingsfrom the accelerometer.For the calibration of the gyroscope an average of
readings while the sensor is static is first calculated,the offset. Then, the offset is subtracted from the rawreadings from the gyroscope.The calibration of the magnetometer to reduce thedistortion of the magnetic field is a bit more intricatethan previous ones. It comprises one similar stepwhere the sensor is turned in all possible orientationsand then an average error or offset is calculated foreach axis. The second step requires the calculation ofa rotating matrix to multiply the actual readings ofthe sensor, distributed in the shape of an ellipsis, andtransforming the distribution into a sphere. These stepsare known as correction of hard and soft iron errors,respectively.The stage of calibration is made once (step 1 of thealgorithm) and must be recalculated each time theexperimental conditions have changed.
• Estimation. In this stage, a first calculation of anglesis performed. Since this calculation is inaccurate andis revised in a next stage, these values are consideredas “estimations”.In our case, the initial readings from sensors are ob-tained (step 2). From the readings from the accelerom-eter and magnetometer, a rotation matrix known asthe Direction Cosine Matrix (DCM ) is calculated(step 3). Then the rotation matrix is updated using thereadings from the gyroscope (step 4). The readingsfrom the gyroscope are integrated taking into accounta measurement error (Me). Initially Me is equal to 0and is updated in a subsequent stage. Finally, the rota-tion matrix is normalized to preserve its orthogonality(step 5).
• Correction. In this stage, estimations are corrected byapplying known error models of the sensors.In our case, the drift error is corrected by using thereadings from both, accelerometer and magnetometer,taking into account known errors of these sensors (step6). In our algorithm, this value was obtained fromthe data sheet of the sensors. With these values, themeasurement error Me is updated (step 7). Then Eulerangles are calculated from the rotation matrix (steps8 and 9).
The stages of estimation and correction are alternated fromnow on from step 2. The measurement error calculated in step7 becomes the known error in the next iteration.
IV. RESULTS AND DISCUSSION
One hundred and twelve sets were processed in total(16 for the experiments of pronation/supination, 64 for flex-ion/extension, and 32 for abduction/adduction), all comprisingthe angles calculated by three sources: (1) the commercialAHRS, a LPMS-B device, (2) our HM-AHRS, and (3) thevideo-camera based system or gold standard.
The root-mean-square error (RMSE) between the estimatedvalues of AHRS devices and the ground-truth values, as well asthe Pearson product-moment correlation coefficient (PCC) forthe same values were calculated. Tables I, II and III summarizethe results per treatment (arcs of 60 degrees for upper limb and30 degrees for lower limb, and also free movements for bothlimbs).
58Copyright (c) IARIA, 2015. ISBN: 978-1-61208-424-4
GLOBAL HEALTH 2015 : The Fourth International Conference on Global Health Challenges
70 / 101

Figure 3. Algorithm used to calculate AHRS orientation, andthen angles of pronation/supination, flexion/extension and abduc-tion/adduction movements. L is an index of iterations.
Two remarks can be highlighted from these tables. First,there is a very good agreement between the estimations madeseparately by independent devices with respect to the ground-truth values, as can be seen in the high correlation betweenthe compared values (columns PCC). Second, the performanceof both AHRS devices is quite similar, according to the meanerror calculated for treatment (columns oRMSE).
On average, the LPMS-B device is up to 0.35 angle moreaccurate than the HM-AHRS device for small arcs (30o) for alltreatments, whereas for larger arcs (60o and free movements)the scores of both devices are close. There is a difference ofup to 0.55 and 1.13 degrees for movement within arcs of 60o
and free movement, respectively.These results were obtained from experiments that lasted
short periods of time, as usually required for assessing func-tional activities in laboratories. Longer tracking periods aremore prone to errors and noise, and more sensitive self-calibration methods and filters must be designed for correctingthese drawbacks and enabling AHRS devices for daily uses.
However, it is worth to remark that our HM-AHRSachieved a performance comparable with a commercial AHRS,according to a video-camera based system using a standardsoftware for optical tracking.
TABLE I. RESULTS OF PRONATION/SUPINATION EXPERI-MENT. IN THE COLUMN Treatment, f STANDS FOR FORE-ARM.
LPMS-B HM-AHRSTreatment oRMSE mean (SD) PCC oRMSE mean (SD) PCC
f/60o 4.81 (0.98) 0.98 4.62 (1.03) 0.99f/Free 9.78 (2.42) 0.99 9.11 (1.78) 0.98
TABLE II. RESULTS OF FLEXION/EXTENSION EXPERIMENT.IN COLUMN Treatment, f STANDS FOR FOREARM, a FORARM, t FOR THIGH AND s FOR SHANK.
LPMS-B HM-AHRSTreatment oRMSE mean (SD) PCC oRMSE mean (SD) PCC
f/60o 2.35 (0.59) 1.00 2.90 (0.59) 1.00f/Free 3.63 (0.85) 1.00 4.76 (2.04) 1.00a/60o 2.51 (0.61) 0.99 2.32 (0.66) 1.00a/Free 3.63 (1.04) 0.99 3.26 (0.97) 1.00t/30o 2.30 (0.73) 0.99 2.56 (0.71) 0.98t/Free 2.79 (0.81) 0.99 2.91 (0.80) 0.99s/30o 1.57 (0.50) 0.99 1.63 (0.45) 0.99s/Free 2.60 (0.47) 0.99 2.98 (1.04) 0.99
TABLE III. RESULTS OF ABDUCTION/ADDUCTION EXPERI-MENT. IN THE COLUMN Treatment, a STANDS FOR ARMAND t FOR THIGH.
LPMS-B HM-AHRSTreatment oRMSE mean (SD) PCC oRMSE mean (SD) PCC
a/30o 2.17 (0.49) 1.00 2.37 (0.94) 1.00a/Free 3.30 (0.99) 1.00 2.69 (0.97) 1.00t/30o 1.79 (0.43) 0.99 2.14 (0.61) 0.99t/Free 1.96 (0.51) 0.99 2.19 (0.69) 0.99
V. CONCLUSION AND PERSPECTIVES
The design of an HM-AHRS device for measuring humanmotion is presented. Designing and programming our owntool is a decision made by our group to address the complexproblem of measuring angles of human motion.
The HM-AHRS device relies on inertial and magneticsensors, and a simple complementary filter running on a micro-processor embedded in the device. The HM-AHRS was testedwith a group of real people for measuring pronation/supination,flexion/extension and abduction/adduction movements of theupper and lower limbs. It was compared to a commercialAHRS device from LP-research, and with respect to ground-truth values provided by a video-camera based system. An ex-perimental platform was also designed and built for controllingand replicating experiments.
The results obtained by our device are very competitive,with a general performance comparable to a black box basedon a commercial device.
The device described in this article is part of an on-going research whose goal is to design reliable and low-cost devices for enhancing human-computer interaction forapplications such as serious games, exergames, and interfacesfor rehabilitation systems. In all these examples, the propermeasurement of pronation/supination, flexion/extension andabduction/adduction movement of upper and lower limbs isconsidered crucial for designing reliable technologies.
59Copyright (c) IARIA, 2015. ISBN: 978-1-61208-424-4
GLOBAL HEALTH 2015 : The Fourth International Conference on Global Health Challenges
71 / 101

In the near future, we will work on the improvementof filters to better track human motion over longer periods.For that, more complicated filters such as Kalman filter isconsidered.
We will extend our work to combine the estimations madeby pairs of our HM-AHRS device in order to calculate jointangles in which both anatomical references are dynamic, i.e.,for knee angle two AHRS devices are placed on thigh andshank, and angles are measured while both segments are inmovement. These studies involve significant computationalchallenges, such as writing simple algorithms for local com-putation, establishing real-time communication among vari-ous AHRS devices, improving calibration, and incorporatingsensors and methods for self-detecting a proper alignment ofvarious devices, among others.
REFERENCES
[1] B. Cimatti, A. M. Marcolino, R. I. Barbosa, and M. C. Registro, A studyto compare two goniometric methods for measuring active pronation andsupination range of motion, “Hand Therapy”, 18(2), 2013, pp. 57-63.
[2] M. Kaneko et al., A measurement of a motion of pronation and supinationof forearm for healthy subjects using wireless acceleration and angularvelocity sensors, “World Congress on Medical Physics and BiomedicalEngineering, IFMBE Proceedings 39”, 2013, pp. 700-703.
[3] G. X. Lee, K. S. Low, and T. Taher, Unrestrained measurement of armmotion based on wearable wireless sensor network, “IEEE Transactionsof Instrumentation and Measurement”, 59(5), 2010, pp. 1309-1317.
[4] M. El-Gohary and J. McNames, Shoulder and elbow joint angle trackingwith inertial sensors, “IEEE Transactions on Biomedical Engineering”,59(9), 2012, pp. 2635-2641.
[5] H. Zhou, T. Stone, and H. Hu, Use of multiple inertial sensors in upperlimb motion tracking. “Medical Engineering & Physics” 30, 2008, pp.123-133.
[6] Z. Q. Zhang, L. Y. Ji, Z. P. Huang, and J. K. Wu, Adaptive informationfor human upper limb movement estimation, “IEEE Transactions onSystems, Man, and Cybernetics - Part A: Systems and Humans”, 42(5),2012, pp. 1100-1108.
[7] B. Bonroy, K. Meijer, P. Dunias, K. Cuppens, R. Gransier, and B.Vanrumste, Ambulatory monitoring of physical activity based on kneeflexion/extension measured by inductive sensor technology, “BiomedicalEngineering”, vol. 2013, 2013, article ID 908452.
[8] J. M. Lambrecht and R. F. Kirsch, Miniature low-power inertial sensors:promising technology for implantable motion capture systems, to bepublished in “IEEE Transactions on Neural Systems and RehabilitationEngineering”, 22(6), 2014, pp. 1138-1147.
60Copyright (c) IARIA, 2015. ISBN: 978-1-61208-424-4
GLOBAL HEALTH 2015 : The Fourth International Conference on Global Health Challenges
72 / 101
Personalize Systems for Psychological Evaluation Performance and Vigilance Monitoring
Marek Penhaker, Radka Jeziorska Department of Cybernetics and Biomedical Engineering,
VSB-Technical University of Ostrava, FEECS Czech Republic
e-mail: [email protected], [email protected]
Vilem Novak, Katerina Panackova Children Neurology Clinic
University Hospital Ostrava, Czech Republic Czech Republic
e-mail:[email protected] , [email protected]
Abstract - This work deals with the monitoring of sleep
deprivation, sleep disorders and investigative methods for their diagnosis. The aim of this work was to develop an algorithm for measuring and evaluating mental performance and vigilance tested. Computer based program consists of six tasks that tested memory, reaction time, coordination of movement and level of sleepiness using the Epworth Sleepiness Scale. Sixty measurements were performed using the above mentioned program. These data were statistically processed and characteristic values were determined for a select group of healthy people. For the creation of the program, the Visual C# development environment was used, and the measured data are stored in a MS Access database on cloud. Statistical data processing was done in software Statgraphics Plus.
Keywords - sleep disorders diagnosis; Epworth scale; mental performance; vigilance; statistical evaluation.
I. INTRODUCTION
Sleep is a basic biological need. It is characterized by reduced movement activity and reduced reactivity to external influences. The body while it rests, function system slows down and starts running the regenerative processes. The changes in physiological changes, reduced body temperature, slowing of the heart and respiratory rate, reduced blood pressure, changing hormone levels in the brain. Good quality sleep is important for maintaining good physical and mental health. It is essential for the proper functioning of the central nervous system (CNS), assists in tissue regeneration and healing, promotes healthy growth, and restores the immune system and thereby increasing the body's resistance to disease. Total sleep time per day for different animals differs greatly, approximately from 2 hours to 20 hours. The sleep duration for humans is individual. It is reported that the average sleep of humans lasts 7-8 hours, but some individuals have different sleep needs can vary from 4 to 12 hours of sleep per day. [1],[ 2]
A. Sleep Disorders
Studies show that 40% of adults have sleep problems and their number increases with increasing age. About 25% of adults indicates occasional sleep disorders, 10% are difficulties permanent and 5% of respondents suffer from excessive daytime sleepiness, and it influence work is social impact on their quality of lives. Under the current international qualification with sleep disorders divided into six basic categories: insomnia, respiratory disorders linked to sleep, hypersomnia, circadian rhythm disorders, parasomnias and abnormal movements linked to sleep.
B. Circadian Rhythm Disorders
Circadian rhythm disorders arise different timing of our own biological rhythm or the rhythm desynchronisation required external environment. Among these syndrome disorders include changes time zones (jet lag syndrome), which arises time shift during transcontinental flights. Other disorders related to circadian rhythm shift work. Daytime sleep for workers who perform night shift, fully substitute its length or quality night's sleep. In delayed sleep phase one goes to bed around 2 to 4 hours of the morning and getting up late in the morning until noon. Conversely, at advanced stages people go to bed early tonight (18 to 20 hours) and wakes up very early in the morning (1 to 3 hours).[3, 4]
C. Symptoms of Sleep Deprivation
Symptoms include emotional problems, anxiety, stress and depression, people are irritation. During prolonged insomnia may occur disorientation and problems with speech. These symptoms usually disappears after sufficient sleep and have no other consequences. Chronic insomnia can have long-term consequences, such as high blood pressure, heart failure, and psychiatric problems in the worst case, death.
D. Exploatation
Sleep deprivation is used in scientific studies to investigate the function sleep and its biological mechanisms. Most often used in laboratory rats, for which examines how total sleep deprivation and deprivation of REM or NREM only phase. Lack of sleep is also used as a torture and interrogation techniques. This fact is used tired that people are more likely to speak the truth. Investigation is the first kept awake for several days and then when he is finally allowed to fall asleep, suddenly awakened and interrogated. According to recent studies it is possible to use sleep deprivation, also for the treatment of depression. This stages have to be measured and analyzed especially for industry and medical application and safety maintenance. [5],[6],[7]
E. Examination Methods
The basic step for the diagnosis of sleep disorders is a detailed medical history specifying sleep and diet excluding exogenous factors (drugs, alcohol, drugs).This history some patients sufficient for a diagnosis. Character disorder specify sleep questionnaires, eg. sleep diary, Epworth sleepiness scale or Stafford sleepiness scale (ESS). Basic testing method is polysomnography. The differential diagnosis individual failures is used multiple sleep latency (MSLT) and maintain wakefulness test (MWT) which is determined using the measure of daytime
61Copyright (c) IARIA, 2015. ISBN: 978-1-61208-424-4
GLOBAL HEALTH 2015 : The Fourth International Conference on Global Health Challenges
73 / 101

sleepiness. The independent self-monitoring system for sleep deprivation and vigilance is not common or the systems are under psychologists and neurologist’s control in ambulance. [8],[9],[10],[11]
II. MEASUREMENT OF MENTAL PERFORMANCE AND
VIGILANCE
The aim of this work was to design and develop a methodology for testing and evaluation of mental performance and vigilance tested. Program was created consisting of six tasks which test memory, reaction time, coordination of movement and level of sleepiness using the Epworth Sleepiness Scale. The obtained data are stored in a database and will be further processed and analyzed statistically.
A. Database Conception
The database structure was designed so that the information it contained as much information on mental performance and alertness of the patient like time of the test each task, errors in tasks, number of success answer act. To connect to the database through a data adapter Microsoft.ACE.OLEDB.12.0, because the database was created in .accdb format (Microsoft Access). The database is located in the data directory of the program and mirroring to google Drive cloud. [12],[13],[14]
B. Task 1 - Presentation of Words and Their Immediate Equipment
The first task is focused on memory investigated. This task is not determined only number of correctly remembered words, but also the number of poorly remembered and words that said the test more than once. The monitor will gradually appear 30 words (Figure 1). The challenge is to remember what they most. When all the words have tested must equip as many words presented, Regardless of how the order. The memorized words then enter in the text box (Figure 1), which appears after presentation of all 30 words. The role is not limited. Presentation of words is repeated three times. For each repeating the same words appear in the same order as in the first experiment. It is necessary to always insert all remembered the words, including those that were already entered in previous experiments. That we will not only memorized the number of words in each experiment, we also observe whether repeatedly tested remember more words.
Figure 1.Inserting memorized words
C. Task 2 - Sorting Numerical Series
The objective of this task is to sort the numbers 1 to 15 in the fastest time. For this purpose form in which the 15 keys with individual numbers (Figure 2), these buttons are arranged in three rows and five columns. Button sequence is random. When you click on this button right. The button will disappear. This task is not recorded only time during which the test line up correctly series of numbers, but also the number of false clicks.
Figure 2. Sorting numerical series
D. Task 3 - Test of the ReactionTtime
This role is based on a psychomotor vigilance test, the test responds pressing the button to light the bulb. In my role appear on the monitor green rectangle, which will be at different time intervals to change color to red (Figure 3). The goalies to click on the rectangle as soon as possible after the color change from green to red. The color varies randomly in the interval 2-10 seconds. Total time jobs are 2 minutes. Do database imposing reaction time individual experiments from which the end of the job calculated average reaction time. An important figure is the number of false clicks, ie. clicks, when the rectangle green.
Figure 3.Change the color of the rectangle
E. Task 4 and 5 - Pulling Shapes
These tasks are focused on the coordination of movement. The monitor shows the image Star shaped (Figure 4). The challenge is to shape Stroke clockwise, move the mouse but is reversed - up is down and down is up, left and right direction remains unchanged. Properly trace shape changes color. If you get out of shape, color cursor turns red and must be returned to the place buckling. The task starts ramming of blue point and ends when the entire pattern correctly trace or after 90 seconds. Results in displacement, which trace the test, expressed in percentage. This task is carried out first and then the dominant non-dominant hand
F. Task 6 - Epthword Sleepiness Scale
This questionnaire (Figure 5) measures the general level of sleepiness during the day. Identifies option snap or sleep on a 4-point scale (0 - I'd never take a nap/a, 1 - a small chance nap, 2 - medium chance nap, 3 - high chance nap) in 8 different situations or activities that are part of everyday life. The total score is the sum of ESS points in different situations and can take values from 0 to 24. The database is not saved only the total score, but also the results for each scenario. The results of this task will be taken as a reference in statistical data processing
62Copyright (c) IARIA, 2015. ISBN: 978-1-61208-424-4
GLOBAL HEALTH 2015 : The Fourth International Conference on Global Health Challenges
74 / 101

Figure 4. Pulling shapes
III. PROGRAM CONTROL
Program Control for measuring mental performance and alertness is done by tablet or mouse. It was necessary to find a tool that would enable the program to operate even if one not used to working with a mouse. These people could be misrepresented the results of each task. [15],[16]
Tablet was chosen as a compromise between control mouse and implementation of special control. It consists of a solid substrate with an active area of a rectangle and moving the sensing device in the form of a wireless pen. The computer input peripherals allows operate a computer in a similar way as a computer mouse (cursor control).
Figure 5.Epworth Sleepiness Scale
To realize the test was elected tablet G-Pen F610 (Figure 6).
It is a widescreen tablet with a working area of 150 x 250 mm (6 x 10 „). The computer is connected via an interface USB, from which is also supplied. For their work with the tablet used pressure-sensitive pen, which is capable of recognize the 1024-level pressure for accurate shooting. The pen is cordless and are available there dedicated buttons for left and right mouse button.
Figure 6. Tablet templates for test
When testing must be used in tablet mode, absolute positioning, the position of the pen on the tablet corresponds to the position of the cursor on the screen. This is adapted to the program, which individual form elements adapt to the screen resolution, and therefore can be used monitors of different sizes and different resolutions. For the role of „Sorting numerical sequence“ and „Test reaction time“ were then created templates (Figure 6), which help better control tasks using a tablet. These templates are inserted top sheet tablet. [17]
IV. STATISTICAL EVALUATION OF MEASUREMENT DATA
Data were obtained using an assay for measuring mental performance and vigilance. Was tested a total of 60 people aged 21 to 28 years. Tested had normal sleep patterns and not been treated with any kind of sleep disorder. The statistical evaluation was used program Statgraphics Plus version 5.0.
A. Analyzed data
Output data in a program objectively measured data showing mental performance and alertness measured entity. These data are classified using variables which serve as input for statistical evaluation.
The same number of men (n=30) and women (n=30) took part in the measurement. Number of tested with dominant right hand is n=51 what creates 85% of all respondents. Number of tasted with dominant left hand is n=9 what creates 15% of all respondents.
The examined group of persons that was selected for this study is the group of young people of age between 20 to 30 years who, in time of the testing, did not suffer from any hypnophrenosis and who had normal sleep habits. 60 respondents of the age from 21 to 28 years complied with this criterion from which there were 30 men and 30 women. Before the intrinsic test completing the tested were asked not to use any drinks with caffeine content, e.g. tea or coffee, and also not to smoke.
Time demand on the test gave rise to the creation of two versions because its length ranges approximately from 20 up to 30 minutes. Therefore, a part of data was collected by means of the first version when the tablet was used for controlling. The rest of data was obtained from the respondents to whom the program was sent by e-mail. The advantage of this version was addressing of a huge number of persons. The response rate was about 50% in this case. [17]
63Copyright (c) IARIA, 2015. ISBN: 978-1-61208-424-4
GLOBAL HEALTH 2015 : The Fourth International Conference on Global Health Challenges
75 / 101

V. RESULTS
A. The Dependence Between the Total Score and the ESS Sex
The first step of the test according to the total score of the ESS and sex create a Table (Tab. 1), which contains the observed frequency and the relative frequency and the expected frequency. For proper results it is necessary to observe the test assumption that none of the expected frequency of not less than 2 and at least 80% of the expected frequency must be greater than 5. To meet these prerequisites are met, the overall score ESS divided into three categories: 0-6 points, 7-8 points, and 9-24 points.
TABLE I. A FREQUENCY TABLE FOR THE CORRELATION BETWEEN THE TOTAL SCORE AND ESS
1-6 standart value
7-8 border value
9-24 increased value
man 14 23,33% 14 7 11,67% 7 9 15,00% 9
woman 14 23,33% 14 7 11,67% 7 9 15,00% 9
Sum 28 46,67% 14 23,33% 18 30,00%
On Table (Tab. 1) is seen that all of the expected frequency of greater than 5, it is possible to use the chi-square test. Before the test still possible the null and alternative hypotheses:
The null hypothesis is: ESS depend on gender.
The alternative hypothesis is: ESS depends on sex.
Since the p-value was set to 1, i.e., p-value is greater than 0.05, do not reject the null hypothesis and we can say that the overall ESS scores depend on the sex (of at level 0.05).
B. Correlation Between the Number of Memorized Words and a Total Score of ESS
In this test, we find that the correlation between the number of memorized words on the third attempt and a total score of ESS. ESS scores are divided into three groups of 0-6 points 7-8 points 9-24 points. To determine this dependence, we use ANOVA method by which we can compare the mean number of selections. Must be met assuming a normal distribution and homoscedasticity (ie. The same variance). If you have the same scattering data, but does not come from a normal distribution, we used the nonparametric Kruskal-Wallis test, the mean values do not test, but compliance medians.
First, we formulate null and alternative hypotheses:
Null hypothesis: Number of memorized words depend on the ESS score.
Alternative hypothesis: Number of memorized words depends on the ESS score.
Before the test is needed to verify the normality of the data, where the null hypothesis is: The data comes from a normal distribution. For testing normality is used chi-square test of goodness of fit. P-value of 0.031 is the first choice, ie. p-value <0.05, so we reject the null hypothesis and we can say that the data come from a normal distribution. P-value for the second selection is 0.208, ie. p-value> 0.05, so do not reject the null hypothesis and we can say that the data comes from a normal
distribution. P-value 0.343 is the third selection, ie. p-value> 0.05, therefore, we accept the null hypothesis and we can say that the data comes from a normal distribution.
Next, we verify homoscedasticity, where the null hypothesis is: Scattering of memorized words all selections are the same. Because the data from the first choice does not come from a normal distribution, use Levene test. P-value is 0.10, ie. p-value> 0.05, do not reject the null hypothesis and we can say that the spread of memorized words all selections are the same.
Because the data from the first choice does not come from a normal distribution, we cannot use ANOVA. To test the dependence use Kruskal-Wallis one-way analysis of variance to test conformity medians. P-value of 0.018. This value is smaller than the significance level of 0.05, so we reject. Analysis of sleep deprivation null hypothesis and accept the alternative hypothesis. We can say that the number of memorized words depends on the total score (ESS at a significance level of 0.05).
For a more accurate conclusion in rejecting the null hypothesis needs to be done post hoc analysis. The maximum number of memorized words are tested with a lower Scores for ESS. The biggest difference in the number of memorized words is tested with ESS between 0-6 and 7 to 8 more homogeneous than the time required to sort the numerical range for the test with ESS 7-8 and ESS 9 to 24 The higher the ESS, the longer the time required to sort the numerical series. The biggest difference time required to sort the numerical series is among tested with ESS 0-6 and 9 to 24
C. Dependence Between the Average Response Time and Overall Score ESS
In this assay, verify whether the relationship between the reaction time and the average total score of the ESS. ESS scores are divided into three groups of 0-6 points 7-8 points 9-24 points. To determine this dependence, we use ANOVA method by which we can compare the mean number of selections. Must be met assuming a normal distribution and homoscedasticity (ie. The same variance). If you have the same scattering data, but does not come from a normal distribution, we used the nonparametric Kruskal-Wallis test, the mean values do not test, but compliance medians.
First, we formulate null and alternative hypotheses:
Null hypothesis: The average response time does not depend on the total score of ESS.
Alternative hypothesis: The average response time depends on the total score of ESS.
Before the test is needed to verify the normality of the data, where the null hypothesis is: The data comes from a normal distribution. For testing normality is used chi-square test of goodness of fit. P-value of 0.67 is the first choice, ie. p-value> 0.05, so do not reject the null hypothesis and we can say that the data comes from a normal distribution. P-value is 0.15 second selection, ie. p-value> 0.05, so do not reject the null hypothesis and we can say that the data comes from a normal distribution. P-value of the third selection is 0.45, ie. p-value> 0.05, so do not reject the null hypothesis and we can say that the data comes from a normal distribution.
64Copyright (c) IARIA, 2015. ISBN: 978-1-61208-424-4
GLOBAL HEALTH 2015 : The Fourth International Conference on Global Health Challenges
76 / 101

Next, we verify homoscedasticity, where the null hypothesis is: Scattering average times of all selections is the same. Because all selections are normally distributed data, use Bartlett's test. P-value is 0.056, ie. p-value> 0.05, do not reject the null hypothesis and we can say that the variance of the average reaction time of selection is the same.
Because all the preconditions are met, we can proceed to the actual ANOVA. P-value is 0.0002. This value is smaller than the significance level of 0.05, so we reject the null hypothesis and we can say that the average response time is dependent on the overall score ESS (at a significance level of 0.05).
D. Dependence Between the Track Trace Non-Dominant Hand and aTotal Score of ESS
In this test, we find that the relationship between the track non-dominant hand and an overall score of ESS. ESS scores are divided into three groups of 0-6 points 7-8 points 9-24 points. To determine this dependence, we use ANOVA method by which we can compare the mean number of selections. Must be met assuming a normal distribution and homoscedasticity (ie. The same variance). If you have the same scattering data, but does not come from a normal distribution, we used the nonparametric Kruskal-Wallis test, the mean values do not test, but compliance medians.
First, we formulate null and alternative hypotheses:
Null hypothesis: The track does not depend on the total score of ESS.
Alternative hypothesis: The path depends on the total score of ESS.
Before the test is needed to verify the normality of the data, where the null hypothesis is: The data comes from a normal distribution. For testing normality is used chi-square test of goodness of fit. P-value of 0.0001 is the first choice, ie. p-value <0.05, therefore rejected the null hypothesis and I can say that the data come from a normal distribution. P-value of 0.071 is the second choice, ie. p-value> 0.05, so do not reject the null hypothesis and we can say that the data comes from a normal distribution. P-value 0.343 is the third selection, ie. p-value> 0.05, so do not reject the null hypothesis and we can say that the data comes from a normal distribution.
Next, we verify homoscedasticity, where the null hypothesis is: Scattering tracks all selections are the same. Since the date of first choice does not come from a normal distribution, use Levene test. P-value is 0.59, ie. p-value> 0.05, do not reject the null hypothesis and we can say that the scattering paths all selections are the same.
Because the data from the first choice does not come from a normal distribution, we cannot use ANOVA. To test the dependence use Kruskal-Wallis one-way analysis of variance to test conformity medians. P-value is 0.16. This value is greater than the significance level of 0.05, so do not reject the null hypothesis. We can say that the track trace non-dominant hand is independent of the total score (ESS at a significance level of 0.05).
VI. DISCUSSIONS
The aim of this work was to study methods for the diagnosis of sleep disorders and the creation of a program to measure
mental performance and alertness on the basis of which it is possible to determine whether the test suffers from lack of sleep. Was designed and created program stack the six tasks with which testing memory, reaction time, coordinate the movement and level of sleepiness.
There were an average of individual tasks for testing in the range 21 to 28 years who have normal sleep patterns and do not suffer from a sleep disorder. The first task was tested by memory. The average number of words memorized in the first experiment was 10.1 ± 3.1 words, in the second experiment, it was 16.2 ± 3.8 words, in the third 21.0 ± 3.5 words. In the second task was average time required to sort the numerical series 13.8 ± 2.4 seconds. The average reaction time in the third test role was 0.438 ± 0.067 seconds. Percentage tracks trace dominant hand was 70.7% ± 22.5%, when using non-dominant hand, the percentage of paths 69.3% ± 26.0%. The value of total Epworth Sleepiness Scale score was 7.1 ± 3.2.
As a point of reference was chosen Epworth sleepiness scale, the results of which were compared results of the study Dr. Murray Johns, who created this method. Because the results of ESS in this study were comparable to studies, it was possible to use the results for further testing.
In testing, it was found that there is a correlation between the number of memorized words, the time required for alignment of numerical series and the average reaction time and the total score of the ESS. At the same tim the followed track traced of both dominant and non-dominant hand depends on the overall ESS score is strongly.
VII. CONCLUSIONS
Computer aided testing of psychometric variables seems to be very useful in the medical practice and research. Many testing procedures are well-grounded by a simple algorithm and they are suitable for the implementation in a form of the computer software. The software enables a quick and cheap measurement of the psychometric variables.
The effect of the personal UI interaction within device is conclusive for accuracy and reliability of the psychometric evaluation. The classical PC’s UI are not very appropriate because of variable computer skills in population. The button device as used in the Cognitive Drug Research Ltd. System is more useful due to its simplicity. Use of pressure-sensed pen and tablet is another interesting way because of almost general writing skills in population.
This method of measuring mental performance and alertness was created in collaboration with the University Hospital in Ostrava. The proposed scheme can be further used for testing and collection of additional data and to determine the average value, characterizing the other groups tested.
ACKNOWLEDGMENT
The work and the contributions were supported by the project SP2015/179 'Biomedical engineering Systems XI', and this paper has been elaborated in the framework of the project „Support research and development in the Moravian-Silesian Region 2014 DT 1 - Research Teams“(RRC/07/2014). Financed from the budget of the Moravian-Silesian Region.
65Copyright (c) IARIA, 2015. ISBN: 978-1-61208-424-4
GLOBAL HEALTH 2015 : The Fourth International Conference on Global Health Challenges
77 / 101

REFERENCES
[1] C. Borzová, „ Insomnia and other sleep disorders “, 1. vyd. ed. Praha: Grada, 2009.
[2] S. Nevsimalova „Disorders of sleep and wakefulness” Habilitation work. Praha,, 1996.
[3] S. Nevsimalova, „The Diagnosis and Treatment of Pediatric Narcolepsy,“ Current Neurology and Neuroscience Reports, vol. 14, Aug 2014.
[4] J. Pisko, L. Pastorek, J. Buskova, K. Sonka, and S. Nevsimalova, „Nightmares in narcolepsy: underinvestigated symptom?,“ Sleep Medicine, vol. 15, pp. 967-972, Aug 2014.
[5] M. Behan and O. Krejcar, „Mobile Widget Technology as a Solution for Smart User Interaction,“ in Ambient M edia and Systems. vol. 118, C. T. Angelis, D. Fotiadis, and A. T. Tzallas, Eds., ed, 2013, pp. 113-122.
[6] M. Behan and O. Krejcar, „Modern smart device-based concept of sensoric networks,“ Eurasip Journal on Wireless Communications and Networking, pp. 458-466, 2013 2013.
[7] I. Idris, A. Selamat, N. Ngoc Thanh, S. Omatu, O. Krejcar, K. Kuca, et al., „A combined negative selection algorithm-particle swarm optimization for an email spam detection system,“ Engineering Applications of Artificial Intelligence, vol. 39, pp. 33-44, Mar 2015.
[8] M. W. Johns, „A new perspective on sleepiness,“ Sleep and Biological Rhythms, vol. 8, pp. 170-179, Jul 2010.
[9] S. S. Sullivan and C. A. Kushida, „Multiple Sleep Latency Test and Maintenance of Wakefulness Test,“ Chest, vol. 134, pp. 854-861, Oct 2008.
[10] M. Cerny, M. Penhaker „The HomeCare and circadian rhythm, pp. 786-794, 2008.
[11] D. Vybiral, M. Augustynek, and M. Penhaker, „Devices for position detection,“ Journal of Vibroengineering, vol. 13, pp. 531-535, SEP 2011 2011.
[12] J. Majernik and P. Jarcuska, „Education of Clinical Disciplines in Pre and Post-Graduate Study Oriented on Increasing of Newest Infectious Diseases Knowledge,“ in 3rd International Conference on New Horizons in Education - Inte 2012. vol. 55, A. Isman, Ed., ed, 2012, pp. 604-611.
[13] J. Majernik, P. Jarcuska, and Ieee, „Web-based delivery of medical education contents used to facilitate learning of infectology subjects,“ 2014 10th International Conference on Digital Technologies (Dt), pp. 225-229, 2014 2014.
[14] M. W. Chughtai, A. Selamat, I. Ghani, and J. J. Jung, „E-Learning Recommender Systems Based on Goal-Based Hybrid Filtering,“ International Journal of Distributed Sensor Networks, 2014 2014.
[15] P. Brida, J. Duha, and M. Krasnovsky, „On the accuracy of weighted proximity based localization in wireless sensor networks,“ in Personal Wireless Communications. vol. 245, R. Bestak, B. Simak, and E. Kozlowska, Eds., ed, 2007, pp. 423-432.
[16] P. Brida, F. Gaborik, J. Duha, and J. Machaj, „Indoor Positioning System Designed for User Adaptive Systems,“ in New Challenges for Intelligent Information and Database Systems. vol. 351, N. T. Nguyen, B. Trawinski, and J. J. Jung, Eds., ed, 2011, pp. 237-245.
[17] V. Novak, R. Jeziorska, and M. Penhaker, „Computer Based Psychometric Testing and Well Being Software for Sleep Deprivation Analysis,“ in Advanced Methods for Computational Collective Intelligence. vol. 457, N. T. Nguyen, B. Trawinski, R. Katarzyniak, and G. S. Jo, Eds., ed, 2013, pp. 207-216.
[18] Epworth Sleepiness Scale. Neuropsychological tests [Online]. Available from: http://wiki.galenhealthcare. com/index.php/File:ECalcs_Epworth_Sleepiness_Scale.jpg
66Copyright (c) IARIA, 2015. ISBN: 978-1-61208-424-4
GLOBAL HEALTH 2015 : The Fourth International Conference on Global Health Challenges
78 / 101

IT-Aided Business Process EnablingReal-time Analysis of Candidates for Clinical Trials
Matthieu-P. Schapranow, Cindy Perscheid, Hasso PlattnerHasso Plattner Institute
Enterprise Platform and Integration ConceptsAugust–Bebel–Str. 88
14482 Potsdam, Germanyschapranow|cindy.perscheid|[email protected]
Abstract—Recruitment of participants for clinicaltrials is a complex task involving screening of hun-dreds of thousands of candidates, e.g., testing fortrial-specific inclusion and exclusion criteria. Today, asignificant amount of time is spent on manual screen-ing as improper selected candidates have impact onthe overall study results.
We introduce a candidate eligibility metric, whichallows systematic ranking and classification of can-didates based on trial-specific filter criteria in anautomatic way. It is implemented as part of ourweb application, which enables real-time analysis ofpatient data and assessment of candidates. Thus, thetime for identification of eligible candidates is tremen-dously reduced whilst additional degrees of freedomfor assessing the relevance of individual candidatesare available.
Keywords-Clinical Trials; In-Memory Technology;Data Analysis; Eligibility Metric; Clustering.
I. Introduction
The pharmaceutical industry heavily invests in clinicaltrials to improve existing drugs and introduce new onesevery year [1]. The Guidelines for Good Clinical Practice(GCP) define details for conducting clinical trials onhuman subjects, which are widely adopted in certaincountries, e.g., the United States of America (USA) andthose of the European Union (EU) [2]. Amongst others,they define document artifacts, e.g., Informed ConsentForm (ICF) or Case Report Form (CRF), as well asinteraction between involved actors, e.g., investigators,sponsors, and trial participants. Before participation ina clinical trial, candidates need to be tested for certaintrial inclusion and exclusion criteria.In the given work, we introduce an integrated
software-aided business process supporting the determi-nation of eligible candidates for clinical trials building anadditional source of confidence. Our software addressesprincipal investigators during the design of clinical trialsand investigators during the identification of candidates.Our approach incorporates latest In-Memory Database(IMDB) technology to support real-time analysis ofpatient data during this phase. As a result, our approach
Figure 1: Result view of our web application showing four clustersof candidates each containing an automatically assessed list ofcandidates for review.
contributes by reducing the overall time for determina-tion of candidates, which consumes a significant amountof the overall clinical trial time today [3]. Figure 1 depictsthe result view of our web application with four resultclusters while a ranked candidate list for the cluster"desired Karnofsky score" is selected.
The rest of the work is structured as follows: InSection II, our work is set in the context of relatedwork whilst we share a real-world use case in Section III.We explain our incorporated methodology in Section IV,demonstrate how it can improve the clinical trial processin Section V, and introduce our IMDB approach inSection VI. In Section VII, we discuss our findings andour work concludes with an outlook in Section VIII.
67Copyright (c) IARIA, 2015. ISBN: 978-1-61208-424-4
GLOBAL HEALTH 2015 : The Fourth International Conference on Global Health Challenges
79 / 101

II. Related Work
The given contribution addresses a) a software so-lution improving filtering and assessment of patientdata and b) a business process integrated the software.Selected related work addressing software solutions forcandidate identification are discussed in the following.The Veterans Health Information Systems and Tech-
nology Architecture (VistA) of the U.S. Department ofVeterans Affairs is a Hospital Information System (HIS)combining data from distributed VA clinics and sites ina single data source [4], [5]. Although it contains datafor candidate identification, it is not used this purposeas it does not provide required tools.The Informatics for Integrating Biology and the Bed-
side (i2b2) system provides IT tools for clinical re-searchers for research purposes [6]. It provides a config-urable and interactive query editor supporting a range offilters, including diseases, medications, laboratory tests,and doctor’s visit details [7]. Our contribution providesadditional enhancements, e.g., an eligibility metric torank and cluster results, as defined in Section VI.Dumas et al. identified Acute Myeloid Leukemia
(AML) candidates for clinical trials using clinical datafrom of patients taken from the HIS of a German hospitaland compared them to inclusion and exclusion criteriaof ongoing clinical trials [8]. We also believe that thesecondary use of existing clinical data is beneficial forcandidate identification. Thus, our contribution definesan IT-aided business process for candidate identificationfor a wide range of diseases.All aforementioned approaches lack support for assess-
ment of results. In contrast, our approach systematicallycalculates a score for each candidate enabling rankingand clustering of the result set for the first time.
III. Use Case
We defined the following persona as a concrete exam-ple for our enhanced business process in the remainder ofthis work. Forrest G., male, 62 years old was an activesmoker for a long period in his life. During one of hisregular checkups, he was recently diagnosed with Non-Small Cell Lung Cancer (NSCLC). Now, Forrest worriesabout receiving the best available treatment for NSCLC.Thus, he learned about targeted therapies and is veryinterested in participating in clinical trials optimizedfor his personal disease. As a result, selected detailsof his Personal Health Record (PHR) are shared in ade-identified way to assess the individual eligibility forclinical trials. We refer to a fictive clinical trial targetingNSCLC requiring at least 150 g available tumor tissuefor preliminary testing.
IV. MethodsIn the following, we share details about our incorpo-
rated methodology: in Section IV-A we introduce oureligibility metric defining a unique key figure per candi-date representative for its calculated trial applicabilitywhilst the incorporated IMDB technology to leverageinteractive data analysis of big patient data in oursoftware artifact is introduced in Section IV-B.
A. Candidate Eligibility MetricWe define a vector of n candidate criteria v “
pc1, . . . , ck, . . . , cnq with ci P r0, 1s, i P t1, . . . , nu whileeach of the vector components is calculated by an indi-vidual function, as described in Section VI-E. Thus, eachcandidate is represented as a point in a n-dimensionalvector space where the most suitable candidate is definedby the vector p1.0, . . . , 1.0, . . . , 1.0q.We define the eligibility score sk of a candidate k
as the normalized Euclidian distance dp v1.0, vkq betweenthe vector of the most suitable candidate v1.0 and thevector of the individual patient vk, as defined in Equa-tion 1.
sk “ 1.0 ´ d p v1.0, vkqd p v1.0, v0.0q (1)
“ 1.0 ´gffe nÿ
i“1
˜v1.0ci
´ vkci
v1.0ci´ v0.0ci
¸2
(2)
B. In-memory Database TechnologyWe refer to IMDB technology as a toolbox of Informa-
tion Technology (IT) artifacts, which enables processingof enterprise data in the main memory of server systemsin real time [9]. Through the combination of IMDBdatabase technology and analysis of available candi-date data, we aim to achieve a speedup for the time-consuming identification of candidates, as described inSection I. In the following, selected building blocks ofthe IMDB technology are introduced.
1) Column-Oriented Data Layout: Most modern rela-tional database systems fall into the category of transac-tional databases and store their data in a row-orientedformat, i.e., all attributes of a record are stored inadjacent blocks. This is advantageous if the completedata of a single row has to be processed. On the otherhand, analytical database systems store and processtheir data column-wise, i.e., all entries of a column arestored in adjacent blocks, which is beneficial if onlyselected attributes of a data set need to be accessed.When filtering patients based on a study’s criteria, onlycertain parts of their data need to be read. The typesof queries to be expected in our prototype can thereforebenefit from this data layout.
68Copyright (c) IARIA, 2015. ISBN: 978-1-61208-424-4
GLOBAL HEALTH 2015 : The Fourth International Conference on Global Health Challenges
80 / 101

2) Lightweight Compression: Lightweight compres-sion refers to a data storage representation that con-sumes less space than its original pendant [9]. Stor-ing data column-wise facilitates lightweight compressiontechniques, such as run-length encoding, dictionary en-coding, and difference encoding [10]. The diverse natureof patient data results in heterogeneous data, i.e., manyNULL values, facilitating the potential to save spacethrough encoding.
3) Partitioning: Our incorporated IMDB providesvertical and horizontal partitioning [11]. The formeraddresses large database tables and splits up a databasetable in multiple column-wise subsets that can be dis-tributed on individual servers while the latter dividesa long database table in smaller subsets of data [12].Splitting data into equally long horizontal partitionssupports parallel search operations and improves scal-ability [9]. For our use case, partitioning enables the useof multiple sources of candidates to increase the reach ofthe system [13].
4) Multi-Core and Parallelization: Modern systemarchitectures are designed to provide multiple CPUswith each of them having separate cores. This capacityneeds to be fully exploited by parallelizing applicationexecution to achieve maximum processing speed. Inter-nal tools of IMDBs are implemented to benefit fromparallelization. By using the capabilities of our database,we can speed up the process of clustering candidates.
5) Bulk Data Load: For candidate identification, largeamounts of clinical data have to be collected andstored. The bulk load capabilities of IMDBs supportthis through the use of the CSV format and parallelprocessing of the data to insert.
C. Realistic Patient DataWe consider the use of realistic patient data for devel-
opment and testing as the foundation to optimize soft-ware for real-world use cases. As a result, we incorporatepatient data from The Cancer Genome Atlas (TCGA)program in the course of our development [14].
D. Design ThinkingTogether with subject matter experts from research
and industry, we derived design decisions for our webapplication and the enhanced process. For that, we incor-porated the design thinking methodology, which helpedto stratifying the cooperation in an interdisciplinaryteam [15]. Consequently, we performed regular userinterviews sharing our research artifacts to constantlyimprove our approach.
V. The Clinical Trials ProcessWe define the following phases in the context of
clinical trials as depicted in Figure 2:
Figure 2: Phases of a clinical trial.
‚ Design: Inclusion and exclusion criteria need to bedefined during this phase. Reviewing a list of po-tential candidates supports investigators in selectedcriteria to include a representative population.
‚ Pre-Screening: Candidate’s data is scanned andthey are contacted if they fulfill the criteria listedin the clinical trial synopsis.
‚ Screening: After a comprehensible explanation ofthe trial’s purpose, candidates need to consent theirparticipation by signing the ICF. A doctor, e.g., byconducting medical tests, checks them. Iff a candi-date fits all required criteria of the trial definition,she/ he gets enrolled.
‚ Execution: The actual trial execution starts, e.g.,intake of pharmaceuticals or placebos. After theparticipant completes the trial the individual casereport is created. The Clinical Study Report (CSR)is created after the overall trial is finished and thetrial database was locked.
‚ Follow-up: Study participants are followed up withsatisfaction surveys and further assessments, e.g.,regular health checks.
A. Design of Study ProtocolsInclusion and exclusion criteria are defined during de-
sign of a study protocol to identify adequate candidatesrepresenting the population [16]. Improper design deci-sions may result in complex or inadequate selection ofcandidates affecting the quality of the study results [17],[18]. Our contribution supports trial investigators, e.g.,they can examine all candidates and evaluate defined in-clusion and exclusion criteria by simulating their impacton candidate identification using real data.
B. Identification of Eligible CandidatesThe analysis of patient-specific data and their match-
ing with study-specific inclusion and exclusion criteria isperformed during the pre-screening phase, as defined inSection V. Nowadays, this involves time-consuming andmanual analysis of individual trial criteria for hundredsof thousands of candidate profiles.Our enhanced process improves the manual process by
defining an eligibility score for each candidate, as defined
69Copyright (c) IARIA, 2015. ISBN: 978-1-61208-424-4
GLOBAL HEALTH 2015 : The Fourth International Conference on Global Health Challenges
81 / 101

in Section IV-A, representing the applicability in contextof the study. The process consists of the following phases:
‚ Configuration of filter criteria,‚ Automatic analysis of candidate data, and‚ Review of results.During configuration of filter criteria, investigators
define criteria accordingly to the inclusion and exclusionof the clinical trial on the filter screen of our app. Thespecified filter criteria are translated into a databasequery matching the selected filter criteria.During data analysis, individual candidate records are
screened to meet defined filter criteria. This process isperformed completely within the incorporated IMDB,which eliminates the need for any application-level filterand optimizes run time.During the review phase, the investigator accesses the
result screen, which consists of a list of clusters, each ofthem containing a ranked list of trial candidates witha specific matching score for the current trial. Candi-dates with a similar score but with different criteriaare assigned to individual clusters, which outlines howcandidates’ criteria differ.For each candidate, all accessible data can be directly
expanded in the result view in order to assess follow-upquestions directly during the manual review phase. Theresult view also provides interactive graphical analysisfeatures using individual criteria, e.g., graphs and fig-ures about age, gender, or tumor weight distribution.If a potential candidate is found, she or he is addedto a persisted list of candidates to follow-up, e.g., bydownloading the candidate list to inform them abouttheir eligibility for the clinical trial.
VI. Contribution
In this section, we share implementation details of oursoftware application for identification of trial candidatesmatching trial-specific filter criteria.
A. Database SchemaWe defined an extendable star database schema for
patient data optimized for data analysis [19]. It consistsof the fact table CLINICAL_PATIENT containing uniquemaster data about the patients, which is referred to bymultiple dimension tables as depicted in Figure 3. Forexample, the fact table contains birth date, gender, andECOG or Karnofsky score to quantify the health statusof a person [20], [21]. Dimension tables store additionaloptional patient data using n : m relations, e.g., thedimension table DRUG contains details about medicationintake, such as duration and dosage.For our research prototype, we incorporated TCGA
data for indications of lung and ovarian cancer andconsolidated it. The LUAD table contains details about
Figure 3: Entity-relationship diagram of our star database schema.It consists of the fact table CLINICAL_PATIENT holding generalpatient data and dimension tables holding additional data, e.g.,drug intake or tumor sample. Cardinality of all relations is 1 : ˚unless marked.
Figure 4: Filter criteria creation in our web application: Threefilters have already been created, and the user is creating a forthone using the auto-completion.
lung cancer, e.g., tumor location or active smoking time,whilst the OV table contains ovarian-specific details.We defined an Extract, Transform, Load (ETL) pro-
cess for import of TCGA data into the database [22].TCGA is downloaded and divided into multiple raw datafiles, which are transformed by a Python script into CSVfiles. The latter is loaded into our database using its bulkload capabilities, as described in Section IV-B5.
B. Backend and Frontend
Our web application backend consists of a lean Rubyserver with Sinatra serving the static content of webpages only [23]. All analysis operations, e.g., clusteringand ranking, are performed directly within the IMDB,which eliminates the need to transfer data through theapplication stack. We designed a web application ex-changing user data between backend and frontend usingAsynchronous JavaScript and XML (Ajax) [24].
70Copyright (c) IARIA, 2015. ISBN: 978-1-61208-424-4
GLOBAL HEALTH 2015 : The Fourth International Conference on Global Health Challenges
82 / 101

C. User InterfaceOur User Interface (UI) incorporates a responsive de-
sign, i.e., display optimized for individual device classes,e.g., desktop PCs and mobile devices.Figure 4 depicts the filter definition view of our web
app for the use case defined in Section III. On theleft-hand side, inclusion and exclusion filter criteria arespecified. Our app provides a list of relevant filter criteriausing auto-completion while typing. Filter criteria areadded either as Boolean operators AND or AND NOT. Onthe right-hand side, filter-specific values are defined.Figure 6 shows a matrix of user-defined filter criteria
for graphical exploration. The color of the dots indicatesthe cluster, where the value belongs to, e.g., the redcluster indicates candidates that are close to the desiredECOG score while having only a few other diseases.Candidates with a high result from the most suitablecandidate function are most eligible from a data’s pointof view.Candidates are grouped in similar clusters, where each
cluster consists of a ranked list of candidates with spe-cific information. Investigators can inspect all availablecandidate information with a click on the "View fullpatient record" link and store them in a follow-up listusing the "Save patient" button.
D. Filter TypesTogether with subject matter experts, we defined filter
types supporting the identification of trial candidates. Inthe following, selected filter types of our web applicationare described in detail:
‚ Single option filters can have either of two pos-sible values, e.g., gender: or ,
‚ One of many options filters describe one ofmultiple statuses, e.g., cancer stages I to IV,
‚ Range filters define a continuum of values, e.g.,age between 18 and 45,
‚ Threshold filters must be above or below a certainvalue, e.g., a minimum tumor weight, and
‚ Free-text filters provide a text field with auto-completion for selection of various values, e.g., dis-eases or previous medications.
We distinguish hard and soft filters, where the formerdo not allow outliers and the latter consider incompleteor imprecise data points. Soft filters assign lower scoresto outliers instead of removing them completely. If datarelevant for a filter is missing, e.g., the tumor weight ofa candidate is unknown, s/he will receive a lower score,but will not be removed from the result.
E. RankingFor candidate ranking, we incorporate our vector-
based eligibility metric, as described in Section IV-A.
Table I: EXCERPT OF PATIENT DATA.
Candidate Gender Age Diagnosis Tumor Weight1 45 NSCLC 242 g2 51 NSCLC n/a
The most suitable candidate has the value one in all com-ponents of the vector. For each candidate in the resultset, we calculate the distance between the candidate-specific and the most suitable patient’s vector. Theranking process is based on the vector space model [25].For each vector component, an individual function
implements the comparison of candidate-specific datawith the data defined for the most suitable candidateand returns a decimal value within the interval r0, 1s.Ranking functions for individual filters are imple-
mented differently depending on their type: there arefunctions for hard and soft filters as well as a specialimplementation for threshold filters. Apart from filter-specific functions, the completeness and most suitablecandidate functions are always executed per candidate.
1) Completeness: Patient data may be incomplete,i.e., some data is missing or unavailable in the can-didate’s profile. The completeness function assigns ahigher score to candidates having all matching attributesavailable.Let us consider the excerpt of patient data in Ta-
ble I for the use case described in Section III. Thecompleteness score is defined as mean of all availableattributes, i.e., the number of available and matchingfacts divided by the number of requested facts. Thecompleteness score is 1.0 for the first and 2
3 for thesecond candidate. Thus, the completeness function ranksthe first candidate higher than the second, who couldstill match all trial criteria although the tumor weight isunavailable.
2) Most Suitable Candidate: The most suitable can-didate function defines a certain penalty for candidateswith additional indications than the requested ones totake eventual issues into account. We defined an indi-vidual penalty score for each disease according to thedegree of disease, e.g., having lung cancer is worse thanhaving asthma. The score is calculated by subtractingthe maximum of all disease penalties from 1.0.Let us consider the use case described in Section III.
NSCLC without any additional indications results in ascore of 1.0, a candidate suffering from asthma receives ascore of 0.8, and a candidate, who just recently suffereda heart attack, receives a score of 0.5.
F. Calculation of Eligibility ScoreLet us consider the use case, as defined in Section III,
using the completeness, general health, and thresholdfunctions to define the eligibility score s, as defined in
71Copyright (c) IARIA, 2015. ISBN: 978-1-61208-424-4
GLOBAL HEALTH 2015 : The Fourth International Conference on Global Health Challenges
83 / 101

The lower thisdistance, the
better the patient.
Completeness
General Health
Thre
shol
d
(0.5, 0.
5, 1.0)
(1.0, 1.0, 1.0)
0.4
0.4
0.8
0.8
Figure 5: Example of calculating the ranking score for a candidate.The current candidate has the values (0.5, 0.5, 1.0). The mostsuitable candidate is located at the point (1.0, 1.0, 1.0). Thenormalized Euclidian distance between the current candidate andthe most suitable candidate determines the total ranking score.
Section IV-A. Figure 5 depicts candidate k as vk “p0.5, 0.5, 1q and the most suitable candidate defined byv1.0 “ p1.0, 1.0, 1.0q as well as the distance from eachother in the three-dimensional space. For candidate knot all required data is available, the health status differsfrom the requested one, and the requested thresholdvalue is exceeded. Thus, the eligibility score sk is sk “0.5918, i.e., candidate k is eligible for the clinical trialwith 59.18% with regard to the selected criteria.
G. ClusteringRanking candidates enables investigates to evaluate
the eligibility of candidates with regard to trial criteria.However, two candidates may vary in different aspectswhile having the same eligibility score.Thus, we perform a clustering of results, which assigns
similar candidates to the same cluster. We selected the k-means clustering algorithm as it is the most appropriatealgorithm for our purpose [26]. Clustering is directlyexecuted within our IMDB, which eliminates the needfor exporting the data, processing the data by third-party tools, and importing of results. As a result, we wereable to leverage interactive data analysis and explorationof results for our application’s end users.While the target number of clusters must be config-
ured, the algorithm can be applied to any number ofdimensions, as the distance to the cluster centroids canbe calculated in any multi-dimensional space. For ourprototype, we configured the algorithm to return fourclusters. This number is configurable and was chosenafter consideration of our sample dataset. Because usersof our application are allowed to vary the number offilters, the number of dimensions is not fixed.In the frontend, the resulting list of candidates is
grouped in clusters, which are given appropriate names
Figure 6: Visualization of multi-dimensional clustering results.Each block shows all candidates, projected onto two dimensions.For example, the bottom right square shows the position of allcandidates with regard to Karnofsky score and the most suitablecandidate function, as defined in Section VI-E2. Clusters areindicated by a point’s color.
based on frequent properties. Additionally, the clustersare visualized in a projection to each pair of two dimen-sions as depicted in Figure 6.
VII. Evaluation and Discussion
We configured our candidate eligibility metric for aconcrete clinical trial addressing lung cancer patients, asdescribed in Section IV-A. Our database was populatedwith real patient data taken from TCGA includingvarious indications, such as lung cancer and ovariancancer. Together with our experts from industry, wedefined specific filter criteria to retrieve relevant subsetsof candidates eligible for the specific clinical trial.During our conducted user interviews, we received
promising feedback that our enhanced business processwill reduce the overall time to identify candidates forclinical trials.Our enhanced process combines the automatic analy-
sis of patient data with a manual review phase performedby a human expert. Thus, routined work is optimizedthrough our software-aided web application while the ac-curacy of the outcome is guaranteed by the incorporatedhuman reviewer.
VIII. Conclusion and Outlook
In the given work, we shared research results of ourinterdisciplinary cooperation of pharma experts, clinical
72Copyright (c) IARIA, 2015. ISBN: 978-1-61208-424-4
GLOBAL HEALTH 2015 : The Fourth International Conference on Global Health Challenges
84 / 101

trial teams, and software engineers. Applying the con-crete use case of a clinical trial for lung cancer patients,we defined an enhanced business process incorporatingIT artifacts, which enable the integrated analysis ofpatient data. Today, the identification of candidatesrequires manual interpretation and matching of patientand trial data, which results in a time-consuming anderror-prone process, e.g., in course of phase III and IVclinical trials with more than thousand participants.We defined a generic candidate eligibility metric in
Section IV-A that is configurable per trial to reflectspecific inclusion and exclusion criteria of the study syn-opsis. Furthermore, we introduced an enhanced IT-aidedbusiness process for identification of eligible candidatesfor clinical trials in Section V. Consequently, we sharedin Section VI design decisions and implementation de-tails of our web application supporting the analysis oflarge pools of patient data in real time.Our future work focuses on the adaption of our candi-
date eligibility metric to further indications and the useof additional criteria. Furthermore, we are working to-gether with our partners to establish our enhanced pro-cess as standard operating procedures for cost-effectiveidentification of candidates for clinical trials.
References
[1] Y. Feyman, “Shocking Secrets of FDAClinical Trials Revealed,” http://www.forbes.com/sites/theapothecary/2014/01/24/shocking-secrets-of-fda-clinical-trials-revealed/ (lastaccessed: Jun 1, 2015), 2014.
[2] World Health Organization, “Handbook for Good Clin-ical Research Practice (GCP),” http://apps.who.int/prequal/info_general/documents/GCP/gcp1.pdf (lastaccessed: Jun 1, 2015).
[3] S. J. Projan, “Why is Big Pharma Getting Out ofAntibacterial Drug Discovery?” Current Opinion in Mi-crobiology, vol. 6, no. 5, 2003, pp. 427 – 430.
[4] D. Hynes, G. Joseph, and C. Pheil, “Veterans HealthInformation Systems and Technology Architecture as aResearch Tool,” VIReC Ins, vol. 3, no. 1, 2002, pp. 1–8.
[5] United States Department of Veterans Affairs,“VistA Health System,” http://www.vistahealth.com/vista-health-system/myhealthhomepatientportal.aspx(last accessed: Jun 1, 2015), 2014.
[6] S. N. Murphy et al., “Serving the Enterprise and Beyondwith Informatics for Integrating Biology and the Bedside(i2b2),” American Medical Informatics Assoc., vol. 17,no. 2, 2010, pp. 124–130.
[7] Partners Healthcare, “i2b2 Software,” https://www.i2b2.org/software/index.html (last accessed: Jun 1,2015), 2015.
[8] M. Dugas, M. Lange, W. Berdel, and C. Müller-Tidow,“Workflow to Improve Patient Recruitment for ClinicalTrials within Hospital Information Systems: A Case-Study,” Trials, vol. 9, no. 2, 2008.
[9] H. Plattner, A Course in In-Memory Data Management:The Inner Mechanics of In-Memory Databases, 1st ed.Springer, 2013.
[10] P. Svensson, “The Evolution of Vertical Database Ar-chitectures: A Historical Review,” in Proceedings of the20th Int’l Conf on Scientific and Stat Database Mgmt.Springer-Verlag, 2008, pp. 3–5.
[11] S. S. Lightstone, T. J. Teorey, and T. Nadeau, PhysicalDatabase Design: The Database Professional’s Guide toExploiting Indexes, Views, Storage, and more. MorganKaufmann, 2007.
[12] J. M. Hellerstein, M. Stonebraker, and J. Hamilton,Architecture of a Database System, Foundation andTrends in Databases. now Publishers, 2007, vol. 1.
[13] H. Plattner and M.-P. Schapranow, Eds., High-Performance In-Memory Genome Data Analysis: HowIn-Memory Database Technology Accelerates Personal-ized Medicine. Springer-Verlag, 2014.
[14] National Cancer Institute, “The Cancer Genome AtlasData Portal Overview,” https://tcga-data.nci.nih.gov/tcga/ (last accessed: Jun 1, 2015), 2015.
[15] H. Plattner, C. Meinel, and L. Leifer, Design ThinkingResearch, ser. Understanding Innovation. Springer,2012.
[16] V. Cottin et al., “Small-Cell Lung Cancer: PatientsIncluded in Clinical Trials are not Representative of thePatient Population as a Whole,” Annals of Oncology,vol. 10, no. 7, 1999, pp. 809–815.
[17] L. Lovato, K. Hill, S. Hertert, D. Hunninghake, andJ. Probstfield, “Recruitment for Controlled Clinical Tri-als: Literature Summary and Annotated Bibliography,”Controlled Clinical Trials, vol. 18, no. 4, 1997, pp. 328–352.
[18] L. Marks and E. Power, “Using Technology to AddressRecruitment Issues in the Clinical Trial Process,” Trendsin biotechnology, vol. 20, no. 3, 2002, pp. 105–109.
[19] W. A. Giovinazzo, Object-Oriented Data WarehouseDesign: Building a Star Schema. Prentice Hall UpperSaddle River, NJ, 2000.
[20] M. M. Oken et al., “Toxicity and Response Criteria ofthe Eastern Cooperative Oncology Group,” AmericanJournal of Clinical Oncology, vol. 5, no. 6, Dec. 1982,pp. 649–656.
[21] D. A. Karnofsky, “The Clinical Evaluation ofChemotherapeutic Agents in Cancer,” Evaluationof Chemotherapeutic Agents, 1949.
[22] J. Singh, Understanding ETL and Data Warehousing:Issues, Challenges and Importance. Lambert Acad.Publishing, 2011.
[23] A. Harris and K. Haase, Sinatra: Up and Running.O’Reilly Media, 2011.
[24] A. Mesbah and A. van Deursen, “Migrating Multi-PageWeb Applications to Single-Page Ajax Interfaces,” inProceedings of the 11th European Conf on SoftwareMaintenance and Reengineering. IEEE, 2007, pp. 181–190.
[25] G. Salton, A. Wong, and C.-S. Yang, “A VectorSpace Model for Automatic Indexing,” Commun. ACM,vol. 18, no. 11, 1975, pp. 613–620.
[26] T. Kanungo, D. Mount, N. S. Netanyahu, C. D. Pi-atko, R. Silverman, and A. Wu, “An Efficient K-MeansClustering Algorithm: Analysis and Implementation,”IEEE Transactions on Pattern Analysis and MachineIntelligence, vol. 24, no. 7, 2002, pp. 881–892.
73Copyright (c) IARIA, 2015. ISBN: 978-1-61208-424-4
GLOBAL HEALTH 2015 : The Fourth International Conference on Global Health Challenges
85 / 101

Understanding the social dynamics of Twitter, Facebook and Diabetes.co.uk and their value implications for patients and health
researchers
Joanna Taylor
Centre for Population Health Sciences, University of Edinburgh , United
Kingdom Ernst and Young AG, Switzerland
email: [email protected]
Claudia Pagliari
Centre for Population Health Sciences, University of Edinburgh , United
Kingdom email:
Miles Osborne
Bloomberg LP , United Kingdom
email: [email protected]
Abstract—Health and wellness are dominant societal concerns, which is reflected in their presence on Social Media. People with diabetes use a range of Social Media to share information, build knowledge and seek peer support, but surprisingly little is known about how this behaviour varies across platforms. We drew data from a 10 day period in September 2014 from Twitter, Facebook and the Diabetes.co.uk discussion forum and classified these according to their informational and social properties, using Bales Interaction Process Analysis (IPA). Contrary to the generalisations made in previous research, Twitter is chiefly used for information dissemination, whilst Facebook and Diabetes.co.uk are also used for social interaction and peer support. These differences exist due to the structure of these platforms, including the potential for threaded discussions, the specificity of the user base and the presence of a moderator, each of which influence the nature of member interactions. Our novel findings contribute new insight about the social function of different Social Media in healthcare and the relative value of these Social Media as sources of data for health research, tools for health promotion and intervention, as well as forums for community and patient engagement.
Keywords–health, diabetes, social media, social network, Facebook, Twitter
I. INTRODUCTION
Type 1 diabetes is a chronic autoimmune condition, which occurs when the pancreas stops producing insulin. This results in increased levels of glucose in the blood, putting patients at long-term risk of heart disease, stroke, nerve damage, kidney disease and blindness. There is currently no known cure for Type 1 diabetes and those diagnosed are treated either by insulin injections, insulin pump therapy, islet cell transplantation or a pancreas transplant.
Hamm et al. (2013) concluded that patients most commonly use Social Media as a means of supporting selfcare and that the literature is dominated by studies of online discussion forums and support groups, followed by dedicated social networking sites and micro-blogs [1]. Social Media has become an increasingly popular data source for public health researchers to understand how members of patient communities interact with each other regarding specific conditions [2], [3].
Previous research has focused on single platforms such as Twitter, Facebook or condition specific online communities [3], [4], [5]. We go beyond such studies with a view to gaining
insights into the social interactions that occur across and within Social Media. We are not aware of any previously published study to have compared Twitter (twitter.com) Facebook (https://www.facebook.com/T1Diabetes ) and Diabetes.co.uk (http://www.diabetes.co.uk/forum/category/type-1-diabetes.19/) in relation to Type 1 diabetes. Motivated by this, we considered the following research questions, the answers to which will help inform the design of future successful Social Media for the purposes of health and will help patients understand better how they can manage their conditions using them:
RQ1: Do diabetes Type 1 patients use different Social Media platforms for different purposes?
RQ2: Which Social Media are successful at encouraging social interaction and support for patients?
RQ3: What are the implications for Social Media design?
Our three Social Media embody different styles of social interaction. Twitter and Facebook are well known, general purpose sites. Diabetes.co.uk is a condition specific discussion forum where users can create content and others can comment.
The rest of this paper is organised as follows. Section II describes the methodology and datasets. Section III describes outcome of RQ1. Section IV describes the outcome of RQ2. Section V describes the outcome of RQ3. Section VI provides a conclusion to close the article.
II. METHODOLOGY AND DATASETS
For our comparison of Social Media use by diabetes patients, we took a two-stage approach: firstly we extracted and screened posts made by 533 users from each of the three sites and then categorised them using the Bales IPA categories.
74Copyright (c) IARIA, 2015. ISBN: 978-1-61208-424-4
GLOBAL HEALTH 2015 : The Fourth International Conference on Global Health Challenges
86 / 101

Application of Bales Interaction Process Analysis Bales IPA system [6] was first introduced in 1951 and has been widely used in public health research as a means of identifying and recording the nature, not the content, of group interactions. Bales identified and defined twelve categories of group interaction each of which were considered when reviewing the Type 1 diabetes posts. Each post was considered a single unit of interaction and that the categories were not considered mutually exclusive when applied to the sample of posts.
Twitter A random 1% sample of all available Tweets was extracted on the 3 October 2014. The tweets were posted between 0:00:00 (UTC) on 1 September 2014 and 23:59:59 (UTC) on 10 September 2014 and were extracted by crawling the data through the standard publically available Twitter API using the pre-defined search terms diabetes, type 1 diabetes, t1 diabetes, t1d and type 1.
The data extracted included the date and time of posting in UTC, the Twitter account id and the text in the tweet. Re-tweets were identified and any duplicates and spam were removed. The sample of 1433 English language tweets was manually screened. Those that referred to Type 1 diabetes, produced a sample of 66 posts, which were subsequently included in the categorization stage. url links included in the tweets were not reviewed during the screening.
Facebook Using the Facebook search functionality, we searched for Type 1 diabetes and in doing so identified the largest Type 1 Diabetes Facebook community available. Known as the Type 1 Diabetes Community this community was established in 2011 and is intended to be an open forum for people who have Type 1 diabetes to talk about anything they want. As of 4 October 2014, it had 36,671 likes and on this same date all wall posts and replies that were posted between 1 and 10 September 2014 were identified by viewing the storyline of historical posts. These posts along with the author and the date of posting were manually extracted for further analysis. Given the particular focus of this online community, the sample of 479 posts were all considered relevant to Type 1 diabetes and therefore included in the categorisation stage.
Diabetes.co.uk Diabetes.co.uk is a global Diabetes com- munity with over 125,000 members spanning all forms of the condition. The Type 1 discussion forum on Diabetes.co.uk was identified through the forum homepage and the list of discussion threads was then filtered based on the start date 1 September 2014. All original posts and replies posted between 1 and 10 September 2014, were identified and manually extracted. The total sample of 713 posts was included in the categorisation stage.
Extraction and screening of relevant posts The output of the extraction and screening of Type 1 diabetes posts are summarised in Table 1, where we see the number of posts extracted from each of the three Social Media, the number of original posts and replies included in the sample and their respective number of authors.
III. RQ1: DO DIABETES TYPE 1 PATIENTS USE DIFFERENT SOCIAL MEDIA PLATFORMS FOR
DIFFERENT PURPOSES?
Surprisingly, although Twitter had the highest absolute number of total posts at 1433, these results revealed that it is a noisy source of data compared to other Social Media as only 66 posts were relevant to the condition of Type 1 diabetes. Contrary to expectations, the results also revealed that despite being a popular Social Media, Facebook, with a total of 479 posts, was not the most actively used platform for members to discuss the condition. Instead the discussion forum on Diabetes.co.uk was identified as being the most actively used Social Medium included in the study, with a total of 713 posts during the 10-day period.
The sample of Twitter data contained notably fewer responses to posts (0%), than Facebook (96.6%) and Diabetes.co.uk (94.2%). suggesting that there is a greater degree of two-way communication between users of social networks and discussion forums compared to micro-blogging platforms. Twitter has less developed conversational structures, making it harder for patients to read all related comments. Facebook and Diabetes.co.uk posts include associated comments that are easily found. Facebook and Diabetes.co.uk also provided much richer posts, both in terms of length and structured content, i.e. long chains of comments.
When analysing the data further, it was identified that the community moderator who posted questions from anonymous members of community created all original posts within the Facebook community. Thus creating a degree of uncertainty, as the number of authors contributing to original posts is not available This is in contrast to the Diabetes.co.uk discussion forum and Twitter where any registered member of the site could generate an original post and that 37 and 62 members created an original post, respectively.
It was also revealed that a single post within the Facebook community generated a higher response rate relative to others. The post Over/Under time again. 153. Are you over or under? was a request from the community moderator for members to post their current blood glucose levels. This post generated 101 responses, accounting for 21% of the total sample therefore performing a role similar to that of an online survey.
In summary, our results for RQ1 indicate that patients do use different Social Media platforms for different purposes as is highlighted by the volume and conversation structures represented in the sample. Whilst Facebook appeared to be heavily moderated, this was weakly present in Diabetes.co.uk and absent in Twitter. Given these differences in utility it is natural to ask how members of the Type 1 diabetes community use these Social Media to interact with others. Surprisingly, we find that Diabetes.co.uk was the most actively used Social Medium in terms of volume, whilst Facebook achieved the highest percentage response rate. A finding widely known within the Computer Science community but not yet reflected in much of the published Public Health research that is available.
75Copyright (c) IARIA, 2015. ISBN: 978-1-61208-424-4
GLOBAL HEALTH 2015 : The Fourth International Conference on Global Health Challenges
87 / 101

TABLE I. SUMMARY OF POSTS FROM 1 – 10 SEPTEMBER 2014
Social Media Sample size Screened sample size
Posts included in IPA N (%) original posts N authors N (%) replies N reply authors
Twitter 1433 66 (4.6%) 62 0 (0%) 0 66
Facebook 479 16 (3.3%) 1 463 (96.6%) 310 479
Diabetes.co.uk 713 41 (5.7%) 37 672 (94.2%) 123 713
IV. RQ2: WHICH SOCIAL MEDIA ARE SUCCESSFUL AT ENCOURAGING SOCIAL INTERACTION AND SUPPORT
FOR PATIENTS?
The results of Bales IPA reveal differences in the nature of interactions between users of these three Social Media. These are described in Table II, where we see the percentage of posts relevant to the Bales IPA categories for each of the three Social Media. The Over/Under post accounted for one fifth of the Facebook sample. It was therefore highlighted as a separate line item so as to avoid potential skew of results within the Facebook dataset.
Whilst the three Social Media are predominantly used to disseminate suggestions, opinions and information with other members, the highest percentage of posts; Twitter (36%), Facebook (44%) and Diabetes.co.uk (55%) represent members sharing their opinion. Noticeably fewer posts ask to receive suggestions, opinions and information from other members and the majority of these are original posts.
We observe several interesting differences in the nature of the posts. As noted, Twitter is mainly used to disseminate information (29%) and opinion (36%) and not for interaction. These posts are characterised by dramatization (18%), few friendly posts (18%) and no indications of agreement or disagreement between members. Below shows some examples of these Tweets.
• 33k kids in canada went #backtoschool with diabetes. it’s time to make school a better places for t1d kids.
• sanofi launches mobile game for kids with type 1 diabetes in the uk
• did you know that the character elsa from the movie ”frozen” was in part inspired by a child with type 1 diabetes?
• amazing revolution - bionic pancreas which will automatically inject insulin to type 1 diabetes patients
• an open letter to teresa may advice on her type one diabetes
In contrast, the Type 1 Diabetes Facebook community and Type 1 Diabetes.co.uk discussion forum were considered very interactive with friendly posts accounting for 47% of Facebook posts and 46% of posts on Diabetes.co.uk. The Facebook community generated a greater percentage of agreement (12%) and disagreement (5%) compared to the other Social Media. Whilst the posts within the Diabetes.co.uk discussion forum, indicate a higher percentage of tension (12%) and unfriendly posts (3%), particularly in relation to topics such as diet and the new treatments that are available. Limited moderation of this forum has, therefore, enabled a greater diversity of opinion to be represented.
The three most popular discussion threads on Facebook community are listed in below, including the number of replies to the original post.
• Over/Under time again... 153 Are you over or under? (101)
• This may seem like an odd question but I’m more than a little curious if other T1s experience what I do. I get bit by mosquitos all the time. So much more than anyone else I know. Everyone jokes that mosquitos must love me cause my blood is so sweet. I laugh it all off cause it seems ridiculous. However, I also seem to attract bees. Kind of odd huh? I’m curious how many others experience this...if any? (63)
• Just want peoples advice really I’m 22yrs old been t1 diabetic since I was 6trs old I have one child but planning another but can’t get my hba1c past 8.5 and the docs won’t let me try till it’s 7 any tips on how to get it down? I’m on injections novo rapid and levemir, thanks (54)
The three most popular discussion threads on Diabete.co.uk
discussion forum are listed in below, including the number of replies to the original post.
• How highly would you recommend eating low carb? I know this is probably a silly question as it has quite an obvious answer! I love my carbs. I love pasta, rice and
76Copyright (c) IARIA, 2015. ISBN: 978-1-61208-424-4
GLOBAL HEALTH 2015 : The Fourth International Conference on Global Health Challenges
88 / 101

potatoes. In the past, I’ve tried to take the right amount of insulin to cover this but it’s so easy to get it wrong and misjudge it - it also means I can end up taking whopping amounts of insulin! Would you recommend I reduce my carbs? It should make my diabetes easier to manage, yes? (I’m also doing Slimming World so although I’ve read a little about LCHF, I’m not keen to start eating loads of ’fattier’ foods!) (91)
• New Flash Glucose Monitoring from Abbott Bloodless Testing Its arrived and heres a video for all you guys who wanted more info (76)
• LCHF success stories from type 1’s I created this thread as a place for fellow type 1 diabetics to share their success stories on the LCHF diet. I know there is a similar thread on the low carb forum but I found that most of the responses were from type 2’s, so I thought it’d be nice to have a specific place for us to share experiences and hopefully inspire and learn from each other! (67)
In summary, our results indicate that although the three
Social Media are all used to disseminate information about the condition, Facebook and Diabetes.co.uk are also used for social interaction and peer support. These findings provoke controversy as to the validity and application of Twitter as a popular Social Media for gaining insight into Type 1 diabetes and in its use as a means of delivering relevant health interventions.
V. RQ3: WHAT ARE THE IMPLICATIONS FOR SOCIAL MEDIA DESIGN?
Although the three Social Media can be considered a valid source of information about the clinical condition of Type 1 diabetes these platforms should not be considered equal or synonymous as has been the case in previous public health studies. Exciting implications are also revealed into the utility of condition specific Social Media as a potentially more effective means of health promotion and patient engagement.
Studies into the social shaping of technology reveal that technology does not develop according to an inner technical logic but is instead a social product influenced by the conditions of its creation and use [7]. With this in mind, we find that the way Social Media are configured and moderated as well as, through the opportunities that they offer for certain types of interaction [8] can shape the behaviours of Social Media users.
For patients living with chronic and life threatening conditions such as diabetes, different utilities are derived from dissemination directed Social Media such as Twitter than from interactive and community building Social Media such as Facebook and Diabetes.co.uk. These differences in use within healthcare are contrary to the generalisations made in existing public health studies, which extrapolate the findings from a single Social Media. This therefore provides interesting and novel applications for a diverse range of research directions that aim to understand how Social Media are used by patients with other clinical conditions and what effect this has on the use of Social Media for research, health interventions and patient engagement.
TABLE II. APPLICATION OF BALES IPA TO DIABETES POSTS
Social Media Bales IPA Categories
Shows tension Dramatises Agrees Gives Suggestions Gives Opinion Seems
Unfriendly Twitter 8 18 0 20 36 0
Facebook 4 5 9 29 33 1 Facebook (minus the over/under
post) 4 6 12 37 40 1
Diabetes.co.uk 12 7 5 18 55 3
Gives info Asks for info Disagrees Asks for
Suggestions Asks for Opinions Seems friendly
Twitter 29 8 0 5 6 18 Facebook 33 6 4 1 3 37
Facebook (minus the over/under post) 15 8 5 1 3 47
Diabetes.co.uk 32 10 1 1 6 46
77Copyright (c) IARIA, 2015. ISBN: 978-1-61208-424-4
GLOBAL HEALTH 2015 : The Fourth International Conference on Global Health Challenges
89 / 101

VI. CONCLUSION
We presented the first results from this unique study on how different types of Social Media are used by patients living with a chronic condition. In doing so we defy popular assumption and conclude that Type 1 diabetes patients use different Social Media platforms for different purposes, with Twitter primarily used by members for information and opinion sharing, with little support or empathy. Whilst Diabetes.co.uk and Facebook, by virtue of their user base, design and self moderating communities are more successful in their utility for social interaction and peer support by those living with this live long condition. These findings have important implications for Social Media and their application in the context of healthcare.
REFERENCES
[1] M. Hamm, A. Chisholm, J. Shulhan, A. Milne, S. Scott, L. Given, and L. Hartling, “Social media use among patients and caregivers: a scoping review,” BMJ OPEN, vol. 3, no. 5, 2013.
[2] D. Capurro, K. Cole, M. I. Echavarria, N. Joe, J., T., and A. M. Turner, “The use of social networking sites for public health practice and research: A systematic review,” Journal of Medical Internet Research, vol. 16, no. 3, 2014.
[3] S. Moorhead, D. Hazlett, L. Harrison, J. Carroll, A. Irwin, and C. Hoving, “A new dimension of health care: Systematic review of the uses, benefits, and limitations of social media for health communication,” Journal of Medical Internet Research, vol. 15, no. 4, 2013.
[4] E. Weitzman, B. Adida, S. Kelemen, and K. Mandl, “Sharing data for public health research by members of an international online diabetes social network,” PlOS One, vol. 6, no. 4, 2011.
[5] L. Ellis, C. Showell, and P. Turner, “Social media and patient self management: not all sites are created equal,” Studies In Health Technology And Informatics, 2013, pp. 291–295.
[6] R. Bales, Interaction process analysis : a method for the study of small groups. Addison-Wesley Press, 1951.
[7] R. Williams and D. Edge, The Social Shaping of Technology. BV, 1996.
[8] P. Smart and N. R. Shadbolt, “Social Machines,” in Encyclopedia of Information Science and Technology. IGI Global, 2014, pp. 6855–6862.
78Copyright (c) IARIA, 2015. ISBN: 978-1-61208-424-4
GLOBAL HEALTH 2015 : The Fourth International Conference on Global Health Challenges
90 / 101

A Semantic Reasoning Engine for Lifestyle Profiling
in Support of Personalised Coaching
Sara Mikolajczak, Tom Ruette, Elena Tsiporkova
Data Innovation Group
ICT & Mechatronics, Sirris
Brussels, Belgium
email: tom.ruette, [email protected]
Milena Angelova, Veselka Boeva
Computer Systems & Technologies Department
Technical University of Sofia
Plovdiv, Bulgaria
email: [email protected], vboeva@tu-
plovdiv.bg
Abstract—The aim of this research is to develop a sound
methodology enabling the profiling of coachees that are being
supported by a lifestyle coach. This profiling is to be useful for
the professional coaches to personalize their approach for
helping people acquire and maintain a healthier lifestyle. For
the coachee profiling, the known relevant factors for a healthy
lifestyle are gathered, e.g., sleep duration and activity level.
Based on coachee input in a questionnaire, to be filled in with
support of the coach, a qualitative profile is generated in terms
of food and liquids consumption, physical activity, personality
and cardiovascular risk. The modeling and reasoning
environment is realized with semantic technologies. We find
that semantic technology is an efficient technology for
performing user profiling in a digital coaching context.
Keywords—coachee profile; ontology; Semantic Web; coachee
modeling; Jena rules; protégé
I. INTRODUCTION
This research has been performed within a large ARTEMIS EU project WITH-ME [18], which aims to provide a digital coaching platform that continuously monitors, advises and interacts with coachees to help them acquire and maintain a healthier lifestyle. To reduce the variability of coachees, an initial coachee profile is constructed, based on answers to a questionnaire that is filled in by the coachee, together with a personal coach during the first coaching session. The part of the WITH-ME platform that generates an initial coachee profile is technically realized as an ontological model with a reasoning layer. This initial profile is used by the coach to determine the best strategy for helping the coachee acquire and maintain a healthier lifestyle.
Ontologies have been proven to be effective means for modeling user context [1]. Ontologies model concepts and relationships in a high level of abstraction, providing rich semantics for humans to work with and the required formalism for computers to perform mechanical processing and reasoning.
Using an ontology to model a user profile has already been proposed in various applications like web search [9], [12] and personal information management [7]. Up to this point, ontologies modeling user profiles are application-specific. Namely, each one has been created specifically for a particular domain. Taking into account the continuing incorporation of ontologies in new applications, there is an
emerging need for a standard ontology to model user profiles. Such a standard ontology would facilitate the communication between applications and will serve as a reference point when profiling functionalities need to be developed.
In this work, however, we present an ontology for modeling coachee profiles in the domain of medical services including a variety of areas such as patient care, clinical and administrative decisions, assisting devices and patient diagnostics. The developed ontology will be put to use in a web-based software application that accepts input data from a form-based interface and then presents a coachee profile in the field of healthcare. The ontology development process starts with the requirements analysis phase where concepts, attributes, relationships and axioms are identified. In the design phase, a consistent conceptual model is defined over a set of tasks, which increases the complexity of the ontology step by step. In the development phase, a suitable ontological language is used to formalize the ontology, which can help to update the ontology according to the domain concepts in the maintenance phase.
In the remainder of this paper, we first discuss related work for applying ontologies in the medical domain (Section II). Then, we discuss a number of practical issues one can encounter during the creation of an ontology (Section III). Finally, we describe the software and results in some detail (Section IV). The paper ends with a conclusion (Section V).
II. RELATED WORK
Generally, an ontology is defined as a formal, explicit specification of a shared conceptualization [13]. An ontology describes the concepts and relationships that are important in a particular domain, providing a vocabulary for that domain as well as a computerized specification of the meaning of terms used in the vocabulary [13]. The aim of an ontology is to formalize domain knowledge in a generic way and to provide a common understanding of a domain, which may be used and shared by applications and groups. An ontology is also an emerging technology for knowledge representation [14], with applications for reasoning to infer new knowledge, and with applications for data integration [15].
An ontology consists of classes, properties and individuals. A class defines a concept; individuals realize a class; individuals are linked to each other via properties; individuals are linked to data values via properties. The use
79Copyright (c) IARIA, 2015. ISBN: 978-1-61208-424-4
GLOBAL HEALTH 2015 : The Fourth International Conference on Global Health Challenges
91 / 101

of the term “individual” might seem confusing, since in natural language, it refers to a person. However, in the remainder of this paper, we will use “individual” consistently to refer to an instantiation of a class in an ontology.
Ontological technology has been widely adopted in the business and scientific communities as a way to share, reuse and process domain knowledge. Ontological technology is also central to many applications in fields including information management, systems integration and semantic web services [16]. Many studies have also demonstrated that ontologies are essential for the development of knowledge-oriented systems.
The most widely used terminology resources in the biomedical domain are the Gene Ontology and the Unified Medical Language System. The Gene Ontology (GO) project [19] is a collaborative effort to address two aspects of information integration in several domains of molecular and cellular biology. Namely, the GO project provides consistent descriptors for gene products in different databases and standardizes classifications for sequences and sequence features. The Unified Medical Language System (UMLS) [21] is maintained by the U.S. National Library of Medicine in order to facilitate the development of computer systems in the field of biomedicine and health. The UMLS consists of files and software that bring together many health and biomedical vocabularies and standards to enable interoperability between computer systems.
Huang et al. [4] developed a medical ontology to serve as the foundation for an intelligent Chinese Medical Diagnostic System (CMDS), which acts as a human expert to diagnose a number of digestive system conditions including stomachache, vomiting, hiccups, diaphragmatitis, diarrhea, dysentery, constipation, jaundice, tympanites, etc. In [5], Bouamrane et al. presented the design and implementation of an ontological knowledge-based pre-operative assessment support system, which is a generic clinical screening process, intended to identify early in a patient’s journey the potential risk of complications during or after surgery. Juarez et al. proposed in [13] an ontology-based medical knowledge base called the Causal and Temporal Knowledge Acquisition (CATEKAT2), which provides physicians with a broad spectrum of medical knowledge. Kola et al. developed an ontological knowledge base to drive an Occupational Health Application (OCHWIZ), which provides suggestions as to possible causes and industries associated with a given clinical finding related to a specific occupation [15]. Based on these suggestions, it is also capable of inferring other diseases and conditions to watch out for. Alexandrou et al. described an ontological software platform SEMPATH, which can offer personalized treatment plans by using and managing health care business processes (clinical pathways) [14]. During the execution of clinical pathways, the system considers the patient’s clinical status and reaction to the treatment scheme according to the Semantic Web Rule Language (SWRL) [29] rules in reconfiguring the next treatment steps.
Other important works with clinical relevance are SNOMED Clinical Terms (CT) [22] and ISO/EN 13606 Electronic Health Record (EHR) communication paradigm
[23]. SNOMED CT [20] provides a consistent information interchange and is fundamental to an interoperable electronic health record. It allows a consistent way to index, store, retrieve, and aggregate clinical data across specialties and sites of care. It also helps in organizing the content of EHR systems by reducing the variability in the way data is captured, encoded and used for clinical care of patients and research. EHR Archetypes are formal and standardized specifications for the representation and organization of clinical information inside electronic health records. ISO/EN 13606-2 incorporates the “openEHR” archetype approach as a standard information model, and an exchange representation, for the communication of electronic health record archetypes [23].
III. ONTOLOGY CREATION ISSUES
A. Application Context
The goal of this research is to develop an application
capable of generating a complete and qualitative lifestyle
profile based on the input of a coachee. An initial ontology
model together with the reasoning layer implemented in
SWRL has been conceived and validated as a part of the
Master Thesis work of Sara Mikolajczak at the KU Leuven,
Belgium.
Lifestyle can be modelled taking into account different
aspects, e.g., eating and drinking habits like calorie and
nutrient intake, activity levels, body and weight levels like
BMI (Body Mass Index), WC (Waist Circumference) and
WHR (Waist-Hip Ratio), levels of motivation and levels of
general (un)healthy habits (risk factors) like smoking and
sleeping habits.
To collect the relevant factors that influence a healthy
lifestyle, an extensive study of the literature [16][17] has
been performed as part of a master thesis. From this
literature study, important life style areas have been
extracted with relevant data, such as boundary values and
possible conditions that may be the consequence of
exceeding these boundaries. These data have been used in
the construction of the coachee profile.
For some areas, it was not possible to find scientifically
validated specifications of the boundary values. In this case,
non-scientific values were used to provide a full proof-of-
concept implementation. Therefore, further research is
required to refine these values in order to provide a correct
and justified tool to the coach and coachee.
B. Definition
An ontology is a “hierarchal structuring of knowledge about concepts by sub-classing them according to their properties and qualities” [6]. It can also be defined as “a declarative model of a domain that defines and represents the concepts existing in that domain, their attributes and the relationships between them” [2][6]. Thus, our lifestyle ontology gives a formalization of concepts (e.g., person, habit, motivation) in their respective classes (e.g., Person, Habit, Motivation) and the relations (e.g., is a Person, has a
80Copyright (c) IARIA, 2015. ISBN: 978-1-61208-424-4
GLOBAL HEALTH 2015 : The Fourth International Conference on Global Health Challenges
92 / 101

Habit, has a Motivation) that can exist between them. A correct definition of classes is very important for data sharing and knowledge representation.
C. Classification
Ontologies can be classified according to the level of detailed knowledge they provide. Upper ontologies provide very generic knowledge with low domain specific knowledge. For example, a disease ontology is an upper ontology compatible for any biomedical domain. General ontologies represent knowledge at an intermediate level of detail independently of a specific task. Domain ontologies represent knowledge about a particular part of the world, such as medicine, and should reflect the underlying reality through a theory of the represented domain. Finally, ontologies designed for specific tasks are called application ontologies.
D. Description
We have defined an ontology as a specification and formalization of concepts and relations between them. The domain concepts are represented by “classes”. The features of a concept are described by “properties”. These properties can be either relationships between classes, or data values of “individuals”, which are the instantiations of a class. Together with these “individuals”, this is what constitutes the domain knowledge base.
Classes are the main focus in an ontology. Classes can be sub-classed to describe more specific features of a class. For example, if we define a class Habit, it includes all the habit classes in the habit domain. The Habit class can be sub-classed to specify more specific habits like ConsumptionHabit or SleepingHabit.
Properties can be created to describe properties of a class or individual. For example, we can define a property of a class named “hasSleepingHabit”, which connects a Habit Class to the SleepingHabit class. An individual that instantiates the SleepingHabit class can have a property sleepingHabit, which holds a data value that gives the amount of hours somebody typically sleeps. We can also mention that it is possible to store a data value range as a property of an individual, e.g., sleepingHabit could contain a range of the amount of hours somebody sleeps. Moreover, fuzzy logic reasoners can be applied to optimally leverage the concept of a range.
Figure 1 shows a summary of the above discussion. The description of an ontology domain includes [3]:
The definition of a concept in the domain as classes.
The definition of an instantiation of the class as individuals.
The definition of attributes of classes or individuals as properties.
E. Ontology structure
The ontology model contains three ontologies in layers: a Core Ontology Layer, a Profiling Ontology Layer and a Reasoning Ontology Layer. They are depicted in Figure 2.
1. Core ontology – is the main ontology, which contains the classes and properties. It also contains a Standard_Profile, which is an individual that contains the boundary values that were recorded during the literature review phase.
2. Profiling ontology – contains multiple individuals that describe different parts of the final coachee profile. The final coachee profile is divided into an “eating and drinking profile”, a “motivation profile”, a “physical profile” and a “health profile”. These four aspects are discussed in some more detail below.
3. Reasoning ontology – This layer contains the individuals that are to be populated with coachee data.
Figure 1: The amount of hours that a coachee habitually
sleeps is stored in the ontology.
Figure 2: Ontology structure.
Below, we discuss in some more detail the four aspects of
the Profiling ontology layer:
Eating and Drinking Profile - In this part of the
ontology, the daily consumed food is evaluated. The
evaluation of calorie intake is based on the daily calorie
requirement (DCR), which in turn is based on the activity
level in combination with the basal metabolic rate (BMR).
The evaluation of protein, fat and carbohydrate intake is
based on the recommended rate of each nutrient in the total
amount of calories.
Thing
Habit
Consumption_Habit Sleeping_Habit
sleepingHabit
81Copyright (c) IARIA, 2015. ISBN: 978-1-61208-424-4
GLOBAL HEALTH 2015 : The Fourth International Conference on Global Health Challenges
93 / 101

Motivation profile - Based on answers given on a
list of multiple choice questions, the coachee receives a
score for being intrinsically and extrinsically motivated. The
reasoner evaluates these scores and returns an optimal
approach for motivating the coachee.
Physical profile - The physical profile is further
split into two parts: the first part concerns the body
profiling, the second part the activity profiling. The body
profile consists of a body mass index level, a waist-hip ratio
level and a waist circumference level. These levels indicate
a risk for a cardiovascular disease, given a certain BMI,
WHR and WC. The activity profile contains five activity
levels going from "sedentary" to "extremely active". The
assignment of an activity level to a coachee is based on the
her job(s), hobbies and means of transportation.
Health profile - In this part of the ontology, the
sleeping and smoking habits are modeled. The optimal daily
number of hours of sleep is defined according to certain age
categories, e.g., the optimal number of daily hours of sleep
for younger people is higher than for older people. The
smoking habit class is defined by the daily amount of
tobacco products being consumed.
F. Rules
Two formalization approaches for expressing rules have been investigated in this paper. First, the Semantic Web Rule Language (SWRL) can be used to create rules in an ontology. The SWRL is a proposed language for the Semantic Web that can be used to express rules as well as logic by combining Web Ontology Language (OWL) Description Logic (DL) or OWL Lite with a subset of the Rule Markup Language. Second, rules can also be implemented in the format specific for Apache Jena [28], which is a Java-oriented system for handling ontologies. Jena provides an Application Programming Interface (API) to extract data from and to write to Resource Description Framework (RDF) [24] graphs. Since the syntax of Jena rules is more readable, and since these rules can be more easily integrated in a software production environment, we preferred the Jena approach over the SWRL approach.
One can see below a rule that is written in Jena syntax. This rule calculates the DCR of a coachee. DCR is the amount of calories the coachee should eat in a day to maintain her current weight at the current height and age. It is calculated based on the coachee’s level of Basic Metabolic Rate (BMR) and how active the coachee is:
[DCR: (?p rdf:type core:Person) (?p physical:hasActivityProfile ?activityProfile) (?activityProfile physical:activityValue ?activityValue) (?p core:hasExternalExaminationResult ?BMRCalc) (?BMRCalc core:examinationType 'BMR') (?BMRCalc core:externalValue ?BMR) product(?activityValue, ?BMR, ?DCR) (?p core:hasExternalExaminationResult ?DCRCalc) (?DCRCalc core:examinationType 'DCR') -> (?DCRCalc core:externalValue ?DCR) ]
IV. DESCRIPTION OF SOFTWARE AND RESULTS
The software implementation that we used to build a proof-of-concept for the WITH-ME project [18] adopts a decoupled architecture, where the evaluation of the data values by the ontology and its rules is strictly separated from the web-based interface. These two components communicate via a so-called messaging system, where the output of the first component (the interface) becomes the input for the second component (the ontology and rules).
The web interface contains a number of questions that need to be filled in, some of which are depicted in Figure 3.
The decoupled architecture of the web-based software requires that the data, i.e. answers to the questionnaire, from the web-based interface is communicated to the separated ontology processing backend. To communicate between these two components, a shared message format is used, i.e. Java Script Object Notation (JSON) [25]. JSON is a lightweight data-interchange format, that is easily readable for humans, and easily generated and parsed by machines. The messaging system that is being used in WITH ME is Microsoft Azure Service Bus [26].
Figure 3: A screenshot of the web-based questionnaire
interface.
The collected personal data are sent to the backend,
which consists of a Apache Jena implementation around the ontology. The backend accepts the input data and stores them as properties in the appropriate individuals of the ontology model. A Pellet reasoner [27] is then used in the developed system. Pellet is an open-source Java-based OWL 2 reasoner. The Pellet reasoner analyzes the received data from the web system and generates newly inferred data. The inferred data together make up the coachee profile. The output of the backend is again a JSON message, which is
82Copyright (c) IARIA, 2015. ISBN: 978-1-61208-424-4
GLOBAL HEALTH 2015 : The Fourth International Conference on Global Health Challenges
94 / 101

being submitted to the messaging system. From there, it can be picked up by another decoupled component that could, as an example, generate visualizations of the coachee profile.
The proposed profiler will be evaluated on multiple coachees during the pilot phase of the WITH ME project, starting September 2015.
V. CONCLUSION AND FUTURE WORK
This paper has presented an approach for designing a semantic reasoning engine for coachee profiling. An ontological approach to knowledge representation in healthcare has been selected in the coachee profile design.
The developed system uses a web-based interface for collecting coachee data and an ontology to analyze and process the entered coachee data. Тhe performed analysis generates a coachee profile as a result. This profile can be used to optimize the coaching activities of a professional lifestyle coach, or as a basis for the creation of other software applications that expand the applicability of the developed one. For the former, an example is that a professional lifestyle coach can choose a motivational style on the basis of the motivation profile that is generated by the profiler. For the latter, an example is that a software application can use the profile to automatically recommend objectives to the coachee, on the basis of objectives of other coachees with similar user profiles.
REFERENCES
[1] N. Gurano, “Formal Ontology and Information Systems”, Formal Ontology in Information Systems, Proceedings of FOIS’98, Trento, Italy, 6-8 June 1998, pp. 3-15.
[2] J. C. Maxwell, A Treatise on Electricity and Magnetism, 3rd ed., vol. 2. Oxford: Clarendon, 1892, pp.68–73.
[3] N. F. Noy and D. L. McGuinness. “Ontology Development 101: A Guide to Creating Your First Ontology”. Stanford Knowledge Systems Laboratory Technical Report KSL-01-05M.
[4] J. Huang and M. Y. Chen, “Integrated design of the intelligent web-based Chinese Medical Diagnostic System (CMDS) – Systematic development for digestive health”, Expert Systems with Applications, vol. 32, January 2007, pp. 658-673.
[5] M. M. Bouamrane, A. Rector, and M. Hurrell, “Using Owl ontologies for adaptive patient information modelling and preoperative clinical decision support”, Knowledge and Information Systems, vol. 29, no. 2, November 2007, pp. 405-418.
[6] T. R. Gruger, “Toward Principles for the Design of Ontologies Used for Knowledge Sharing”, International Journal of Human-Computer Studied, vol. 43, no. 5-6, November-December, 1995, pp. 907-928.
[7] V. Katifori, A. Poggi,. M. Scannapieco, T. Catarci, and Y. Ioannidis, “OntoPIM: how to rely on a personal ontology for Personal Information Management”, In Proc. of the 1st Workshop on The Semantic Desktop, 20015, pp. 78-81.
[8] M. K. Smith, C. Welty, and D. L. McGuinness. “OWL Web Ontology Language Guide. W3C Recommendation”, 2004, http://www.w3.org/TR/owl-guide/ [retrieved: 6, 2015]
[9] J. Trajkova and S. Gauch, “Improving Ontology-based User Profiles”, Proc. of RIAO 2004, University of Avignon (Vaucluse), France, April 26-28, 2004, pp. 380-389.
[10] Y. Tang and R. Meersman, “DIY-CDR: an ontology-based, Do-It-Yourself component discoverer and recommender,” Personal and Ubiquitous Computing, vol. 16, no. 5, June 2011, pp. 581-595.
[11] A. Smirnov, N. Shilov, T. Levashova, L. Sheremetov, and M. Contreras, “Ontology-driven intelligent service for configuration support in networked organizations,” Knowledge and Information Systems, vol. 12 no. 2, July 2007, pp. 229-253.
[12] E. Rich, “Users are individuals: individualizing user models”, International Journal of Man-mashine Studies 18(3), 1983, pp. 199-214.
[13] J. M. Juarez. T. Riestra, M. Campos, A. Morales, J. Palma, and R. Marin, “Medical knowledge management for specific hospital departments”, Expert System Application, vol. 36, no. 10, December 2009, pp. 12214-12224.
[14] D. A. Alexandrou, I. E. Skitsas, and G. N. Mentzas, “A Holistic environment for the Design and Execution of Self-Adaptive Clinical Pathways”, IEEE Trans. On Information Technology in Biomedicine, vol. 15, no. 1, January 2011, pp. 108-118.
[15] J. Kola, B. Wheeldin, and A. Rector, “Lessons in building OWL Ontology driven applications: OCHWIZ – an Occupational Health Application”, in Proc. e-Scinece All Hands Conf., UK, 2007, pp. 71-78.
[16] NIH (National Heart, Lung and Blood Institute, “What Are the Health Risks of Overweight and Obesity?”, 2012, http://www.nhlbi.nih.gov/health/health-topics/topics/obe/risks.html [retrieved: 6, 2015]
[17] P. Kopelman, „Health risks associated with overweight and obesity,” obesity reviews, vol. 8, nr. 1, 2007, pp. 13-17.
[18] http://www.with-me-project.eu/ [retrieved: 6, 2015]
[19] Gene Ontology Consortium, “The Gene Ontology (GO) Database and Informatics Resources”, Nucleic Acids Research, Database issue, vol. 32, 2004, pp. D258-D261
[20] P. Ruch, J. Gobeill, C. Lovis, and A. Geissbühler, “Automatic medical encoding with SNOMED categories”, BMC Medical Informatics and Decision Making, vol.8, 2008, supplement 6.
[21] http://www.nlm.nih.gov/research/umls/ [retrieved: 2015-06-01]
[22] http://www.ihtsdo.org/snomed-ct/ [retrieved: 6, 2015]
[23] http://www.eurorec.org/services/archetypes/ [retrieved: 6, 2015]
[24] http://www.w3.org/TR/2014/REC-rdf-syntax-grammar-20140225/ [retrieved: 6, 2015]
[25] http://json.org/ [retrieved: 6, 2015]
[26] http://azure.microsoft.com/en-us/services/service-bus/ [retrieved: 6, 2015]
[27] E. Siring, B. Parsia, B. C. Grau, A. Kalyanpur, Y. Katz, „Pellet: a practical OWL-DL reasoner“, Web Semantics: Science, Services and Agent on the Word Wide Web, vol.5, June 2007, 51-53.
[28] http://jena.apacha.org [retrieved: 6, 2015]
[29] http://www.w3.org/Submission/SWRL/ [retrieved: 6, 2015]
83Copyright (c) IARIA, 2015. ISBN: 978-1-61208-424-4
GLOBAL HEALTH 2015 : The Fourth International Conference on Global Health Challenges
95 / 101

Detection and Classification of the Basic Emotions Using a MultimodalApproach for Emotions Detection
Chaka Koné and Cécile Belleudy
LEAT laboratoryUniversity of Nice Sophia Antipolis
CNRS UMR 7248France, Sophia Antipolis
Email: [email protected],[email protected]
Imen Tayari Meftah
REGIM laboratoryUniversity of Sfax
Sfax, TunisiaEmail: [email protected]
Nhan Le-thanh
I3S LaboratoryUniversity of Nice Sophia Antipolis
CNRS UMR 7271Sophia Antipolis, France
Email: [email protected]
Abstract—Negative emotions (anxiety, fear, anger, andgrief) may affect physical health and the quality oflife. Indeed, people with depression experience severeand prolonged feelings of negative emotions like sad-ness, anger, disgust and fear. On one hand, this paperpresents a new method for the fusion of signals forthe purpose of a multimodal recognition of eight basicemotions, on the other hand, it present a classificationof these basic emotions in three emotional classes,namely, neutral, positive and negative emotions whichare using physiological signals. After constructing anemotion data base during the learning phase, we applythe recognition algorithm on each modality separately.Then, we merge all these decisions separately by apply-ing a decision fusion approach to improve recognitionrate. The experiments show that the proposed methodallows high accuracy emotion recognition. Indeed, weget a recognition rate of 81.69% under some conditions.
Keywords— Signal fusion method; basic emo-tions; multimodal detection; physiological signals.
I. Introduction
Historically, emotions had a great impact on ourbehavior, our feelings and we are constantly trying tomanage our emotions as well as the people that surroundus, in order to live together in harmony. Indeed, emotionsenable us to communicate with our environment but alsoto adapt, to innovate, to succeed, and to flourish.
A lot of research based on video application orspeech analysis [9][10] (EMOTIENT, Eurospeech, NiceSpeech) has emerged to analyze emotions, with the aim,amongst other, to provide a real-time, aggregate view ofusers feelings and in general to identify customer dissatis-faction. The solution proposed in this article targets thehealthcare domain in that it monitors biological signals,but in a non-intrusive manner for the benefit of patients.
In the future, emotion detection tests will be verychallenging because they constitute a key point to analyzethe impact of all medical treatments, and the resultingdevice market will probably be substantial. We shouldalso note that neurodegenerative diseases are characterizedby the presence of cognitive and behavioral disturbances,
gradually resulting in a loss of autonomy for the real-ization of acts of the daily routine. These disturbancescan fluctuate over time, making the evaluation sometimesdifficult with the usual clinical tools. Non-pharmacologicalapproaches for their daily care must be favoured, as phar-macological approaches are time-consuming and involvea significant financial cost as they require a qualifiedprofessional entourage who are regularly sought. In thiscontext, the use of new Information and Communica-tion Technologies (ICT) can improve both clinical as-sessment techniques, but also non-medicated therapeutictechniques. Monitoring patients requires, amongst other,being able to assess their emotional state. The informationproduced is an aid for the diagnosis and the applicabilityof medical treatments.
Indeed, new technologies benefiting people’s healthhave emerged and have allowed, for example, developingthe bases of affective computing, defined by RosalindPicard in 1995 [8]. This is an area which aims to studythe interactions between technology and emotion to givemachines the ability to understand, to interpret our emo-tions, or even express emotions. Affective computing offersmany advantages such as the battle against depression,interactive games, E-Learning, etc.
Our goal is to collect the physiological signals ofa person under different conditions of real life to detectemotions automatically. We propose a method for a mul-timodal detection of emotions using physiological signals.The paper is structured as follows. In Section 1, a briefstate of the art on the multimodal recognition of emotionsand different methods to merge signals is described. InSection 2, all the steps of the proposed methods areexplained in detail; in Section 3, a comparison is madebetween our results and those obtained in the state ofthe art; finally, conclusion and future work are reportedin Section 4.
II. State of the art
Emotions detection systems are based on threefundamental steps: acquisition of the signals, features
84Copyright (c) IARIA, 2015. ISBN: 978-1-61208-424-4
GLOBAL HEALTH 2015 : The Fourth International Conference on Global Health Challenges
96 / 101

extraction of these signals and the emotions detection.Many works were focused on the emotions detection us-ing facial expressions, vocal expressions or physiologicalsignals [14][15][16]; however, fewer studies are focused onthe multimodal recognition [2] of emotions. The use of amultimodal approach allows not only enhancing the recog-nition rate but it gives more strength to the system whenone of these modalities is acquired in a noisy environment[3]. In theory, there are three methods [12] to merge thesignals from various sensors: fusion at the signal level(fusion of physiological signals), feature level fusion (fusionof features) and decision level fusion (fusion of decisions)[4][5].
1) Fusion of signals [4]: This fusion is performedon raw data directly (as shown in Figure 1) from eachphysiological signal sensor; it can be applied only whensignals are similar in nature and have the same temporalresolution. This technique is, therefore, rarely used onaccount of the difficulty of merging the different signalsand the noise due to the sensor’s sensitivity.
Figure 1. Signals level fusion
2) Fusion of features [5]: This fusion method (seeFigure 2) is most frequently used; it aims at forming amultimodal vector from features vectors extracted for eachsensor. It has the advantage of requiring only a singlelearning phase and the resulting feature vector is multi-modal. Otherwise, all descriptors must be synchronizedand the treatment is done without taking into account theinteractions that may exist between the various parame-ters.Several techniques have been proposed in the literature
Figure 2. Characteristic level fusion.
[6][7], notably the concatenation of unimodal features vec-tors, the method of K-Nearest Neighbors (KNN) [17], theAnalysis Principal Component (ACP) [8] etc. Fission andFusion based Hilbert Huang Transform (HHT) featuresconsist in the extraction from Intrinsic Mode Function(IMF) by applying the Empirical Mode Decomposition(EMD) [13].o Fission: We extract 2 features: instantaneous frequencyand amplitude using the Hilbert transform on each IMF.
o Fusion: We determine the use of weighted mean fre-quency, and the mean instantaneous frequency.
This technique of fusion based HHT features (fusionof 4 physiological signals) has allowed to have a 62%recognition rate while MIT’s hybrid method Sequentialfloating forward search - Fisher projection (SFFS-FP)allowed to have an 83% recognition rate. Nevertheless,the SFFS-FP method allows to determine emotions duringa fixed time interval, therefore it does not permit aninstantaneous detection. The SFFS-FP method, based ona scenario, calculates the characteristics of a given emo-tion, and then reduces the number of characteristic data,which enables emotions detection over a long period butnot instantaneously. Unlike MIT’s method that does notpermit an instantaneous emotions detection, our methodallows automatic and instantaneous detection of emotions.
In the following section, we focus our study on theinstantaneous detection of emotions.
3) Fusion of decisions: After having classified sepa-rately from each sensor signals, this is a way to merge thesedifferent decisions in order to obtain a global vision of theemotion. Unlike features level fusion, this fusion techniqueis independent of the nature of the low level features usedfor decision making [4].The most used and most intuitive technique is to take
Figure 3. Decision level fusion.
into account for the vote all modalities (each sensor: Elec-troMyoGram (EMG), ElectroCardioGram (ECG), Gal-vanic Skin Response (GSR),Blood Volune Pulse (BVP)),and to choose the decision expressed by the maximum ofmodalities; Figure 3 shows the steps for this technique.
III. Methodology
In this section, we present a new multimodal andautomatic method of emotions recognition based on thefusion of the above decisions. Our method is divided intotwo major phases, namely: the Learning phase and theDetection phase.
A. Learning phase
This phase consists of four steps (signal splitting,filtering, feature extraction, creation of the basis for learn-ing) in order to provide a learning base which will then beused in the detection phase for the automatic detectionof emotions. Figure 4 shows the synoptic of the learningphase.
85Copyright (c) IARIA, 2015. ISBN: 978-1-61208-424-4
GLOBAL HEALTH 2015 : The Fourth International Conference on Global Health Challenges
97 / 101

Figure 4. Synoptic of the learning phase.
1) Signal splitting: In this step, after having ac-quired the physiological signal (here we use the physio-logical signals provided by MIT [1]), we isolate the partof the signal corresponding to a given emotion becausewe have information on the period in which each of theeight emotions is expressed. Therefore, this step dividesthe input signal into eight portions of signal correspondingto eight emotions.
2) Filtering: After having isolated the signal, wefilter it to remove the noise of the useful signal, which willfacilitate the extraction of the features. We have optedfor the convolution method for filtering, which consists inconvoluting the signal in the spatial domain with differentfilters (for which we chose the Hanning filter [8]). Thismethod is less computationally expensive in calculations.
3) Extraction of features: For each isolated andfiltered signal, we proceed to the detection of peaks, whichis done by calculating the gradient of the signal and then,finding the sign changes in the gradient, because it is rareto find points in discrete signals where the gradient iszero. A maximum is shown by the passage of a positivegradient to a negative gradient, a minimum by the passageof a negative gradient to a positive gradient. To detectand isolate a peak, our method should detect a minimumfollowed by a maximum followed by a minimum. Once apeak is isolated, we calculate a feature vector composed offive features that are: the mean, the variance, the mean ofthe filtered signal, the variance of the filtered signal, andthe amplitude of the peak.
4) Creation of the Learning phase: After extractionof the features vectors, we create a learning base foreach modality. Thus, at the end of this step, we get 4learning bases which are made of 30 vectors for eachemotion, resulting in a total of 240 features vectors. 40%of the signals available for each modality were used for thecreation of the learning base and the remaining 60% wereused for detection (test).
B. Detection phase
Our research is based on that of Imen [8], whichhas developed a new vector method to represent emotions.Therefore, each emotion is written as a linear combinationof the 8 basic emotions (B) we considered. Indeed, eachemotion e can be written as: (B)= (No emotion, anger,hate, grief, love, romantic love, joy and reverence)
(e) =8∑
i=1< E, ui > ui (1)
(e) = α1 ∗NoEmotion+α2 ∗Anger+ ...+α8 ∗Reverence(2)
(e) = (α1 α2... α8)B (3)
where (α1, α2, ..., α8) are the probabilities of thefeature vector extracted belonging to each emotional classof our base. This phase consists of two steps. The first stepconsists in the extraction of features, requiring the samesteps as in the learning phase, without going through thesplitting step since in this phase, there is no informationbeforehand on the period at which every emotion is ex-pressed.
The remainder of our process will be based onthis features extraction step. It is necessary to detect apeak (an emotional activity) before pass to classificationstep. Indeed, thanks to this condition on the necessityof detecting an emotional activity, our method allows aninstantaneous recognition of emotions. The second stepis classification, the purpose of which is to predict theemotional class of the features vector extracted using ourlearning base, which was developed in the learning phase.We opted for the classification using the K-Nearest Neigh-bors (KNN) algorithm, which is based on the calculationof the Euclidean distance between the extracted featurevector, the emotional class of which is to be predicted,and 30 features vectors, which are found in our learningbase. This allows determining the K nearest emotions inour database of extracted feature vector. Studies [8] haveshown that the optimal value of K = 10 and the size ofthe Hanning window n = 500 enable the best detection.For example, in our algorithm, at the classification stage,among the K = 10 Nearest Neighbors, we have 6 elementsbelonging to the anger emotional class, 3 elements belong-ing to the grief emotional class and 1 element to the hateemotional class. Thus, the resulting emotional vector is:
(e) = 0.6 ∗Anger + 0.3 ∗Grief + 0.1 ∗Hate (4)
where the coefficients (0.6, 0.3, and 0.1) are the prob-abilities of the feature vector extracted belonging to eachemotional class of our base. Of this emotional vector, wekeep as a final decision the most likely emotional class (theanger class in the above example).
86Copyright (c) IARIA, 2015. ISBN: 978-1-61208-424-4
GLOBAL HEALTH 2015 : The Fourth International Conference on Global Health Challenges
98 / 101
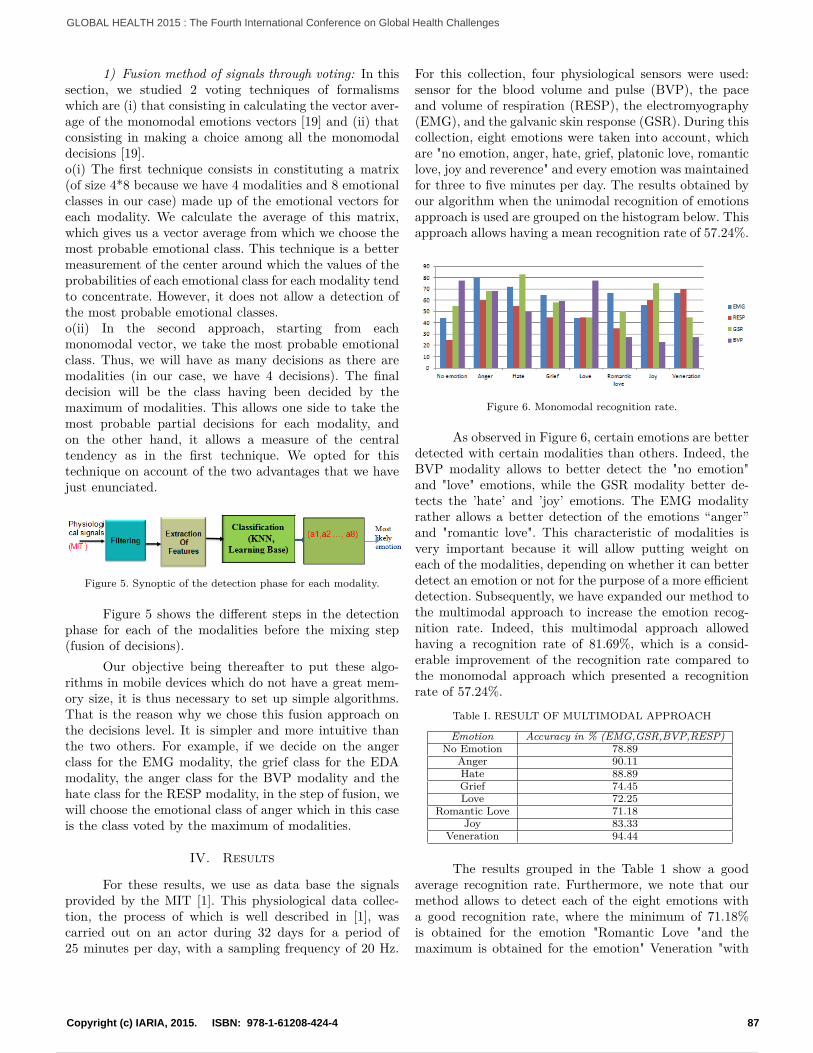
1) Fusion method of signals through voting: In thissection, we studied 2 voting techniques of formalismswhich are (i) that consisting in calculating the vector aver-age of the monomodal emotions vectors [19] and (ii) thatconsisting in making a choice among all the monomodaldecisions [19].o(i) The first technique consists in constituting a matrix(of size 4*8 because we have 4 modalities and 8 emotionalclasses in our case) made up of the emotional vectors foreach modality. We calculate the average of this matrix,which gives us a vector average from which we choose themost probable emotional class. This technique is a bettermeasurement of the center around which the values of theprobabilities of each emotional class for each modality tendto concentrate. However, it does not allow a detection ofthe most probable emotional classes.o(ii) In the second approach, starting from eachmonomodal vector, we take the most probable emotionalclass. Thus, we will have as many decisions as there aremodalities (in our case, we have 4 decisions). The finaldecision will be the class having been decided by themaximum of modalities. This allows one side to take themost probable partial decisions for each modality, andon the other hand, it allows a measure of the centraltendency as in the first technique. We opted for thistechnique on account of the two advantages that we havejust enunciated.
Figure 5. Synoptic of the detection phase for each modality.
Figure 5 shows the different steps in the detectionphase for each of the modalities before the mixing step(fusion of decisions).
Our objective being thereafter to put these algo-rithms in mobile devices which do not have a great mem-ory size, it is thus necessary to set up simple algorithms.That is the reason why we chose this fusion approach onthe decisions level. It is simpler and more intuitive thanthe two others. For example, if we decide on the angerclass for the EMG modality, the grief class for the EDAmodality, the anger class for the BVP modality and thehate class for the RESP modality, in the step of fusion, wewill choose the emotional class of anger which in this caseis the class voted by the maximum of modalities.
IV. Results
For these results, we use as data base the signalsprovided by the MIT [1]. This physiological data collec-tion, the process of which is well described in [1], wascarried out on an actor during 32 days for a period of25 minutes per day, with a sampling frequency of 20 Hz.
For this collection, four physiological sensors were used:sensor for the blood volume and pulse (BVP), the paceand volume of respiration (RESP), the electromyography(EMG), and the galvanic skin response (GSR). During thiscollection, eight emotions were taken into account, whichare "no emotion, anger, hate, grief, platonic love, romanticlove, joy and reverence" and every emotion was maintainedfor three to five minutes per day. The results obtained byour algorithm when the unimodal recognition of emotionsapproach is used are grouped on the histogram below. Thisapproach allows having a mean recognition rate of 57.24%.
Figure 6. Monomodal recognition rate.
As observed in Figure 6, certain emotions are betterdetected with certain modalities than others. Indeed, theBVP modality allows to better detect the "no emotion"and "love" emotions, while the GSR modality better de-tects the ’hate’ and ’joy’ emotions. The EMG modalityrather allows a better detection of the emotions “anger”and "romantic love". This characteristic of modalities isvery important because it will allow putting weight oneach of the modalities, depending on whether it can betterdetect an emotion or not for the purpose of a more efficientdetection. Subsequently, we have expanded our method tothe multimodal approach to increase the emotion recog-nition rate. Indeed, this multimodal approach allowedhaving a recognition rate of 81.69%, which is a consid-erable improvement of the recognition rate compared tothe monomodal approach which presented a recognitionrate of 57.24%.
Table I. RESULT OF MULTIMODAL APPROACH
Emotion Accuracy in % (EMG,GSR,BVP,RESP)No Emotion 78.89
Anger 90.11Hate 88.89Grief 74.45Love 72.25
Romantic Love 71.18Joy 83.33
Veneration 94.44
The results grouped in the Table 1 show a goodaverage recognition rate. Furthermore, we note that ourmethod allows to detect each of the eight emotions witha good recognition rate, where the minimum of 71.18%is obtained for the emotion "Romantic Love "and themaximum is obtained for the emotion" Veneration "with
87Copyright (c) IARIA, 2015. ISBN: 978-1-61208-424-4
GLOBAL HEALTH 2015 : The Fourth International Conference on Global Health Challenges
99 / 101

a good classification rate of 94.44%. Table 2 allows doinga comparison between our results and the different resultsof the methods of the state of the art that allow aninstantaneous detection of emotions. The method we have
Table II. COMPARISON OF RESULTS
Methods Good recognition rate in %Method of Kim [11] 61.2
Fusion based HHT features [13],[8] 62Baseline [8] 71
Proposed Method 81.69
proposed allows a better classification of emotions than allthe other methods found in table 2. Statistics demonstratethat approximately 150 million people suffer from a majordepressive disorder at any moment, and almost a millioncommit suicide each year [18]. In fact, neurodegenerativediseases like Alzheimer, that are considered like a cogni-tive deficiency are caused and/or are source of negativeemotions. However, detecting and classifying emotionsdepending on whether they are negative or not can beused as a means of preventing depression and on the otherhand, it may also be used to help health professionalswho work with people with cognitive deficiencies. Basedon this important observation, we then decided to put inplace a strategy of classification of the emotional vector inthree emotional classes using the multidimensional modelmathematical proposed by Imen [17]. The three emotionalclasses we have are:
• Neutral emotions : No emotion, Reverence
• Positive emotions : Love, Romantic love, Joy
• Negative emotions: Anger, Hate, Grief
As we mentioned in the previous section, every emotioncan be written as a linear combination of other emotions,and using the algebraic representation method of emotionsdescribed in [17], from the representation of an emotionalvector, representation of the basic emotions is describedby a vector containing a single coefficient non zero. Forexample
Egrief = (0 0 0 α4 0 0 0 0)B (5)
Ejoy = (0 0 0 0 0 0 α7 0)B (6)
where α4 6= 0 and α7 6= 0By combining these two vectors of basic emotions, one canget a complex emotion defined as an emotion composed ofmore than one emotion.
Ecombination = Egrief ⊕ Ejoy = (0 0 0 α4 0 0 α7 0)B
(7)So, based on this algebraic representation, our classifica-tion method is described as follows: For each modality,after detecting an emotional vector which consists of 8eight basic emotions that each of them will be represented
in the form of the (5), combining these vectors to havethree emotional classes in the following way:
ENeutralEmotion = ENoEmotion ⊕ EReverence (8)
EP ositiveEmotion = ELove ⊕ ERomanticLove ⊕ Ejoy (9)
ENegativeEmotion = EAnger ⊕ EHate ⊕ EGrief (10)
Subsequently, we use the decisions level fusion proposedfor a multimodal classification of emotions. As we note
Figure 7. Classification recognition rate.
on Figure 7, our method allows us to have a satisfac-tory classification rate of emotions. The minimum rate of66.67% correct classification is obtained for the emotions(No emotion and grief) while we obtained a maximumof 94.44% for emotions (Anger and Love.)
V. Conclusion and perspectives
We have developed a novel method of multimodalrecognition of emotions based on the processing of physio-logical signals. The physiological signals of 4 modalitieswere used for the recognition of 8 basic emotions. Anew method for multimodal recognition based on thefusion decision level has been defined and developed. Onthe other hand, a classification method of emotions inthree emotional classes has been proposed. The differentresults show a marked improvement in the recognition rateof emotions. In our future work, on one hand, we willstudy physiological signals acquisition platforms in orderto generate our own recognition base and on the otherhand set up a complete system from the acquisition ofphysiological signals for the detection of emotions. More-over, this system will allow creating a more appropriaterecognition base for a wide range of people.
88Copyright (c) IARIA, 2015. ISBN: 978-1-61208-424-4
GLOBAL HEALTH 2015 : The Fourth International Conference on Global Health Challenges
100 / 101

References
[1] J. Healey. Wearable and automotive systems for the recognitionof affect from physiology. Media Arts and Sciences. Cambridge,Massachusetts Institute of Technology. Doctor of Philosophy,2000.
[2] N. Sebe, E. Bakker, I. Cohen, T. Gevers and T. S. Huang.Bimodal emotion recognition. In Proceedings of the 5th Inter-national Conference on Methods and Techniques in BehavioralResearch, 2005, August.
[3] M. Pantic and Leon J. M. Rothkrantz. Toward an Affect-Sensitive Multimodal Human-Computer Interaction. In Pro-ceedings of the IEEE, 2003, 91(9) pp. 1370-1390.
[4] H. Hamdi, Multimodal platform for the recognition of emotionsthrough the analysis of physiological signals: application to thesimulation of job interviews. Modeling and Simulation. Univer-sity of Angers, 2012. French.
[5] R. Sharma, V. Pavlovic and T. S. Huang. Toward multimodalhuman-computer interface. Proceedings of the IEEE,1998,86(5), pp. 853-869.
[6] P. Teissier, P. Escudier and J.L. Schwartz, Automatic Processingof spoken language -2: speech recognition, multimodal speechchapter.2002, Hermes, Paris, pp. 141–178.
[7] Q. Zhi, M. N. Kaynak, K. Sengupta, A. D. Cheok, and C. C. Ko.Hmm modeling for audio-visual speech recognition. In In Pro-ceedings of the IEEE International Conference on Multimediaand Expo (ICME ’01), 2001, pp. 136.
[8] I. T. Meftah, Modeling, detection and annotation of emotionalstates using a multi-dimensional vector space. Artificial Intelli-gence. University of Nice Sophia Antipolis, 2013. French. <NNT: 2013NICE4017>.
[9] P.Niedenthal, J. Halberstadt, J. Margolin and A. Innes-ker,Emotional state and the detection of change in facial expressionof emotion in European journal of social psychology March 92000, volume 30, issue 2.
[10] Busso, S. Lee and S. Narayanan, Analysis of Emotionally SalientAspects of Fundamental Frequency for Emotion Detection inIEEE transactions on audio, speech and language processing ,May 4 2009, vol.17 no. 4.
[11] K. H. Kim, S. W. Bang and S. R. Kim, Emotion RecognitionSystem Using Short-TermMonitoring of Physiological Signals inMedical and Biological Engineering and Computing 2004, vol.42 February 17 2004, pp. 419-427.
[12] J. Wagner, E. Andre, F. Lingenfelser and J. Kim, Exploring fu-sion methods for multimodal emotion recognition with missingdata in Affective computing IEEE Transactions on vol. 2, issue4, 12 January 2012, pp. 206-218.
[13] C. Zong and M. Chetouani, Hilbert Huang transform basedPhysiological signals analysis for emotion recognition in signalprocessing and information technology( ISSPIT), IEEE Inter-national Symposium on, December 14 2009, pp. 334-33.
[14] E. Monte-Moreno, M. Chetouani, M. Faundez-Zanuy and J.SoleCasals, Maximum likelihood linear programming data fu-sion for speaker recognition. Speech Communication, 51(9):2009. 68, pp. 820–830.
[15] A. Mahdhaoui and M. Chetouani. Emotional speech classifica-tion based on multi view characterization. In Pattern Recogni-tion (ICPR), 2010 20th International Conference IEEE, August2010, pp. 4488-4491.
[16] A. Mahdhaoui, Social Signals Analysis for Modeling the interac-tion face to face.Signal and Image Processing. Pierre and MarieCurie University- Paris VI, 2010. French.
[17] I. M. Tayari, N. L. Thanh and C. Ben Amar, Detecting depres-sion using a multidimensional model of emotional states: GlobalHealth 2012, the first international conference on global healthchallenges, ISBN: 978-1-61208-243-1, pp. 101-107.
[18] E. Van’t Hof, P. Cuijpers, W. Waheed and D. J. Stein, “Psycho-logical treatments for depression and anxiety disorders in low-and middle- income countries: a meta-analysis.” African Journalof Psychiatry, 2001, pp. 200–207.
[19] S. Hoch, F. Althoff, G. McGlaun and G. Rigoll. Bimodalfusion of emotional data in an automotive environment. InAcoustics, Speech, and Signal Processing, March 2005. Proceed-
ings.(ICASSP’05). IEEE International Conference on (Vol. 2,pp. ii-1085).
89Copyright (c) IARIA, 2015. ISBN: 978-1-61208-424-4
GLOBAL HEALTH 2015 : The Fourth International Conference on Global Health Challenges
Powered by TCPDF (www.tcpdf.org)
101 / 101