global fund banking outlook - svb.com
TRANSCRIPT
Global Fund Banking OutlookEmerging trends and insights for the private equity and venture capital ecosystemsQ4 2021
GFB Outlook ReportQ4 2021
Macro: Markets Strong Despite Looming Concerns4Capital: Ecosystem Awash With Capital7Spotlight: ESG and NFTs14Liquidity: Investors Reap Benefits From Exits17
Kristy TriesteFounding partner, CFO and CCO of Motive Partners, offers her take on six success factors for a PE/VC firm experiencing rapid growth.Page 13
2GLOBAL FUND BANKING OUTLOOK: Q4 2021
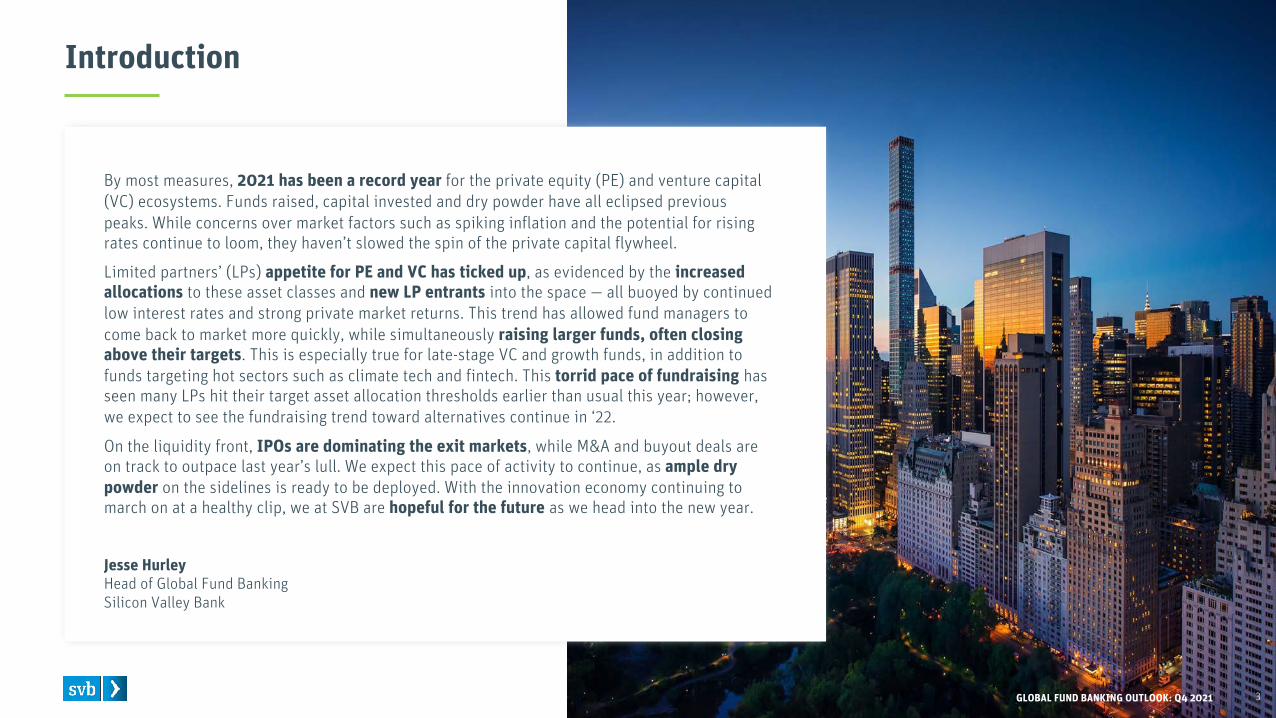
By most measures, 2021 has been a record year for the private equity (PE) and venture capital (VC) ecosystems. Funds raised, capital invested and dry powder have all eclipsed previous peaks. While concerns over market factors such as spiking inflation and the potential for rising rates continue to loom, they haven’t slowed the spin of the private capital flywheel.
Limited partners’ (LPs) appetite for PE and VC has ticked up, as evidenced by the increased allocations to these asset classes and new LP entrants into the space — all buoyed by continued low interest rates and strong private market returns. This trend has allowed fund managers to come back to market more quickly, while simultaneously raising larger funds, often closing above their targets. This is especially true for late-stage VC and growth funds, in addition to funds targeting hot sectors such as climate tech and fintech. This torrid pace of fundraising has seen many LPs hit their target asset allocation thresholds earlier than usual this year; however, we expect to see the fundraising trend toward alternatives continue in ‘22.
On the liquidity front, IPOs are dominating the exit markets, while M&A and buyout deals are on track to outpace last year’s lull. We expect this pace of activity to continue, as ample dry powder on the sidelines is ready to be deployed. With the innovation economy continuing to march on at a healthy clip, we at SVB are hopeful for the future as we head into the new year.
Jesse HurleyHead of Global Fund BankingSilicon Valley Bank
Introduction
3GLOBAL FUND BANKING OUTLOOK: Q4 2021

MacroMarkets Strong Despite Looming Concerns
4GLOBAL FUND BANKING OUTLOOK: Q4 2021
Inflation Might Be Inflated?
US CPI Change Year-Over-Year (YoY), US 10-Year and US VC Investment Since 19901, 2
Notes: 1) US VC investment includes Corporate and Private Equity Growth deals. 2) US CPI YoY and US 10-Year Treasury yield data are monthly, while US VC investment is quarterly. 3) Federal Funds Target Rate. Source: US Bureau of Labor Statistics, Federal Reserve, PitchBook, S&P Capital IQ and SVB analysis.
US CPI Change YoY for Select Categories
US VC InvestmentUS CPI US Bear MarketUS 10-Year Treasury Yield
Federal Reserve Expectations for Rate Hikes
FF Rate3
3.00%2.75% l2.50% l2.25% llllll2.00% l1.75% lll ll1.50%1.25% llllll lll1.00% l lll0.75% lll lll l0.50% llllll llll0.25% lllllllll l0.00%
2022 2023 2024
CPI excl. Food, Shelter, Energy and Used Cars & TrucksEnergy CPIUsed Cars & Trucks CPI
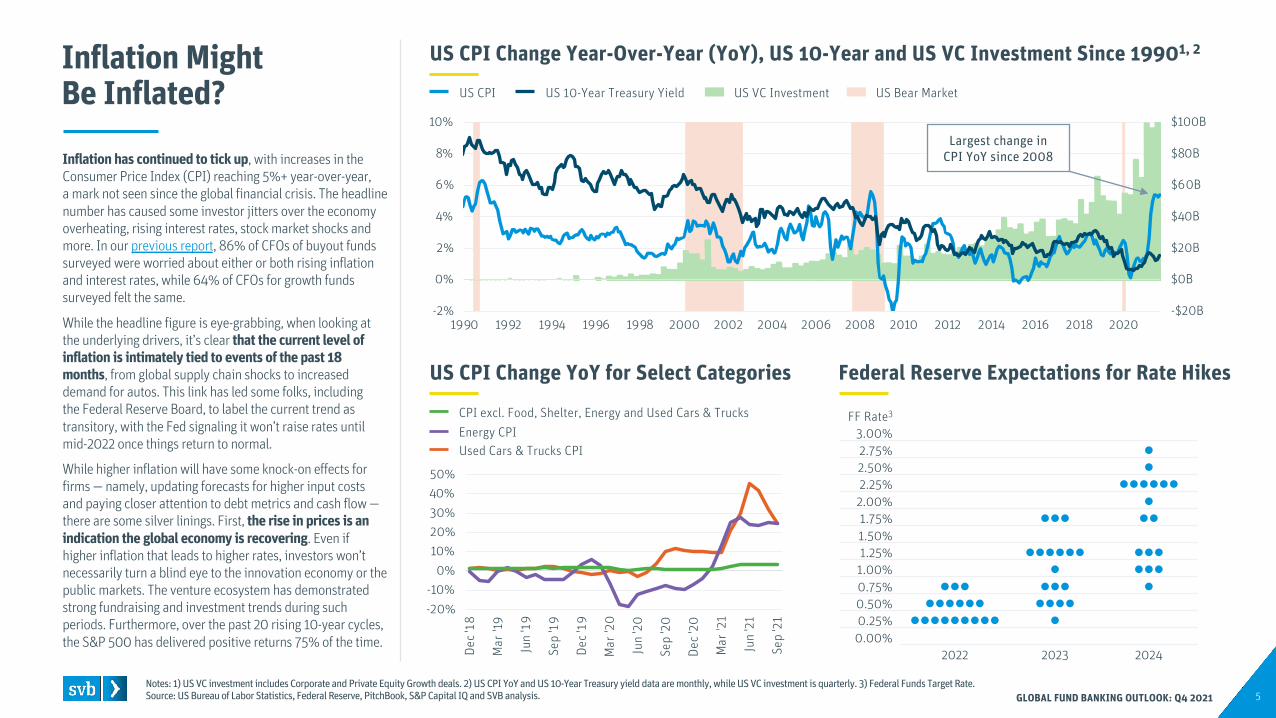
Inflation has continued to tick up, with increases in the Consumer Price Index (CPI) reaching 5%+ year-over-year, a mark not seen since the global financial crisis. The headline number has caused some investor jitters over the economy overheating, rising interest rates, stock market shocks and more. In our previous report, 86% of CFOs of buyout funds surveyed were worried about either or both rising inflation and interest rates, while 64% of CFOs for growth funds surveyed felt the same.
While the headline figure is eye-grabbing, when looking at the underlying drivers, it’s clear that the current level of inflation is intimately tied to events of the past 18 months, from global supply chain shocks to increased demand for autos. This link has led some folks, including the Federal Reserve Board, to label the current trend as transitory, with the Fed signaling it won’t raise rates until mid-2022 once things return to normal.
While higher inflation will have some knock-on effects for firms — namely, updating forecasts for higher input costs and paying closer attention to debt metrics and cash flow —there are some silver linings. First, the rise in prices is an indication the global economy is recovering. Even if higher inflation that leads to higher rates, investors won’t necessarily turn a blind eye to the innovation economy or the public markets. The venture ecosystem has demonstrated strong fundraising and investment trends during such periods. Furthermore, over the past 20 rising 10-year cycles, the S&P 500 has delivered positive returns 75% of the time.
-$20B
$0B
$20B
$40B
$60B
$80B
$100B
-2%
0%
2%
4%
6%
8%
10%
1990 1992 1994 1996 1998 2000 2002 2004 2006 2008 2010 2012 2014 2016 2018 2020
Largest change in CPI YoY since 2008
-20%-10%
0%10%20%30%40%50%
Dec '
18
Mar
'19
Jun
'19
Sep
'19
Dec '
19
Mar
'20
Jun
'20
Sep
'20
Dec '
20
Mar
'21
Jun
'21
Sep
'21
5GLOBAL FUND BANKING OUTLOOK: Q4 2021
Private Assets Deliver Strong Returns
S&P 500 Annual Returns1 Compared to Private Market Returns
6
S&P 500 Annual Return
Notes: 1) Price returns. 2) Private Equity includes Buyout and Growth funds. 3) Data for Family Offices as of 2012 as more recent data not available; Sovereign Wealth Funds (SWF) data are for North America. 4) As of 6/30/21.Source: Publicplansdata.org, National Association of College and University Business Officers, Preqin, S&P Capital IQ, Bloomberg, fund and firm press releases and SVB analysis.
Allocation to Private Equity by US LP Type3 Portfolio Returns by Select LPs
Venture Capital Internal Rate of Return (IRR) by Vintage Year
8%
4%
15%
12%
8% 7%
15% 16%
10% 10%
23%
20%
Pension Funds SovereignWealth Funds
Endowments &Foundations
Family Offices
201020152021
GLOBAL FUND BANKING OUTLOOK: Q4 2021
Pension Funds Endowments
-40%
-20%
0%
20%
40%
2000 2001 2002 2003 2004 2005 2006 2007 2008 2009 2010 2011 2012 2013 2014 2015 2016 2017 2018 2019 2020 2021
The first three quarters of 2021 were the fourth best since 2000 and the third best since 2010 following the strong rebound from the global financial crisis.
Private Equity2 IRR by Vintage Year
FY 2021 Return4 Private Equity Allocation4
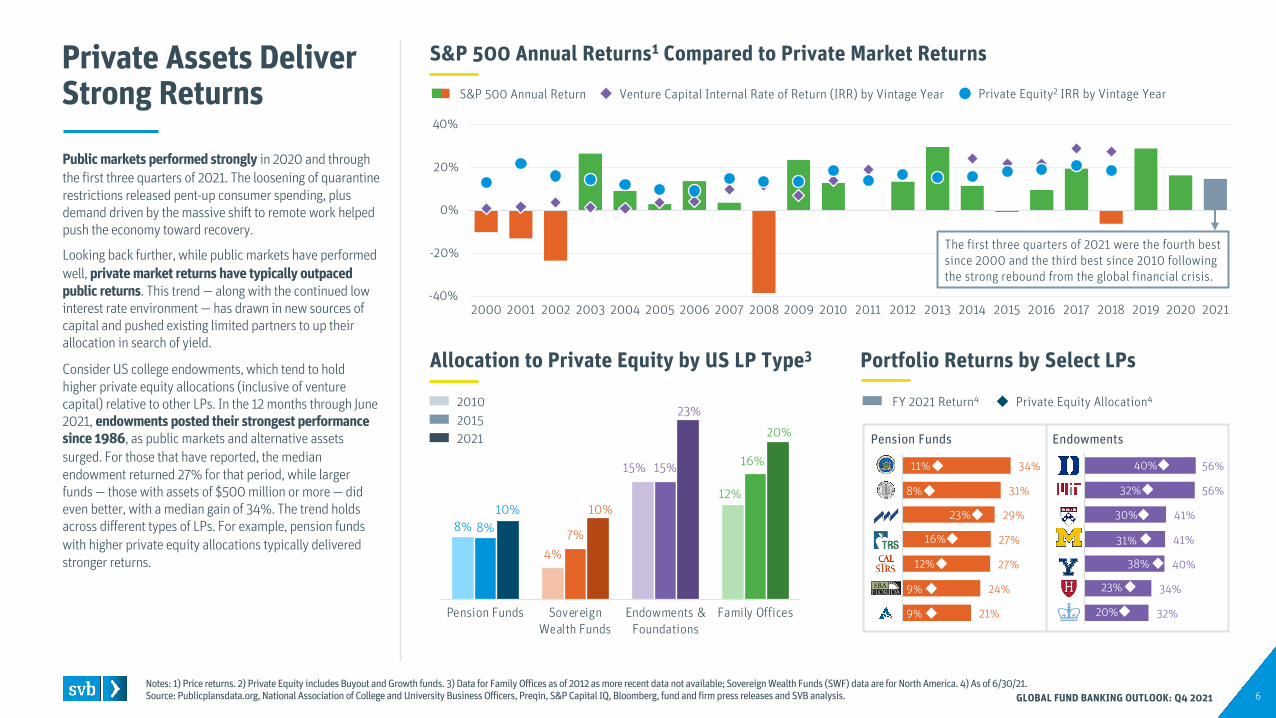
Public markets performed strongly in 2020 and through the first three quarters of 2021. The loosening of quarantine restrictions released pent-up consumer spending, plus demand driven by the massive shift to remote work helped push the economy toward recovery.
Looking back further, while public markets have performed well, private market returns have typically outpaced public returns. This trend — along with the continued low interest rate environment — has drawn in new sources of capital and pushed existing limited partners to up their allocation in search of yield.
Consider US college endowments, which tend to hold higher private equity allocations (inclusive of venture capital) relative to other LPs. In the 12 months through June 2021, endowments posted their strongest performance since 1986, as public markets and alternative assets surged. For those that have reported, the median endowment returned 27% for that period, while larger funds — those with assets of $500 million or more — did even better, with a median gain of 34%. The trend holds across different types of LPs. For example, pension funds with higher private equity allocations typically delivered stronger returns.
56%
56%
41%
41%
40%
34%
32%
40%
32%
30%
31%
38%
20%
23%
34%
31%
29%
27%
27%
24%
21%9%
9%
12%
16%
23%
8%
11%
CapitalEcosystem Awash With Capital
7GLOBAL FUND BANKING OUTLOOK: Q4 2021
Capital Continues to Mount
Notes: 1) As of 9/30/2021.Source: Preqin and SVB analysis. 8
Number of $1B+ US Funds Closed by Fund TypeUS PE & VC Fundraising1
US PE & VC Dry Powder1 US PE & VC Dry Powder Growth YoY
GLOBAL FUND BANKING OUTLOOK: Q4 2021
$424 $415$476 $478
$537$589
$670$771
$874
$1,020
$1,150
2011 2012 2013 2014 2015 2016 2017 2018 2019 2020 2021
3.5% Compound Annual Growth Rate (CAGR)
50%
13%
18%
19%
23%
54%
7%
14%
0%
10%
20%
30%
40%
50%
60%
2017 2018 2019 2020 2021
15.0% CAGRTotal Growth
360473
561692 692
880928
1,075
1,092
1,007
1,257
2011 2012 2013 2014 2015 2016 2017 2018 2019 2020 2021
1013
19
29 27 2528 28
58
4447
3 3 38
5 47
11 11
17 19
4 41
6 4 6 3 8 5
15 16
2011 2012 2013 2014 2015 2016 2017 2018 2019 2020 2021
OtherVentureGrowthBuyout
BuyoutGrowthVenture
2021 data extrapolated
Buyout Venture Other Growth
2021 data extrapolated
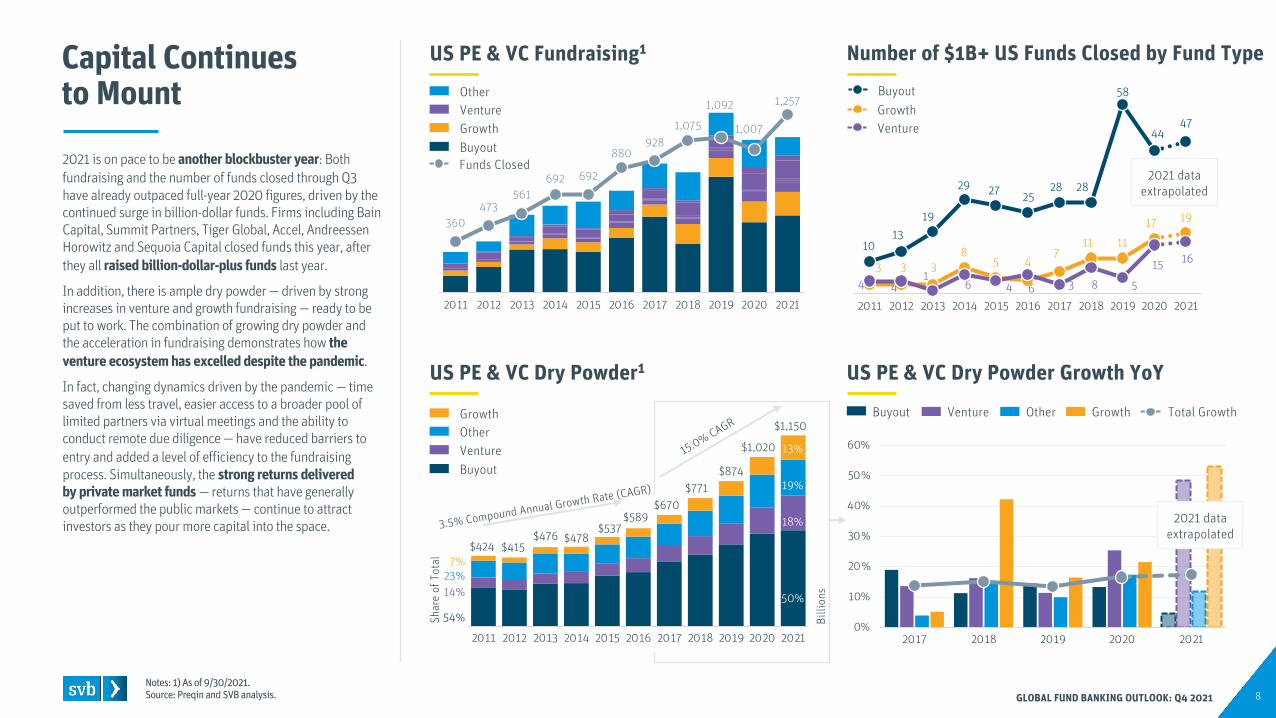
Funds Closed2021 is on pace to be another blockbuster year: Both fundraising and the number of funds closed through Q3 have already outpaced full-year 2020 figures, driven by the continued surge in billion-dollar funds. Firms including Bain Capital, Summit Partners, Tiger Global, Accel, Andreessen Horowitz and Sequoia Capital closed funds this year, after they all raised billion-dollar-plus funds last year.
In addition, there is ample dry powder — driven by strong increases in venture and growth fundraising — ready to be put to work. The combination of growing dry powder and the acceleration in fundraising demonstrates how the venture ecosystem has excelled despite the pandemic.
In fact, changing dynamics driven by the pandemic — time saved from less travel, easier access to a broader pool of limited partners via virtual meetings and the ability to conduct remote due diligence — have reduced barriers to entry and added a level of efficiency to the fundraising process. Simultaneously, the strong returns delivered by private market funds — returns that have generally outperformed the public markets — continue to attract investors as they pour more capital into the space.
GrowthOtherVentureBuyout
Shar
e of
Tot
al
Billi
ons
3
6
16
1 2
62
3
9
10%48% 11%
Large Funds Grow in Size and Share
Notes: 1) Venture Capital funds with a minimum size of $150M. 2) Fundraising capital and fund size buckets limited to Buyout, Growth and Venture Capital strategies. Source: PitchBook, Preqin and SVB analysis. 9
Share of US PE & VC Fundraising2
by Fund SizeUS Average Fund Size by Fund Type
Average Time Between Fund Series Raises: Mega Funds vs. Mid-Sized Funds
Monthly Deal Velocity by Investor Fund Bucket
GLOBAL FUND BANKING OUTLOOK: Q4 2021
51% 21% 14% 14%2011
61% 17% 11% 11%2016
69% 13% 8% 9%2021
$1B+ $500M-$1B $250M-$500M $0-$250M
VentureBuyout Growth
$250M -$500M Funds
$500M -$1B Funds
$1B+ Funds
Investments2 made per month in 2021 by size of fund closed in 2020
Example: Investors who raised a $1B+ fund in 2020 made 9 investments per month in 2021
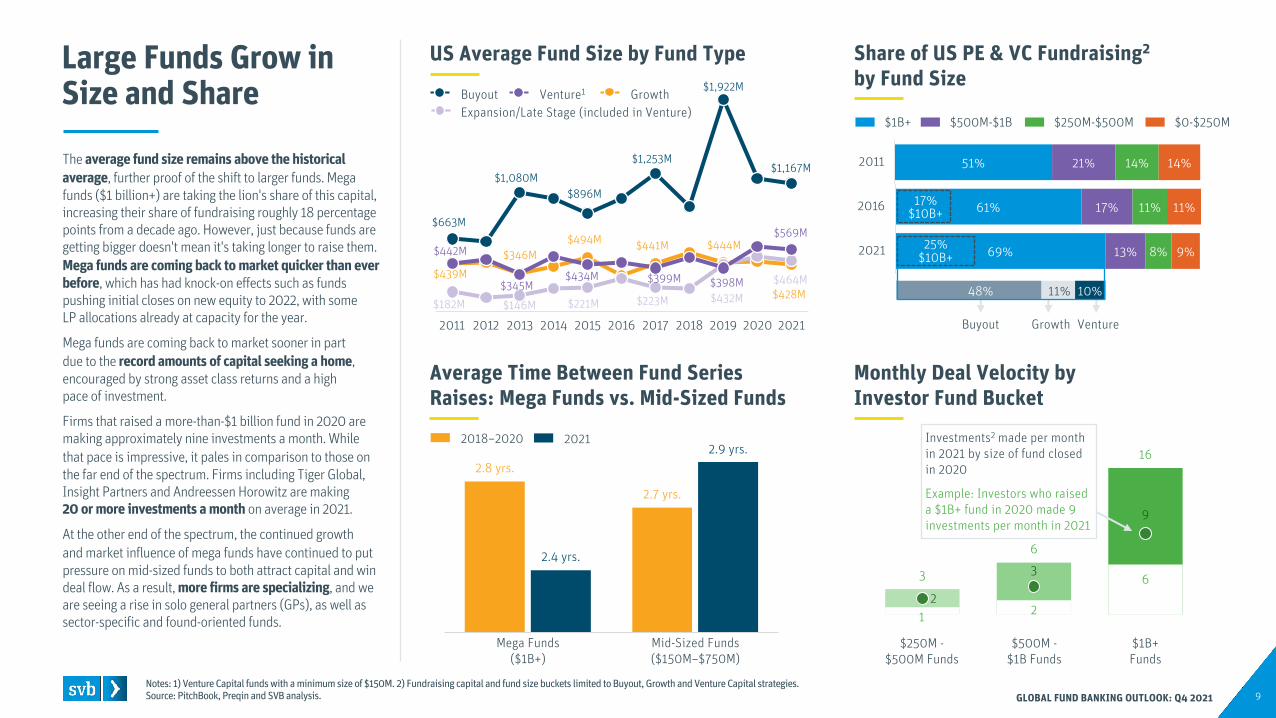
The average fund size remains above the historical average, further proof of the shift to larger funds. Mega funds ($1 billion+) are taking the lion's share of this capital, increasing their share of fundraising roughly 18 percentage points from a decade ago. However, just because funds are getting bigger doesn't mean it's taking longer to raise them. Mega funds are coming back to market quicker than ever before, which has had knock-on effects such as funds pushing initial closes on new equity to 2022, with some LP allocations already at capacity for the year.
Mega funds are coming back to market sooner in part due to the record amounts of capital seeking a home, encouraged by strong asset class returns and a high pace of investment.
Firms that raised a more-than-$1 billion fund in 2020 are making approximately nine investments a month. While that pace is impressive, it pales in comparison to those on the far end of the spectrum. Firms including Tiger Global, Insight Partners and Andreessen Horowitz are making 20 or more investments a month on average in 2021.
At the other end of the spectrum, the continued growth and market influence of mega funds have continued to put pressure on mid-sized funds to both attract capital and win deal flow. As a result, more firms are specializing, and we are seeing a rise in solo general partners (GPs), as well as sector-specific and found-oriented funds.
$663M
$1,080M$896M
$1,253M
$1,922M
$1,167M
$439M
$346M$494M $441M $444M
$428M$182M $146M $221M $223M $432M
$464M
$442M
$345M$434M $399M $398M
$569M
2011 2012 2013 2014 2015 2016 2017 2018 2019 2020 2021
17%$10B+
25%$10B+
2.8 yrs.
2.7 yrs.
2.4 yrs.
2.9 yrs.2018–2020 2021
Mega Funds($1B+)
Mid-Sized Funds($150M–$750M)
Buyout GrowthVenture1
Expansion/Late Stage (included in Venture)
Funds Exceeding Their Targets
Notes: 1) Expansion and Late-stage only. 2) For funds above $150M. Source: Preqin and SVB analysis. 10
Growth: Closed Size vs. Target Size by Year2Venture:1 Closed Size vs. Target Size by Year2
Closed Size vs. Target Size by Fund Size and Fund Number in 2021
GLOBAL FUND BANKING OUTLOOK: Q4 2021
116%118%
100% 100% 101%
112%
123%126%
113%
120% 120%
133%
102% 100% 99% 100% 100% 100%
2016 2017 2018 2019 2020 2021
111%
104%101% 100%
103%
111%
118% 119%
114%111%
109%
122%
100% 100% 100% 100% 100%
108%
2016 2017 2018 2019 2020 2021
25th Percentile
75th PercentileMedian
25th Percentile
75th PercentileMedian
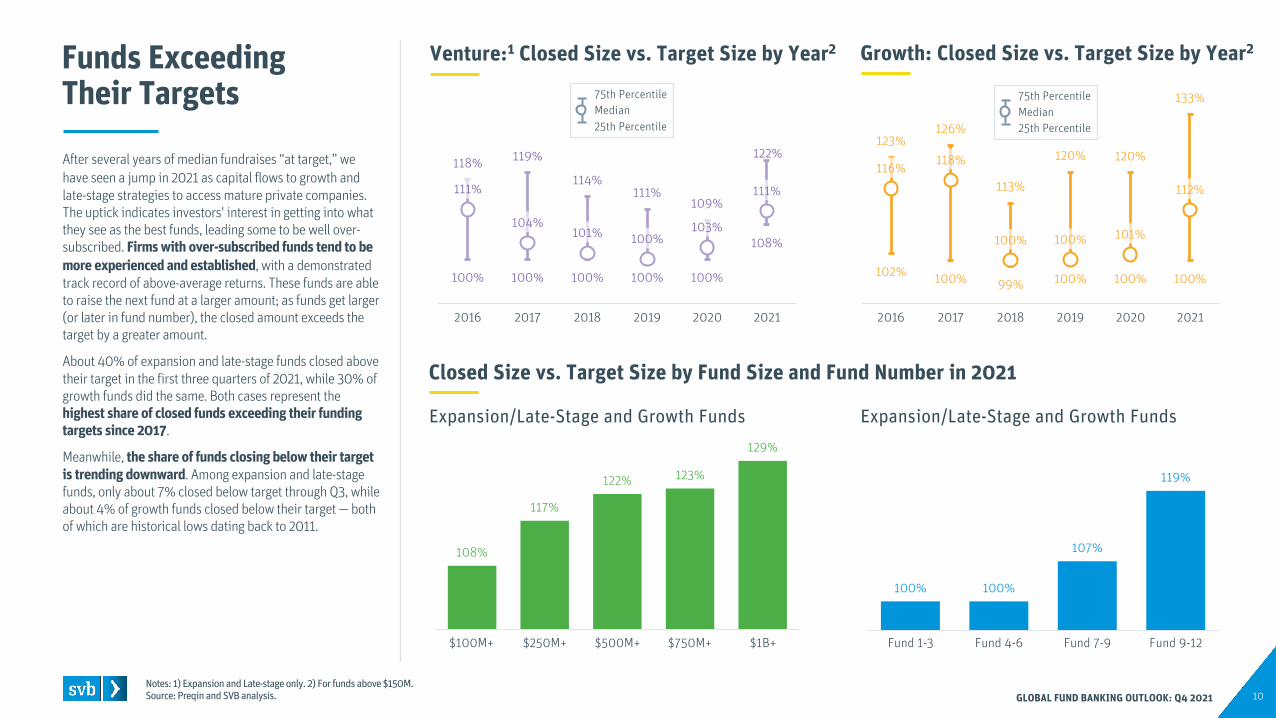
After several years of median fundraises “at target,” we have seen a jump in 2021 as capital flows to growth and late-stage strategies to access mature private companies. The uptick indicates investors' interest in getting into what they see as the best funds, leading some to be well over-subscribed. Firms with over-subscribed funds tend to be more experienced and established, with a demonstrated track record of above-average returns. These funds are able to raise the next fund at a larger amount; as funds get larger (or later in fund number), the closed amount exceeds the target by a greater amount.
About 40% of expansion and late-stage funds closed above their target in the first three quarters of 2021, while 30% of growth funds did the same. Both cases represent the highest share of closed funds exceeding their funding targets since 2017.
Meanwhile, the share of funds closing below their target is trending downward. Among expansion and late-stage funds, only about 7% closed below target through Q3, while about 4% of growth funds closed below their target — both of which are historical lows dating back to 2011.
108%
117%
122% 123%
129%
$100M+ $250M+ $500M+ $750M+ $1B+
100% 100%
107%
119%
Fund 1-3 Fund 4-6 Fund 7-9 Fund 9-12
Expansion/Late-Stage and Growth Funds Expansion/Late-Stage and Growth Funds
Funds Step Up to the Plate
Notes: 1) US Buyout, Growth and Venture Capital funds based on year closed. 2) US Venture Capital funds include US Private Equity Growth funds. 3) Does not include funds that are targeted at multiple sectors. Source: Preqin and SVB analysis. 11
Median Step Up by Fund for VC2 FundsFund1 Step Up by Year
Median Step Up by Fund for Buyout Funds Median Step Up by Sector 2019–20211
GLOBAL FUND BANKING OUTLOOK: Q4 2021
38% 44% 49% 44%34%
57%
102% 106%122%
92%72%
113%
7% 14% 8% 9%0%
15%
2016 2017 2018 2019 2020 2021
64%
50%
34%
19%17%
57%50%
30%39%
21%
76% 75%
51%
37%
17%
1 2 3 4 5Fund 1-2 Fund 2-3 Fund 3-4 Fund 4-5 Fund 5-6
2019 2020 2021
74%
41%
92%
67%
42%
105%
68% 67%54%
50%
83%
67%
43%55%
40%
Fund 1-2 Fund 2-3 Fund 3-4 Fund 4-5 Fund 5-6
100%+
25th Percentile
75th PercentileMedian
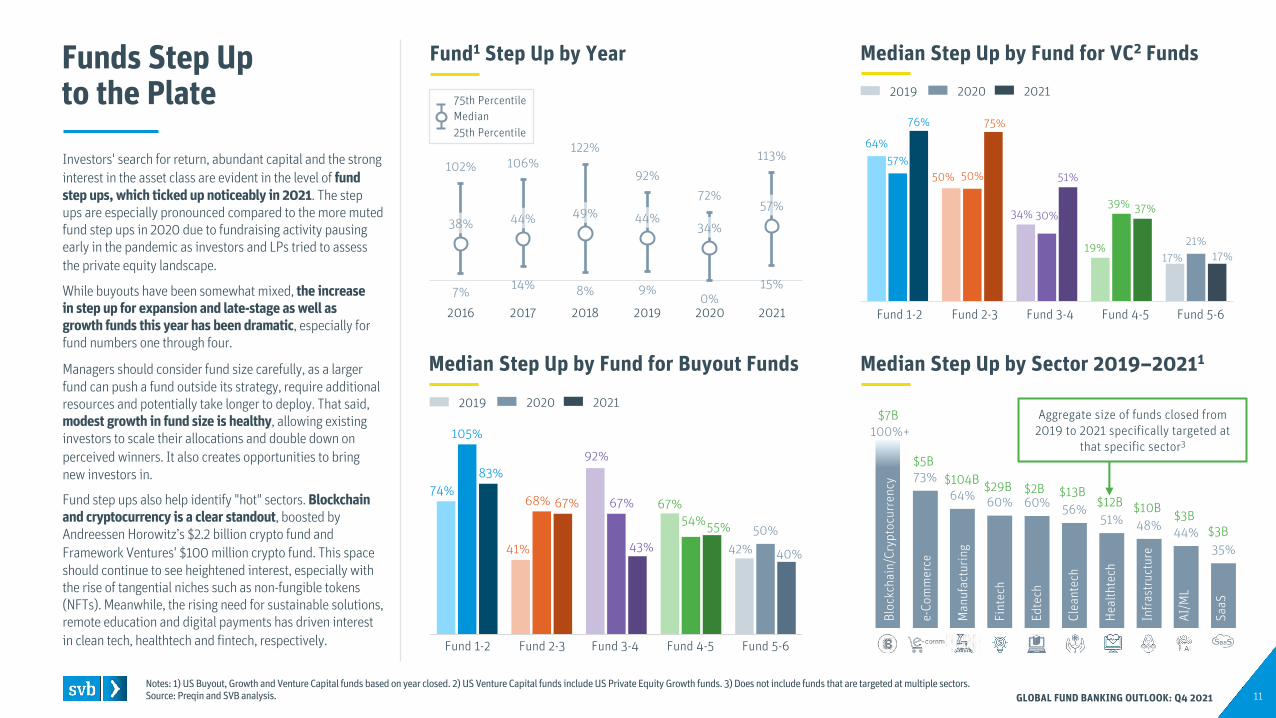
Investors' search for return, abundant capital and the strong interest in the asset class are evident in the level of fund step ups, which ticked up noticeably in 2021. The step ups are especially pronounced compared to the more muted fund step ups in 2020 due to fundraising activity pausing early in the pandemic as investors and LPs tried to assess the private equity landscape.
While buyouts have been somewhat mixed, the increase in step up for expansion and late-stage as well as growth funds this year has been dramatic, especially for fund numbers one through four.
Managers should consider fund size carefully, as a larger fund can push a fund outside its strategy, require additional resources and potentially take longer to deploy. That said, modest growth in fund size is healthy, allowing existing investors to scale their allocations and double down on perceived winners. It also creates opportunities to bring new investors in.
Fund step ups also help identify "hot" sectors. Blockchain and cryptocurrency is a clear standout, boosted by Andreessen Horowitz’s $2.2 billion crypto fund and Framework Ventures' $100 million crypto fund. This space should continue to see heightened interest, especially with the rise of tangential niches such as non-fungible tokens (NFTs). Meanwhile, the rising need for sustainable solutions, remote education and digital payments has driven interest in clean tech, healthtech and fintech, respectively.
73%64% 60% 60% 56%
51% 48% 44%35%
AI/M
L
Bloc
kcha
in/C
rypt
ocur
renc
y
e-Co
mm
erce
Man
ufac
turin
g
Fint
ech
Edte
ch
Clea
ntec
h
Heal
thte
ch
Infr
astr
uctu
re
SaaS
$7B
$5B
$29B$104B
$12B$13B$2B
$10B $3B$3B
Aggregate size of funds closed from 2019 to 2021 specifically targeted at
that specific sector3
2019 2020 2021
Ushering in a New Crop of Investors
Notes: 1) Pensions includes both public and private pensions.Source: iLevel, SVB proprietary data and SVB analysis.
2021 New LPs Based on Commitment by TypeNew LPs Added in First 9 Months: 2020 vs. 2021
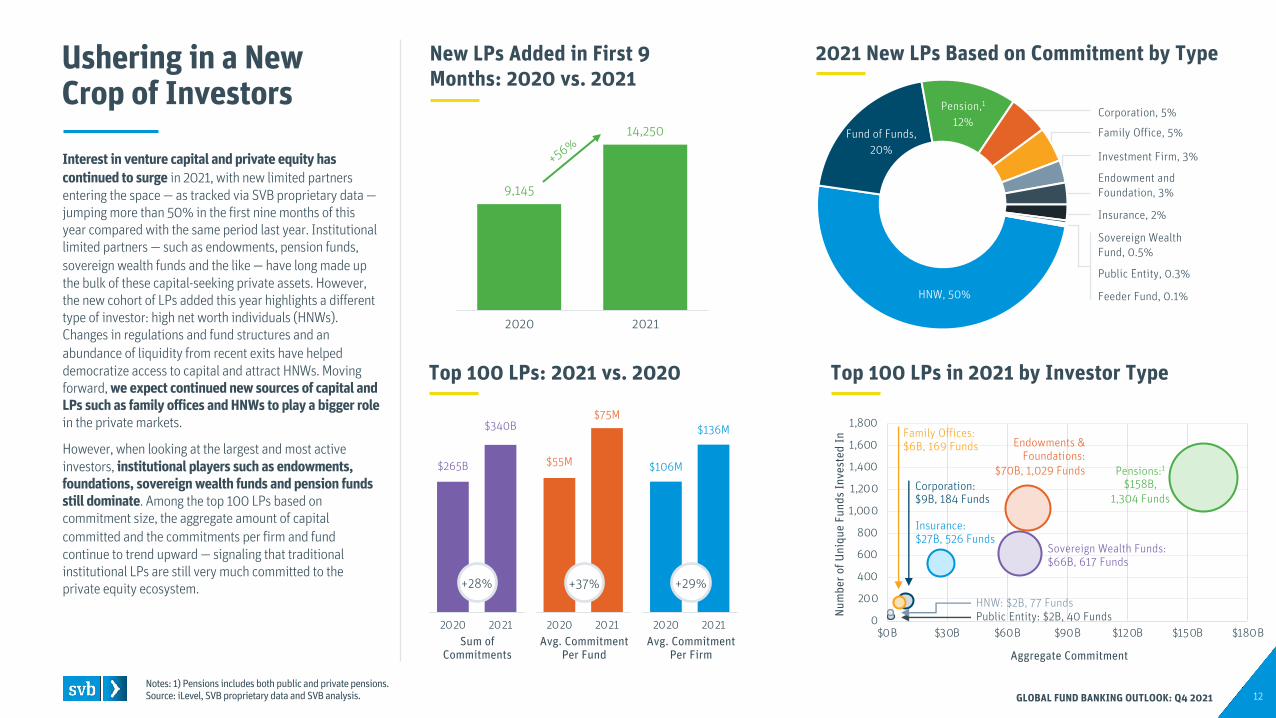
Interest in venture capital and private equity has continued to surge in 2021, with new limited partners entering the space — as tracked via SVB proprietary data —jumping more than 50% in the first nine months of this year compared with the same period last year. Institutional limited partners — such as endowments, pension funds, sovereign wealth funds and the like — have long made up the bulk of these capital-seeking private assets. However, the new cohort of LPs added this year highlights a different type of investor: high net worth individuals (HNWs). Changes in regulations and fund structures and an abundance of liquidity from recent exits have helped democratize access to capital and attract HNWs. Moving forward, we expect continued new sources of capital and LPs such as family offices and HNWs to play a bigger rolein the private markets.
However, when looking at the largest and most active investors, institutional players such as endowments, foundations, sovereign wealth funds and pension funds still dominate. Among the top 100 LPs based on commitment size, the aggregate amount of capital committed and the commitments per firm and fund continue to trend upward — signaling that traditional institutional LPs are still very much committed to the private equity ecosystem.
$265B
$340B
2020 2021
$55M
$75M
2020 2021
$106M
$136M
2020 2021Sum of
Commitments Avg. Commitment
Per FundAvg. Commitment
Per Firm
+28% +29%+37%
9,145
14,250
2020 2021
+56%
HNW, 50%
Fund of Funds, 20%
Pension,1
12%
Top 100 LPs: 2021 vs. 2020
Investment Firm, 3%
Endowment and Foundation, 3%
Insurance, 2%
Sovereign Wealth Fund, 0.5%
Public Entity, 0.3%
Feeder Fund, 0.1%
Corporation, 5%
Family Office, 5%
Top 100 LPs in 2021 by Investor Type
12GLOBAL FUND BANKING OUTLOOK: Q4 2021
0
200
400
600
800
1,000
1,200
1,400
1,600
1,800
$0B $30B $60B $90B $120B $150B $180B
Num
ber o
f Uni
que
Fund
s In
vest
ed In
Aggregate Commitment
Sovereign Wealth Funds: $66B, 617 Funds
Endowments & Foundations:
$70B, 1,029 Funds Pensions:1$158B,
1,304 Funds
Insurance:$27B, 526 Funds
Corporation: $9B, 184 Funds
Family Offices: $6B, 169 Funds
HNW: $2B, 77 FundsPublic Entity: $2B, 40 Funds
13GLOBAL FUND BANKING OUTLOOK: Q4 2021
Six Success Factors for Managing Growth
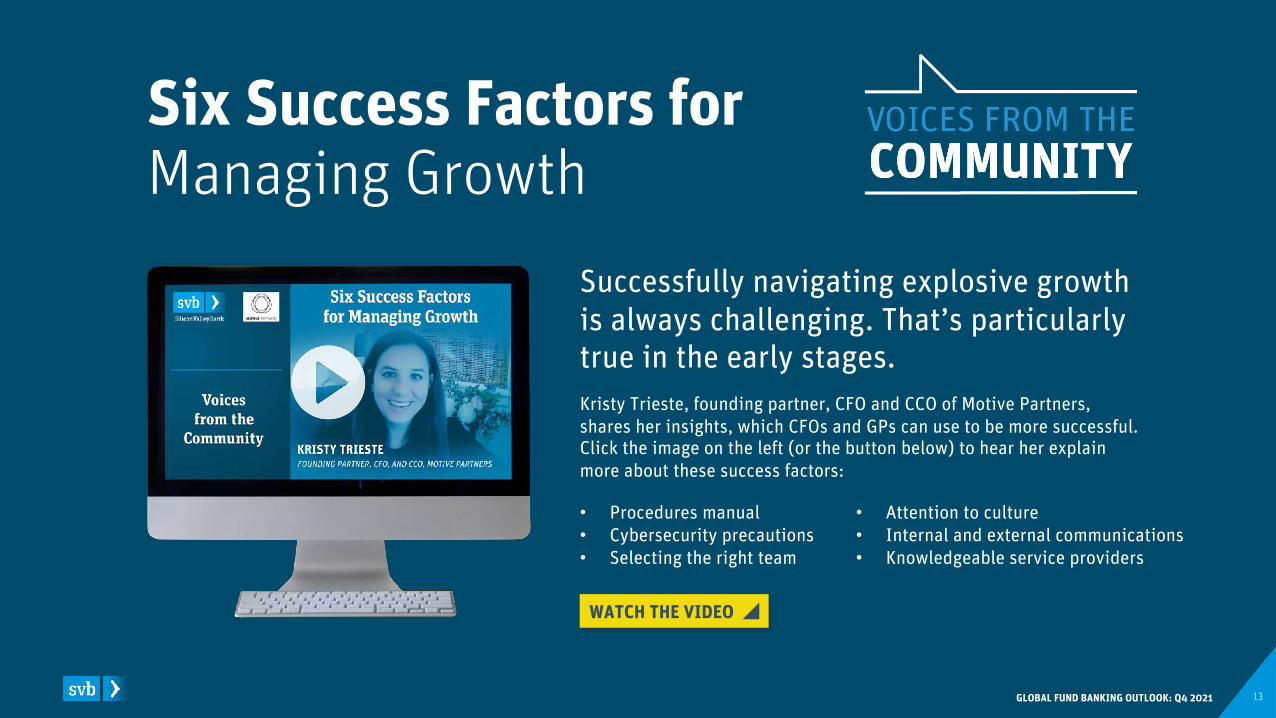
• Procedures manual• Cybersecurity precautions• Selecting the right team
Successfully navigating explosive growth is always challenging. That’s particularly true in the early stages. Kristy Trieste, founding partner, CFO and CCO of Motive Partners, shares her insights, which CFOs and GPs can use to be more successful. Click the image on the left (or the button below) to hear her explain more about these success factors:
• Attention to culture• Internal and external communications• Knowledgeable service providers
WATCH THE VIDEO
SpotlightESG and NFTs
14GLOBAL FUND BANKING OUTLOOK: Q4 2021
ESG Remains Top of Mind
Notes: 1) Global funds with a stated interest in cleantech and/or agtech. 2) Based on analysis from Climate Tech VC and updated with data from Preqin.Source: Preqin, Climatetechvc.org and SVB analysis. 15
Notable Climate Tech Funds Announced 20212Climate Tech Focused1 VC Fundraising
Financing Options for Climate Tech Startups
GLOBAL FUND BANKING OUTLOOK: Q4 2021
Median Time to Final Close
9 Months 12 Months
(+)
Idea/Startup Development GrowthConception• Technology• Product
Rollout• Market Fit• Product
Scale• Monetization• Execution• Talent
Risks
(-)
Minimum Capital Requirement
University R&DFriends & Family
IncubatorsCrowdfunding
Angel Investors
VC & CVCVenture Debt
Family Offices
Bank DebtPrivate Equity
SPACs
Government Funding
Maturity
• Market• Talent• Financing
• Talent• Financing• Early Traction
Capital Number of Funds Extrapolation
21 Months 24 Months
TimeExpansion• Market Size• Competition
Exit• Financial Market• Strategic Fit
• Execution• Talent
Capital-Light Companies Capital- and Hardware-Intensive Companies
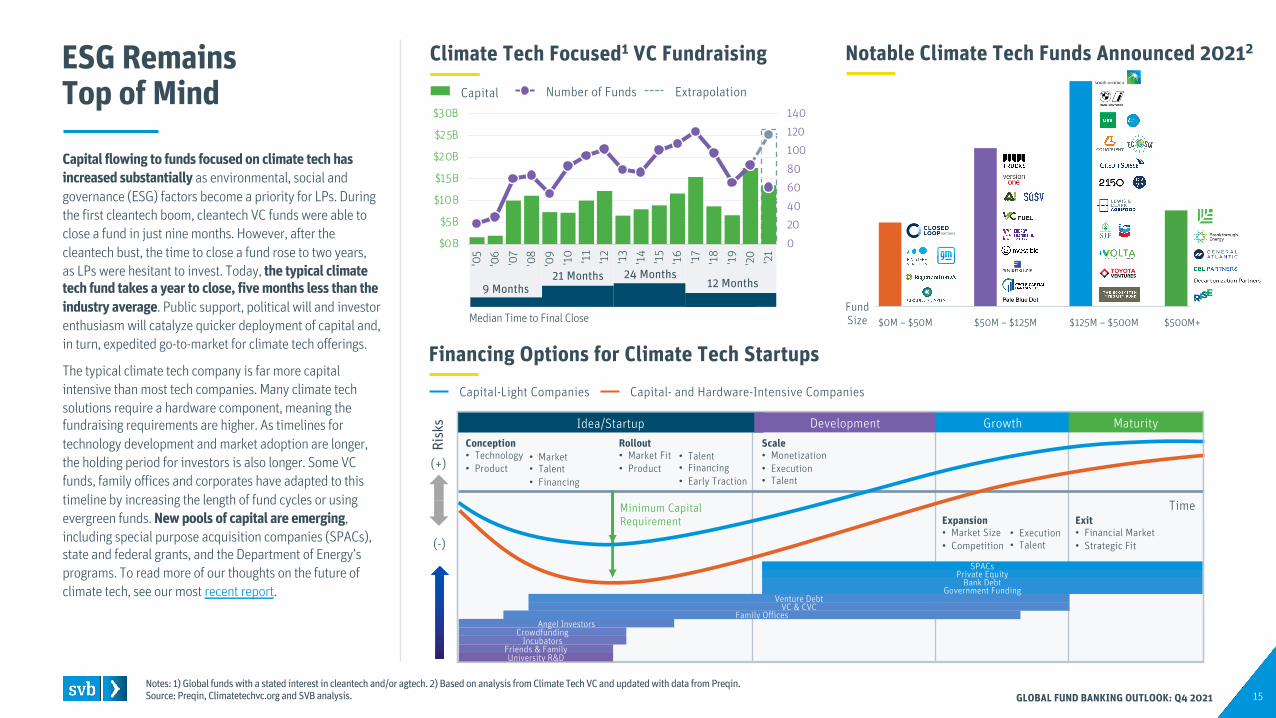
Capital flowing to funds focused on climate tech has increased substantially as environmental, social and governance (ESG) factors become a priority for LPs. During the first cleantech boom, cleantech VC funds were able to close a fund in just nine months. However, after the cleantech bust, the time to close a fund rose to two years, as LPs were hesitant to invest. Today, the typical climate tech fund takes a year to close, five months less than the industry average. Public support, political will and investor enthusiasm will catalyze quicker deployment of capital and, in turn, expedited go-to-market for climate tech offerings.
The typical climate tech company is far more capital intensive than most tech companies. Many climate tech solutions require a hardware component, meaning the fundraising requirements are higher. As timelines for technology development and market adoption are longer, the holding period for investors is also longer. Some VC funds, family offices and corporates have adapted to this timeline by increasing the length of fund cycles or using evergreen funds. New pools of capital are emerging, including special purpose acquisition companies (SPACs), state and federal grants, and the Department of Energy’s programs. To read more of our thoughts on the future of climate tech, see our most recent report.
$0M – $50M $50M – $125M $125M – $500M $500M+Fund Size
0
20406080
100120140
$0B
$5B
$10B
$15B
$20B
$25B
$30B
'05
'06
'07
'08
'09
'10 '11
'12
'13
'14 '15
'16 '17
'18
'19
'20 '21
NFT Market Takes Off
Notes: 1) Data through 10/18/2021; Includes Corporate and PE Growth deals. 2) NFT companies defined using keyword searches in company descriptions on PitchBook. Source: DappRadar, PitchBook and SVB analysis. 16
Top Investors in NFT Companies Since 20171, 2Global VC Investment in NFT Companies1, 2
OpenSea Quarterly Transaction Data Trailing 30-Day Average Daily OpenSea Users
GLOBAL FUND BANKING OUTLOOK: Q4 2021
$0.01B $0.1B $0.1B $0.1B$2.1B
$0.1B$0.4B $0.4B $0.2B
$17.4B
7 17 19 21
128
2017 2018 2019 2020 2021
Deal Count
Genesis Block Ventures
Coinbase Ventures
AndreessenHorowitz
AnimocaBrands
AU21Capital
CoinFund
Morningstar Ventures
Spark DigitalGroup
GenblockCapital
Digital Currency
17 10111114
9 7788
Number of investments made in NFT companies since 2017
$0.0B $0.0B $0.0B $0.0B $0.2B $0.3B
$6.2B
87K 49K 32K 82K 271K 618K
5,285K
Q1 2020 Q2 2020 Q3 2020 Q4 2020 Q1 2021 Q2 2021 Q3 2021
0K
5K
10K
15K
20K
25K
30K
35K
Dec '
19
Mar
'20
Jun
'20
Sep
'20
Dec '
20
Mar
'21
Jun
'21
Sep
'21
Capital Invested Post Valuation Sum
Transaction CountTransaction Volume
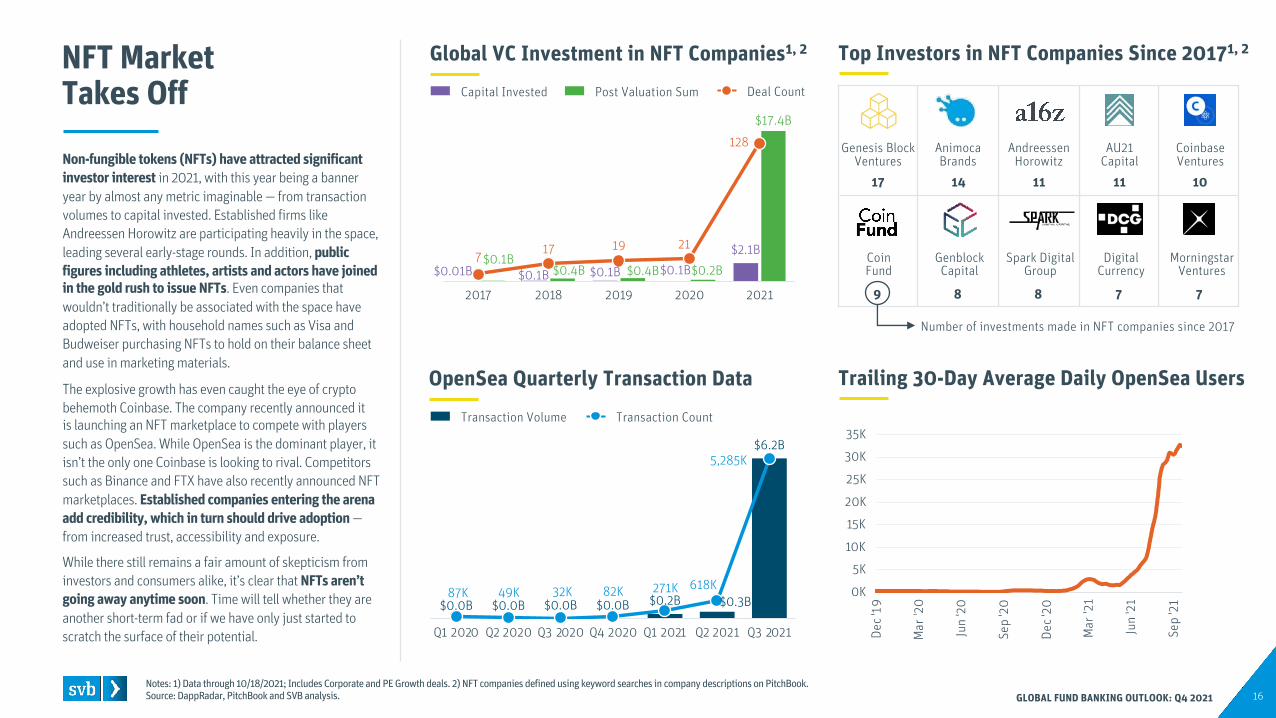
Non-fungible tokens (NFTs) have attracted significant investor interest in 2021, with this year being a banner year by almost any metric imaginable — from transaction volumes to capital invested. Established firms like Andreessen Horowitz are participating heavily in the space, leading several early-stage rounds. In addition, public figures including athletes, artists and actors have joined in the gold rush to issue NFTs. Even companies that wouldn’t traditionally be associated with the space have adopted NFTs, with household names such as Visa and Budweiser purchasing NFTs to hold on their balance sheet and use in marketing materials.
The explosive growth has even caught the eye of crypto behemoth Coinbase. The company recently announced it is launching an NFT marketplace to compete with players such as OpenSea. While OpenSea is the dominant player, it isn’t the only one Coinbase is looking to rival. Competitors such as Binance and FTX have also recently announced NFT marketplaces. Established companies entering the arena add credibility, which in turn should drive adoption —from increased trust, accessibility and exposure.
While there still remains a fair amount of skepticism from investors and consumers alike, it’s clear that NFTs aren’t going away anytime soon. Time will tell whether they are another short-term fad or if we have only just started to scratch the surface of their potential.
LiquidityInvestors Reap Benefits From Exits
17GLOBAL FUND BANKING OUTLOOK: Q4 2021
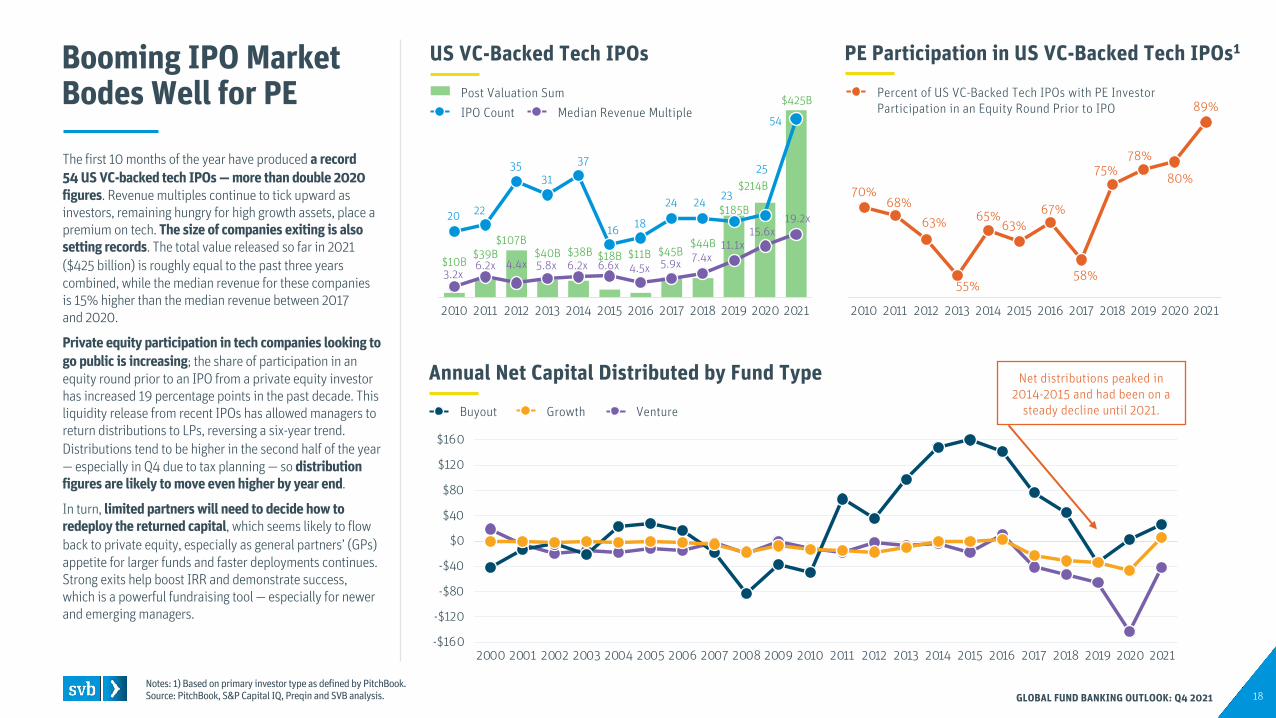
Booming IPO Market Bodes Well for PE
Notes: 1) Based on primary investor type as defined by PitchBook.Source: PitchBook, S&P Capital IQ, Preqin and SVB analysis. 18
PE Participation in US VC-Backed Tech IPOs1US VC-Backed Tech IPOs
Annual Net Capital Distributed by Fund Type
GLOBAL FUND BANKING OUTLOOK: Q4 2021
70%68%
63%
55%
65%63%
67%
58%
75%78%
80%
89%
2010 2011 2012 2013 2014 2015 2016 2017 2018 2019 2020 2021
$10B$39B
$107B$40B $38B $18B $11B $45B
$44B
$185B
$214B
$425B
20 22
3531
37
16 18
24 24 23
25
54
3.2x6.2x 4.4x 5.8x 6.2x 6.6x 4.5x 5.9x 7.4x
11.1x15.6x
19.2x
2010 2011 2012 2013 2014 2015 2016 2017 2018 2019 2020 2021
-$160
-$120
-$80
-$40
$0
$40
$80
$120
$160
2000 2001 2002 2003 2004 2005 2006 2007 2008 2009 2010 2011 2012 2013 2014 2015 2016 2017 2018 2019 2020 2021
Net distributions peaked in 2014-2015 and had been on a
steady decline until 2021.
Post Valuation SumIPO Count Median Revenue Multiple
Percent of US VC-Backed Tech IPOs with PE Investor Participation in an Equity Round Prior to IPO
Buyout Growth Venture
The first 10 months of the year have produced a record 54 US VC-backed tech IPOs — more than double 2020 figures. Revenue multiples continue to tick upward as investors, remaining hungry for high growth assets, place a premium on tech. The size of companies exiting is also setting records. The total value released so far in 2021 ($425 billion) is roughly equal to the past three years combined, while the median revenue for these companies is 15% higher than the median revenue between 2017 and 2020.
Private equity participation in tech companies looking to go public is increasing; the share of participation in an equity round prior to an IPO from a private equity investor has increased 19 percentage points in the past decade. This liquidity release from recent IPOs has allowed managers to return distributions to LPs, reversing a six-year trend. Distributions tend to be higher in the second half of the year — especially in Q4 due to tax planning — so distribution figures are likely to move even higher by year end.
In turn, limited partners will need to decide how to redeploy the returned capital, which seems likely to flow back to private equity, especially as general partners’ (GPs) appetite for larger funds and faster deployments continues. Strong exits help boost IRR and demonstrate success, which is a powerful fundraising tool — especially for newer and emerging managers.
1. The material contained in this document, including without limitation the statistical information herein, is provided for informational purposes only. The material is based in part upon information from third-party sources that we believe to be reliable, but which has not been independently verified by us and, as such, we do not represent that the information is accurate or complete. This information should not be viewed as tax, investment, legal or other advice, nor is it to be relied on in making an investment or other decision. You should obtain relevant and specific professional advice before making any investment decision. Nothing relating to the material should be construed as a solicitation, offer or recommendation to acquire or dispose of any investment or to engage in any other transaction.
2. All credit products and loans are subject to underwriting, credit and collateral approval. All information contained herein is for informational and reference purposes only and no guarantee is expressed or implied. Rates, terms, programs and underwriting policies subject to change without notice. This is not a commitment to lend. Terms and conditions apply.
3. SVB Private Bank is a division of Silicon Valley Bank. Banking and loan products and services are offered by Silicon Valley Bank. Loans and credit cards are subject to credit and/or collateral approval. Financing is available and varies by state. Restrictions may apply.
4. SVB Leerink LLC is a member of SVB Financial Group. Products and/or services offered by SVB Leerink LLC are not insured by the FDIC or any other federal government agency and are not guaranteed by Silicon Valley Bank or its affiliates. SVB Leerink LLC is a member of FINRA and SIPC.
5. To execute your wealth plan we work with third-party unaffiliated specialists in the areas of Tax, Insurance and Trust & Legal Services. Founders Circle Capital is a third party and not affiliated with SVB or SVB Wealth Advisory, Inc. Silicon Valley Bank does not have a direct relationship with Founders Circle Capital (FCC) and has no responsibility or affiliation. Silicon Valley Bank, as a member of SVB Financial Group, has an indirect financial interest in FCC and, as a result, has an indirect interest in making client referrals to FCC. FCC is a registered investment advisor and is not a bank or member of the Federal Reserve System.
6. All companies listed throughout this document, outside of Silicon Valley Bank, and the related entities, non-bank affiliates and subsidiaries listed on this “Disclaimer” page are independent third parties and are not affiliated with SVB Financial Group.
7. Wealth planning and investment and stock option strategies are provided through SVB Wealth Advisory, Inc., a registered investment advisor and non-bank affiliate of Silicon Valley Bank.
8. Foreign exchange transactions can be highly risky, and losses may occur in short periods of time if there is an adverse movement of exchange rates. Exchange rates can be highly volatile and are impacted by numerous economic, political and social factors as well as supply and demand and governmental intervention, control and adjustments. Investments in financial instruments carry significant risk, including the possible loss of the principal amount invested. Before entering any foreign exchange transaction, you should obtain advice from your own tax, financial, legal and other advisors and make investment decisions only on the basis of your own objectives, experience and resources.
9. SVB Asset Management, a registered investment advisor, is a non-bank affiliate of Silicon Valley Bank and a member of SVB Financial Group. SVB Securities is a non-bank affiliate of Silicon Valley Bank and a member of SVB Financial Group. Member FINRA and SIPC. SVB Wealth Advisory is a registered investment advisor, non-bank affiliate of Silicon Valley Bank and a member of SVB Financial Group.
Opinions expressed are our opinions as of the date of this content only. The material is based upon information which we consider reliable, but we do not represent that it is accurate or complete, and it should not be relied upon as such. Investment products:
Disclaimers
Are not insured by the FDIC or anyother federal government agency
Are not deposits of orguaranteed by a bank May lose value
19
See complete disclaimers on previous page.
© 2021 SVB Financial Group. All rights reserved. SVB, SVB FINANCIAL GROUP, SILICON VALLEY BANK, MAKE NEXT HAPPEN NOW and the chevron device are trademarks of SVB Financial Group, used under license. Silicon Valley Bank is a member of the FDIC and the Federal Reserve System. Silicon Valley Bank is the California bank subsidiary of SVB Financial Group (Nasdaq: SIVB).
About Silicon Valley BankFor nearly 40 years, Silicon Valley Bank has helped innovative companies and their investors move bold ideas forward, fast. SVB provides targeted financial services and expertise through its offices in innovation centers around the world. With commercial, international and private banking services, SVB helps address the unique needs of innovators.
@SVBFinancialGroup
Silicon Valley Bank
@SVB_Financial
www.svb.com
20