global climate change and the effect of conservation practices in us agriculture
TRANSCRIPT
Research article
Environmental Geology 40 (1-2) December 2000 7 Q Springer-Verlag 41
Received: 27 December 1999 7 Accepted: 14 March 2000
N.D. UriCompetitive Pricing Division, Common Carrier Bureau,Federal Communications Commission, 445 12th Street, SW,Washington, DC 20554, USAe-mail: nuri6fcc.govTel.: c1-202-4180062
The views expressed are those of the author and do notnecessarily represent the policies of the FederalCommunications Commission or the views of other FederalCommunications staff members.
Global climate change and theeffect of conservation practices inUS agricultureNoel D. Uri
Abstract Increase in the use of conservation prac-tices by agriculture in the United States will en-hance soil organic carbon and potentially increasecarbon sequestration. This, in turn, will decreasethe net emission of carbon dioxide. A number ofstudies exist that calibrate the contribution of var-ious individual, site-specific conservation practiceson changes in soil organic carbon. There is a gen-eral absence, however, of a comprehensive effort tomeasure objectively the contribution of these prac-tices including conservation tillage, the Conserva-tion Reserve Program, and conservation bufferstrips to an change in soil organic carbon. This pa-per fills that void. After recounting the evolution ofthe use of the various conservation practices, it isestimated that organic carbon in the soil in 1998 inthe United States attributable to these practices wasabout 12.2 million metric tons. By 2008, there willbe an increase of about 25%. Given that there is asignificant potential for conservation practices,which could lead to an increase in carbon seques-tration, there are a number of policy options thatcan be pursued. These include education and tech-nical assistance, financial assistance, research anddevelopment, land retirement, and regulation andtaxes.
Keywords Conservation 7 Global climate change 7Organic carbon 7 US agriculture
Introduction
Organic carbon in soils plays a key role in the carbon cy-cle and has a potentially large impact on the greenhouseeffect (Lal and others 1998). Soils in the world contain anestimated 1.5!1018 g of carbon, or twice as much as theatmosphere and three times the level held in terrestrialvegetation (Post 1990). The annual net release of carbonfrom agriculture has been estimated at about 14% of cur-rent fossil fuel emissions globally (Schlesinger 1995). Inaddition to the influence that soil carbon has on globalwarming, it also plays a key role in determining long-term soil quality. The ability to sequester carbon in soilsby proper tillage and erosion management provides long-term justification for soil conservation programs (Huntand others 1996; Weinhold and Halvorson 1998). Thereis, however, a paucity of information on the changes insoil organic carbon (SOC) that accrue from key soil con-servation programs and policies (Donigian and others1994; Smith 1999). After recounting the trend in the useof conservation practices in agriculture in the UnitedStates, this paper provides some objective estimates ofthe impact that the increase in the use of three conserva-tion practices have on changes in soil organic carbon andhence the potential to sequester carbon. The three con-servation practices considered are conservation tillage,the Conservation Reserve Program (CRP), and conserva-tion buffer strips.
The trend in the useof conservation practicesand their potential impacton carbon dynamics
Carbon levels in the soil are determined by the balance ofinputs, such as crop residues and organic amendments,and carbon losses through organic matter decomposition.Thus, management to increase soil organic carbon and toenhance the potential to sequester carbon requires in-creasing carbon inputs, decreasing decomposition, orboth. This is the aim of the conservation practices con-sidered here. Additionally, in the context of managingsoils to sequester carbon, erosion is a transport process

Research article
42 Environmental Geology 40 (1-2) December 2000 7 Q Springer-Verlag
rather than a loss or gain of soil organic carbon. It is notclear whether erosion, at the regional level, increases ordecreases carbon stocks in the soil and sediments (Paus-tien and others 1997; Van Noordwijk and others 1997),hence, this is not explicitly addressed.
Conservation tillage
Conservation tillage is probably the best-known conserva-tion practice. Conservation tillage evolved from practicesthat range from reducing the number of trips over thefield to raising crops without primary or secondary til-lage. Current emphasis is on leaving crop residues on thesurface after planting rather than merely reducing thenumber of trips across the field, although the two areclosely related.In 1963, the Soil Conservation Service of the US Depart-ment of Agriculture began recording the area of croplandplanted by minimum tillage, which was then used onabout 1.6 million planted ha (about 1% of the total). By1967, the area had doubled (Mannering and others 1987).One of the difficulties in following the trends has beenthe absence of any consistent definition of conservationtillage. Before 1977, “minimum tillage” was used, whichaimed at reducing the number of tillage trips over a field.Although a large portion of the area on which minimumtillage was used would have had considerable amounts ofresidue after planting, a significant portion would nothave met the current definition of conservation tillage(Schertz 1986).In 1977, the Soil Conservation Service changed the termminimum tillage to conservation tillage and defined it asa form of non-inversion tillage that retains protectiveamounts of residue on the surface throughout the year.Conservation tillage included no tillage, strip tillage, stub-ble mulching, and other types of non-inversion tillage.In 1984, the Soil Conservation Service changed the defini-tion to the one currently used (Conservation TechnologyInformation Center 1998):
Any tillage and planting system that maintains at least30% of the soil surface covered by residue after plantingto reduce soil erosion by water. Where soil erosion bywind is the primary concern, any system that maintainsat least 184 kg (per ha) of flat, small grain residue equi-valent on the surface during the critical wind erosion pe-riod. Two key factors influencing crop residue are (1) thetype of crop, which establishes the initial residue amountand determines its persistence, and (2) the type of tillageoperations prior to and including planting.
The use of conservation tillage in the United States hadan identifiable upward trend until the last few years,which shows no discernible change. The use of conserva-tion tillage increased from 1% of planted hectarage in1963 to approximately 37% of planted hectarage in 1998(CTIC 1998; Schertz 1988).
A disaggregated view of the use of conservation tillagecan be obtained by considering specific crops and states/regions. The percentage of US cropland that was conser-vation tilled increased from 26 to 37% over the 10-yearperiod (1989–1998) but the increase differs by crop (CTIC1998). That is, conservation tillage is used mostly on soy-beans, corn, and small grains. More than 45% of totalcorn and soybean planted hectarage in 1998 was conser-vation tilled. Where double cropping was used, nearly74% of soybean hectarage, 45% of corn hectarage, and49% of sorghum hectarage employed conservation tillagesystems. Full-season corn is the most extensively growncrop in the United States accounting for 27% of totalplanted hectarage in 1998. Currently, nearly 40% ofplanted hectarage on which corn is grown is conservationtilled. A decline in the use of conservation tillage on cornbetween 1995 and 1998 reflects reduced use of conserva-tion tillage in Indiana, which produces relatively largeamounts of corn, and to a lesser degree Ohio. Both Statesencountered unusually wet weather conditions at the timeof planting in the spring. Because of this, more than260,000 ha in Indiana alone (over 5% of total plantedhectarage) that were conservation-tilled in 1995 revertedto conventional tillage by 1998. Cotton has the lowestproportion of conservation tillage, increasing from 3 to12% between 1989 and 1998. Other important crops, suchas peanuts, potatoes, beets, tobacco, and vegetables, havealso improved residue management and erosion control,even though their cultural practices preclude the use ofconservation tillage.Kentucky leads the United States in conservation tillage,with an adoption rate of 71%. Delaware, Iowa, Maryland,Missouri, Nebraska, and Tennessee all have between 50and 63% of cropland conservation-tilled. States with ad-option rates of ~10% include Arizona, Florida, Massa-chusetts, Rhode Island, and Vermont. The Appalachianand Corn Belt regions lead in conservation tillage adop-tion with 49 and 48% respectively, whereas the Delta,south-east, Pacific and southern plains have only between20 and 24%.The substantial fall in the use of conservation tillage insome of the Midwestern States between 1993 and 1994 re-flects the heavy rains and flooding in 1993 that destroyedcrop hectarage. Nearly 2 million fewer ha were planted in1993 than in 1992 and 1994. Most of this land was re-turned to production in 1994, but rills and gullies on thesurface and sand and soil deposits on the bottomlandsforced farmers to till the soil more. Much of the declinein mulch tillage in 1994 is attributed to this. Thus, theuse of conservation tillage in Illinois fell 16.3% between1993 and 1994, whereas Kansas, Minnesota, Ohio, andWisconsin experienced similar, although less precipitous,declines.Another important factor leading to the decline in con-servation tillage in the Corn Belt in 1994 was the absenceof a government set-aside program. Previously idled hec-tares that were returned to production were tilled usingconventional practices (US Environmental ProtectionAgency 1996).
Research article
Environmental Geology 40 (1-2) December 2000 7 Q Springer-Verlag 43
Mulch tillage continues to be the dominant type of con-servation tillage although there is increased use of no til-lage. (Note that definitions of mulch tillage and othertypes of conservation tillage are provided in the Appen-dix 1.) Mulch tillage accounted for 53% of conservationtillage and was used on 20% of the cropland in the Uni-ted States in 1998. No tillage accounted for 44% of con-servation tillage, being used on 16% of the cropland inthe United States, whereas ridge tillage was used on onlyabout 1% of the cropland in 1998. Over the past fewyears, there has been little change in the use of no tillagerelative to mulch tillage.Tillage affects decomposition processes through the phy-sical disturbance and mixing of soil, by exposing soil ag-gregates to disruptive forces, and through the distribu-tion of crop residue in the soil (Beare and others 1994).Tillage also affects soil temperature, aeration and waterrelations by its impact on surface residue cover and soilstructure (Paustien and others 1999). By increasing theeffective soil surface area and continually exposing newsoil to wetting/drying and freeze/thaw cycles at the sur-face, tillage makes aggregates more susceptible to disrup-tion and physically-protected inter-aggregate organic ma-terial becomes more available for decomposition (Elliottand Coleman 1988).Thus, long-term use of conservation tillage leads to anincrease in soil organic carbon, an enhancement of soilquality, and an improvement in soil resilience (Black andTanaka 1997; Grant 1997). Conservation tillage can im-prove soil aggregation and change the vertical distribu-tion and retention of soil organic carbon (Beare and oth-ers 1994). Edwards and others 1992, for example, foundthat conversion from conventional tillage to conservationtillage increased soil organic carbon by 56% over a 10-year period. A number of other studies have also shownmore soil organic carbon content associated with conser-vation tillage than with conventional tillage (e.g. Tracyand others 1990; Wood and others 1991; Lafond and oth-ers 1994; Power 1994). An increase in soil organic carbonassociated with conservation tillage also leads to an im-provement in soil structure and aggregation comparedwith conventional tillage (Bruce and others 1990).A survey of the literature indicates that the carbon se-questration potential associated with the adoption of con-servation tillage ranges from 0.10 to 0.50 metrictons ha–1 year–1 for humid temperate regions and from0.05 to 0.20 metric tons ha–1 year–1 for semiarid and trop-ical regions (Lal 1995). Moreover, it has been suggestedthat the increase in soil organic carbon associated withthe adoption of conservation tillage will continue for aperiod of 25 to 50 years depending on climatic condi-tions, soil characteristics, and production managementpractices (Wood and others 1991; Zobeck and others1995; Hunt and others 1996; Franzluebbers 1997; Franz-luebbers and others 1999).Still, there are a number of unresolved questions with re-spect to modifying the processes that promote carbonloss from the soil. One is the relative importance of thedifferent processes affected by tillage such as soil distur-
bance and the way tillage impacts changing carbon in-puts and losses. An answer to this question is necessarybefore an accurate assessment can be made of the long-term effect of different tillage systems on the carbon levelin the soil (Barker and others 1996; Hussain and others1999).The beneficial effects of conservation tillage will be lost ifthe soil is tilled even after a relatively long period underconservation tillage (Gilley and Doran 1997). Hence, it isgenerally conceded that while there may be an increase insoil organic carbon for soils managed with mulch tillageor ridge tillage where minimum tillage occurs, there is anabsence of data to test this hypothesis (Franzluebbers1996). Consequently, for conservation tillage, only no til-lage results in a significant increase in soil organic car-bon (Kern and Johnson 1993; Paustien and others 1999;Six and others 1999). Moreover, when the conversionfrom conventional tillage to no tillage occurs, the realizedbenefits of an increase in soil organic carbon occurs veryquickly (McCarty and others 1998).Finally, compounding the issue of measuring the benefi-cial effects of the adoption of conservation tillage on anincrease in soil organic carbon is the fact that this in-crease is highly variable even for the same crop and soiltype (Donigian and others 1994). This is because rates ofcarbon emissions from the soil are significantly corre-lated with temperature and precipitation and have a pro-nounced seasonal pattern (Kern and Johnson 1993). Morestudies of the sort by Gilley and others (1997) that assessthe relative carbon content of different tillage practiceson comparable soils over space (i.e. geographically dis-perse) and for different climatic conditions are needed.
Conservation Reserve Program
The policy to take land out of production and place itinto conservation uses was first used in the Soil BankProgram of the 1950s, and has been significantly in-creased in the current Conservation Reserve Program(CRP). This program was initiated by Congress in TitleXII of the Food Security Act of 1985. As a voluntarylong-term program, the CRP provides participants (farmowner and operators) with an annual per-hectare rentand half the cost of establishing a permanent land cover(usually grass or trees) in exchange for retiring highlyerodible and/or environmentally sensitive cropland fromproduction for 10–15 years. Although the enrollmentmandate established in the 1985 Act was 16.2–18.2 millionha by the end of the 1990 crop year, by that point13.7 million ha had been enrolled. The primary goal ofthe CRP during 1986–1989 was to reduce soil erosion onhighly erodible cropland. Secondary objectives includedprotecting the long-run capability of the United States toproduce food and fiber, reduce sedimentation, improvewater quality, foster wildlife habitat, curb production ofsurplus commodities, and provide income support forfarmers (Osborn 1996). Only recently has the increase in
Research article
44 Environmental Geology 40 (1-2) December 2000 7 Q Springer-Verlag
soil organic carbon and the carbon sequestration poten-tial of land in the CRP been discussed (Gebhart 1994).The Food, Agriculture, Conservation, and Trade Act of1990 extended the CRP enrollment period through 1995,and redirected the goals of the CRP toward improvingwater quality and other environmental concerns. Underthe 1990 Act, an additional 1 million ha were enrolled,bringing total enrollment to 14.7 million ha by 1993. Sub-sequent appropriations legislation capped CRP enroll-ment at 15.4 million ha. The most recent farm legislationas manifest in the Federal Agricultural Improvement andReform Act of 1996 continues the CRP through 2002. Un-der this legislation, the US Department of Agriculturewas given authority to re-enroll existing CRP contracts,as well as to enroll new hectares, subject to a maximumannual enrollment of 15.4 million ha.While the establishment of perennial grass cover was anoriginal objective of the CRP, these new grasslands havethe potential to reduce concomitantly atmospheric car-bon emission levels because of accumulation and incor-poration of litter into surface soils and the relatively largeamounts of net primary production allocated toward rootgrowth in grasslands (CAST 1992).The CRP provides an opportunity to mitigate radiativeforcing by sequestering atmospheric carbon emissions ascarbon in the soil and trees (CAST 1992). Gebhart andothers (1994) assessed the impact of the CRP on soil or-ganic carbon in Texas, Kansas, and Nebraska. The carbonsequestration rate of CRP was 1.1 million metric tons perha per year. They suggest that the principal cause of theincrease in soil organic carbon was erosion control. Fol-lett (1993) estimates that about 14.6 million ha of CRPland could sequester between 3 and 10 million metrictons of carbon equivalent as soil organic carbon over a10-year period. Paustien and others (1998) estimated thatCRP hectarage would sequester about 25 million metrictons over a 10-year period. The rate of soil organic car-bon accumulation ranged from 40 g m–2 year–1, with thehighest rates in more humid regions. Paustien and others(1999), in a different study that looked at annually culti-vated land placed into the CRP with perennial grass cov-er, estimates the sequestration potential of CRP land at16 million metric tons per year. Hence, there is a consid-erable range in the estimate of the increase in soil or-ganic carbon attributable to land in the CRP planted withgrass.McConnell and Quinn (1988) have shown that soil or-ganic carbon contents of the surface 0–25 cm of croplandabandoned and/or reseeded to perennial grasses weresimilar to adjacent native rangeland after about 50 yearsof recovery. Conversely, surface soil organic carbon ofcropland continuously cultivated was substantially lowerthan that of native rangeland and abandoned and re-seeded cropland. Dormaar and Smoliak (1985) observedsimilar trends for abandoned cropland and native range-land in Alberta, Canada. Based on these and other stud-ies, it is clear that land-use change from crop productionto perennial grass cover associated with the CRP may se-quester atmospheric carbon back into the soil carbon
pool, thereby changing soil from sources to sinks for at-mospheric carbon.Most of the highly erodible land (HEL) contracted intothe CRP had suffered much erosion, organic matter loss,and structural deterioration while it was in cultivatedcrop production (see Appendix 2). When lands are re-turned to grass, their structure and organic matter im-prove and tend to approach the structure and organicmatter content of the original grassland soils (Gebhartand others 1994). The degree of soil improvement from10 years of grass is a function of site-specific factors. As ageneral rule, the greater the amount of soil structure de-terioration from past cultural practices, the more likelythat grass management will improve the soil’s character-istics. Rasiah and Kay (1994) found that if soils had high-er levels of organic matter and other stabilizing materialsat the time of grass introduction, the time required forsoil structure regeneration was reduced. Soils in the CRPtypically fit into the category of degraded soils whose or-ganic matter is lower than that of surrounding soils, be-cause they were primarily allowed into the programbased on their highly erodible classification (Lindstromand others 1992; Barker and others 1996).If CRP land is planted with trees, the potential carbon se-questration is ostensibly considerably greater than forgrass (Lant and others 1995). Credible estimates of thispotential, however, are still being developed (McCarl andCallaway 1993; Lee 1995).CRP contracts are beginning to expire, so farmers havethe option to return the land to crop production. Forland that would be returned to production, the improve-ments in soil quality and erosion reduction gained duringthe CRP contracts will be rapidly lost if conventional til-lage is used. Coincidentally, most of the carbon accumu-lated during the CRP contract period is likely to be lostwithin a few years. Thus, only those areas that are main-tained in perennial vegetation and not reverted to annualcropping will result in an increase in soil organic carbonand provide a significant long-term sink for carbon.
Conservation buffer strips
Conservation buffers strips are small areas or strips ofland in permanent vegetation, designed to intercept pol-lutants and manage other environmental concerns. Aswith CRP hectares planted to grass, conservation bufferstrips have the potential to reduce atmospheric carbonemission levels by the accumulation and incorporation oflitter into surface soils and the relatively large amountsof net primary production dispersed to root growth ingrasslands (CAST 1992).Buffers include riparian buffers, which are establishedalong streams to absorb sediment and agricultural chemi-cals before the runoff enters a stream, filter strips de-signed to absorb run-on water and sediments from up-stream land, grassed waterways that are designed for safedisposal of excess water from cropland, shelter-belts,
Research article
Environmental Geology 40 (1-2) December 2000 7 Q Springer-Verlag 45
windbreaks, living snow fences, contour grass strips,cross-wind trap strips, shallow water areas for wildlife,field borders, alley cropping, herbaceous wind barriers,and vegetative barriers.Strategically placed buffer strips in the agricultural land-scape can effectively mitigate the movement of sediment,nutrients, and pesticides within farm fields and fromfarm fields. Filter strips are especially effective in retain-ing surface-applied swine manure and other constituentsbecause they decrease the runoff rate and encourage sedi-mentation (Chaubey and others 1994). When coupledwith appropriate upland treatments, including crop resi-due management, nutrient management, integrated pestmanagement, winter cover crops, and similar manage-ment practices and technologies, buffer strips allow farm-ers to achieve a measure of economic and environmentalsustainability in their operations. Buffer strips can alsoenhance wildlife habitat and protect biodiversity (Lantand others 1995).Vegetated strips, ranging in width from 5 to 50 m, usual-ly are installed along streams and on cropland. Thesebuffer strips slow water runoff, trap sediment, and en-hance infiltration within the buffer. Buffers also trap fer-tilizers, pesticides, pathogens, and heavy metals, and theyhelp trap snow and cut down on blowing soil in areaswith strong winds. In addition, they protect livestock andwildlife from harsh weather and buildings from winddamage. If properly installed and maintained, they havethe capacity to remove up to 50% or more of nutrientsand pesticides, remove up to 60% or more of certain pa-thogens, and remove up to 75% or more of sediment (USNatural Resources Conservation Service 1998). Conserva-tion buffers also help stabilize a stream and reduce itswater temperature as well as offer a setback distance foragricultural chemical use from water sources (Martin1998).Given that the type of vegetation used for buffer strips isvery similar to that used for land enrolled in the CRP,the expected increase in soil organic carbon associatedwith the use of buffer strips will be comparable to thatfor CRP hectarage. There are very few studies that objec-tively assess the increase in soil organic carbon and otherbenefits associated with buffer strips. One extant studyassessed the effectiveness of a double row of tall wheatgrass established with 15 m between rows (Aase and Paul1995). A gradual increase in soil organic content was ob-served from upslope to down slope from 11 to 12 g/kgfor 0- to 5-cm depth, and 8 to 10 g/kg for 15- to 20-cmdepth. Robinson and others (1996) found that the initial3 m of a vegetative filter strip removed more than 70% ofthe sediments from runoff.The US Department of Agriculture has a voluntary pro-gram to install 3.2 million hectares of conservation bufferstrips by 2002 (Natural Resources Conservation Service1998). Conservation buffer strips have different widthsranging from 6 to 30 m for filter strips, 15 to 45 m for ri-parian buffers, and 24 to 30 m for grassed waterways. Anaverage width of all types of conservation buffer strips isabout 10 m.
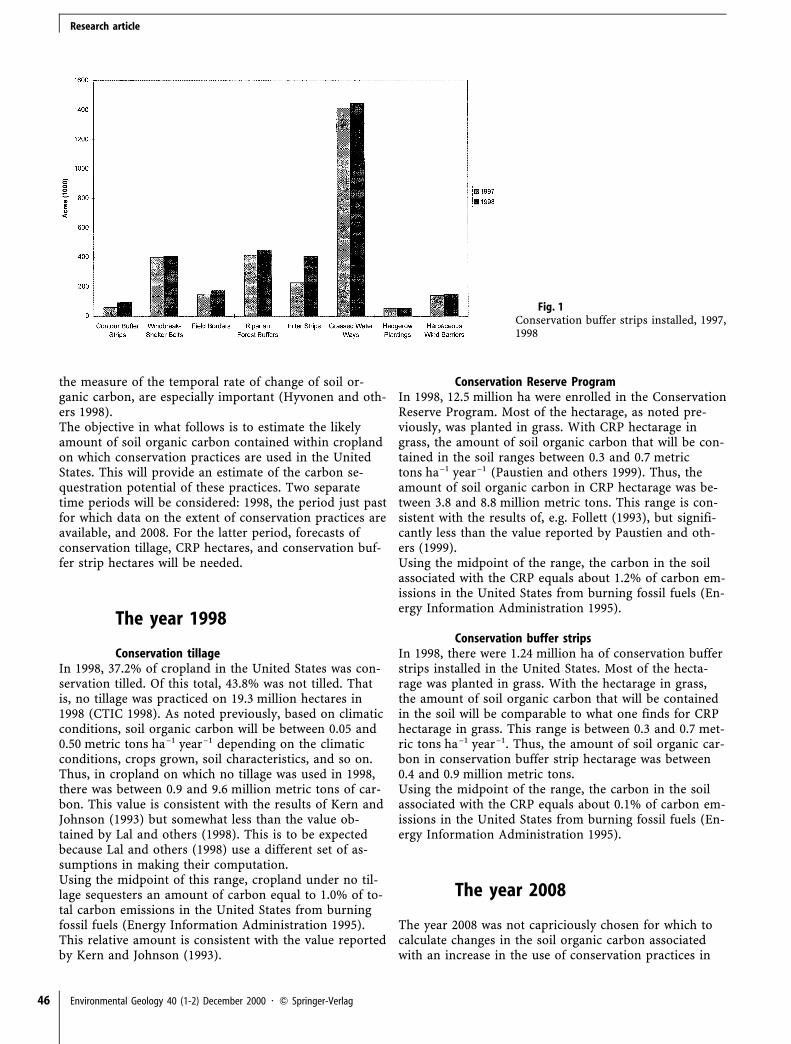
Objective data on the installation of conservation bufferstrips are scarce. The National Resources Inventory, how-ever, is one available source that is based on a scientifi-cally selected random sample (Soil Conservation Service1992). Figure 1 gives information on the number of hec-tares of installed conservation buffer strips in 1997 and1998. These data are taken from the 1998 Special Nation-al Resources Inventory and represent the most currentdata available. Note that the Natural Resources Conserva-tion Service (NRCS) conducted a Special National Re-sources Inventory in 1998 to identify changes in croplanduse, vulnerability of land to soil erosion, erosion on landcultivated for crops, and soil conservation practices oncropland. The study was designed to provide timely in-formation on such things as recent changes in land inproduction and its susceptibility to potential degradationin response to market conditions and the Federal Agri-culture Improvement and Reform (FAIR) Act of 1996.The data were collected for 6000 Primary Sampling Units(PSUs) in the Spring of 1998. Consequently, the impact ofadverse weather conditions, such as the drought in thesouth-west United States in the summer of 1998 and oth-er changes such as adjustments in production practicesor crops grown, are not reflected in the results.The number of hectares of grassed waterways is signifi-cantly greater than that of other conservation practices.
Conservation practices and thepotential to sequester carbon
There are different interpretations as to what constitutescarbon sequestration in the context of carbon emissionsmitigation polices. Among the alternatives are (1) soil or-ganic matter (excluding litter), (2) soil organic matterplus soil litter and roots (referred to as total belowground carbon), and (3) below ground carbon plus theminimum standing stocks of above ground litter and bio-mass (referred to as the ecosystem carbon level). Whilediffering in magnitude, the patterns of each of these dif-ferent quantities are similar (Paustien and others 1999).The fact, however, that different measures exist leads tosome uncertainty in defining precisely what the carbonsequestration potential of the various conservation prac-tices is. This problem is compounded when comparisonacross studies is undertaken. Results of different studiesusing different interpretations of what constitutes seques-tered carbon are really not comparable.One other issue of concern that needs to be noted beforeturning to the estimation of the potential of cropland inthe United States to sequester carbon is the impact of theinherent uncertainty in the short-term estimates of thepotential to sequester carbon on the long-term carbonstorage potential. The accuracy in the prediction of soilorganic carbon stores depends greatly on the source ofthe errors. Thus, errors in approximating the interactionbetween soil organic carbon and soil texture, as well as
Research article
46 Environmental Geology 40 (1-2) December 2000 7 Q Springer-Verlag
Fig. 1Conservation buffer strips installed, 1997,1998
the measure of the temporal rate of change of soil or-ganic carbon, are especially important (Hyvonen and oth-ers 1998).The objective in what follows is to estimate the likelyamount of soil organic carbon contained within croplandon which conservation practices are used in the UnitedStates. This will provide an estimate of the carbon se-questration potential of these practices. Two separatetime periods will be considered: 1998, the period just pastfor which data on the extent of conservation practices areavailable, and 2008. For the latter period, forecasts ofconservation tillage, CRP hectares, and conservation buf-fer strip hectares will be needed.
The year 1998
Conservation tillageIn 1998, 37.2% of cropland in the United States was con-servation tilled. Of this total, 43.8% was not tilled. Thatis, no tillage was practiced on 19.3 million hectares in1998 (CTIC 1998). As noted previously, based on climaticconditions, soil organic carbon will be between 0.05 and0.50 metric tons ha–1 year–1 depending on the climaticconditions, crops grown, soil characteristics, and so on.Thus, in cropland on which no tillage was used in 1998,there was between 0.9 and 9.6 million metric tons of car-bon. This value is consistent with the results of Kern andJohnson (1993) but somewhat less than the value ob-tained by Lal and others (1998). This is to be expectedbecause Lal and others (1998) use a different set of as-sumptions in making their computation.Using the midpoint of this range, cropland under no til-lage sequesters an amount of carbon equal to 1.0% of to-tal carbon emissions in the United States from burningfossil fuels (Energy Information Administration 1995).This relative amount is consistent with the value reportedby Kern and Johnson (1993).
Conservation Reserve ProgramIn 1998, 12.5 million ha were enrolled in the ConservationReserve Program. Most of the hectarage, as noted pre-viously, was planted in grass. With CRP hectarage ingrass, the amount of soil organic carbon that will be con-tained in the soil ranges between 0.3 and 0.7 metrictons ha–1 year–1 (Paustien and others 1999). Thus, theamount of soil organic carbon in CRP hectarage was be-tween 3.8 and 8.8 million metric tons. This range is con-sistent with the results of, e.g. Follett (1993), but signifi-cantly less than the value reported by Paustien and oth-ers (1999).Using the midpoint of the range, the carbon in the soilassociated with the CRP equals about 1.2% of carbon em-issions in the United States from burning fossil fuels (En-ergy Information Administration 1995).
Conservation buffer stripsIn 1998, there were 1.24 million ha of conservation bufferstrips installed in the United States. Most of the hecta-rage was planted in grass. With the hectarage in grass,the amount of soil organic carbon that will be containedin the soil will be comparable to what one finds for CRPhectarage in grass. This range is between 0.3 and 0.7 met-ric tons ha–1 year–1. Thus, the amount of soil organic car-bon in conservation buffer strip hectarage was between0.4 and 0.9 million metric tons.Using the midpoint of the range, the carbon in the soilassociated with the CRP equals about 0.1% of carbon em-issions in the United States from burning fossil fuels (En-ergy Information Administration 1995).
The year 2008
The year 2008 was not capriciously chosen for which tocalculate changes in the soil organic carbon associatedwith an increase in the use of conservation practices in
Research article
Environmental Geology 40 (1-2) December 2000 7 Q Springer-Verlag 47
the United States. Rather, 2008 is the final year of theforecast horizon of the current US Department of Agri-culture Baseline forecasts (World Agricultural OutlookBoard 1999). Forecasts provided include total plantedcropland hectarage and CRP hectarage. What is not pro-vided is a forecast of hectarage that is conservation tilled.That will be estimated here.
Conservation tillageThere is some uncertainty about the extent to which con-servation tillage – no tillage – will be used in 2008. Con-sequently, the forecast of its adoption and use must beprovided in the context of a confidence interval. To fore-cast the use of no tillage in 2008, a forecast of the pro-portion of total planted hectarage that is conservationtilled is combined with the baseline forecast of totalplanted hectarage to yield the number of hectares that isconservation tilled. Assuming that the historical relation-ship between the proportion of hectares that are mulchtilled, ridge tilled, and no-tilled holds, the number of hec-tares that will be not be tilled in 2008 will be obtained.To estimate the proportion of total planted hectares thatwill be conservation tilled in 2008, a simple logistic mod-el is fit to the historical data. The model is estimated as
cttp(1/(1ca exp (–bt)))cut (1)
where ct denotes the proportion of hectares conservationtilled, t denotes the time period, u is the stochastic term,and a and b are coefficients to be estimated.Using nonlinear least squares with an adjustment forfirst-order serial correlation (which is present and whichis the highest order empirically observed), the estimatedmodel is
ctp(1/1c(5.5571 exp0.8453)
(P(0.1295 t)0.0161)
(2)
with 1SSEp0.5881, log of the likelihood func-tionp21.7547 and the standard errors of the estimates inparentheses.Using this functional relationship, the proportion of totalplanted hectareage that is expected to be conservationtilled in 2008 is 0.54. The associated 95% confidence in-terval is 0.46–0.62.Combining this with the baseline forecast and the histori-cal relationship between the three different conservationtillage types means that between 17.7 and 23.1 million hawill be no-tilled in 2008. For the next step in the compu-tation, assume that none of the previously no-tilled hec-tarage is tilled. That is, the net increase in no-tilled hec-tarage comes just from cropland that was previously con-ventionally tilled. Also assume, consistent with the litera-ture, that the increase in the soil organic carbon of cro-pland converted from conventional tillage to no tillage isrelatively rapid. Then, if the forecast of no-tilled hecta-rage with its attendant 95% confidence interval is com-bined with the estimate of the organic carbon content ofsoil that is conservation tilled, then between 0.9 and 11.6million metric tons of carbon will be contained in the
soil that is conservation tilled in 2008. This representsabout a 19% increase over 1998.
Conservation Reservation ProgramThe baseline forecast predicts that CRP hectarage will in-crease to its mandated limit of 14.7 million ha by 2002and remain constant thereafter. Assume that all of theCRP hectarage is planted in grass. Then CRP hectaragewill contain between 4.4 and 10.3 million metric tons ofcarbon in 2008. This is a 17% increase in the carbon inCRP hectarage over 1998.
Conservation buffer stripsFor conservation buffers strips, it is assumed that the tar-get of 3.2 million ha will be reached by 2008 if not by theyear 2002, which is the original US Department of Agri-culture target year. These conservation buffer strips willcontain between 1 and 2.4 million metric tons of carbon.This translates into a 162% increase in soil organic car-bon over the level in 1998.Combining the forecasts for each of the different conser-vation practices and absent any further policy initiatives,soil organic carbon associated with the use of these prac-tices is expected to increase by F25% between 1998 and2008.Clearly, the conservation practices considered here con-tribute greatly to organic carbon in the soil. An increasein their use will further increase soil organic carbon andhence enhance the potential to sequester carbon in theUnited States. There are a number of policy optionsavailable to promote the adoption of conservation prac-tices. These are discussed in the next section.
The use of public policiesto promote the useof conservation practices
Several public policies can be used to affect farmers’ ad-option of conservation practices: education and technicalassistance, financial assistance, research and develop-ment, land retirement, and regulation and taxes. Eachpolicy has implications about agricultural profits and theallocation of public funds.
Education and technical assistance
If a preferred conservation practice would be profitablefor a farmer but the farmer is unaware of its benefits,education efforts can lead to voluntary use of the conser-vation practice. Educational activities generally take theform of demonstration projects and information cam-paigns in print and electronic media, newsletters, andmeetings. Demonstration projects provide more directand detailed information about farming practices and
Research article
48 Environmental Geology 40 (1-2) December 2000 7 Q Springer-Verlag
production systems, and how these systems are advanta-geous to the producer (Bosch and others 1995). Informa-tion assumes an especially significant role in the case ofnew or emerging technologies (Saha and others 1994).When adoption of a conservation practice would lead toan increase in long-term profits, but either new skills areneeded or farming operations must be adapted for theconservation practice to produce the highest net benefits,technical assistance can be provided to those who chooseto adopt. Technical assistance is the direct one-on-onecontact provided by an assisting agency or private com-pany for the purpose of providing a farmer with theplanning and knowledge necessary to implement a parti-cular conservation practice on the individual farm. Re-quirements for successful implementation vary betweenindividual farms because of resource conditions, opera-tion structure, and owner/operator managerial skill. Test-ing a conservation practice on part of the farm enhancesits potential for adoption (US Office of Technology As-sessment 1990; Nowak and O’Keefe 1995). Technical as-sistance is often critical, especially for conservation prac-tices that require a greater level of management than thefarmer currently uses (Dobbs and others 1995). Both edu-cation and technical assistance can be provided by eitherpublic or private sources, and both will induce adoptionby farmers for whom the conservation practice would bemore profitable than the one they had been using.
Financial assistance
Financial assistance can be offered to overcome eithershort- or long-term impediments or barriers to adoption.If the conservation practice is profitable once installed,but involves initial investment or transition and adjust-ment expenses, a single cost-share payment can be usedto encourage the switch to the preferred conservationpractice. Transition and adjustment costs include lostproduction, increased risk, or increased managementcosts caused by learning how to use the new conservationpractice efficiently. Financial and organizational charac-teristics of the whole operation also may be a hindranceto adoption (US Office of Technology Assessment 1990;Nowak 1991). When the conservation practice is moreprofitable to the farmer than the current conservationpractice, but the environmental or other off-farm benefitsare substantial, public funds could be allocated on anongoing basis to defray the loss in profits to the farmer.Another form of financial incentive could be the grantingof a tax credit for investment in a particular conservationpractice. From a public perspective, the optimal financialassistance rates are those that induce the adoption of de-sired conservation practices at the least cost. Efficientrates would have to be set individually because farm andfarmer characteristics vary widely (Caswell and Shoemak-er 1993). Therefore, for ease of implementation, mostlarge financial assistance programs specify a uniformsubsidy rate across resource conditions. Uniform rates,
however, invariably introduce production distortions. Be-cause resource and production characteristics can varywidely, different farms may need different sets of conser-vation practices to achieve the same environmental goal.A production system that is appropriate for one farmmay be inappropriate for another. The effectiveness of aconservation system in controlling erosion depends onseveral factors, including the frequency, timing, and/orseverity of wind and precipitation, the exposure of landforms to weather, the ability of exposed soil to withstanderosive forces, the plant material available to shelter soils,and the propensity of conservation practices to reduce orextenuate erosive forces. An efficient financial assistanceprogram would have a list of eligible conservation prac-tices that included all alternatives appropriate for eachfarm. Cost-share and incentive payment policies arebased on the fact that targeted farmers would not volun-tarily adopt the preferred conservation practice, but thepublic interest calls for the conservation practices to beused more widely. Financial assistance is not a substitutefor education and technical assistance. Even with finan-cial assistance, a farmer will not adopt a technology if heor she is unfamiliar with it.
Research and development (R&D)
Research and development policies can be used to en-hance the benefits of a given conservation practice. Theobjective of the research would be to either improve theperformance or to reduce the costs of the conservationpractice. Data gathering and analysis, as well as monitor-ing also contribute to R&D by providing informationnecessary to assess the determinants of adoption and theeffectiveness of conservation practices in achieving publicgoals. In addition, R&D funds could be allocated to en-sure that the conservation practice is adaptable for morecircumstances. R&D is a long-term policy strategy withan uncertain probability of success, but it may also reapthe greatest gains in encouraging the voluntary adoptionof a preferred technology because it can increase theprofitability of the conservation practice for a widerrange of potential adopters.
Land retirement
The policy that has the largest impact on farmers’ choiceof conservation practices is land retirement. The underly-ing premise is that large public benefits can be gained byradically changing agricultural conservation practices onparticular parcels of land and that changes in individualconservation practices would not provide sufficient socialbenefits. For an individual to voluntarily agree to put theland in conserving uses, he or she would expect compen-sation in an amount at least as great as the lost profitsfrom production. The payment mechanisms that can be

Research article
Environmental Geology 40 (1-2) December 2000 7 Q Springer-Verlag 49
used to implement land retirement strategies are lumpsum payments or annual “rental fees.” The former areoften referred to as easements whereby the farmer’s rightto engage in non-conserving uses is purchased by thepublic sector for a specific period. Payment to an individ-ual to retire land would result in a voluntary change inconservation practices.
Regulation, taxes, and incentives
If voluntary measures prove insufficient to produce thechanges in conservation practices necessary to achievepublic goals, regulation is a policy that can be used. Theuse of certain conservation practices could be prohibited,taxed, or made a basis for withholding other benefits.Preferred conservation practices could be required or taxincentives offered to promote their use thereby offsettingsome of the cost of the requisite new equipment. Pointsources of pollution have been subject to command-and-control policies for many years. There are recognizedinefficiencies associated with technology-based regula-tions because the least-cost technology combination tomeet an environmental goal for an individual may not bepermitted. It has been assumed that such loss in efficien-cy is made up for by ease of implementation.
Conclusion
The use of conservation practices by agriculture in theUnited States will enhance soil organic carbon and poten-tially increase carbon sequestration. This, in turn, will de-crease the net emission of carbon dioxide.A number of studies exist that calibrate the contributionof various individual, site-specific conservation practiceson changes in soil organic carbon. There is a general ab-sence, however, of a comprehensive effort to measure ob-jectively the contribution of these practices, includingconservation tillage, the Conservation Reserve Program,and conservation buffer strips, to a change in soil organiccarbon. This paper attempts to fill that void.After recounting the evolution of the use of the variousconservation practices, it is estimated that organic carbonin the soil in 1998 in the United States attributable tothese practices was about 12.2 million metric tons. By2008, there will be an increase of about 25%.Given that there is a significant potential for conservationpractices to lead to an increase in carbon sequestration,there are a number of policy options that can be pur-sued. These include education and technical assistance,financial assistance, research and development, land re-tirement, and regulation and taxes.
Appendix 1
Tillage system definitions
Crop residue management (CRM)A year-round conservation system that usually involves areduction in the number of passes over the field with til-lage implements and/or in the intensity of tillage opera-tions, including the elimination of plowing (inversion ofthe surface layer of soil). CRM begins with the selectionof crops that produce sufficient quantities of residue toreduce wind and water erosion and may include the useof cover crops after low residue-producing crops. CRMincludes all field operations that affect residue amounts,orientation, and distribution throughout the period re-quiring protection. The amounts of residue cover neededat specific sites are usually expressed in percentage butmay also be in kilograms. Tillage systems included underCRM are conservation tillage (no tillage, ridge tillage, andmulch tillage) and reduced tillage.
Conservation tillageAny tillage and planting system that maintains at least30% of the soil surface covered by residue after plantingto reduce soil erosion by water. Where soil erosion bywind is the primary concern, any system that maintainsat least 454 kg per ha of flat, small grain residue equival-ent on the surface during the critical wind erosion peri-od. Two key factors influencing crop residue are (1) thetype of crop, which establishes the initial residue amountand determines its fragility, and (2) the type of tillage op-erations prior to and including planting.
Conservation tillage systemsMulch tillage: The soil is disturbed prior to planting.
Tillage tools such as chisels, field cultiva-tors, disks, sweeps, or blades are used.Weed control is accomplished with herbi-cides and/or cultivation.
Ridge tillage: The soil is left undisturbed from harvestto planting except for nutrient injection.Planting is completed in a seedbed pre-pared on ridges with sweeps, disk open-ers, coulters, or row cleaners. Residue isleft on the surface between ridges. Weedcontrol is accomplished with herbicidesand/or cultivation. Ridges are rebuilt dur-ing cultivation.
No tillage: The soil is left undisturbed from harvestto planting except for nutrient injection.Planting or drilling is accomplished in anarrow seedbed or slot created by coult-ers, row cleaners, disk openers, inrow chi-sels, or roto-tillers. Weed control is ac-complished primarily with herbicides.Cultivation may be used for emergencyweed control.
Research article
50 Environmental Geology 40 (1-2) December 2000 7 Q Springer-Verlag
Reduced till (15–30% residue)Tillage types that leave 15–30% residue cover after plant-ing, or 227–454 kg ha–1 of small grain residue equivalentthroughout the critical wind erosion period. Weed con-trol is accomplished with herbicides and/or cultivation.
Conventional till (~15% residue)Tillage types that leave less than 15% residue cover afterplanting, or less than 227 kg ha–1 of small grain residueequivalent through the critical wind erosion period. Gen-erally includes plowing or other intensive tillage. Weedcontrol is accomplished with herbicides and/or cultiva-tion.Source: Conservation Technology Information Center(1998)
Appendix 2
Soil erosion definitionsThe universal soil loss equation (USLE) is
ApR!K!f(L, S)!C!P
whereA is the computed soil loss per unit area, expressed in
the units selected for K and for the periods selectedfor R. In practice, these are usually so selected thatthey compute A in kg ha–1 year–1;
R the rainfall and runoff factor, is the number of therainfall erodibility index units plus a factor for runofffrom snow melt or applied water where such runoff issignificant;
K the soil erodibility factor is the soil loss rate per erod-ibility index unit for a specified soil as measured on aunit plot, which is defined as a 22-m length of uni-form 9% slope continuously in clean-tilled fallow;
L the slope length factor, is the ratio of soil loss fromthe field slope to that from a 22-m length of uniform9% slope continuously in clean-tilled fallow;
S the slope steepness factor, is the ratio of soil lossfrom the field slope gradient to that from a 22-mlength of uniform 9% slope continuously in clean-tilled fallow;
C the cover and management factor, is the ratio of soilloss from an area with specified cover and manage-ment to that from an identical area in tilled contin-uous cover; and
P the support practice factor, is the ratio of soil losswith a supporting practice such as contouring, stripcropping, or terracing to that with straight-row farm-ing up and down the slope.Note that f(L,S) indicates a nonlinear relationship be-tween L and S.
Highly erodible land (HEL) is land determined to have aninherent erosion potential of over eight times its soil losstolerance (T) level. Determination is made by calculatingthe erodibility index (EI) for both water and wind ero-
sion. If the EI for either water or wind is greater than 8,then the soil is classified as HEL.The erodibility index is a number showing how manytimes the inherent erosion potential is of the soil loss to-lerance (T) level. For water (sheet and rill) erosion, thenumber is calculated as
EIpR!K!L!S/T
whereR the rainfall and runoff factor, is the number of the
rainfall erodibility index units plus a factor for runofffrom snow melt or applied water where such runoff issignificant;
K the soil erodibility factor is the soil loss rate per erod-ibility index unit for a specified soil as measured on aunit plot, which is defined as a 22-m length of uni-form 9% slope continuously in clean-tilled fallow;
L the slope length factor, is the ratio of soil loss fromthe field slope to that from a 22-m length of uniform9% slope continuously in clean-tilled fallow; and
S the slope steepness factor, is the ratio of soil lossfrom the field slope gradient to that from a 22-mlength of uniform 9% slope continuously in clean-tilled fallow.
The soil loss tolerance level (T) is the maximum rate ofannual soil erosion that may occur and still permit a highlevel of crop productivity to be obtained economicallyand indefinitely. Most values for cropland in the UnitedStates are between 1.4 and 2.3 kg per metric tons peryear.
References
Aase J, Paul J (1995) Terrace formation in cropping stripsprotected by tall wheatgrass barriers. J Soil Water Conserv50 : 110–112
Barker JG, Baumgardner D, Turner, Lee J (1996) Carbondynamics of the Conservation and Wetland Reserve Pro-grams. J Soil Water Conserv 51 : 340–346
Beare MP, Hendrix, Coleman D (1994) Water-stable aggre-gates and organic matter fractions in conventional and no-til-lage soils. Soil Sci Soc Am J 58 : 777–786
Black A, Tanaka D (1997) A conservation tillage croppingsystems study in the Northern Great Plains of the UnitedStates. In: Paul E, Paustien K, Elliott E, Cole C (eds) Soil or-ganic matter in temperate agroecosystems. CRC Press, BocaRaton, pp 45–83
Bosch DZ, Cook, Fuglie K (1995) Voluntary versus mandatoryagricultural policies to protect water quality: adoption of ni-trogen testing in Nebraska. Rev Agric Econ 17 : 13–24
Bruce RG, Langdale, Dillard A (1990) Tillage and crop ro-tation effects on characteristics of a sandy surface soil. SoilSci Soc Am J 54 : 1744–1747
CAST (1992) Preparing US agriculture for global climatechange. Council for Agriculture and Technology, Report 119,Washington, DC
Caswell M, Shoemaker R (1993) Adoption of pest manage-ment strategies under varying environmental conditions.Tech Bull 1827, Economic Research Service, US Departmentof Agriculture, Washington, DC, December
Research article
Environmental Geology 40 (1-2) December 2000 7 Q Springer-Verlag 51
Chaubey ID, Edwards T, Daniel P, Moore, Nichols D
(1994) Effectiveness of vegetative filter strips in retaining sur-face-applied swine manure constituents. Trans Am Soc AgricEng 37 : 845–850
Conservation Technology Information Center (CTIC) (1998) Na-tional crop residue management survey. CTIC, West La-fayette, IN
Dobbs TJ, Bischoff L, Henning, Pflueger B (1995) Casestudy of the potential economic and environmental effects ofthe water quality incentive program and the integrated cropmanagement program: preliminary findings. Paper presentedat annual meeting of the Great Plains Economics Committee,Great Plains Agricultural Council, Kansas City, MO, April,pp 67–121
Donigian AT, Barnwell R, Jackson A, Patwardhan K,
Weinrich A, Rowell R, Chinnaswamy, Cole C (1994) Al-ternative management practices affecting soil carbon inagroecosystems of the central US. US Environmental Protec-tion Agency, Washington, DC, pp 23–48
Dormaar J, Smoliak S (1985) Recovery of vegetative coverand soil organic matter during revegetation of abandonedfarmland in a semiarid climate. J Range Manage 38 : 487–491
Edwards JC, Wood D, Thurlow, Ruf M (1992) Tillage andcrop rotation effects on fertility status of a hapludalt soil. SoilSci Soc Am J 56 : 1577–1582
Elliott E, Coleman D (1998) Let the soil work for us. EcolBull 39 : 23–32
Energy Information Administration (1995) Emissions of green-house gases in the United States 1987–1994. US Departmentof Energy, Washington, DC
Follett R (1993) Global climate change. J Prod Agric6 : 181–190
Franzluebbers A (1996) Water-soluble aggregation and or-ganic matter in four soils under conventional and zero tillage.Can J Soil Sci 76 : 387–393
Franzluebbers A (1997) Soil microbial biomass and mineral-izable carbon of water-stable aggregates. Soil Sci Soc Am J61 : 1090–1097
Franzluebbers AG, Langdale, Schomberg H (1999) Soilcarbon, nitrogen, and aggregation in response to type andfrequency of tillage. Soil Sci Soc Am J 63 : 349–355
Gebhart DH, Johnson H, Mayeux, Polley H (1994) TheCRP increases soil organic carbon. J Soil Water Conserv49 : 488–492
Gilley JJ, Doran D, Karlen, Kaspar T (1997) Runoff, ero-sion, and soil quality characteristics of a former ConservationReserve Program site. J Soil Water Conserv 52 : 189–193
Grant F (1997) Changes in soil organic matter under differenttillage and rotations: mathematical modeling in ecosystems.Soil Sci Soc Am J 61 : 1159–1175
Hefferman W (1984) Assumptions of the adoption/diffusionmodel and soil conservation. In: English B, Maetzold J, Hold-ing B, Heady E (eds) Agricultural technology and resourceconservation, Iowa State University Press, Ames, IA,pp 321–382
Hunt P (1996) Changes in carbon content of a Norfolk loamysand after 14 years of conservation or conventional tillage. JSoil Water Conserv 51 : 255–258
Hussain IK, Olson, Ebelhar S (1999) Long-term tillage ef-fects on soil chemical properties and organic matter fractions.Soil Sci Soc Am J 63 : 1335–1341
Hyvonen RG, Agren, Bosatta E (1998) Predicting long-termsoil organic carbon storage from short-term information. SoilSci Soc Am J 62 : 1000–1005
Kern J, Johnson M (1993) Conservation tillage impacts on na-tional soil and atmospheric carbon levels. Soil Sci Soc Am J57 : 200–210
Kneese A, Bower B (1968) Managing water quality: economics,technology, institutions. Johns Hopkins University Press, Bal-timore, MD
Lafond GD, Derksen H, Loeppky, Struthers D (1994) Anagronomic evaluation of conservation tillage systems andcontinuous cropping in east central Saskatchewan. J Soil Wa-ter Conserv 49 : 387–393
Lal R (1995) Conservation tillage for carbon sequestration. Pa-per presented at the International Symposium on Soil-Sourceand Sink of Greenhouse Gases, Nanjing, China, September
Lal RJ, Kimble R, Follett, Cole C (1998) The potential ofUS cropland to sequester carbon and mitigate the greenhouseeffect. Ann Arbor Press, Chelsea, MI
Lant CS, Kraft, Gillman K (1995) Enrollment of filter stripsand recharge areas in the CRP and USDA Easement Pro-grams. J Soil Water Conserv 50 : 193–200
Lee J (1995) The potential effects of afforestation on the carbonbudget of the south central United States. US EnvironmentalProtection Agency, Corvallis, OR
Lindstrom MT, Schumacher A, Jones, Gantzer C (1992)Productivity index model for selected soils in north centralUnited States. J Soil Water Conserv 47 : 491–494
Mannering JD, Schertz, Julian B (1987) Overview of conser-vation tillage. Effects of conservation tillage on groundwaterquality. Lewis Publishers, Chelsea, MI
Martin R (1998) Conservation buffers in best interest of all ofagriculture. Novartis Crop Protection, Inc., Springfield, MO
McCarl B, Callaway J (1993) Carbon sequestration throughtree planting on agricultural lands. Texas Agricultural Experi-ment Station, College Station, TX
McCarty GN, Lyssenko, Starr J (1998) Short-term changesin soil carbon and nitrogen pools during tillage managementtransition. Soil Sci Soc Am J 62 : 1564–1571
McConnell S, Quinn M (1988) Soil productivity of four landuse systems in southeastern Montana. Soil Sci Soc Am J52 : 500–506
Nowak P (1991) Why farmers adopt production technology. In:Crop residue management for conservation. Proc NationalConference, Soil and Water Conservation Society, Ankeny, IA
Nowak P, O’Keefe G (1995) Farmers and water quality: localanswers to local issues. Draft Report submitted to the USDept of Agriculture, Washington, DC, September
Osborn T (1993) The Conservation Reserve Program: status,future, and policy options. J Soil Water Conserv 48 : 271–280
Osborn T (1996) Conservation. Provisions of the Federal Agri-cultural Improvement Act of 1996, Economic Research Ser-vice, US Department of Agriculture, Washington, DC,pp 21–28
Paustien K, Andren H, Janzen R, Lal P, Smith G, Tian H,
Tiessen M, Van Noordwijk, Woomer P (1997) Agriculturalsoils as a sink to mitigate CO2 emissions. Soil Use Manage13 : 230–244
Paustien K, Cole D, Sauerbeck, Sampson N (1998) CO2 mi-tigation by agriculture. In: Paustien K (ed) Climatic change.CRC Press, Boca Raton, pp 132–157
Paustien K, Cipra V, Cole E, Elliott K, Killian, Bluhm G
(1999) The contribution of grassland CRP to C sequestrationand CO2 mitigation. Unpublished manuscript, Natural Re-source Ecology Laboratory, Colorado State University, Ft Col-lins, CO
Post WT, Peng W, Emanuel A, King V, Dale, DeAngelis D
(1990) The global carbon cycle. Am Sci 78 : 310–326Power J (1994) Understanding the nutrient cycling process. J
Soil Water Conserv 49 : 16–23Rasiah R, Kay B (1994) Characterizing the changes in aggre-
gate stability subsequent to introduction of forages. Soil SciSoc Am J 58 : 935–942
Research article
52 Environmental Geology 40 (1-2) December 2000 7 Q Springer-Verlag
Saha AH, Love, Schwart R (1994) Adoption of emergingtechnologies under output uncertainty. Am J Agric Econ76 : 836–846
Schertz D (1986) Conservation tillage: an analysis of acreageprojections in the United states. J Soil Water Conserv33 : 256–258
Schlesinger W (1995) An overview of the carbon cycle. In: LalR, Kimble J, Levine E, Stewart B (eds) Soils and globalchange. CRC Press, Boca Raton, pp 231–269
Schumacher TM, Lindstrom M, Blecha, Blevins R (1995)Management options for lands concluding their tenure in theConservation Reserve Program. In: Blevins R, MoldenhauerW (eds) Crop residue management to reduce erosion and im-prove soil quality – Appalachia and Northeast. AgriculturalResearch Service, US Department of Agriculture, Washington,pp 37–61
Six JE, Elliot, Paustien K (1999) Aggregate and soil organicmatter dynamics under conventional and no-tillage systems.Soil Sci Soc Am J 63 : 1350–1358
Smith K (1999) After the Kyoto protocol: can soil scientistsmake a useful contribution. Soil Use Manage 15 : 71–75
Tracy PD, Westfall E, Elliot G, Peterson, Cole C (1990)Carbon, nitrogen, phosphorous and sulfur mineralization inplow and no-till cultivation. Soil Sci Soc Am J 54 : 457–461
US Congress, Office of Technology Assessment (1990) Beneaththe bottom line: agricultural approaches to reduce agrichemi-cal contamination of groundwater. OTA-F-418, US Govern-ment Printing Office, Washington, DC, November
US Department of Agriculture, Economic Research Service(1998) Agricultural resources and environmental indicators.US Department of Agriculture, Washington, DC
US Department of Agriculture, Natural Resources ConservationService (1998) Buffer strips: common sense conservation. USDepartment of Agriculture, Washington, DC
US Department of Agriculture, Soil Conservation Service (1992)Instructions for collecting 1992 national resources inventorysample data, Washington, DC
US Environmental Protection Agency (1996) Notes on agricul-ture. Environmental Protection Agency, Washington, DC
Van Noordwijk MC, Cerri P, Woomer K, Nughroho M,
Bernoux (1997) Soil carbon dynamics in the humid tropicalforest zone. In: Elliot E, Kimble J, Swift M (eds) The manage-ment of carbon in tropical soils under global change: Science,practice, and policy Geoderma
Wander MM, Bidart, Aref S (1998) Tillage impacts on depthdistribution of total and particulate organic matter in threeIllinois soils. Soil Sci Soc Am J 62 : 1704–1711
Weinhold B, Halvorson A (1998) Cropping system in-fluences on several soil quality attributes in the northernGreat Plains. J Soil Water Conserv 53 : 254–258
Wood CJ, Edwards J, Cummins C (1991) Tillage and crop ro-tation effects on soil organic matter in a typical hapludalt ofnorthern Alabama. J Sustain Agric 2 : 31–41
World Agricultural Outlook Board (1999) USDA agricultural ba-seline projections to 2008. US Department of Agriculture,Washington, DC
Zobeck TN, Rolong D, Fryear J, Bilbro, Allen B (1995)Properties of recently tilled sod, 70-year cultivated soil. J SoilWater Conserv 50 : 210–215