global burden of disease and economic growth
TRANSCRIPT

HAL Id: halshs-00678713https://halshs.archives-ouvertes.fr/halshs-00678713
Preprint submitted on 16 Mar 2012
HAL is a multi-disciplinary open accessarchive for the deposit and dissemination of sci-entific research documents, whether they are pub-lished or not. The documents may come fromteaching and research institutions in France orabroad, or from public or private research centers.
L’archive ouverte pluridisciplinaire HAL, estdestinée au dépôt et à la diffusion de documentsscientifiques de niveau recherche, publiés ou non,émanant des établissements d’enseignement et derecherche français ou étrangers, des laboratoirespublics ou privés.
Global burden of disease and economic growthMartine Audibert, Pascale Combes Motel, Alassane Drabo
To cite this version:Martine Audibert, Pascale Combes Motel, Alassane Drabo. Global burden of disease and economicgrowth. 2012. �halshs-00678713�

CERDI, Etudes et Documents, E 2012.12
1
C E N T R E D ' E T U D E S
E T D E R E C H E R C H E S
S U R L E D E V E L O P P E M E N T
I N T E R N A T I O N A L
Document de travail de la série
Etudes et Documents
E 2012.12
Global burden of disease and economic growth
Martine AUDIBERT, Pascale COMBES MOTEL,
Alassane DRABO
March 2012
CERDI
65 BD. F. MITTERRAND
63000 CLERMONT FERRAND - FRANCE
TEL. 04 73 17 74 00
FAX 04 73 17 74 28
www.cerdi.org

Les auteurs
Martine AUDIBERT
CNRS Researcher, Clermont Université, Université d'Auvergne, CNRS, UMR 6587, Centre d’Etudes
et de Recherches sur le Développement International (CERDI), F-63009 Clermont-Ferrand, France
Email: [email protected]
Pascale COMBES MOTEL
Professor, Clermont Université, Université d’Auvergne, CNRS, UMR 6587, Centre d’Etudes et de
Recherches sur le Développement International (CERDI), F-63009 Clermont-Ferrand, France
Email: [email protected]
Alassane DRABO
Clermont Université, Université d’Auvergne, CNRS, UMR 6587, Centre d’Etudes et de Recherches
sur le Développement International (CERDI), F-63009 Clermont-Ferrand, France
Email: [email protected]
Corresponding author: [email protected]
La série des Etudes et Documents du CERDI est consultable sur le site :
http://www.cerdi.org/ed
Directeur de la publication : Patrick Plane
Directeur de la rédaction : Catherine Araujo Bonjean
Responsable d’édition : Annie Cohade
ISSN : 2114-7957
Avertissement :
Les commentaires et analyses développés n’engagent que leurs auteurs qui restent seuls
responsables des erreurs et insuffisances.

CERDI, Etudes et Documents, E 2012.12
3
Abstract
Relationships between health and economic prosperity or economic growth are difficult
to assess. The direction of the causality is often questioned and the subject of a vigorous
debate. For some authors, diseases or poor health had contributed to poor growth
performances especially in low-income countries. For other authors, the effect of health on
growth is relatively small, even if one considers that human capital accumulation needs also
health investments. It is argued in this paper that commonly used health indicators in
macroeconomic studies (e. g. life expectancy, infant mortality or prevalence rates for specific
diseases such as malaria or HIV/AIDS) imperfectly represent the global health status of
population. Health is rather a complex notion and includes several dimensions which
concern fatal (deaths) and non-fatal issues (prevalence and severity of cases) of illness. The
reported effects of health on economic growth vary accordingly with health indicators and
countries included in existing analyses. The purpose of the paper is to assess the effect of
health on growth, by using a global health indicator, the so-called disability-adjusted life year
(DALY) that was proposed by the World Bank and the WHO in 1993. Growth convergence
equations are run on 159 countries over the 1999-2004’s period, where the potential
endogeneity of the health indicator is dealt for. The negative effect of poor health on
economic growth is not rejected thus reinforcing the importance of achieving MDGs.
JEL Classification: E22, E24, I19, I18, O47
Key Words: Disease Global Burden, DALYs, economic growth, macroeconomic health impact,
cross-country analysis

CERDI, Etudes et Documents, E 2012.12
4
Introduction
Human capital investments are known for a long time as basic candidates explaining
growth performances (e. g. Schultz, 1961). Sen’s works on human capabilities and the
emergence of AIDS have renewed the interest given to the link between health, welfare, and
prosperity. At a microeconomic level, several studies found that poor health have negative
effects on economic prosperity and living conditions.1 At a macroeconomic level, the
Commission on Macroeconomics and Health (2001) concluded that diseases raise barriers to
economic growth and that countries have to invest in health. Several authors have considered
that communicable diseases, among others, had contributed to slow down economic
development of low income countries. The latter proposition is still hotly debated as some
methodological issues are not satisfactorily addressed (see the comprehensive and critical
review of Packard, 2009). Acemoglu and Johnson (2006), using international data from the
epidemiological transition period, find that an increase in life expectancy generated by a
decrease in mortality rates had a small positive effect which grows over the post
epidemiological transition. The latter was not enough important to compensate for increases
in population. Consequently, life expectancy increases do not lead to a significant increase in
per capita economic growth. This study makes reminiscent previous results of Barlow (1968)
with regard to malaria eradication and of Over (1992) with regard to economic effects of
AIDS as well. In the same vein, Bell, Bruhns and Gersbach (2006), using an overlapping
generations model simulate relaxed effects of AIDS on economic growth in Kenya by 2050.
There are at least three reasons that could explain difficulties to assess health impacts at the
macroeconomic level and therefore fuel the debate. First, links between health and
development or growth are complex and health effect could also be channelled into education
levels, the environment, and cultural behaviours as well. When, due to missing adequate
indicators, these behaviours are not included in the model, the estimated health effect will be
biased or hidden by unobserved heterogeneity (Thomas, 2009; Strauss and Thomas, 2007).
Second, health is subject to measurement errors either due to poor measurement facilities such
as lack of good equipment and materials for setting appropriate diagnosis, low human
resource training, deficient registration, measurement variability over the day (e.g. blood
pressure) or the year (e. g. malaria indicators). Third, health status is a rather complex notion
that includes several dimensions. Researchers face a wide array of health indicators
1 The literature on links between health and economic well-being or prosperity at microeconomic level is
abundant. See Strauss and Thomas (2007) for an exhaustive literature review.

CERDI, Etudes et Documents, E 2012.12
5
addressing one specific dimension of health. Consequently, using one or the other is not
equivalent.
Partly due to these difficulties of measuring multiple dimensions of health and therefore
global health, macroeconomic effects of health have been more still studied using health
indicators such as life expectancy at birth, infant mortality rates, or nutritional status
measures. Existing results can be questioned by addressing specifically the choice of health
status indicators, which is the subject of this study.
The rest of the paper is organized as follows. Section 2 is devoted to health measurement
issue. Different measures of health indicators used in the growth literature are discussed
before exploring the more global one on which is focused this study. Section 3 reviews the
theoretical and empirical literature on the link between health outcomes and economic
performances. The empirical setting and the results are presented in section 4 and 5. Section 6
concludes.
1. Looking for a global health indicator
Health measurement is a hard task since, contrary to economic indicators, health is multi-
dimensional,2 and measured with errors. Moreover, researchers, either in a perspective of
public health initiatives, health research, or economic health research, have developed a wide
array of health indicators, among which few however are satisfactorily measured (Murray and
Frenk, 2008; Murray, 2007).3 If it is crucial to understand what each indicator measures
(Strauss and Thomas, 2008), it is also important to insure that health indicators fit the
purposes of studies
The most commonly used indicators of health conditions at the macroeconomic level are
life expectancy at birth and infant mortality rates (Strauss and Thomas, 2008). Those
indicators are considered reflecting the general health conditions and supposed to be
positively associated with economic growth. It is true that life expectancy is higher and infant
mortality lower in richer countries than in poorer countries. Indeed, the correlation between
life expectancy at birth and GDP per capita is not systematic as life expectancy is lower (or
2 Whatever the approach chosen (medical, self-assessment or functional) for measuring health, poor health is
considering as a deviation between the observed health and a norm. This deviation may occur into either,
physical, mental, or social well-being dimension.
3 For a discussion on the issue and challenge of health measurement, see Mwabu, 2007; Strauss and Thomas,
2008; Murray and Frenk, 2008; Audibert, 2009).

CERDI, Etudes et Documents, E 2012.12
6
higher) than expected given GDP per capita in countries like Southern Africa, Gabon or
Indonesia (for examples, see Strauss and Thomas, 2008). Per capita incomes have diverged
over time while life expectancy and infant mortality have converged (Deaton, 2006; Jack and
Lewis, 2009). Life expectancy and infant mortality are inadequate indicators of the
population’s health in high income countries and for several upper middle income countries
where life expectancy is high and infant mortality is very low or low. For low and lower
middle income countries, those indicators are more adequate due to their poor levels. For that
reason, studying the relationships between health and economic development or growth in
cross-country studies using infant mortality or life expectancy at birth is not really
appropriate.
As underlined by Jack and Lewis (2009), the effect of a population’s health status on
national income varies accordingly with the health indicator used. Most health indicators used
in the literature capture one dimension of the population health. They either relate to fatal (life
expectancy,4 mortality indicators) or to non-fatal (morbidity indicators) issue of illness
(Audibert, 2009). For example, the emergence of HIV/AIDS and its high prevalence (more
than 15%) in some southern African countries (Botswana, Lesotho, Namibia, South Africa,
Swaziland, Zambia, and Zimbabwe, UNAIDS5), have motivated several studies focusing on
their economic effects. But, little evidence of a correlation between HIV/AIDS and GDP per
capita was found (Strauss and Thomas, 2008). With the renewed interest for malaria, some
authors (Sachs and Malaney, 2002; McCarthy, Wolf and Wu, 2000) have investigated its
effect on African countries growth. But, those indicators neither take into account other
dimensions of health, such as invalidity, handicap or social consequences, nor
multidimensional characteristics of health.
The main thesis of this paper is that macroeconomic effects of the global health status are
accurately caught by the Disability-Adjusted Life Year (DALY) per capita calculated by the
World Health Organization (WHO). This indicator is proposed by the World Bank and WHO
since 1993 (the World Bank, 1993). Its represents “a one lost year of healthy life and extends
the concept of potential years of life lost due to premature death to include equivalent years of
4 In low income countries, life expectancy is mainly determined by infant mortality, and also in countries where
AIDS prevalence is high, by AIDS mortality.
5 http://www.unaids.org/en/CountryResponses/Regions/SubSaharanAfrica.asp.
CERDI, Etudes et Documents, E 2012.12
7
healthy life lost by virtue of being in states of poor health or disability” (WHO, 2008).6 “The
sum of these DALYs across the population represents the burden of disease and can be
thought of as a measurement of the gap between current health status and an ideal health
situation where the entire population lives to an advanced age, free of disease and disability”
(WHO, 2008). DALYs were calculated initially for about one hundred causes and diseases
and over the whole world and were not updated since 2000. From 2000 to 2004 however,
DALYs are also available on a regional basis. DALYs are commonly used in cost-
effectiveness analyses but, to the best of our knowledge, have never been used in
macroeconomic analyses since DALYs at the country level are only available for 2002 and
2004.
Any indicator, including DALYs, is amenable to criticism with a particular emphasis on
weighting (namely age and disease severity) and discounting (e.g. Anand and Hanson, 1998).
A large revision has been however implemented, mainly by the Institute of Health Metrics,
which is in charge DALYs calculations updates and improvements (Lopez et al, 2006). This
does not prevent however this indicator from being a serious candidate for representing
population global health status, deriving from illness consequences which are taken into
consideration in a single indicator.
Figures 1B, 2B, 3B and 4B, Appendix B, present the relationships between different
DALY indicators and traditional health measures (Life expectancy, Infant Mortality Rate and
Child Mortality Rate) as well as GDP per capita. It appears clearly that even though there is a
tight association between DALYs and traditional health indicators, the correlation between
them is far from perfect.
2. Relationship between health and growth
This paper builds on the idea of health being a capital: people are endowed an initial stock
which can depreciate through time with age but which is the subject of investments
(Grossman, 1972; see Mwabu, 2007 for a literature review on the concept of health capital).
6 The DALYs for each health condition are the sum of the years of life lost (YLL) due to premature mortality
and the years lost due to disability (YLD) for incident cases of the health condition. YLL are calculated from the
number of deaths at each age multiplied by a global standard life expectancy for each age. YLD is the number of
incident cases in a particular period × average duration of the disease × weight factor. The weight factor reflects
the severity of the disease on a scale from 0 (perfect health) to 1 (death). For additional information, see WHO,
http://www.who.int/healthinfo/global_burden disease/metrics_daly/en/.

CERDI, Etudes et Documents, E 2012.12
8
From such a perspective, Van Zon and Muysken (2005) mention two positive effects of health
on economic growth. First, the health status of population increases the efficiency of labour;
second, human capital accumulation requires “health hours”. These effects add to those of
Bloom and Canning (2000) who argue that improvements in longevity increase savings and in
turn investments; moreover there exists a demographic dividend generated by a decline in
child mortality. The effect of health on economic growth has also been the subject of
theoretical investigations. One may refer to the augmented Solow model developed and tested
by Mankiw et al. (1992). Other authors have included health in optimal Cass-Koopmans like
growth models and thereby justified its inclusion in conditional convergence analyses as well:
the productivity in the health sector has a positive impact on all steady state variables
(Muysken et al. 2003). At last, health investments are taken into account in endogenous
growth models à la Lucas (1988) with two characteristics: health is produced with decreasing
returns whereas human capital is built with increasing returns. Health can either be a
complement or a substitute to growth when the effect of health on longevity is internalised
(van Zon & Muysken, 2001). Neo-schumpeterian growth models also allow identifying
several channels through which population health impacts their long run growth performance.
One of these channels puts forward the ability of health improvements to stabilise the gap in
living standards relatively to technology leaders (Howitt, 2005).
If at a micro-level, empirical studies found that poor health has an economic effect through
several channels (e.g. Audibert 2010), this effect is less evident at a macro-level. The
Preston’s curb (1975) establishes an upward shifting relationship between life expectancy and
national income per capita between 1900 and 1960. This correlation however neither gives
pieces information on the sense of the causality nor on the different channels through which
health may impact economic growth.
These channels may be identified. The first is that healthier people are more productive
and supply labour more efficiently. Indeed, they can work harder and longer, and think more
clearly. Health status may also improve economic outcomes through its effect on education.
Improvements in health raise the motivation to attend high level schooling, since the returns
to investments in schooling are valuable over a longer working life. Healthier children and
students also have more attendance and higher cognitive functioning, and thus receive a better
education for a given level of schooling. Furthermore lower mortality rates and higher life
expectancy encourage savings for retirement, and thus raise investment levels and capital per

CERDI, Etudes et Documents, E 2012.12
9
worker. Table A8 in Appendix A gives a synthesis of some of the main studies that explored
the connection between health and economic prosperity. We discuss here some major results.
Some scholars assess empirically how health indicators may influence economic returns in
a specific region using individual or household data while others measure the same effect at
more aggregated level, between countries or regions. All these studies could be divided
according to the health indicators considered. Indeed, a number of studies utilize health inputs
whereas others used health outcomes. Health inputs are the physical factors that influence an
individual’s health and comprise nutrition variables, exposure to pathogens, and the
availability of medical care (Weil, 2007). Health outcomes are related to the health status of
an individual or a given population. These include health indicators broadly considered such
as life expectancy, mortality indicators, the ability to work hard, and cognitive functioning as
well as specific illness prevalence such as malaria, AIDS/HIV, Guinea worm, etc.
Researchers generally conclude that population health remains an important predictor of
economic outcomes. Life expectancy at birth positively impact economic performances
(Barro & Lee, 1994; Cuddington & Hancock, 1994; Barro & Sala-I-Martin, 1995; Barro,
1996; Sach & Warner, 1997; Bloom & Malaney, 1998; Bloom et al., 2000, 2005, 2009;
Arora, 2001; Acemoglu & Johnson, 2007, 2009). Bloom et al. (2004) show that life
expectancy has a positive, sizable, and statistically significant effect on aggregate output even
when experience of the workforce is controlled for. Sala-i-Martin et al. 2004 departing from
the numerous potential explanatory variables in cross-country growth regressions, implement
a model selection criterion. The set of explanatory variables which emerges from the analysis
includes human capital variables and more especially life expectancy at birth. Acemoglu and
Johnson’s results (2007) are less conclusive with results indicating that increases in life
expectancy have no significant effect on output per capita.7
Mortality or survival variables are also used in the literature as overall health outcome
indicators that impact economic growth (Hamoudi & Sachs, 1999; Bhargava et al. 2001;
Weil, 2007; Lorentzen et al. 2005). Using cross-national and sub-national data, Lorentzen et
al. (2005) argue that high adult mortality rates reduce economic growth by shortening time
horizons since they favour riskier behaviours, higher fertility rates, and lower investments in
physical capital. Other authors are interested in the impact of specific diseases on economic
7 Even though, Bloom, Canning & Fink (2009) disagree with their results, Acemoglu and Johnson still
maintained their position in their 2009 paper.

CERDI, Etudes et Documents, E 2012.12
10
returns. In fact, many diseases like HIV/AIDS and malaria are found to have a negative effect
on the economy (Cuddington & Hancock, 1994; Gallup & al, 1999; Bonnel, 2000; Gallup &
Sachs, 2001; Sachs, 2003; Bell, Devarajan and Gerbasch 2003; McDonald & Roberts, 2006;
Audibert et al., 1998, 1999, 2003, 2006, 2009). McDonald & Roberts (2006) have calculated
that the elasticity of economic growth to HIV/AIDS prevalence in Africa is -0.59. Carstensen
& Gundlach (2006) found that malaria prevalence causes quantitatively important negative
effects on income even after controlling for institutional quality. Wiping out malaria from
sub-Saharan Africa could increase that continent’s per capita growth rate by as much as 2.6%
a year (Gallup and Sachs, 2001).
The results of the literature on the effect of poor health on economic growth are not clear-
cut, some authors finding a negative and significant effect, while others did not. The fact that
traditional health measures (prevalence, incidence, mortality rate, life expectancy at birth) do
not give a good indication of the disease burden, may explain that. By including diseases that
cause early death but little disability such as diseases that do not cause death but do cause
disability, the DALY gives a good indication of the disease burden (WHO, 2008) whatever
the main causes of this burden.8
3. Empirical framework
The analysis of the effect of health on economic growth is based on the augmented
neoclassical growth equation, which includes the global health status variable as a regressor
combined with initial GDP per capita as catch up variable and other exogenous variables.
�� = � + ����ℎ� + ′�� + ��
Where yi is the annual growth rate of GDP per capita with subscript i designating the
country; Healthi is the global health indicator; � is the matrix of the k control variables and εi
is the independently and identically distributed error terms; α, β and δ are parameters to be
estimated. Regional dummy variables are included to control for regional specific effects.
3.1. Data and variables
DALYs are available on the 2000-2004 period for 153 WHO member states (see countries’
list in Table A6). yi is thus the annual average growth rate on the 2000-2004 period; control
8 70% of the disease burden is from communicable diseases in Africa, 70% is from non-communicable diseases
in high income countries while the part of communicable and non-communicable diseases is equal in middle-
income countries (WHO, 2008).

CERDI, Etudes et Documents, E 2012.12
11
variables are average values over the same period. DALYs per capita at the country level are
not available on the whole period. DALYs are available for each WHO country (country
DALY) in 2002 and 2004; and from 2000 to 2002 and 2004 at a regional level according to the
WHO’s classification (regional DALY). In order to have comparable periods, we have several
opportunities.
First we can use country DALYs in 2002 or in 2004 (DALY 2002; DALY 2004) assuming
that the figures are representative of the health status over the period under study (Columns 1
and 2 in Table 1). Second, we can also use the average country DALY value, calculated with
the 2002 and 2004 data (DALY 2002-2004, Column 3 in Table 1). Third, we calculate a
corrected DALY. Under the hypothesis that the gap between the DALY of a country and the
DALY of the WHO region is constant on the 2000-2004’s period, the regional DALY is
weighted by the ratio of the 2004 country level DALY over the 2004 regional DALY
(Column 4 in Table 1). It allows generating DALY at the country level over the whole period
and then generates the average value for DALYs. More precisely:
�������������� = ������������� × !"#$%&'()*�#+,,-
./0�!#12'()*�#+,,-with
� = 2000, 2001, 2002, 2004
The causes of the disease burden differ according to income levels (see footnote 8). This
characteristic is taken into account while calculating DALYs with respect to communicable
diseases and to non-communicable diseases as well. Finally as malaria and HIV/AIDS
constitute respectively a large part of the disease burden in low income countries, and are the
fifth main diseases in the world (WHO, 2008), DALYs with respect to both diseases are also
considered in the econometric analysis.
We consider several control variables X, which are either assumed from the theoretical
model or inferred from other cross-country analyses of Solow augmented growth regressions.
Initial GDP per capita allows considering conditional convergence when it exhibits a negative
effect on growth; annual growth rates of population and investment ratio to GDP have resp. a
negative and positive effect on growth (e.g. Mankiw et al. 1992). In addition to the global
health indicator, other human capital variables are included. Lagged female school enrollment
rates are preferred to male school enrollment as it may also reflect the inequality level that has
an impact on growth. Lagged variables may cope with endogeneity bias.

CERDI, Etudes et Documents, E 2012.12
12
Our second group of control variables includes the Government consumption ratio to GDP,
openness and inflation rates. The government consumption does not have a clear-cut effect on
growth (Barro, 1992). Openness and inflation allows taking economic policy variables with
resp. a positive and a negative effect on growth. A variable taken from Kaufmann and al.
(2009) allows including institutional quality which positively affects growth.
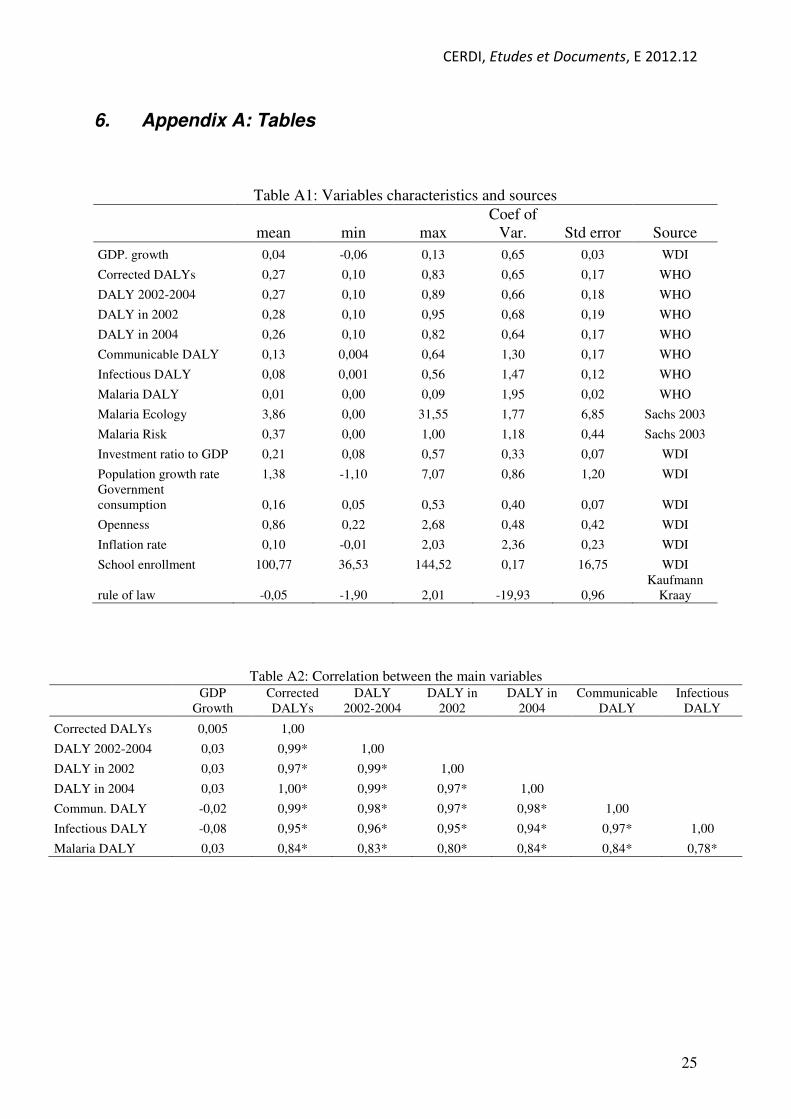
Summary statistics are reported in Table A1 and A2, Appendix A.
3.2. Econometric specification
OLS estimation of equation (1) is potentially biased. First there can be a simultaneity bias
between global health status and growth (e.g. Bonnel 2000; Bloom, Canning and Malaney
2000; Sachs et al. 1999, 2003; Strauss and Thomas, 2008; Schultz, 2008). Under the
hypothesis that faster growing economies have a better health outcome, OLS estimates of
health effects on growth are positively biased. Measurement errors of the global health
indicator may also induce downward biased estimators (attenuation bias). To deal with these
problems, we draw on instrumental variables techniques and therefore several instruments.
The first is malaria ecology developed by Kiszewski et al. (2004) and first used in cross-
country regressions by Sachs (2003) and Carstensen and Gundlach (2006). Malaria ecology is
built upon climatic factors and specific biological properties of each regionally dominant
malaria vector which only reflects the forces of biological evolution and is thus independent
from present health interventions and economic conditions. Moreover germs likely to be
affected by economic conditions or public health interventions (like mosquito abundance, for
example) do not enter the calculation of the index (Kiszewski et al. 2004; Carstensen and
Gundlach 2006).
The other instrument used in this paper is the proportion of each country’s population
threatened by a risk of malaria transmission in 1994 (Sachs 2003). This indicator affects
current economic growth only through health status and is unlikely affected by current
economic conditions.
4. Econometric results
Equation (1) is estimated with the heteroskedastic-efficient two-step generalized method of
moments (IV-GMM) estimator which generates efficient coefficients as well as consistent
standard errors estimates. The efficiency gains of this estimator relative to the traditional

CERDI, Etudes et Documents, E 2012.12
13
IV/2SLS estimator derive from the use of the optimal weighting matrix, the over-identifying
restrictions of the model, and the relaxation of the independently and identically distributed
(i.i.d.) assumption. For an exactly-identified model, the efficient GMM and traditional
IV/2SLS estimators coincide, and under the assumptions of conditional homoskedasticity and
independence, the efficient GMM estimator is the traditional IV/2SLS estimator (Hayashi
2000 pp.206-13 and 226-27; Baum et al. 2007).
4.1. Results
Our results stress that health status is an important predictor of economic development on a
large sample of poor and rich countries. Efficient-GMM estimations are presented in Table 1
below. The quality of the instruments is either validated by the Shea R², or the statistic of
Fisher and the Hansen over-identification test of the first stage estimation results presented in
Table A4 (Appendix A).
The effect of DALYs due to HIV/AIDS on economic development is not estimated for two
reasons. First, we did not find a valid and relevant instrument for HIV/AIDS. The instrument
used in the literature is the lagged HIV/AIDS variable (McDonald and Roberts, 2006) and we
do not have relevant data for that. The second reason is that HIV/AIDS is always associated to
co-infections that enter into the group of communicable and non-communicable diseases such
as tuberculosis, hepatitis C, liver disease (see for example Sharifi-Mood and Metanat, 2006;
Amin et al. 2004). We may thus suppose that the effect of HIV/AIDS may be caught by
communicable and non-communicable DALYs.
The first four columns report estimates with a global health indicator. Contrary to OLS
estimates,9 Health is found to have a negative and statistically significant effect on economic
growth thus validating the attenuation bias. This result is robust to variants of DALYs
(columns 1 to 4). The marginal effect of DALY on growth is significant whatever its
calculation (Table 1). Contrary to what expected, the coefficient and then the effect of
DALYs for communicable diseases (Column 5) are not different to that of global DALYs. It
may reflect the importance of communicable diseases in health status in the world and as a
barrier to economic development. Malaria has however a strong negative effect on economic
growth: the coefficient of DALYs for malaria is higher (-0.365) than the coefficients of
9 OLS estimates of equation (1) are reported in Table A3, Appendix A.

CERDI, Etudes et Documents, E 2012.12
14
global DALYs or communicable DALY, also indicating that malaria is one among other
health main causes.
These results are in conformity with some important previous works. Moreover, the other
explanatory variables present the expected signs apart from the population growth rate and the
education variable. The convergence hypothesis is not rejected, inflation rate reduces
economic growth and investment rate improves it. We also found that Government spending
is negatively related to economic growth (Landau, 1983). As found in the literature (Knowles
and Owen 1994, Berthélemy et al. 1997), education is not significant.

CERDI, Etudes et Documents, E 2012.12
15
Table 1. Two-step GMM estimation of economic effects of DALYs per capita Dependent variable: GDP per capita growth
Independent variables (1) (2) (3) (4) (5) (6) (7)
DALY in 2002 -0.111**
(2.47)
DALY in 2004 -0.108**
(2.55)
DALY 2002-2004 -0.110**
(2.53)
Corrected DALYs -0.108***
(2.61)
Communicable DALY -0.119***
(2.64)
Infectious DALY -0.157**
(2.54)
Malaria DALY -0.365**
(2.36)
Log initial GDP per capita -0.010***
-0.008**
-0.009**
-0.009***
-0.009**
-0.008**
-0.005*
(2.61) (2.49) (2.57) (2.59) (2.56) (2.44) (1.74)
Investment ratio to GDP 0.127***
0.105***
0.116***
0.102**
0.110***
0.123***
0.129***
(3.71) (2.58) (3.13) (2.54) (2.86) (3.27) (3.38)
Population growth rate 0.002 0.002 0.002 0.002 0.003 0.002 0.004*
(0.55) (0.87) (0.71) (0.82) (1.31) (0.60) (1.77)
Government consumption -0.108***
-0.119***
-0.114***
-0.117***
-0.117***
-0.111***
-0.134***
(2.94) (3.26) (3.12) (3.21) (3.14) (3.02) (3.76)
Openness 0.006 0.004 0.005 0.004 0.003 0.005 0.002
(1.60) (1.34) (1.52) (1.27) (1.03) (1.33) (0.62)
Inflation rate -0.018**
-0.018**
-0.018**
-0.016**
-0.014* -0.009 -0.026
**
(2.13) (2.29) (2.22) (2.04) (1.91) (1.09) (2.10)
School enrolment lagged -0.000 -0.000 -0.000 -0.000 -0.000 -0.000 -0.000
(0.97) (1.21) (1.09) (1.18) (1.06) (0.35) (1.25)
Institutions -0.001 -0.003 -0.002 -0.002 -0.001 -0.000 -0.003
(0.19) (0.73) (0.45) (0.61) (0.16) (0.09) (0.64)
Constant 0.147***
0.136***
0.141***
0.141***
0.127***
0.111***
0.080***
(2.93) (2.92) (2.95) (2.99) (3.00) (2.91) (2.65)
Observations 138 138 138 138 138 138 138
R² 0.345 0.396 0.380 0.393 0.410 0.374 0.411
Shea R2 0.146 0.232 0.190 0.208 0.191 0.157 0.483
Fisher F statistic 6.811 13.726 9.750 11.984 10.924 8.869 54.800
(p-value) 0.0016 0.0000 0.0001 0.0000 0.0000 0.0003 0.0000
Hansen OID p-value 0.467 0.481 0.470 0.624 0.764 0.708 0.274
Note: Health variables are instrumented by Malaria Ecology and Malaria Risk.
***significant at 1%, **significant at 5%, *significant at 10%. Robust t-statistics in parentheses.
4.2. Robustness analyses
Our previous results may still be questioned. First, they may be due to the large health
outcome gap between developed and developing countries, and may not satisfactorily explain
development levels gaps between developing or developed countries. Secondly, it is relevant
to investigate the role of health in the explanation of development differential within countries
which share a common characteristic related to poor basic health infrastructures. Our growth
regression is therefore estimated on a low and middle-income countries sub-sample of which

CERDI, Etudes et Documents, E 2012.12
16
results are presented in Table 2 and the first stage estimation results are presented in Table A5
Appendix A. They are similar to those obtained for the whole sample, namely, health remains
an important determinant of economic growth. Coefficients are smaller than those previously
obtained on the whole sample (0.083 against 0.108 for Corrected DALYs; 0.324 against 0.365
for Malaria DALYs).
These results suppose that there are other limiting global factors to growth other than
health such as education quality which is not satisfactorily measured. We cannot show
evidence of a complementarity between health and education which is probably the result of a
poor measurement of education.

CERDI, Etudes et Documents, E 2012.12
17
Table 2: Two-steps GMM estimation of economic effect of DALYs per capita, developing countries
Dependent variable: GDP per capita growth
Independent. variables (1) (2) (3) (4) (5) (6) (7)
DALY in 2002 -0.077**
(2.01)
DALY in 2004 -0.084**
(2.07)
DALY 2002-2004 -0.080**
(2.05)
Corrected DALYs -0.083**
(2.10)
Communicable DALY -0.091**
(2.05)
Infectious DALY -0.108**
(2.06)
Malaria DALY -0.324*
(1.88)
Log initial GDP per capita -0.008**
-0.008* -0.008
* -0.008
** -0.008
* -0.007
* -0.005
(1.98) (1.91) (1.95) (1.97) (1.95) (1.86) (1.44)
Investment ratio to GDP 0.128***
0.110**
0.119***
0.109**
0.117***
0.127***
0.124***
(3.25) (2.45) (2.86) (2.46) (2.78) (3.02) (2.62)
Population growth rate -0.002 -0.002 -0.002 -0.002 -0.001 -0.001 -0.002
(0.71) (0.92) (0.81) (0.86) (0.19) (0.56) (0.96)
Government consumption -0.098***
-0.109***
-0.103***
-0.107***
-0.109***
-0.102***
-0.130***
(2.66) (2.90) (2.80) (2.86) (2.85) (2.76) (3.21)
Openness 0.001 -0.001 0.000 -0.001 -0.001 -0.000 -0.001
(0.15) (0.10) (0.04) (0.15) (0.18) (0.06) (0.21)
Inflation rate -0.021**
-0.021**
-0.021**
-0.019**
-0.018**
-0.015* -0.028
*
(2.14) (2.17) (2.16) (2.04) (1.98) (1.67) (1.94)
School enrolment lagged -0.000 -0.000 -0.000 -0.000 -0.000 -0.000 -0.000
(0.70) (0.93) (0.81) (0.88) (0.72) (0.15) (1.01)
Institutions 0.002 0.001 0.002 0.001 0.002 0.003 0.002
(0.52) (0.18) (0.36) (0.21) (0.45) (0.60) (0.35)
Constant 0.130***
0.134***
0.132***
0.137***
0.124***
0.104***
0.102***
(3.11) (3.05) (3.09) (3.08) (3.13) (3.24) (2.90)
Observations 103 103 103 103 103 103 103
R² 0.447 0.446 0.452 0.447 0.464 0.468 0.421
SheacR2 0.189 0.265 0.229 0.241 0.211 0.199 0.486
Fisher F statistic 7.748 13.360 10.178 11.784 10.090 9.725 48.174
(p-value) 0.0008 0.0000 0.0001 0.0000 0.0001 0.0002 0.0000
Hansen OID p-value 0.689 0.671 0.679 0.796 0.876 0.862 0.381
Note: Health variables are instrumented by Malaria Ecology and Malaria Risk.
***significant at 1%, **significant at 5%, *significant at 10%. Robust t-statistics in parentheses.
4.3. Effect of a standard deviation decrease of the DALYs on growth
In the previous subsection, we showed that population health measured by the global
burden of disease has a negative impact on economic development. This result can be
quantified by simulating the effect of a one standard deviation increase of the DALYs on
economic growth. The first and third columns of Table 3 present respectively the change in
economic growth due to one standard deviation decrease of the different measures of DALYs

CERDI, Etudes et Documents, E 2012.12
18
for the whole sample and that of developing countries. For the total DALYs and
communicable diseases DALYs, the effect ranges from 0.44 to 0.50 percentage points on the
whole sample and around 0.30 percentage points on the developing countries sample. More
importantly, this health impact doubles for infectious diseases and is multiplied by ten for
malaria DALYs. The second column of Table 3 shows the average economic growth level for
the whole samples after experiencing one standard deviation decrease of the DALYs. The
average economic growth changes from 4% to around 5.5%, and is even around 10% for
malaria DALYs. A similar figure is observed for developing countries sample in the last
column. This is largely due to high standard deviation of malaria indicator (around 0.154
against 0.062).
Table 3: Effect of a standard deviation decrease of the global burden of disease on economic growth
Whole sample Developing countries sample
Change (∆y) Effect (y+∆y) Change (∆y) Effect (y+∆y)
DALY in 2002 0.00504 0,04537 0.00297 0,04547
DALY in 2004 0.00455 0,04488 0.00337 0,04587
DALY 2002-2004 0.00473 0,04507 0.00315 0,04565
Corrected DALYs 0.00442 0,04476 0.00324 0,04574
Communicable DALY 0.00534 0,04568 0.00405 0,04655
Infectious DALY 0.00976 0,05010 0.00566 0,04816
Malaria DALY 0.05630 0,09663 0.05609 0,09859
5. Concluding remarks
This article contributes to the debate on the relationship between health outcomes and
economic performance by paying a particular attention to global health status measurement
issues. We argue that, traditional health indicators such as life expectancy and mortality rates
are inadequate to explain the overall health status in a population since they present many
drawbacks and are devoted to a particular health problem. An accurate health indicator must
measure the gap between current health status and an ideal health situation where the entire
population lives to an advanced age, free of disease and disability. This is what the disability-
adjusted life year (DALY) proposed by the World Bank and WHO since 1993 tries to
measure.
Several remarks can be drawn from our results. First, as the results were very similar
whatever the estimation of DALYs used (corrected DALYs, country DALYs or regional
DALYs), it appears that regional DALYs represent correctly the disease burden of each

CERDI, Etudes et Documents, E 2012.12
19
country inside the considered region. Estimating country DALYs each year does not seem to
be necessary. Secondly we highlight and confirm the role of poor health in the economic
development. This result has been showed by using a global health outcome which takes into
consideration mortality, morbidity, and disability consequences of health as well. Thus, we
estimated the effect of global health, and not only of a specific disease or disease fatal
consequence. However, this indicator that can be calculated for a group of particular diseases
such as communicable diseases, or for a specific disease, such as malaria, allowed us to
estimate the economic burden of diseases that remain an important impediment to economic
development especially in low income countries.
These results call for important and relevant policy recommendations, especially for the
developing world. Given the low health status in poor countries, health issues represent a
challenge rather than a handicap since it offers them more rooms and possibilities to boost
their economic growth and reduce their poverty levels.
For this challenge to be transformed into an opportunity, accurate health policies should be
implemented, such as efficient health spending. More attention should be paid to water and
sanitation that are the main determinants of communicable diseases such as diarrheal diseases.
International community should also help national health policy makers through their support
and pressure. This could be done through increasing health sector assistance and the
promotion of good institutions. Brain drain in health sector also should be transformed into
brain gain through support to physicians from poor countries.
CERDI, Etudes et Documents, E 2012.12
20
References
Abegunde, D. Stanciole A., 2006. An estimation of the economic impact of chronic non-
communicable diseases in selected countries, WHO Working Paper, CHP department.
Acemoglu, D., Johnson S., 2009. Disease and Development: The Effect of Life Expectancy
on Economic Growth, In: Michael Spence and Maureen Lewis (Eds), Health and
Growth Chapter 4, Commission on Growth and Development.
Amin, J., Kaye, M., Skidmore, S., Pillay, D., Cooper, D.A., Dore, G.J., 2004. HIV and
hepatitis C co-infection within the CAESAR study. HIV Medicine, 5 (3) 174-9.
Anand, S., Hanson, K., 1998. DALYs: efficiency versus equity, World Development, 26, 2,
307-310.
Aguayo-Rico A., Guerra-Turrubiates I.A., 2005. Empirical Evidence of the Impact of Health
on Economic Growth, Political Economy, Vol. 14
Arora, S., 2001., Health, Human Productivity, and Long-Term Economic Growth, The
Journal of Economic History, 699-749.
Audibert, M., 1986. Agricultural non-wage production and health status: a case study in a
tropical environment, Journal of Development Economics 24, 275-291.
Audibert, M., 1997a. La cohésion sociale est-elle un facteur de l’efficience technique des
exploitations agricoles en économie de subsistance? Revue d’Economie du
Développement 3, 69-90.
Audibert, M., 1997b. Technical inefficiency effects among paddy farmers at the ‘Office du
Niger’, Mali, West Africa, Journal of Productivity Analysis 8, 379-394.
Audibert, M., 2009. Issues and Challenges of Measurement of Health: Implications for
Economic Research, Health Economic Growth Framework Paper, HEGPR_02, 29p.
Audibert, M., 2010. Endemic Diseases and Agricultural Productivity: Challenges and Policy
Response. Journal of African Economies, Oxford University Press, vol. 19(3), 110-
165.
Audibert, M., Etard J-F., 1998. Impact of schistosomiasis on rice production and efficiency in
Mali. Journal of African Economies, 7 (2), 185-207.
Audibert, M., Brun, J-F., Mathonnat, J., Henry, M-C., 2003. Malaria and Property
Accumulation in Rice Production Systems in the Savannah Zone of Cote d'Ivoire,
Tropical Medicine and International Health, Vol. 8 , n° 5, p. 471-483
Audibert, M., Brun, J-F., Mathonnat, J., Henry, M-C., 2006. Malaria, Production and Income
of the Producers of Coffee and Cocoa: an Analysis from Survey Data in Côte d’Ivoire.
Malaria, coffee and cocoa production and income, CERDI, études et documents, 2006
n° 31
Audibert, M., Brun, J-F., Mathonnat, J., Henry, M-C., 2006.Effets économiques du paludisme
sur les cultures de rente : l’exemple du café et du cacao en Côte d’Ivoire. Revue
d'Economie du Développement, Vol. 23 , n° 1-2, p. 145-166
CERDI, Etudes et Documents, E 2012.12
21
Audibert, M., Nzeyimana, I., Mathonnat, J., Henry, M-C., 1999. Rôle du paludisme dans
l'efficience technique des producteurs de coton du nord de la Côte d'Ivoire, Revue
d'Economie du Développement, p. 121-148
Barlow, R., 1968. The economic effects of malaria eradication. Bureau of Public Health
Economics. Research Series 15: 167p.
Barro, R., 1992. Economic growth in a cross section of countries, The Quarterly Journal of
Economics, 106, 2, May, 407-443.
Barro, R., 1996. Health and Economic Growth. Harvard University, Cambridge, MA.
Barro, R., Lee, J., 1994. Sources of economic growth, Carnegie-Rochester Conference Series
on Public Policy 40, 1–46.
Barro, R., Sala-I-Martin X., 1995. Economic Growth. New York: McGraw-Hill.
Baum, C.F., Schaffer, M. E., Stillman, S., 2007. Enhanced routines for instrumental
variables/GMM estimation and testing. Unpublished working paper, forthcoming.
Bell, C., Bruhns R., Gersbach H., 2006. Economic growth, education, and AIDS in Kenya,
Policy Research Working Paper 4025, The World Bank, Development Economics.
Bell, C., Devarajan, S., Gersbach, H., 2003. The Long-run Economic Costs of AIDS: Theory
and an Application to South Africa. World Bank Economic Review 20(1): 55-89.
Berthélemy, J-C., D., S., Varoudakis, A., 1997. Capital humain et croissance: le rôle du
régime commercial. Revue économique, 48(3), 419-428.
Bhargava, A., Jamison D.T.,, Lau, L.J., Murray C. 2001. Modeling the Effects of Health on
Economic Growth, Journal of Health Economics, vol. 20, pp. 423-440.
Bloom, D.E., Canning D., Sevilla J., 2001. The Effect of Health on Economic Growth:
Theory and Evidence, Working Paper 8587.
Bloom, D.E., Canning D., 2000. Health and Economic Growth: Reconciling the Micro and
Macro Evidence, CDDRL Working Paper.
Bloom, D.E., Canning, D., Malaney, P.N., 2000. Demographic change and economic growth
in Asia, Population and Development Review, 26(supp.), 257– 290
Bloom, D.E., Williamson, J. G., 1998. Demographic transitions and economic miracles in
emerging Asia. World Bank Economic Review, 12(3), 419–455.
Bloom, D., Sachs, J., 1998. Geography, demography, and economic growth in Africa.
Brookings Papers on Economic Activity, 2, 207–273.
Bloom, D.E., Malaney, P.N., 1998. Macroeconomic consequences of the Russian mortality
crisis, World Development, 26, 2073–2085.
Bloom D.E., Canning D., Fink G., 2009. Disease and Development Revisited, NBER working
paper 15137.
Bloom, D.E., Canning, D., Sevilla, J., 2004. The effect of health on economic growth: A
production function approach, World Development, 32, 1, 1-13.

CERDI, Etudes et Documents, E 2012.12
22
Bonnel, R., 2000. HIV/AIDS: Does it increase or decrease growth in Africa? World Bank,
ACTAfrica (AIDS Campaign Team for Africa), November, Washington, D.C.
Carstensen, K., Gundlach E., 2006. The Primacy of Institutions Reconsidered: Direct Income
Effects of Malaria Prevalence, The World Bank Economic Review, 20, 3.
Caselli, F., Esquivel G., Lefort, F. 1996. Reopening the Convergence Debate: A New Look at
Cross-Country Growth Empirics. Journal of Economic Growth 1(3): 363–89.
Commission on Macroeconomics and Health, 2001. Macroeconomics and health: investing in
health for economic development. Geneva: WHO.
Cuddington, J.T. Hancock J.D., 1994. Assessing the Impact of AIDS on the Growth Path of
the Malawian Economy, Journal of Development Economics 43, 363-368.
Deaton, A., 2006. Global Patterns of Income and Health: Facts, Interpretations, and Policies,
NBER Working Paper W12735, Cambridge.
Gallup, J.L., Sachs, J.D. 2001. The economic burden of malaria, The American Journal of
Tropical Medicine and Hygiene, 85-96.
Gallup, J.L, Sachs J.D, Mellinger A.D, 1999. Geography and Economic Development,
International Regional Science Review 22(2): 179–232.
Grossman, M., 1972. On the Concept of Health Capital and the Demand for Health. The
Journal of Political Economy, 80(2), 223-255.
Hamoudi, A., Sachs, J. 1999. Economic Consequences of Health Status: A Review of the
Evidence. Working Paper no. 30. Harvard Center for International Development,
Cambridge, MA.
Hayashi, F., 2000. Econometrics. Princeton: Princeton University Press.
Howitt, P., 2005. Health, Human Capital, and Economic Growth: A Schumpeterian
Perspective. in G. López-Casasnovas, B. Rivera, & L. Currais, ed. Health and
economic growth: findings and policy implications. Cambridge MA: MIT Press, p.
19-40.
Jack, W., Lewis M., 2009. Health investments and economic growth: Macroeconomic
evidence and microeconomic foundations, in Michael Spence and Maureen Lewis
(Eds), Health and Growth Chapter 1, Commission on Growth and Development.
Kaufmann, D., Kraay, A., Mastruzzi, M., 2009. Governance Matters VII: Aggregate and
Individual Governance Indicators, 1996-2007, World Bank Policy Research Working
Paper no. 4654.
Kiszewski, A., Mellinger A., Malaney P., Spielman A., Sachs S.E., Sachs J.D., 2004. A
Global Index of the Stability of Malaria Transmission Based on the Intrinsic Properties
of Anopheline Mosquito Vectors. American Journal of Tropical Medicine and
Hygiene 70(5): 486-498
Knowles, S., Owen, P.D., 1994. Health Capital and Cross-country variation in income per
capita in the Mankiw-Romer-Weil model, Economics Letter, vol. 48(1), 99-106
CERDI, Etudes et Documents, E 2012.12
23
Landau, D., 1983. Government Expenditure and Economic Growth: A Cross-Country Study,
Southern Economic Journal, 49(3) 783-792.
Lopez, A.D., Mathers, C.D., Ezzati, M., Murray C.J.L., Jamison D.T., 2006. Global burden of
disease and risk factors, New York, Oxford University Press, 2006.
Lorentzen, P., McMillan, J., Wacziarg R., 2008. Death and development. Journal of
Economic Growth, 13(2), 81-124.
Lucas, R., 1988. On the Mechanics of Economic Development, Journal of Monetary
Economics, Vol. 22 (1), 3-42.
Mankiw, N.G., Romer, D., Weil, D.N., 1992. A Contribution to the Empirics of Economic
Growth. The Quarterly Journal of Economics, 107(2), 407-437.
Mayer, D., 2001. The Long term impact of health of economic growth. World Development,
1025-1031.
McCarthy F.D., Wolf, H., Wu, Y., 2000. Malaria and Growth, Policy Research Working
Paper 2303, The World Bank.
McDonald, S., Roberts, J., 2006. AIDS and economic growth: A human capital approach,
Journal of Development Economics 80, 228– 250
Murray, C.J.L., Frenk J., 2008. Health metrics and evaluation: strengthening the science,
Lancet 371, 1191-1199.
Murray, C.J.L., 2007. Good practices for health statistics: lessons from the Millennium
Development Goal health indicators, Lancet 369, 862-873.
Muysken, J., Yetkiner, I.H., Ziesemer, T., 2003. Health, labour productivity and growth. In H.
Hagemann & S. Seiter, ed. Growth Theory and Growth Policy. Routledge Studies in
International Business and the World Economy. London: Routlledge, p. 187–205.
Mwabu, G., 2007. Health Economics for Low-Income Countries, in T. P. Schultz & J. A.
Strauss, ed. Handbook of Development Economics. Amsterdam: Elsevier North
Holland, 3305-3374.
Over, M., 1992. The macroeconomic impact of AIDS in Sub-Saharan Africa, AFTPN
Technical Working Paper, Population, Health and Nutrition Division, Africa Technical
Department, Washington D.C, World Bank.
Packard, R.M. 2009. Roll back malaria, roll in development? Reassessing the economic
burden of malaria, Population & Development Review, 35(1), 53-87.
Preston, S.H., 1975. The Changing Relation between Mortality and Level of Economic
Development, Population Studies, 29, 2, 231-248.
Ranis, G., Stewart, F., Ramirez, A., 2000. Economic growth and human Development, World
Development, 28, 197-219.
Sachs J.D., Malaney P., 2002. The economic and social burden of malaria, Nature, 415(6872),
680-685.

CERDI, Etudes et Documents, E 2012.12
24
Sachs J.D., 2003. Institutions Don’t Rule: Direct Effects of Geography on Per Capita Income,
Working Paper 9490.
Sachs, J.D., Warner, A., 1997. Sources of Slow Growth in African Economies, Journal of
African Economics 6(3): 335—76.
Sala-i-Martin, X., Doppelhofer, G., Miller, R.I., 2004. Determinants of Long-Term Growth: A
Bayesian Averaging of Classical Estimates (BACE) Approach. The American
Economic Review, 94(4), 813-835.
Schultz, T.P., 2008. Health Human Capital and Economic Development, Paper presented at
the African Economic Research Consortium Biannual Workshop, Plenary session,
November, Nairobi, Kenya.
Schultz, T.W., 1961. Investment in Human Capital, American Economic Review, LI, 1- 17.
Sharifi-Mood, B., Metanat M., 2006. Co-infection HIV/AIDS and hepatitis C. International
Journal of Virology, 2: 63-66.
Strauss, J., Thomas, D., 2007. Health over the life course, in T. Paul Schultz and J Strauss
(eds.), Handbook of Development Economics, vol 4, Chapter 54, Amsterdam: North
Holland, 3375-3474.
Strauss, J., Thomas, D., 2008. Health over the life course, in T.P Schultz and J. Strauss (Eds),
Handbook of Development Economics, Vol 4 of K.J. Arrow and M.D. Intriligator
(Eds), Handbooks in Economics 9, 3378-3469.
Thomas, D., 2009. The causal effect of health on social and economic prosperity: Methods
and findings, Health Economic Growth Framework Paper, HEGPR_07.
Thuillez, J., Sissoko, M., Toure, O., Kamate, P., Berthélemy, J-C., Doumbo, O., 2010.
Malaria and primary education in Mali: A longitudinal study in the village of
Donéguébougou, Social Science and Medicine, 71, 324-334.
Thuillez, J., 2010. Malaria and primary education: A cross country analysis on primary
repetition and completion rates, Review of Development Economic, 2, 5, 127-157.
Van Zon, A. & Muysken, J., 2001. Health and endogenous growth. Journal of Health
Economics, 20(2), 169-185
Van Zon, A., & Muysken, J., 2005. Health as a principal determinant of economic growth. in
G. López-Casasnovas, B. Rivera, & L. Currais, ed. Health and Economic Growth.
Findings and Policy Implications. Cambridge MA: MIT Press, p. 41–63.
Weil, D., 2007. Accounting for the Effect of Health on Economic Growth. The Quaterly
Journal of Economics, vol. 122, N°3, 1265- 1306.
World Bank. World development report, 1993. Investing in health. New York, Oxford
University Press for the World Bank.
World Health Organization (WHO), 2008. The Global Burden of Disease, 2004 update.
Geneva, Switzerland: World Health Organization
CERDI, Etudes et Documents, E 2012.12
25
6. Appendix A: Tables
Table A1: Variables characteristics and sources
mean min max
Coef of
Var. Std error Source
GDP. growth 0,04 -0,06 0,13 0,65 0,03 WDI
Corrected DALYs 0,27 0,10 0,83 0,65 0,17 WHO
DALY 2002-2004 0,27 0,10 0,89 0,66 0,18 WHO
DALY in 2002 0,28 0,10 0,95 0,68 0,19 WHO
DALY in 2004 0,26 0,10 0,82 0,64 0,17 WHO
Communicable DALY 0,13 0,004 0,64 1,30 0,17 WHO
Infectious DALY 0,08 0,001 0,56 1,47 0,12 WHO
Malaria DALY 0,01 0,00 0,09 1,95 0,02 WHO
Malaria Ecology 3,86 0,00 31,55 1,77 6,85 Sachs 2003
Malaria Risk 0,37 0,00 1,00 1,18 0,44 Sachs 2003
Investment ratio to GDP 0,21 0,08 0,57 0,33 0,07 WDI
Population growth rate 1,38 -1,10 7,07 0,86 1,20 WDI
Government
consumption 0,16 0,05 0,53 0,40 0,07 WDI
Openness 0,86 0,22 2,68 0,48 0,42 WDI
Inflation rate 0,10 -0,01 2,03 2,36 0,23 WDI
School enrollment 100,77 36,53 144,52 0,17 16,75 WDI
rule of law -0,05 -1,90 2,01 -19,93 0,96
Kaufmann
Kraay
Table A2: Correlation between the main variables
GDP
Growth
Corrected
DALYs
DALY
2002-2004
DALY in
2002
DALY in
2004
Communicable
DALY
Infectious
DALY
Corrected DALYs 0,005 1,00
DALY 2002-2004 0,03 0,99* 1,00
DALY in 2002 0,03 0,97* 0,99* 1,00
DALY in 2004 0,03 1,00* 0,99* 0,97* 1,00
Commun. DALY -0,02 0,99* 0,98* 0,97* 0,98* 1,00
Infectious DALY -0,08 0,95* 0,96* 0,95* 0,94* 0,97* 1,00
Malaria DALY 0,03 0,84* 0,83* 0,80* 0,84* 0,84* 0,78*

CERDI, Etudes et Documents, E 2012.12
26
Table A3: OLS estimation of the economic effects of health status
Dependent variable: GDP per capita growth
Independent. variables (1) (2) (3) (4) (5) (6) (7)
DALY in 2002 -0.013
(0.49)
DALY in 2004 -0.019
(0.60)
DALY 02-04 -0.016
(0.54)
Corrected DALYs -0.023
(0.81)
Communicable DALY -0.034
(1.20)
Infectious DALY -0.044
(1.43)
Malaria DALY -0.183
(1.62)
Log initial GDP per capita -0.004 -0.004 -0.004 -0.005* -0.005
** -0.005
* -0.005
*
(1.55) (1.57) (1.56) (1.72) (1.99) (1.98) (1.85)
Investment ratio to GDP 0.119***
0.116***
0.118***
0.115***
0.114***
0.117***
0.116***
(3.71) (3.64) (3.69) (3.61) (3.59) (3.62) (3.54)
Population growth rate 0.005* 0.005
** 0.005
** 0.005
** 0.006
** 0.005
* 0.006
**
(1.96) (2.02) (1.99) (2.01) (2.16) (1.93) (2.36)
Government consumption -0.088***
-0.089***
-0.089***
-0.089***
-0.091***
-0.091***
-0.100***
(2.84) (2.81) (2.82) (2.81) (2.80) (2.86) (2.97)
Openness 0.004 0.004 0.004 0.004 0.004 0.004 0.003
(1.26) (1.19) (1.23) (1.17) (1.07) (1.14) (0.93)
Inflation rate -0.025**
-0.025**
-0.025**
-0.024**
-0.023**
-0.021**
-0.026**
(2.46) (2.40) (2.43) (2.36) (2.36) (2.34) (2.31)
School enrolment lag -0.000 -0.000 -0.000 -0.000 -0.000 -0.000 -0.000
(0.28) (0.34) (0.31) (0.40) (0.45) (0.28) (0.62)
Institutions -0.004 -0.004 -0.004 -0.004 -0.004 -0.004 -0.004
(1.19) (1.21) (1.19) (1.18) (1.02) (1.05) (0.98)
Constant 0.051* 0.055
* 0.053
* 0.060
** 0.064
*** 0.058
*** 0.060
***
(1.76) (1.82) (1.77) (2.10) (2.65) (2.83) (2.62)
Regional dummies yes yes yes yes yes yes yes
Observations 153 153 153 153 153 153 153
R² 0.378 0.380 0.379 0.382 0.389 0.391 0.388
Note: ***significant at 1%, **significant at 5%, *significant at 10%. Robust t-statistics in parentheses.

CERDI, Etudes et Documents, E 2012.12
27
Table A4: first stage estimation results (whole sample) ++ (1) (2) (3) (4) (5) (6) (7)
DALY
2002
DALY
2004
DALY
02-04
Corr.
DALY
Comm.
DALY
Infect.
DALY
Mal.
DALY
Malaria Ecology 0.006**
0.006**
0.006**
0.005* 0.004 0.003
* 0.002
***
(2.16) (2.43) (2.36) (1.97) (1.64) (1.77) (5.54)
Malaria Risk 0.084* 0.087
** 0.085
** 0.102
** 0.104
*** 0.075
** 0.015
***
(1.82) (2.44) (2.13) (2.56) (2.76) (2.33) (2.96)
Regional dummies yes yes yes yes yes yes yes
Observations 138 138 138 138 138 138 138
Fisher F-Stat. 6.81 13.72 9.75 11.98 10.92 8.86 54.80
Shea partial R² 0.14 0.23 0.19 0.20 0.19 0.15 0.48
Hansen OID p-val. 0.46 0.48 0.47 0.62 0.76 0.70 0.27
Note: ***significant at 1%; **significant at 5%; *significant at 10%. t-statistics in parentheses.
++ We show only the coefficients of the instruments, but all the exogenous variables are included in the regressions
Table A5: first stage estimation results (Developing countries) ++
(3) (4) (2) (1) (5) (6) (7)
DALY
2002
DALY
2004
DALY 02-
04
Corr.
DALY
Comm.
DALY
Infect.
DALY
Mal.
DALY
Malaria Ecology 0.006** 0.006** 0.006** 0.005** 0.004* 0.004* 0.002***
(2.40) (2.61) (2.58) (2.11) (1.75) (1.95) (5.36)
Malaria Risk 0.123** 0.110*** 0.117*** 0.128*** 0.125*** 0.104*** 0.015**
(2.44) (2.97) (2.72) (3.14) (3.08) (2.90) (2.50)
Regional dummies yes yes yes yes yes yes yes
Observations 103 103 103 103 103 103 103
Fisher F-Stat. 7.74 13.36 10.17 11.78 10.09 9.72 48.17
Shea partial R² 0.19 0.26 0.23 0.24 0.21 0.20 0.48
Hansen OID p-
val.
0.69 0.67 0.68 0.79 0.87 0.86 0.38
Note: ***significant at 1%; **significant at 5%; *significant at 10%. t-statistics in parentheses.
++ We show only the coefficients of the instruments, but all the exogenous variables are included in the regressions

CERDI, Etudes et Documents, E 2012.12
28
Table A6: List of countries
Low-income Lower-middle-income Upper-middle-income High-income
Benin Albania Argentina Bahrain
Burkina Faso Algeria Belarus Estonia
Burundi Armenia Belize Israel
Cambodia Azerbaijan Botswana Kuwait
Central African Republic Bhutan Brazil Malta
Chad Bolivia Bulgaria Oman
Comoros Cameroon Chile Slovenia
Congo, Dem. Rep. Cape Verde Costa Rica Trinidad and Tobago
Cote d'Ivoire China Croatia United Arab Emirates
Eritrea Colombia Dominica Australia
Ethiopia Congo, Rep. Fiji Austria
Gambia, The Djibouti Gabon Belgium
Ghana Dominican Republic Grenada Canada
Guinea Ecuador Jamaica Czech Republic
Guinea-Bissau Egypt, Arab Rep. Kazakhstan Denmark
Kenya El Salvador Latvia Finland
Kyrgyz Republic Georgia Libya France
Liberia Guatemala Lithuania Germany
Madagascar Guyana Malaysia Greece
Malawi Honduras Mauritius Hungary
Mali India Mexico Iceland
Mauritania Indonesia Panama Ireland
Mozambique Iran, Islamic Rep. Poland Italy
Nepal Jordan Romania Japan
Niger Lesotho Russian Federation Korea, Rep.
Nigeria Macedonia, FYR Seychelles Luxembourg
Pakistan Maldives South Africa Netherlands
Rwanda Moldova St. Kitts and Nevis New Zealand
Sao Tome and Principe Mongolia St. Lucia Norway
Senegal Morocco St. Vincent and the Grenadines Portugal
Sierra Leone Namibia Suriname Slovak Republic
Tajikistan Nicaragua Turkey Spain
Tanzania Paraguay Uruguay Sweden
Togo Peru Venezuela, RB Switzerland
Uganda Philippines United Kingdom
Uzbekistan Sri Lanka United States
Vietnam Sudan
Yemen, Rep. Swaziland
Zambia Syrian Arab Republic
Zimbabwe Thailand
Tonga
Tunisia
Ukraine

CERDI, Etudes et Documents, E 2012.12
29
Table A7: Literature review on the effect of health on economic growth
Study Health
indicator
Coefficient
(standard error) data Estimator Other covariates
Barro and Lee
(1994)
Life
expectancy 0.073 (0.013)
Two periods
n=85 for
1965–75,
n=95 for
1975–85
SUR with country random
effects
Male and female secondary
schooling, I/GDP, G/GDP,
log(1+black market premium),
revolutions
Cuddington
and Hancock
(1994)
AIDS
0.2- 0.3%
points lost in
the medium
case and 1.2-
1.5 in the
lower case
Each five year
age cohort
from 1985-
2010 in
Malawi
simulation Na
Barro and
Sala IMartin
(1995)
Life
expectancy 0.058 (0.013)
Two periods
n=87 for
1965–75,
n=97 for
1975–85
SUR with country random
effects
Male and female secondary and
higher education, log(GDP) · human
capital, public spending on
education/ GDP, investment/GDP,
government consumption/GDP,
log(1+black market premium),
political instability, growth rate in
terms of trade
Barro (1996) Life
expectancy 0.042 (0.014)
Three periods
1965–75,
n=80; 1975–
85, n=87;
1985–90,
N=84
3SLS using lagged values
of some regressions as
instruments, period random
effects
Male secondary and higher
schooling, log(GDP) · male
schooling, log fertility rate,
government consumption ratio, rule
of law index, terms of trade change,
democracy index, demo- cracy
index squared, inflation rate,
continental dummies
Caselli,
Esquivel, and
Lefort (1996)
Life
expectancy -0.001 (0.032)
25-year panel
at 5-year
intervals,
1960–85,
n=91
GMM (Arellano- Bond
method)
Male and female schooling, I/GDP,
G/GDP, black market premium,
revolutions
Sachs and
Warner
(1997)
Life
expectancy 45.48 (2.60)
25-year cross-
section, N=79 OLS
Openness, openness xlog(GDP),
land-locked, government saving,
tropical climate, institutional
quality, natural resource exports,
growth in economically active
population minus population growth life
expectancy
squared
-5.40 (2.41)

CERDI, Etudes et Documents, E 2012.12
30
Study Health
indicator
Coefficient
(standard error) data Estimator Other covariates
Bloom and
Sachs (1998)
Life
expectancy 0.037 (0.011)
25-year cross-
section, 1965–
90, n=65
OLS
Log secondary schooling, openness,
institutional quality, central
government deficit, percentage area
in tropics, log coastal population
density, log inland population
density, total population growth
rate, working- age population
growth rate, Africa dummy
Bloom and
Malaney
(1998)
Life
expectancy 0.027 (0.107)
25-year cross-
section, 1965–
90, n=77
OLS
Population growth, growth of
economically active populations,
log years of secondary schooling,
natural resource abundance,
openness, institutional quality,
access to ports, average government
savings, tropics, ratio of coastline
distance to land area
Bloom and
Williamson
(1998)
Life
expectancy 0.040 (0.010)
25-year cross-
section, 1965–
90, n=78
OLS
Population growth rate, working-
age population growth rate, log
years of secondary schooling,
natural resource abundance,
openness, institutional quality,
access to port, average government
savings rate, tropics dummy, ratio of
coastline to land area
Gallup,
Sachs. and
Mellinger
(1999)
life
expectancy 2.4 (1.34)
25-year cross-
section, 1965–
90, n=75
2SLS with malaria index
instrument by temperate
(temperate, boreal, and
polar eco-zones), desert
(tropical and subtropical
deserts), subtropical (non
desert subtropical), and
tropical (non desert
tropical)
Years of secondary schooling,
openness, quality of public
institutions, population within 100
kilometers of the coast, malaria
index in 1966, change in malaria
index from 1966 to 1994 Malaria index
1966 -2.6 (0.67)
Hamoudi and
Sachs (1999)
Life
expectancy 0.072 (0.020) 15-year cross-
section, 1980–
95, n=78
OLS
Institutional quality, openness, net
government savings, tropics land
area, log coastal population density,
population growth rate, working-age
population growth rate, Africa
dummy Infant
mortality rate
-0.0002
(0.00008)
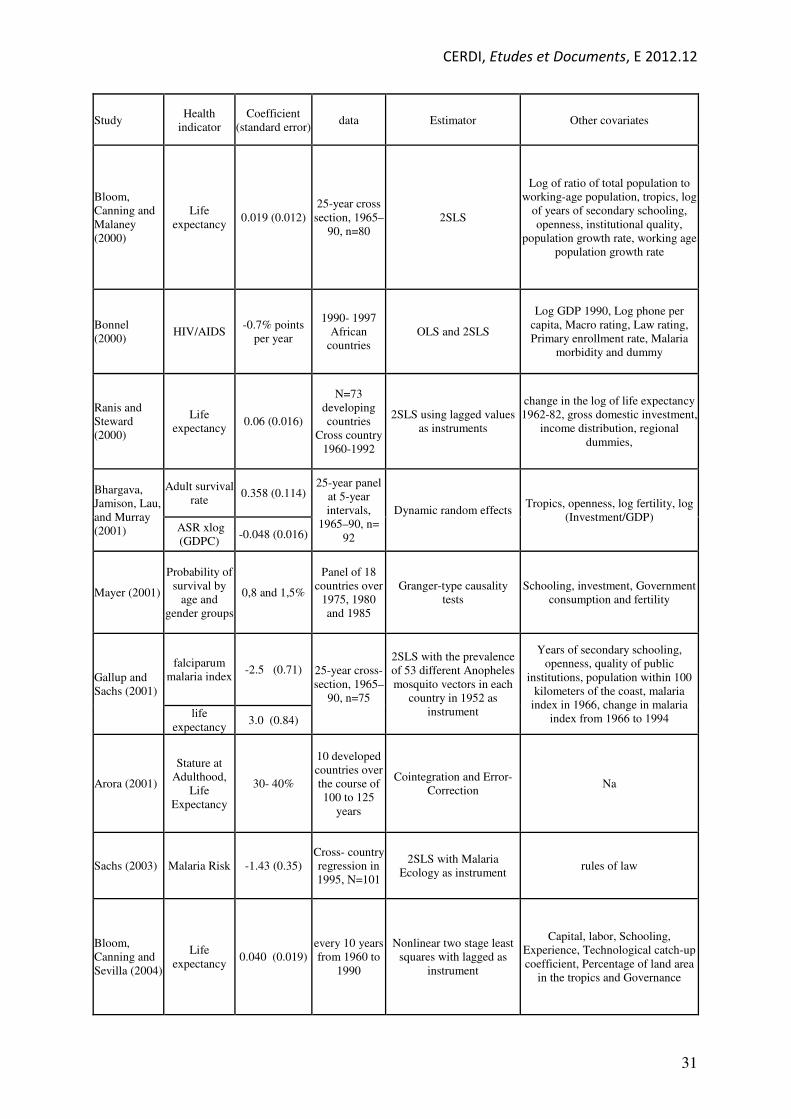
CERDI, Etudes et Documents, E 2012.12
31
Study Health
indicator
Coefficient
(standard error) data Estimator Other covariates
Bloom,
Canning and
Malaney
(2000)
Life
expectancy 0.019 (0.012)
25-year cross
section, 1965–
90, n=80
2SLS
Log of ratio of total population to
working-age population, tropics, log
of years of secondary schooling,
openness, institutional quality,
population growth rate, working age
population growth rate
Bonnel
(2000) HIV/AIDS
-0.7% points
per year
1990- 1997
African
countries
OLS and 2SLS
Log GDP 1990, Log phone per
capita, Macro rating, Law rating,
Primary enrollment rate, Malaria
morbidity and dummy
Ranis and
Steward
(2000)
Life
expectancy 0.06 (0.016)
N=73
developing
countries
Cross country
1960-1992
2SLS using lagged values
as instruments
change in the log of life expectancy
1962-82, gross domestic investment,
income distribution, regional
dummies,
Bhargava,
Jamison, Lau,
and Murray
(2001)
Adult survival
rate 0.358 (0.114)
25-year panel
at 5-year
intervals,
1965–90, n=
92
Dynamic random effects Tropics, openness, log fertility, log
(Investment/GDP) ASR xlog
(GDPC) -0.048 (0.016)
Mayer (2001)
Probability of
survival by
age and
gender groups
0,8 and 1,5%
Panel of 18
countries over
1975, 1980
and 1985
Granger-type causality
tests
Schooling, investment, Government
consumption and fertility
Gallup and
Sachs (2001)
falciparum
malaria index -2.5 (0.71) 25-year cross-
section, 1965–
90, n=75
2SLS with the prevalence
of 53 different Anopheles
mosquito vectors in each
country in 1952 as
instrument
Years of secondary schooling,
openness, quality of public
institutions, population within 100
kilometers of the coast, malaria
index in 1966, change in malaria
index from 1966 to 1994 life
expectancy 3.0 (0.84)
Arora (2001)
Stature at
Adulthood,
Life
Expectancy
30- 40%
10 developed
countries over
the course of
100 to 125
years
Cointegration and Error-
Correction Na
Sachs (2003) Malaria Risk -1.43 (0.35)
Cross- country
regression in
1995, N=101
2SLS with Malaria
Ecology as instrument rules of law
Bloom,
Canning and
Sevilla (2004)
Life
expectancy 0.040 (0.019)
every 10 years
from 1960 to
1990
Nonlinear two stage least
squares with lagged as
instrument
Capital, labor, Schooling,
Experience, Technological catch-up
coefficient, Percentage of land area
in the tropics and Governance
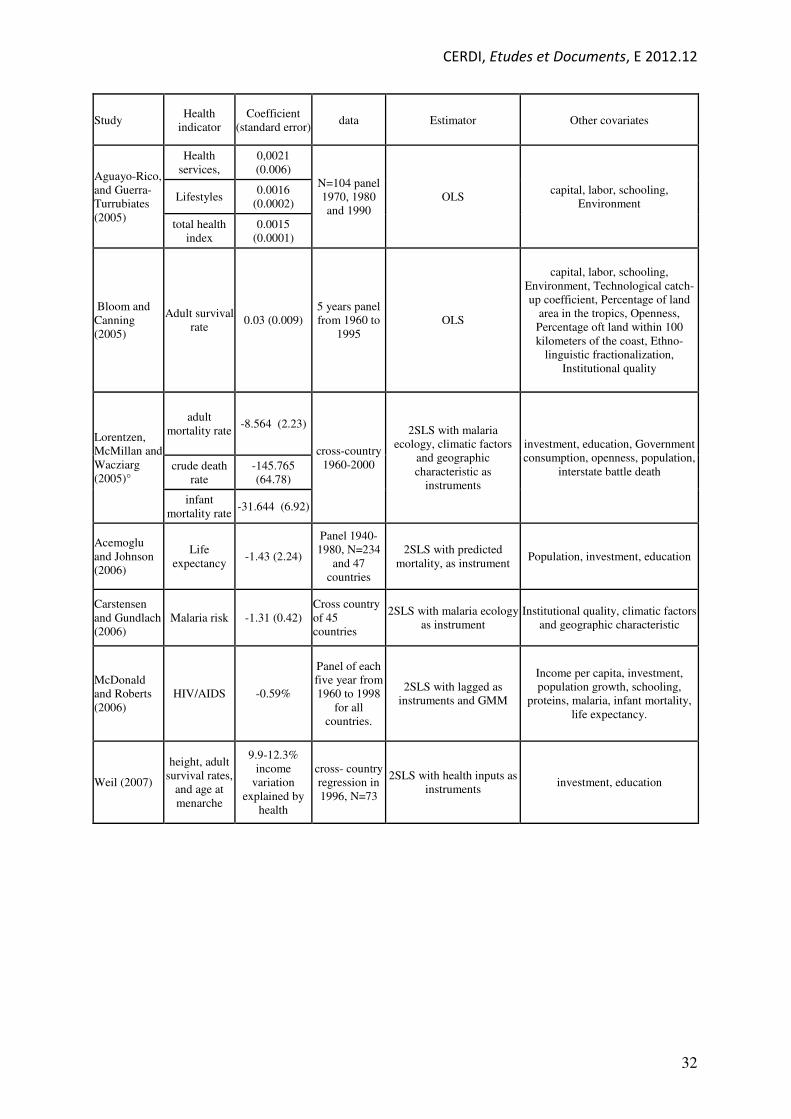
CERDI, Etudes et Documents, E 2012.12
32
Study Health
indicator
Coefficient
(standard error) data Estimator Other covariates
Aguayo-Rico,
and Guerra-
Turrubiates
(2005)
Health
services,
0,0021
(0.006)
N=104 panel
1970, 1980
and 1990
OLS capital, labor, schooling,
Environment Lifestyles
0.0016
(0.0002)
total health
index
0.0015
(0.0001)
Bloom and
Canning
(2005)
Adult survival
rate 0.03 (0.009)
5 years panel
from 1960 to
1995
OLS
capital, labor, schooling,
Environment, Technological catch-
up coefficient, Percentage of land
area in the tropics, Openness,
Percentage oft land within 100
kilometers of the coast, Ethno-
linguistic fractionalization,
Institutional quality
Lorentzen,
McMillan and
Wacziarg
(2005)°
adult
mortality rate -8.564 (2.23)
cross-country
1960-2000
2SLS with malaria
ecology, climatic factors
and geographic
characteristic as
instruments
investment, education, Government
consumption, openness, population,
interstate battle death crude death
rate
-145.765
(64.78)
infant
mortality rate -31.644 (6.92)
Acemoglu
and Johnson
(2006)
Life
expectancy -1.43 (2.24)
Panel 1940-
1980, N=234
and 47
countries
2SLS with predicted
mortality, as instrument Population, investment, education
Carstensen
and Gundlach
(2006)
Malaria risk -1.31 (0.42)
Cross country
of 45
countries
2SLS with malaria ecology
as instrument
Institutional quality, climatic factors
and geographic characteristic
McDonald
and Roberts
(2006)
HIV/AIDS -0.59%
Panel of each
five year from
1960 to 1998
for all
countries.
2SLS with lagged as
instruments and GMM
Income per capita, investment,
population growth, schooling,
proteins, malaria, infant mortality,
life expectancy.
Weil (2007)
height, adult
survival rates,
and age at
menarche
9.9-12.3%
income
variation
explained by
health
cross- country
regression in
1996, N=73
2SLS with health inputs as
instruments investment, education

CERDI, Etudes et Documents, E 2012.12
33
7. Appendix B: Figures
Figure 1B: Relationship between Corrected DALY, traditional health indicators and GDP per capita.
Source: Authors’ construction with data from World Bank and WHO.
Figure 2B: Relationship between Communicable Corrected DALY, traditional health indicators and GDP per
capita.
Source: Authors’ construction with data from World Bank and WHO.
30
40
50
60
70
80
0 .2 .4 .6 .8Corrected DALY
95% CI Fitted values
Life Expectancy
050
100
150
0 .2 .4 .6 .8Corrected DALY
95% CI Fitted values
Infant Mortality Rate
0100
200
300
0 .2 .4 .6 .8Corrected DALY
95% CI Fitted values
Under 5 Mortality Rate
-20000
0200004000060000
0 .2 .4 .6 .8Corrected DALY
95% CI Fitted values
GDP per Capita
30
40
50
60
70
80
0 .2 .4 .6Communicable Corrected Daly
95% CI Fitted values
Life expectancy
050
100
150
0 .2 .4 .6Communicable Corrected Daly
95% CI Fitted values
Infant Mortality Rate
0100
200
300
0 .2 .4 .6Communicable Corrected Daly
95% CI Fitted values
Under 5 Mortality Rate
-20000
0200004000060000
0 .2 .4 .6Communicable Corrected Daly
95% CI Fitted values
GDP per capita

CERDI, Etudes et Documents, E 2012.12
34
Figure 3B: Relationship between Non Communicable Corrected DALY, traditional health indicators and GDP
per capita.
Source: Author’s construction with data from World Bank and WHO.
Figure 4B: Relationship between Malaria Corrected DALY, traditional health indicators and GDP per capita.
Source: Authors’ construction with data from World Bank and WHO.
40
50
60
70
80
.08 .1 .12 .14 .16 .18Non Communicable Corrected Daly
95% CI Fitted values
Life Expectancy
050
100
150
.08 .1 .12 .14 .16 .18Non Communicable Corrected Daly
95% CI Fitted values
Infant Mortality Rate
-100
0100
200
300
.08 .1 .12 .14 .16 .18Non Communicable Corrected Daly
95% CI Fitted values
Under 5 Mortality Rate
010000
20000
30000
40000
50000
.08 .1 .12 .14 .16 .18Non Communicable Corrected Daly
95% CI Fitted values
GDP per Capita
40
50
60
70
80
0 .02 .04 .06 .08 .1Malaria Corrected Daly
95% CI Fitted values
Life Expectancy
050
100
150
0 .02 .04 .06 .08 .1Malaria Corrected Daly
95% CI Fitted values
Infant Mortality Rate
0100
200
300
0 .02 .04 .06 .08 .1Malaria Corrected Daly
95% CI Fitted values
Under 5 Mortality Rate
-20000
0200004000060000
0 .02 .04 .06 .08 .1Malaria Corrected Daly
95% CI Fitted values
GDP per Capita