disease burden of non alcoholic fatty liver disease (nafld) disease burden by... · disease burden...
TRANSCRIPT
Disease Burden of Non Alcoholic Fatty Liver Disease
(NAFLD)
Dr. H. Razavi
May 31, 2017
First European NASH – NAFLD Summit
2
Disclosure:
This work with funded by a multi-sponsored research grant from Intercept,
Gilead and Boehringer Ingelheim. The funders had no influence over the
design, the implementation, or the outcomes of the study.
H. Razavi has not received any personal remuneration for this or any other
project.

3
This work would not be possible without the inputs of the following
experts
• France – Drs. Vlad Ratziu & Lawrence Serfaty
• Germany – Drs. Andreas Geier, Michael Manns, Christian Trautwein &
Stefan Zeuzem
• Italy – Drs. Stefano Bellentani, Antonio Craxi, Giulio Marchesini &
Salvatore Petta
• Spain – Drs. Maria Arias-Loste, Joan Caballeria, Javier Crespo &
Manuel Romero Gomez
• United Kingdom – Drs. Quentin Anstee, Christopher Day, Jude Oben &
Philip Newsome

4
Methodology
• Convened a panel of NAFLD experts in each country
• Collect published epidemiology data for NAFLD
• Gathered country specific rates for obesity and diabetes to estimate incidence
• Used published work to estimate progression rates for non-alcoholic fatty liver
(NAFL) and nonalcoholic steatohepatitis (NASH)
• Modeled the disease progression
• Validates the forecasts against reported NASH related HCC cases

5
The disease progression model tracked the population over time,
taking into consideration the reversible nature of the disease
Compensated
Cirrhosis (F4)
– NASH
Decompensated
Cirrhosis –
NASH
Hepatocellular
Carcinoma
Liver
Transplantation
F0 –
NAFL/NASH
F3 –
NASH
Liver Related
Death
F1 –
NASH
F2 –
NASH
New (Incident)
Cases
Incidence of Adult
Obesity / Diabetes
Used to Calibrate the model
• % of population with NAFLD
• % of NASH with F3/F4
• Incident HCC due to NASH
The outputs of the model were
compared against empirical data
at multiple stages

6
NASH prevalence and obesity in the EU5 are lower than the US
BMI≥30
% of total
population ≥15+
with NAFLD
% of NAFLD with
NASH
% of total
population ≥15+
with NASH
US 28% 30% 20% 6.3%
France 16% 25% 16% 4.2%
Germany 19% 25% 18% 4.6%
Italy 16% 28% 17% 4.9%
Spain 18% 25% 17% 4.4%
UK 21% 25% 18% 4.8%
China 4% 20% 13% 2.8%
Japan 4% 20% 16% 3.4%

7
Obesity has been increasing in the European countries
NAFLD is accounting for more HCC cases in the UK
Adult obesity have been
increasing but the rate of increase
has (and is projected to) slowed.
0%
5%
10%
15%
20%
25%
30%
1980 1990 2000 2010 2020 2030
Adult Obesity Rate
UK Germany Spain France Italy
UK – The proportion of HCC
attributable to NAFLD in
Newcastle was 34.8% in 2010, a
tenfold increase as compared to
2000 (Dyson 2014)
Dyson J, Jaques B, Chattopadyhay D, Lochan R, Graham J, Das D, et al. Hepatocellular cancer: the impact of obesity, type 2 diabetes and
a multidisciplinary team. J Hepatol. 2014;60(1):110-7.

8
Most individuals will remain as NAFL but the NASH population is
expected to grow by 45% while cirrhotic cases will increase by 120%
NASH NAFL
72.3 62.7
4.5
2.5 1.6 0.9
0.0
10.0
20.0
30.0
40.0
50.0
60.0
70.0
80.0
90.0
Total F0 F1 F2 F3 F4
Mil
lio
ns
EU5, 2016
84.0 69.0
6.0
4.0
3.0 2.0
0.0
10.0
20.0
30.0
40.0
50.0
60.0
70.0
80.0
90.0
Total F0 F1 F2 F3 F4
Mil
lio
ns
EU5, 2030

9
Although the increase in total NAFLD cases is slowing down, NASH,
HCC, and liver related deaths is projected to continue to increase
0
10,000,000
20,000,000
30,000,000
40,000,000
50,000,000
60,000,000
70,000,000
80,000,000
90,000,000
1950 1960 1970 1980 1990 2000 2010 2020 2030
NAFLD & NASH Cases - EU5
NAFLD Cases NASH Cases
0
2,000,000
4,000,000
6,000,000
8,000,000
10,000,000
12,000,000
14,000,000
16,000,000
18,000,000
20,000,000
1950 1960 1970 1980 1990 2000 2010 2020 2030
NASH Cases - EU5
NASH Cases
0
1,000
2,000
3,000
4,000
5,000
6,000
7,000
8,000
9,000
1950 1960 1970 1980 1990 2000 2010 2020 2030
Annual HCC Incidence - EU5
HCC Incidence
0
5,000
10,000
15,000
20,000
25,000
30,000
35,000
40,000
45,000
50,000
1950 1960 1970 1980 1990 2000 2010 2020 2030
Annual Liver Related Deaths - EU5
NAFLD
10
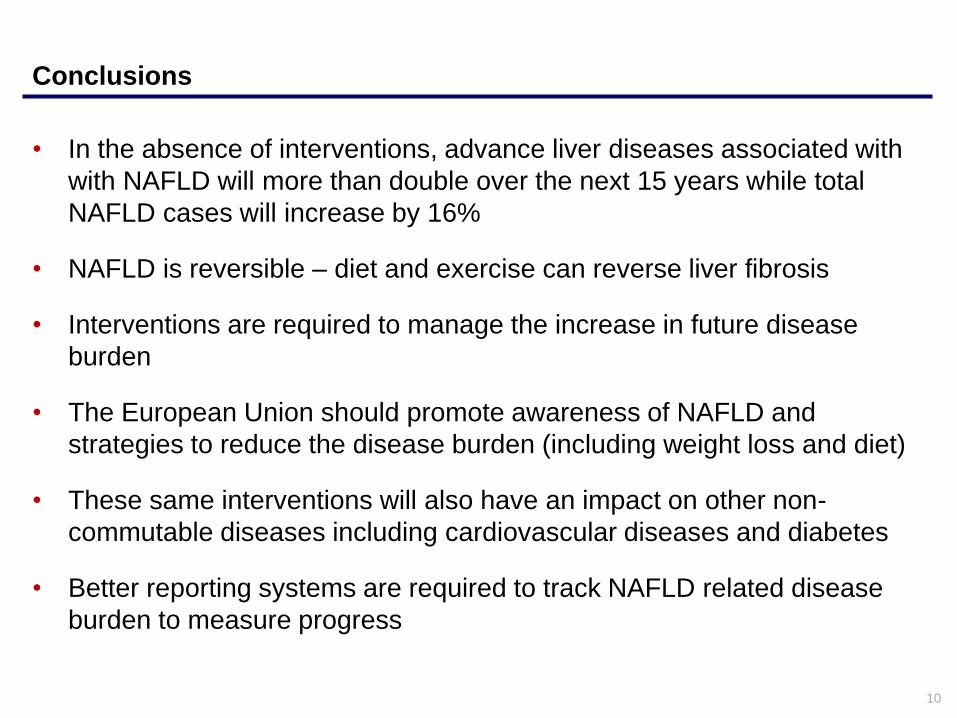
Conclusions
• In the absence of interventions, advance liver diseases associated with
with NAFLD will more than double over the next 15 years while total
NAFLD cases will increase by 16%
• NAFLD is reversible – diet and exercise can reverse liver fibrosis
• Interventions are required to manage the increase in future disease
burden
• The European Union should promote awareness of NAFLD and
strategies to reduce the disease burden (including weight loss and diet)
• These same interventions will also have an impact on other non-
commutable diseases including cardiovascular diseases and diabetes
• Better reporting systems are required to track NAFLD related disease
burden to measure progress

21
US Model Transition Rates
• Model fibrosis progression as compared to Younossi 2016 and Singh 2015
2.2%
13.3% 13.3%
9.9%
0.7%
4.2% 4.2%5.1%
6%
-3%
12%
-23%
4% 4%
10%
5%
13%
10%
7%
15%14%
8%
-25.0%
-20.0%
-15.0%
-10.0%
-5.0%
0.0%
5.0%
10.0%
15.0%
20.0%
Annual Fibrosis Progression Rates
Model Max
Model Min
Younossi 2016
Singh 2015
- Singh, S., et al., Fibrosis progression in nonalcoholic fatty liver vs nonalcoholic steatohepatitis: a systematic review and meta-analysis of
paired-biopsy studies. Clin Gastroenterol Hepatol, 2015. 13(4): p. 643-54.e1-9.
- Younossi ZM, Koenig AB, Abdelatif D, Fazel Y, Henry L, Wymer M. Global Epidemiology of Non-Alcoholic Fatty Liver Disease-Meta-
Analytic Assessment of Prevalence, Incidence and Outcomes. Hepatology. 2016. Available at:
http://www.ncbi.nlm.nih.gov/pubmed/26707365

22
US Model Transition Rates
• Model liver related mortality as compared to Younossi 2016
0.03%
0.17%
0.05%
1.18%
0.07%0.04%
0.54%
1.32%
0.03% 0.06%0.03%
0.22%
1.07%
0.04%
0.29%
0.00%
0.20%
0.40%
0.60%
0.80%
1.00%
1.20%
1.40%
Annual Liver Related Mortality Rates
Model
Younossi 2016
- Younossi ZM, Koenig AB, Abdelatif D, Fazel Y, Henry L, Wymer M. Global Epidemiology of Non-Alcoholic Fatty Liver Disease-Meta-
Analytic Assessment of Prevalence, Incidence and Outcomes. Hepatology. 2016. Available at:
http://www.ncbi.nlm.nih.gov/pubmed/26707365
23
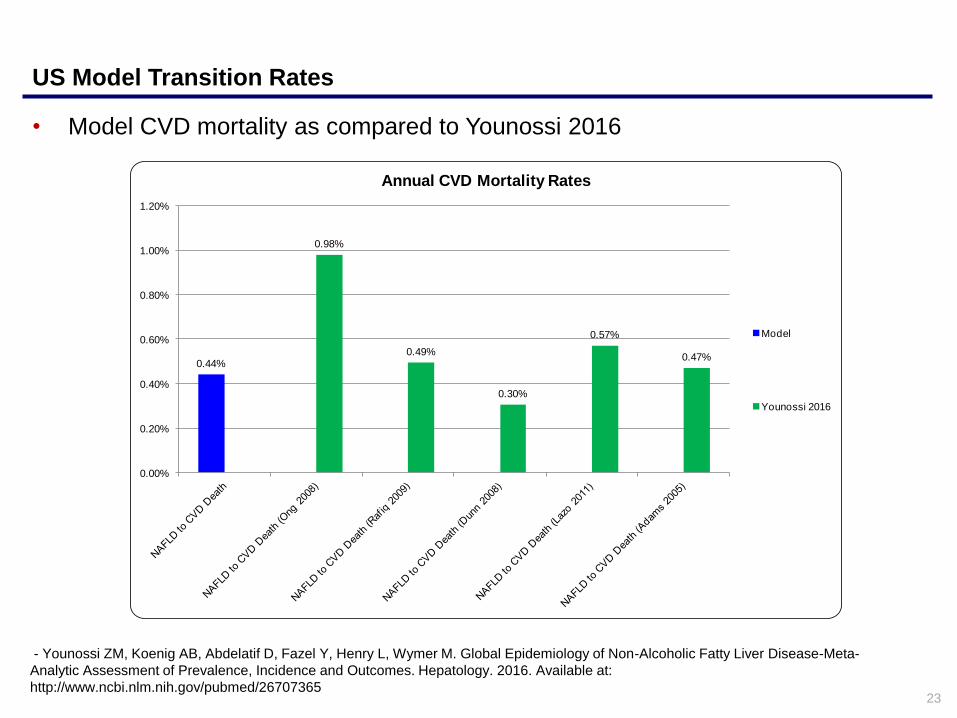
US Model Transition Rates
0.44%
0.98%
0.49%
0.30%
0.57%
0.47%
0.00%
0.20%
0.40%
0.60%
0.80%
1.00%
1.20%
Annual CVD Mortality Rates
Model
Younossi 2016
• Model CVD mortality as compared to Younossi 2016
- Younossi ZM, Koenig AB, Abdelatif D, Fazel Y, Henry L, Wymer M. Global Epidemiology of Non-Alcoholic Fatty Liver Disease-Meta-
Analytic Assessment of Prevalence, Incidence and Outcomes. Hepatology. 2016. Available at:
http://www.ncbi.nlm.nih.gov/pubmed/26707365
24
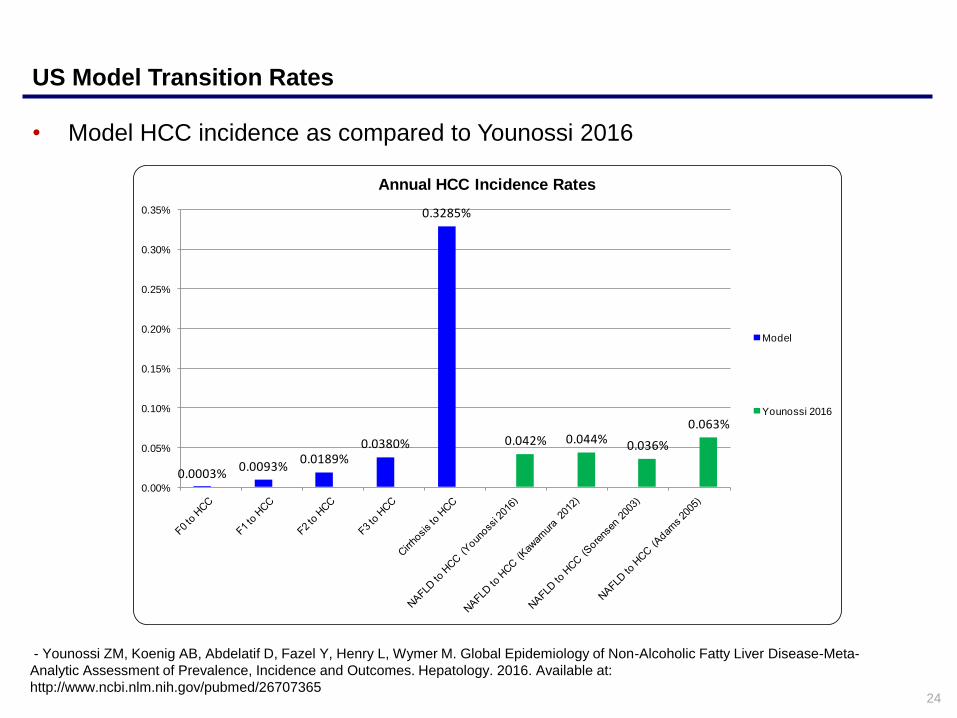
US Model Transition Rates
• Model HCC incidence as compared to Younossi 2016
0.0003%0.0093%
0.0189%0.0380%
0.3285%
0.042% 0.044% 0.036%
0.063%
0.00%
0.05%
0.10%
0.15%
0.20%
0.25%
0.30%
0.35%
Annual HCC Incidence Rates
Model
Younossi 2016
- Younossi ZM, Koenig AB, Abdelatif D, Fazel Y, Henry L, Wymer M. Global Epidemiology of Non-Alcoholic Fatty Liver Disease-Meta-
Analytic Assessment of Prevalence, Incidence and Outcomes. Hepatology. 2016. Available at:
http://www.ncbi.nlm.nih.gov/pubmed/26707365

25
US Model Transition Rates
• Other transition rates used in model:
3.8%
61.0%
16.2%
0.0%
10.0%
20.0%
30.0%
40.0%
50.0%
60.0%
70.0%
Miscellaneous Model Transition Rates
Model
- Sanyal AJ, Banas C, Sargeant C, Luketic VA, Sterling RK, Stravitz RT, et al. Similarities and differences in outcomes of cirrhosis due to
nonalcoholic steatohepatitis and hepatitis C. Hepatology. 2006;43(4):682-9. Available at: http://www.ncbi.nlm.nih.gov/pubmed/16502396
- Younossi ZM, Otgonsuren M, Henry L, Venkatesan C, Mishra A, Erario M, et al. Association of nonalcoholic fatty liver disease (NAFLD)
with hepatocellular carcinoma (HCC) in the United States from 2004 to 2009. Hepatology. 2015;62(6):1723-30. Available at:
http://www.ncbi.nlm.nih.gov/pubmed/26274335
- Ries LAG, Young GL, Keel GE, Eisner MP, Lin YD, Horner M-J. SEER survival monograph: cancer survival among adults: U.S. SEER
program, 1988-2001,patient and tumor characteristics. [NIH Pub.No.07-6215]. 2007. Bethesda, MD, National Cancer Institute, SEER
Program.