global biodiversity monitoring: from data sources to ... · short communication global biodiversity...
TRANSCRIPT
Biological Conservation xxx (2016) xxx–xxx
BIOC-06881; No of Pages 8
Contents lists available at ScienceDirect
Biological Conservation
j ourna l homepage: www.e lsev ie r .com/ locate /b ioc
Short Communication
Global biodiversity monitoring: From data sources to Essential Biodiversity Variables
Vânia Proença a,⁎, Laura Jane Martin b, Henrique Miguel Pereira c,d,e, Miguel Fernandez c,f, Louise McRae g,Jayne Belnap h, Monika Böhm g, Neil Brummitt i, Jaime García-Moreno j, Richard D. Gregory k,João Pradinho Honrado e,l, Norbert Jürgens m, Michael Opige n, Dirk S. Schmeller o,p,Patrícia Tiago e,q, Chris A.M. van Swaay r
a MARETEC, Instituto Superior Técnico, Universidade de Lisboa, Av. Rovisco Pais 1, 1049-001 Lisboa, Portugalb Harvard University, Center for the Environment, Harvard University, Cambridge, MA 02138, USAc German Centre for Integrative Biodiversity Research (iDiv) Halle-Jena-Leipzig, Deutscher Platz 5e, 04103 Leipzig, Germanyd Institute of Biology, Martin Luther University Halle-Wittenberg, Am Kirchtor 1, 06108 Halle (Saale), Germanye CIBIO/InBIO - Rede de Investigação em Biodiversidade e Biologia Evolutiva, Universidade do Porto, Campus Agrário de Vairão, 4485-601 Vairão, Portugalf Instituto de Ecología, Universidad Mayor de San Andrés, Campus Universitario, Cota-cota, Calle 27, La Paz, Boliviag Institute of Zoology, Zoological Society of London, Regent's Park, London NW1 4RY, UKh U. S. Geological Survey, Southwest Biological Science Center, Moab, UT 84532, USAi Department of Life Sciences, Natural History Museum, Cromwell Road, London SW7 5BD, UKj ESiLi Consulting. Het Haam 16, 6846 KW, Arnhem, The Netherlandsk RSPB Centre for Conservation Science, RSPB, The Lodge, Sandy, Bedfordshire, SG19 2DL, UKl Faculdade de Ciências, Universidade do Porto, Rua do Campo Alegre, FCUP-Edificio FC4 (Biologia), 4169-007 Porto, Portugalm Biodiversity, Evolution and Ecology (BEE), Biocenter Klein Flottbek, University of Hamburg, Ohnhorststrasse 18, 22609 Hamburg, Germanyn Nature Uganda, The East Africa Natural History Society, P. O. Box 27034, Katalima Crescent, Naguru, Kampala, Ugandao Helmholtz Center for Environmental Research, UFZ, Department of Conservation Biology, Permoserstrasse 15, 04318 Leipzig, Germanyp ECOLAB, Université de Toulouse, UPS, INPT, Toulouse, Franceq Centre for Ecology, Evolution and Environmental Changes (CE3C), Faculdade de Ciências, Universidade de Lisboa, 1749-016 Lisbon, Portugalr Dutch Butterfly Conservation, P.O. Box 506, 6700 AMWageningen, Netherlands
⁎ Corresponding author.E-mail addresses: [email protected] (V
(M. Fernandez), [email protected] (L. McRae), [email protected] (J. García-Moreno), [email protected] (M. Opige), ds@die-schm
http://dx.doi.org/10.1016/j.biocon.2016.07.0140006-3207/© 2016 Published by Elsevier Ltd.
Please cite this article as: Proença, V., et al., Gservation (2016), http://dx.doi.org/10.1016/
a b s t r a c t
a r t i c l e i n f oArticle history:Received 26 February 2016Received in revised form 15 June 2016Accepted 11 July 2016Available online xxxx
Essential Biodiversity Variables (EBVs) consolidate information from varied biodiversity observation sources.Here we demonstrate the links between data sources, EBVs and indicators and discuss how different sources ofbiodiversity observations can be harnessed to inform EBVs. We classify sources of primary observations intofour types: extensive and intensive monitoring schemes, ecological field studies and satellite remote sensing.We characterize their geographic, taxonomic and temporal coverage. Ecological field studies and intensivemonitoring schemes inform a wide range of EBVs, but the former tend to deliver short-term data, while thegeographic coverage of the latter is limited. In contrast, extensive monitoring schemes mostly inform the popu-lation abundance EBV, but deliver long-term data across an extensive network of sites. Satellite remote sensing isparticularly suited to providing information on ecosystem function and structure EBVs. Biases behind datasources may affect the representativeness of global biodiversity datasets. To improve them, researchers mustassess data sources and then develop strategies to compensate for identified gaps. We draw on the populationabundance dataset informing the Living Planet Index (LPI) to illustrate the effects of data sources on EBVrepresentativeness. We find that long-term monitoring schemes informing the LPI are still scarce outside ofEurope and North America and that ecological field studies play a key role in covering that gap. Achieving repre-sentative EBV datasets will depend both on the ability to integrate available data, through data harmonizationand modeling efforts, and on the establishment of new monitoring programs to address critical data gaps.
© 2016 Published by Elsevier Ltd.
Keywords:Primary biodiversity observationsBiodiversity monitoring schemesEssential Biodiversity VariablesGEO BONGlobal biodiversity monitoringLiving Planet Index
. Proença), [email protected] (L.J. Martin), [email protected] (H.M. Pereira), [email protected][email protected] (J. Belnap), [email protected] (M. Böhm), [email protected] (N. Brummitt),[email protected] (R.D. Gregory), [email protected] (J.P. Honrado), [email protected] (N. Jürgens),ellers.de (D.S. Schmeller), [email protected] (P. Tiago), [email protected] (C.A.M. van Swaay).
lobal biodiversity monitoring: From data sources to Essential Biodiversity Variables, Biological Con-j.biocon.2016.07.014

2 V. Proença et al. / Biological Conservation xxx (2016) xxx–xxx
1. Introduction
In 2010, the parties of the United Nations Convention on BiologicalDiversity (CBD) adopted the Aichi Targets for 2020, which includegoals such as “reducing the direct pressures on biodiversity” and“improving the status of biodiversity by safeguarding ecosystems,species and genetic diversity.” A mid-term assessment of the AichiTargets (Tittensor et al. 2014) suggested that while actions to counter-act the decline of biodiversity have increased, so too have pressures,and there has been a further deterioration in the state and trends ofbiodiversity. In order to be effective, actions towards the Aichi targetswill have to be supported by updated information on regional andglobal patterns of biodiversity change, on drivers of biodiversity change,and on the effectiveness of conservation policies (Pereira and Cooper,2006; Scholes et al., 2012; Tittensor et al., 2014). However, such dataare either missing or not readily accessible, as reflected by the lackof quantitative data on biodiversity change in two-thirds of the 4thnational reports submitted by Parties to the CBD (Bubb et al., 2011),and this affects the indicators too (Tittensor et al., 2014).
Researchers and conservationmanagers hoping to assess biodiversi-ty change at the regional or global level face a number of obstacles. First,the geographic coverage of extant biodiversity monitoring programsis insufficient and uneven (Pereira et al., 2010, 2012). In particular,biodiversity monitoring efforts and ecological fieldwork are biasedtowards developed countries in temperate regions (McGeoch, et al.2010; Martin et al., 2012; Hudson et al., 2014). Second, monitoringschemes are typically not implemented at regional scales and fewdeliver long-term data, making it difficult to monitor biodiversitychange across space and time (Schmeller, 2008; Hudson et al. 2014;McGeoch et al., 2015; but see Jürgens et al., 2012).
In an effort to optimize biodiversitymonitoring initiatives, theGroupon Earth Observations Biodiversity Observation Network (GEO BON;Scholes et al., 2012) has developed the concept of Essential BiodiversityVariables (EBVs) that could form the basis of efficient and coordinatedmonitoring programs worldwide (Pereira et al., 2013). The EBVconcept was inspired by the Essential Climate Variables that guide
Fig. 1.Data flow fromdifferent data sources of primary biodiversity observations into EBVs, folloof the arrows represents the relative input of each source into EBVs and of EBVs into indicatoindicators, the relative contribution of each source to inform indicators will vary depending on
Please cite this article as: Proença, V., et al., Global biodiversity monitoringservation (2016), http://dx.doi.org/10.1016/j.biocon.2016.07.014
implementation of the Global Climate Observing System by Parties tothe UN Framework Convention on Climate Change. EBVs are statevariables that stand between primary observations (i.e., raw data) andhigh level indicators (e.g., the Living Planet Index (Collen et al.,2009)), and may represent essential aspects of biodiversity (fromgenetic composition to ecosystem functioning) or may be integratedwith other EBVs or with other types of data, such as data on driversand pressures, to deliver high-level indicators (Pereira et al., 2013;GEO BON 2015a). The aim of the EBV framework is to identify a mini-mum set of variables that can be used to inform scientists, managersand the public on global biodiversity change.
In a first attempt to identify a minimum set of EBVs, GEO BONaggregated candidate variables into six classes: “genetic composition,”“species populations,” “species traits,” “community composition,”“ecosystem structure,” and “ecosystem function” (Pereira et al., 2013).Recently, Geijzendorffer et al. (2015) compared the EBV frameworkwith indicators currently used for reporting biodiversity informationby seven biodiversity policy instruments. They found that the currentsuite of biodiversity indicators does not incorporate EBV classes equally.For instance, some EBV classes, like “species populations,” were wellrepresented in current indicators, while others, like “genetic composi-tion,” were not. This asymmetry in EBV coverage is related to biases inindicator selection, and ultimately to biases in extant biodiversitymonitoring data, as indicator selection is often driven by data availabil-ity for reasons of feasibility (Geijzendorffer et al., 2015). Hence, thecurrent set of indicators misses important biodiversity facets, due togaps in primary data. Instead, monitoring efforts should be driven bythe information needs of selected indicators. The EBV frameworkcould become an important tool towards that end, by promoting cost-efficient approaches (Pereira et al. 2013, Fig.1).
This article aims to discuss how primary data sources affect therepresentativeness of current EBV datasets. That is, if available, areprimary data well distributed across spatial and temporal scales ofinterest to provide meaningful measures on biodiversity change? Dodata cover a diverse range of species groups? Previous studies haveidentified the existence of geographic and taxonomic biases in data
wed by EBVs input to build biodiversity indicators used tomonitor Aichi targets. Thewidthrs. Only a few EBVs are shown to illustrate the flow of data from sources to biodiversitythe chosen indicators. LPI – Living Planet Index, RLI – Red List Index.
: From data sources to Essential Biodiversity Variables, Biological Con-

3V. Proença et al. / Biological Conservation xxx (2016) xxx–xxx
availability (e.g., Boakes et al., 2010, Pereira et al., 2010; Martin et al.,2012; Hudson et al., 2014; Velasco et al., 2015). Data asymmetries willbe a barrier to effective policy responses (Pereira et al., 2010;Geijzendorffer et al., 2015). Hence, a first step towards improving globalEBV datasets is to assess the underlying data sources and to identifyexisting biases. Only then will it be possible to develop strategies tocover data gaps and to optimize the use of available data.
Here we demonstrate the links between data sources, EBVs andindicators. We classify the main sources of primary observations of ter-restrial biodiversity as: (1) extensivemonitoring schemes, (2) intensivemonitoring schemes, (3) ecological field studies, and (4) satelliteremote sensing. We define each class and its scope by its geographic,taxonomic, and temporal coverage. We then analyze the datasetinforming the Living Planet Index indicator (LPI; Collen et al., 2009) toillustrate the effects of primary data sources on EBV representativeness.The LPI is one of themost complete datasets of biodiversity observationson population abundances. Therefore, the identified gaps shouldprovide an overview of the challenges in building a spatially explicitand globally representative dataset for the population abundance EBV.Finally, we discuss how biases in data sources affect the representative-ness of biodiversity monitoring datasets and we suggest methods toaddress data gaps.
2. Types of primary data sources
Sources of primary biodiversity observations can be characterized bytheir geographic, taxonomic, and temporal coverage (Couvet et al.,2011). In order to develop a typology we consider the followingfeatures: (1) the coverage density (geographic coverage); (2) theobservation effort per site and the sampling frequency (impacting ontaxonomic coverage, seasonal and day/night biases); and (3) the lengthof time series (temporal coverage). Along these dimensions sourcetypes fall into four categories: extensive monitoring schemes, intensivemonitoring schemes, ecological field studies and remote sensing(Table 1).
Extensive monitoring schemes maximize geographic coverage at theexpense of sampling effort per site, expressed as thenumber of ecosystemvariables or functional groups monitored and/or sampling frequency(Couvet et al., 2011). A widespread spatial coverage is often achievedthrough the simplification of the observation effort per site, namely byfocusing on a target species group. This trade-off not only reduces thecosts per site but also enables volunteer engagement (Couvet et al.,2011; Schmeller et al., 2009). Consequently, extensive monitoringschemes tend to focus on popular and conspicuous species groups, suchas birds and butterflies. Intensivemonitoring schemes,meanwhile, investin the effort per site at the expense of geographic coverage. The goal of in-tensive schemes is to capture ecological responses to environmentalchange, by monitoring ecosystem functioning and species interactions(Couvet et al., 2011; Jürgens et al., 2012). Overall, extensive monitoringschemes are best suited for monitoring trends in species distributionand abundancewhereas intensive schemes can generate data formultipleEBVs. On the other hand, the larger and denser the network of sites in anextensive monitoring scheme, the better the data scalability (i.e., theability to aggregate data at multiple scales). Both extensive and intensive
Table 1Qualitative assessment of the key attributes of primary sources of global biodiversity monitorin
Extensive schemes Intensive schemes
Spatial coverage density High LowEffort per site Low HighTime series Long-term Long-termSampling frequency Moderate HighMain biases or limitations Often directed to common,
conspicuous or charismatic taxaLow density of netwosites (i.e. few sites)
EBV classes Species populations, Communitycomposition
Multiple EBVs
Please cite this article as: Proença, V., et al., Global biodiversity monitoringservation (2016), http://dx.doi.org/10.1016/j.biocon.2016.07.014
monitoring schemes provide long-term data series and both can spreadover a large spatial extent, but with different levels of coverage density.Moreover, although the above categorization is useful for data compari-sonpurposes, it is important to note that because the geographic coverageof monitoring schemes falls along a continuous gradient, the thresholdbetween extensive and intensive monitoring schemes is not alwaysprecise. For instance, while intensive schemes are applied in LTER sites,the ILTER network, which aggregates national LTER networks (i.e., anetwork of networks), has a widespread global coverage composed by avast number of sites (Vanderbilt, et al. 2015; Table 2).
In recent years, data from ecological field studies and satelliteremote sensing have been used increasingly as aggregated datasetshave become more accessible (Karl et al., 2013; Hudson et al., 2014;Pimmet al., 2014). Ecological field studies, here defined as experimentalor observational studies located outdoors (Martin et al., 2012), arenumerous but often conducted independently of each other. Despitethe large spatial coverage achieved when independent studies areaggregated (e.g., Hudson et al., 2014), data scalability is constrained bythe fact that ecological field studies do not share a common design ordata recording scheme. Also, compared with the other sources ofbiodiversity data, ecological field studies tend to deliver short-termdata series (Hudson et al., 2014). Yet, because ecological field studiesexplore different research questions and report many different typesof data, they also cover multiple EBV classes. Similarly, citizen sciencegenerates numerous opportunistic data on species observations.Despite their large number and spatial coverage, the use of these datahas been limited by quality issues, namely the lack of samplingprotocols. Recent developments in data correction methods promiseto allow researchers to use opportunistic citizen science data tomonitorspecies distribution trends (van Strien et al., 2013; Isaac et al., 2014).
Satellite remote sensing can deliver long-term data series with a highsampling frequency and extensive geographic coverage. Satellite remotesensing can be distinguished from other types of remote sensing, such asaircraft or drones, by its global and continuous coverage. Moreover, andfor sake of simplicity, the latter can be framedwithin the techniques usedin long-term monitoring schemes and ecological field studies. Althoughsatellite remote sensing data are often vegetation-related, and aretypically used to monitor ecosystem function and ecosystem structureEBVs (e.g., NPP, ecosystem extent and fragmentation), there is somepotential to monitor a broader range of EBVs (Turner, 2014; Skidmoreet al., 2015; O'Connor et al., 2015; Pettorelli et al., 2016). Still, the ongoingdevelopment of techniques for remote sensing data collection andprocessing creates challenges for the aggregation of time series, butalso opportunities for the use of these data in biodiversity monitoring(Pasher et al., 2013; Skidmore et al., 2015). Moreover, while the resolu-tion of satellite imagery is rapidly improving, enabling a more diverserange of applications, the high costs and time needed for data processingcould be a constraint (Pasher et al., 2013). This is reflected in the paucityof map products, despite frequent data collection, and stresses the needfor international and multidisciplinary approaches that harness the useof earth observation data (Pasher et al., 2013). In addition, the produc-tion of EBV datasets from satellite data will require coordinated actionfrom data providers, biodiversity and remote sensing experts, and policymakers (Pettorelli et al., 2016).
g data and their coverage of EBV classes.
Ecological field studies Remote sensing
High Very highLow to high LowShort-term Medium to long-termModerate to high Very high
rk Short-term data series;diverse field protocols
Low resolution data; often vegetation-relatedvariables measured at the ecosystem level
Multiple EBVs Ecosystem structure, Ecosystem function
: From data sources to Essential Biodiversity Variables, Biological Con-

4 V. Proença et al. / Biological Conservation xxx (2016) xxx–xxx
Biodiversity monitoring datasets may combine primary biodiversityobservations from a single source, from different sources of the sametype, or from different sources of different types (Fig. 1). The globalmap of 21st century forest cover change by Hansen et al. (2013) is anexample of the first case. It combines time series of Landsat data tomonitor forest cover change at the global scale. An example of thesecond case is the global Wild Bird Index (WBI; Gregory et al., 2005;Gregory & van Strien 2010) dataset, which currently combines thespecies abundance data delivered by the Pan-European Common BirdMonitoring Scheme and the North American Breeding Bird Survey(Table 2). The Living Planet Index (LPI; Collen et al., 2009) datasetprovides an example of the last case, as it combines data from extensiveschemes, intensive schemes, and ecological field studies (see nextsection). Moreover, primary biodiversity observationsmay be compiledand made available through secondary sources, such as databases(e.g., the PREDICTS database (Hudson et al., 2014)), data repositories,or institutional reports.
3. The data sources behind the Living Planet Index
The LPI is among the best established indicators of the state of globalbiodiversity (Butchart et al., 2010; Tittensor et al., 2014). It monitorschanges in population abundance relative to a 1970 baseline usingtime series of vertebrate populations across the globe (Collen et al.,2009; Fig. 2a). The underlying dataset aggregates time series forN16,000 populations of over 3600 species of vertebrates (http://www.livingplanetindex.org/, accessed 14.06.2016) and is one of the mostcomplete datasets on the population abundance EBV (Collen et al.,2009; Tittensor et al., 2014). New data are added to the dataset asthey become available. A candidate population is included in the datasetonly if data on population size are available for at least two yearsand data were always collected using the same method on the samepopulation throughout the time series (Collen et al., 2009). Data gener-ated by different types of primary sources, namely, extensive schemes,intensive schemes, and ecological field studies, are collected from avariety of available sources, including published scientific literature,on-line databases and gray literature (Collen et al., 2009). Therefore,the LPI dataset emerges from ongoing data survey and collection.
Here we analyze two subsets of the LPI dataset, the subset of terres-trial birds (4406 time series of 1025 species, time interval: 1900–2013)and the subset of terrestrial mammals (2229 time series of 438 species,time interval: 1900–2014). We use information on the length of thetime series (i.e., the time interval between the start and end year),number of data points (i.e., number of measurements made duringthe time interval) and the purpose of primary data collection
Table 2Examples of large scale (i.e., international or continental) extensive (E) and intensive (I) moni
Monitoring schemea Type Coverage N
Pan-European Common Bird Monitoring Scheme (PECBMS) E Europe N
Breeding Bird Survey (BBS) E North America N
International Waterbird Census (IWC) E Global N
Great Backyard Bird Count (GBBC) E Global N
National Butterfly Monitoring Schemes (BMS) E Europe 2Important Bird and Biodiversity Areas (IBAs) E Global N
International Long-Term Ecological Research Network (ILTER) I Global N
National Ecological Observation Network (NEON) I U.S. e6Biodiversity Monitoring Transect Analysis in Africa (BIOTA) I Africa 4Tropical Ecology Assessment & Monitoring network (TEAM) I Africa, Asia,
Latin America1
a Websites: PECBMS (http://www.ebcc.info/); BBS (https://www.pwrc.usgs.gov/bbs/)www.bc-europe.eu/); IBA (http://www.birdlife.org/); NEON (http://www.neoninc.org(http://www.teamnetwork.org).
b GBBC is a citizen science project, participants reported 137,998 checklists in 2013.c Global scope since 2013, running in US since 1998.d Some national LTER networks started before ILTER (e.g., US LTER started in 1980).e NEON operates 20 core terrestrial sites +40 relocatable terrestrial sites.
Please cite this article as: Proença, V., et al., Global biodiversity monitoringservation (2016), http://dx.doi.org/10.1016/j.biocon.2016.07.014
(i.e., baselinemonitoring, conservation or natural resourcemanagement,or population studies) to infer if data originate from long-termmonitor-ing schemes (i.e., extensive and intensive schemes) or from ecologicalfield studies. Lindenmayer and Likens (2010) proposed a minimumtime series length of 10 years to qualify a study as long-term, whileemphasizing that this is an operational criterion and that the adequatethreshold depends on the taxa or ecosystem processes being monitored.For the purpose of our analysis, we assigned long-term monitoringschemes to long-term time series, here defined by a minimum of 10data points if the series started after 1995, or a minimum of 15 datapoints if the series started in 1995 or before. We do not discriminateextensive from intensive schemes because the dataset does not provideprecise information on the number of sampling sites and spatial cover-age of the primary source. For that reason, we do not discuss the relativecontribution of these source types to the LPI. Ecologicalfield studieswereassigned to short-term time series of non-baseline monitoring studies.Moreover, recently started time series collected for baseline monitoringpurposes could evolve in the future into long-term time series.
Results show that for both birds and mammals a large share of theavailable data stems from temperate regions, in particular Europe andNorth America (Fig. 2b-c); in the case ofmammals, the equatorial regionis also better represented than other world regions. In order to correctfor geographic biases, a method of proportional weighting is currentlyapplied to the data when calculating the global LPI (McLellan et al.,2014). Regarding the temporal coverage, long-term time seriescomprise a large share of bird population data but are largely confinedto temperate regions (Figs. 2b, 3a, Appendix A). On the other hand,short-term time series dominate for mammals across all world regions(Figs. 2c, 3b, Appendix A). Relatedly, both species groups are weaklyrepresented by long-term data in tropical regions. Finally, the breadthof the taxonomic coverage also differs between the two species groups.Most sources of bird time-series target multiple taxonomic orders,while in the case of mammals, with the exception of the equatorialregion, most sources target a single order (Figs. 2b-c, 3), and of these60% target a single species (Appendix B).
The bias towards the northern hemisphere is particularly accentuatedin the case of birds, where extensive monitoring schemes, such as theNorth American Breeding Bird Survey and the Pan-European CommonBird Monitoring Scheme (Table 2), deliver many of the long-term(multi order) data on bird populations (Fig. 3a, Appendix C). Efforts arebeing pursued to implement similar schemes in gap regions, particularlyin African countries (BirdLife International, 2013). Once implemented,these schemeswill contribute to reducing the data gap and consequentlythe geographic bias. Notwithstanding, the International Waterbird Cen-sus (Table 2) has global coverage, operating in 143 countries and building
toring schemes.
etwork Species groups Start year Sampling frequency
12,000 sites Birds 1980 Annual1000 sites Birds 1966 Annual25,000 sites Birds 1967 Annual137,000 checklistsb Birds 2013c Annual000 sites Butterflies 1990 Annual3000 sites Birds 1994 Annual600 sites Unrestricted d1993 Depends on species group0 terrestrial sites Unrestricted 2011 Depends on species groupregional transects Unrestricted 1999 Depends on species group6 sites Plants, Mammals, Birds 2009 Annual (dry season)
; IWC (http://www.wetlands.org/); GBBC (http://gbbc.birdcount.org/); BMS (http:///); ILTER (http://www.ilternet.edu/); BIOTA (http://www.biota-africa.org/); TEAM
: From data sources to Essential Biodiversity Variables, Biological Con-

Fig. 2. Global distribution of terrestrial Living Planet Index (LPI) time series over a map of forest change (a), the size of each dot is proportional to the number of populations monitored(adapted from Pereira et al. 2010 and Hansen et al. 2013). Forest change is shown 1 km-pixels and includes areas of forest loss, forest gain and areas of both loss and gain; Latitudinaldistribution of LPI time series of population abundance of terrestrial birds (b) and mammals (c) classified by time series length and taxonomic coverage of the data source: STSO -short-term single order, STMO - short-term multiple order, LTSO - long-term single order, LTMO - long-term multiple order (see Section 3 for a definition of each class). The midpointsof the latitude classes are shown.Source: ZSL/WWF, Hansen et al. 2013.
5V. Proença et al. / Biological Conservation xxx (2016) xxx–xxx
on the contribution of thousands of volunteers (Wetlands International,2016). Long-term time series on mammal population abundances alsoshow a bias towards the northern hemisphere, with data, equally distrib-uted across North America, Europe and Asia. For this species group,ecological field studies seem to be providing more long-term data thanmonitoring schemes (Fig. 3b, Appendix C).
Concurrently, short-term ecological field studies constitute analternative, relatively abundant and globally distributed source of timeseries of population abundance. Ecological field studies deliver a greatpart of the available time series of mammal population abundanceand are essential to complement bird monitoring data (Fig. 3, AppendixC). However, differences in sampling protocols affect data scalabilityacross space and time, hence limiting the full use of primary data(Henry et al., 2008). Furthermore, while the aggregation of data fromdifferent sources confers a broad taxonomic coverage (within thevertebrates) to the LPI dataset, many of the sources, particularly formammals, target a single species or order (Figs. 2c, 3b, Appendix B).This represents a limitation if community-level responses are relevantfor monitoring the impacts of environmental change, such as theassessment of trophic chain effects or the identification of potential“loser” and “winner” species.
Finally, the global distribution of post-2010 data (Appendix D)suggests that the commitment to the Aichi Targets has yet to be followedby the implementation of new monitoring programs in gap regions.
Please cite this article as: Proença, V., et al., Global biodiversity monitoringservation (2016), http://dx.doi.org/10.1016/j.biocon.2016.07.014
4. Improving the representativeness of EBV datasets
The goal of global biodiversitymonitoring is to measure biodiversityresponses to environmental change. This goal implies the use of time se-ries, in particular long-term data capable of capturing on-going changesthrough time (Scholes et al., 2012; Han et al., 2014). Data must also bescalable, so that biodiversity change can be assessed across scales andcompared between sites (Pereira and Cooper, 2006; Han et al., 2014;Latombe et al., this issue), and taxonomically representative, so that amore complete understanding of biodiversity change, which includescommunity level changes, can be achieved.
Here, we have examined what is arguably the most representativeglobal dataset of population abundance, a dataset produced to informthe LPI indicator. The analysis revealed two types of data biases,geographic (i.e., more data from temperate regions) and temporal(i.e., a predominance of short-term time series). Moreover, thetaxonomic coverage is currently restricted to vertebrates, which,despite being the best known taxonomic group, represent only a smallfraction of life on earth (Pereira et al., 2012). Long-term monitoringschemes for non-vertebrate taxa are still scarce and should be targetedby future monitoring efforts. New programs, such as the National But-terfly Monitoring Schemes in Europe (Table 2), are already helping toaddress this gap. The selection of target taxa is challenging however.First, it is not feasible to select a comprehensive set of taxa for global
: From data sources to Essential Biodiversity Variables, Biological Con-
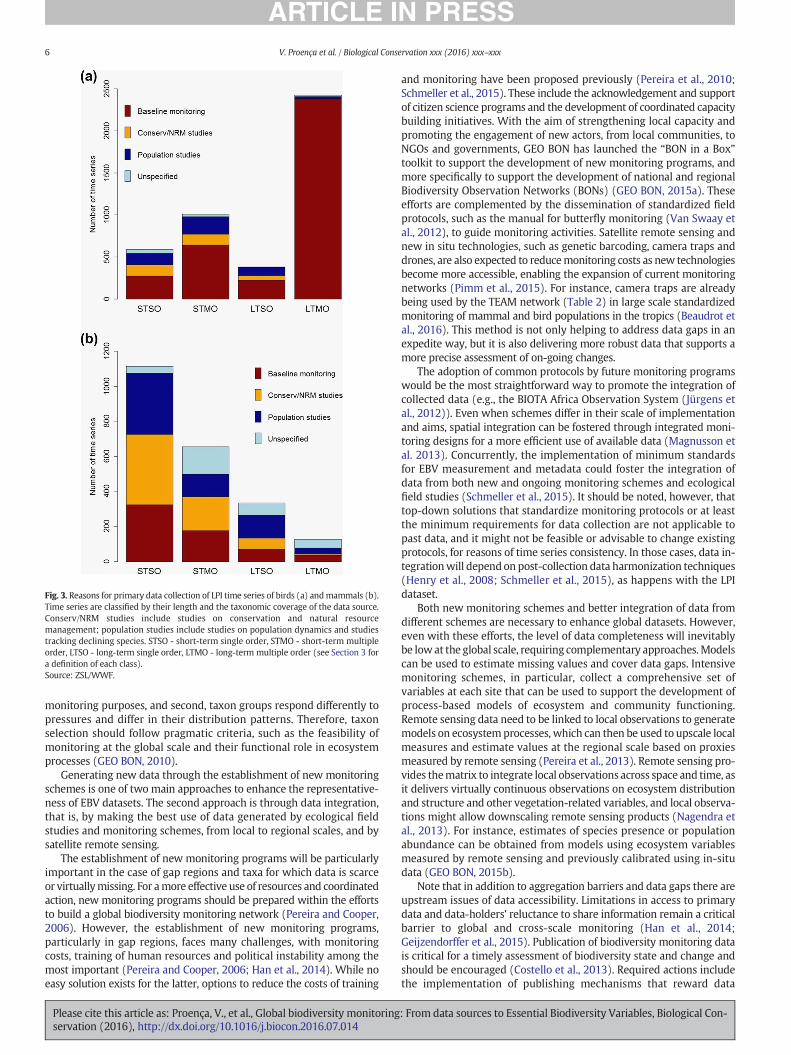
Fig. 3. Reasons for primary data collection of LPI time series of birds (a) andmammals (b).Time series are classified by their length and the taxonomic coverage of the data source.Conserv/NRM studies include studies on conservation and natural resourcemanagement; population studies include studies on population dynamics and studiestracking declining species. STSO - short-term single order, STMO - short-term multipleorder, LTSO - long-term single order, LTMO - long-term multiple order (see Section 3 fora definition of each class).Source: ZSL/WWF.
6 V. Proença et al. / Biological Conservation xxx (2016) xxx–xxx
monitoring purposes, and second, taxon groups respond differently topressures and differ in their distribution patterns. Therefore, taxonselection should follow pragmatic criteria, such as the feasibility ofmonitoring at the global scale and their functional role in ecosystemprocesses (GEO BON, 2010).
Generating new data through the establishment of new monitoringschemes is one of two main approaches to enhance the representative-ness of EBV datasets. The second approach is through data integration,that is, by making the best use of data generated by ecological fieldstudies and monitoring schemes, from local to regional scales, and bysatellite remote sensing.
The establishment of new monitoring programs will be particularlyimportant in the case of gap regions and taxa for which data is scarceor virtuallymissing. For amore effective use of resources and coordinatedaction, new monitoring programs should be prepared within the effortsto build a global biodiversity monitoring network (Pereira and Cooper,2006). However, the establishment of new monitoring programs,particularly in gap regions, faces many challenges, with monitoringcosts, training of human resources and political instability among themost important (Pereira and Cooper, 2006; Han et al., 2014). While noeasy solution exists for the latter, options to reduce the costs of training
Please cite this article as: Proença, V., et al., Global biodiversity monitoringservation (2016), http://dx.doi.org/10.1016/j.biocon.2016.07.014
and monitoring have been proposed previously (Pereira et al., 2010;Schmeller et al., 2015). These include the acknowledgement and supportof citizen science programs and the development of coordinated capacitybuilding initiatives. With the aim of strengthening local capacity andpromoting the engagement of new actors, from local communities, toNGOs and governments, GEO BON has launched the “BON in a Box”toolkit to support the development of new monitoring programs, andmore specifically to support the development of national and regionalBiodiversity Observation Networks (BONs) (GEO BON, 2015a). Theseefforts are complemented by the dissemination of standardized fieldprotocols, such as the manual for butterfly monitoring (Van Swaay etal., 2012), to guide monitoring activities. Satellite remote sensing andnew in situ technologies, such as genetic barcoding, camera traps anddrones, are also expected to reducemonitoring costs as new technologiesbecome more accessible, enabling the expansion of current monitoringnetworks (Pimm et al., 2015). For instance, camera traps are alreadybeing used by the TEAM network (Table 2) in large scale standardizedmonitoring of mammal and bird populations in the tropics (Beaudrot etal., 2016). This method is not only helping to address data gaps in anexpedite way, but it is also delivering more robust data that supports amore precise assessment of on-going changes.
The adoption of common protocols by future monitoring programswould be the most straightforward way to promote the integration ofcollected data (e.g., the BIOTA Africa Observation System (Jürgens etal., 2012)). Even when schemes differ in their scale of implementationand aims, spatial integration can be fostered through integrated moni-toring designs for a more efficient use of available data (Magnusson etal. 2013). Concurrently, the implementation of minimum standardsfor EBV measurement and metadata could foster the integration ofdata from both new and ongoing monitoring schemes and ecologicalfield studies (Schmeller et al., 2015). It should be noted, however, thattop-down solutions that standardize monitoring protocols or at leastthe minimum requirements for data collection are not applicable topast data, and it might not be feasible or advisable to change existingprotocols, for reasons of time series consistency. In those cases, data in-tegrationwill dependon post-collection data harmonization techniques(Henry et al., 2008; Schmeller et al., 2015), as happens with the LPIdataset.
Both new monitoring schemes and better integration of data fromdifferent schemes are necessary to enhance global datasets. However,even with these efforts, the level of data completeness will inevitablybe lowat the global scale, requiring complementary approaches.Modelscan be used to estimate missing values and cover data gaps. Intensivemonitoring schemes, in particular, collect a comprehensive set ofvariables at each site that can be used to support the development ofprocess-based models of ecosystem and community functioning.Remote sensing data need to be linked to local observations to generatemodels on ecosystemprocesses, which can then be used to upscale localmeasures and estimate values at the regional scale based on proxiesmeasured by remote sensing (Pereira et al., 2013). Remote sensing pro-vides thematrix to integrate local observations across space and time, asit delivers virtually continuous observations on ecosystem distributionand structure and other vegetation-related variables, and local observa-tions might allow downscaling remote sensing products (Nagendra etal., 2013). For instance, estimates of species presence or populationabundance can be obtained from models using ecosystem variablesmeasured by remote sensing and previously calibrated using in-situdata (GEO BON, 2015b).
Note that in addition to aggregation barriers and data gaps there areupstream issues of data accessibility. Limitations in access to primarydata and data-holders' reluctance to share information remain a criticalbarrier to global and cross-scale monitoring (Han et al., 2014;Geijzendorffer et al., 2015). Publication of biodiversity monitoring datais critical for a timely assessment of biodiversity state and change andshould be encouraged (Costello et al., 2013). Required actions includethe implementation of publishing mechanisms that reward data
: From data sources to Essential Biodiversity Variables, Biological Con-
7V. Proença et al. / Biological Conservation xxx (2016) xxx–xxx
providers, ensure data quality standards and the sustainability of publicdatabases (Costello et al. 2013, 2014).
The demand for EBV datasets to support biodiversity change assess-ment at multiple spatial and temporal scales is far from being met. Atpresent there are few globally representative EBV datasets that compileand integrate time series of primary observations (Boakes et al., 2010;Han et al., 2014). For instance, data on species distribution/presenceare available through GBIF (Global Biodiversity Information Facility),and GBIF's Integrated Publishing Toolkit (http://www.gbif.org/ipt) isbeing adapted to support the recording of quantitative measures ofspecies abundance (Wieczorek et al. 2014), which will enhance theinteroperability of existing datasets. Species traits data are availablefrom the TRY database (https://www.try-db.org/), and data onspecies interactions are being mobilized into GloBI (http://www.globalbioticinteractions.org/). But inmost cases, time series data, funda-mental for the development of EBV datasets, are poorly represented inthese databases.
In order to develop representative EBV datasets, wemust first assessthe available primary data. Then, alongside efforts to improve dataaccessibility, we must integrate primary data through harmonizationof methods and modeling, and establish new monitoring programs tocover critical data gaps and to ensure the robustness and stability of aglobal monitoring network. The design of a global monitoring networkshould consider both extensive and intensive monitoring schemes.This will enable an inclusive coverage of EBV classes and promote datacomplementarity and their use in modeling efforts, in particular, inconjunction with satellite remote sensing data. Moreover, becauseresources are limited, a smart prioritization of investment will berequired. Concurrently with a strategic selection of areas for theimplementation of new schemes, it also is crucial to prioritize capacitybuilding initiatives and to understand how to make the best use ofmodeling solutions.
Acknowledgements
VP and PT were supported by FCT - the Foundation for Science andTechnology (SFRH/BPD/80726/2011 and SFRH/BD/89543/2012), LJMwas supported by the National Science Foundation DissertationImprovement Grant (Award No.1329750), DSS andNABwere supportedby the EU BON project of the 7th Framework Programme funded by theEuropean Union - Contract No. 308454, MB is supported by the RuffordFoundation, JB was supported by US Geological Survey Ecosystem pro-gram. FCT (PTDC/AAC-AMB/114522/2009, PEst-OE/BIA/UI0329/2011),and GEO BON supported the organization of a workshop of the GEOBON Terrestrial Species Working Group.
Appendix A to D. Supplementary data
Supplementary data to this article can be found online at http://dx.doi.org/10.1016/j.biocon.2016.07.014.
References
Beaudrot, L., Ahumada, J.A., O'Brien, T., et al., 2016. Standardized assessment ofbiodiversity trends in tropical forest protected areas: the end is not in sight. PLoSBiol. 14, e1002357.
BirdLife International, 2013. Spotlight on birds as indicators. Presented as part of the Bird-Life State of the world's birds website. Available from: http://www.birdlife.org/datazone.
Boakes, E.H., McGowan, P.J., Fuller, R.A., et al., 2010. Distorted views of biodiversity:spatial and temporal bias in species occurrence data. PLoS Biol. 8, e1000385.
Bubb, P., Chenery, A., Herkenrath, P., et al., 2011. National Indicators, Monitoring andReporting for the Strategy for Biodiversity 2011–2020. UNEP-WCMC, Cambridge, UK.
Butchart, S.H.M., Walpole, M., Collen, B., et al., 2010. Global biodiversity: indicators ofrecent declines. Science 328, 1164–1168.
Collen, B., Loh, J., McRae, L., et al., 2009. Monitoring change in vertebrate abundance: theLiving Planet Index. Conserv. Biol. 23, 317–327.
Costello, M.J., Michener, W.K., Gahegan, M., Zhang, Z.Q., Bourne, P.E., 2013. Biodiversitydata should be published, cited, and peer reviewed. Trends Ecol. Evol. 28, 454–461.
Please cite this article as: Proença, V., et al., Global biodiversity monitoringservation (2016), http://dx.doi.org/10.1016/j.biocon.2016.07.014
Costello, M.J., Appeltans, W., Bailly, N., et al., 2014. Strategies for the sustainability ofonline open-access biodiversity databases. Biol. Conserv. 173, 155–165.
Couvet, D., Devictor, V., Jiguet, F., Julliard, R., 2011. Scientific contributions of extensivebiodiversity monitoring. C. R. Biol. 334, 370–377.
Geijzendorffer, I.R., Regan, E.C., Pereira, H.M., et al., 2015. Bridging the gap betweenbiodiversity data and policy reporting needs: an Essential Biodiversity Variablesperspective. J. Appl. Ecol. http://dx.doi.org/10.1111/1365-2664.12417.
GEO BON, 2010. Detailed implementation plan. Version 1.0–22 May 2010. (Available at)https://www.earthobservations.org/documents/cop/bi_geobon/geobon_detailed_imp_plan.pdf.
GEO BON, 2015a.What is BON in a Box? Available from: http://geobon.org/bon-in-a-box/what-is-bon-in-a-box/
GEO BON, 2015b. Global Biodiversity Change Indicators. Version 1.2. Available from:http://geobon.org/products/.
Gregory, R.D., van Strien, A., 2010. Wild bird indicators: using composite populationtrends of birds as measures of environmental health. Ornithol. Sci. 9, 3–22.
Gregory, R.D., van Strien, A., Vorisek, P., et al., 2005. Developing indicators for Europeanbirds. Philos. Trans. R. Soc. Lond. Ser. B Biol. Sci. 360, 269–288.
Han, X., Smyth, R.L., Young, B.E., et al., 2014. A biodiversity indicators dashboard:addressing challenges to monitoring progress towards the Aichi biodiversity targetsusing disaggregated global data. PLoS One 9, e112046.
Hansen, M.C., Potapov, P.V., Moore, R., et al., 2013. High-resolution global maps of 21st-century forest cover change. Science 342, 850–853.
Henry, P.Y., Lengyel, S., Nowicki, P., et al., 2008. Integrating ongoing biodiversity monitor-ing: potential benefits and methods. Biodivers. Conserv. 17, 3357–3382.
Hudson, L.N., Newbold, T., Contu, S., et al., 2014. The PREDICTS database: a global databaseof how local terrestrial biodiversity responds to human impacts. Ecol. Evol. 4,4701–4735.
Isaac, N.J., Strien, A.J., August, T.A., et al., 2014. Statistics for citizen science: extractingsignals of change from noisy ecological data. Methods in Ecology and Evolution 5,1052–1060.
Jürgens, N., Schmiedel, U., Haarmeyer, D.H., et al., 2012. The BIOTA Biodiversity Observa-tories in Africa—a standardized framework for large-scale environmental monitoring.Environ. Monit. Assess. 184, 655–678.
Karl, J.W., Herrick, J.E., Unnasch, R.S., et al., 2013. Discovering ecologically relevant knowl-edge from published studies through geosemantic searching. Bioscience 63, 674–682.
Latombe, G., Pyšek, P., Jeschke, J.M., et al., A vision for global monitoring of biologicalinvasions, Biol. Conserv. this issue.
Lindenmayer, D.B., Likens, G.E., 2010. Effective Ecological Monitoring. CSIRO.Magnusson, W., Braga-Neto, R., Pezzini, F., et al., 2013. Biodiversity and Integrated
Environmental Monitoring. Áttema Editorial, Brazil.Martin, L.J., Blossey, B., Ellis, E.C., 2012. Mapping where ecologists work: biases in the
global distribution of terrestrial ecological observations. Front. Ecol. Environ. 10,195–201.
McGeoch, M.A., Butchart, S.H., Spear, D., et al., 2010. Global indicators of biologicalinvasion: species numbers, biodiversity impact and policy responses. Divers. Distrib.16, 95–108.
McGeoch, M.A., Shaw, J.D., Terauds, A., Lee, J.E., Chown, S.L., 2015. Monitoring biologicalinvasion across the broader Antarctic: a baseline and indicator framework. Glob.Environ. Chang. 32, 108–125.
McLellan, R., Iyengar, L., Jeffries, B., Oerlemans, N. (Eds.), 2014. Living Planet Report 2014:Species and Spaces, People and Places. WWF, Gland, Switzerland.
Nagendra, H., Lucas, R., Honrado, J.P., et al., 2013. Remote sensing for conservation mon-itoring: assessing protected areas, habitat extent, habitat condition, species diversity,and threats. Ecol. Indic. 33, 45–59.
O'Connor, B., Secades, C., Penner, J., et al., 2015. Earth observation as a tool for trackingprogress towards the Aichi Biodiversity Targets. Remote. Sens. Ecol. Conserv. 1 (1),19–28.
Pasher, J., Smith, P.A., Forbes, M.R., Duffe, J., 2013. Terrestrial ecosystem monitoring inCanada and the greater role for integrated earth observation. Environ. Rev. 22,179–187.
Pereira, H.M., Cooper, H.D., 2006. Towards the global monitoring of biodiversity change.Trends Ecol. Evol. 21, 123–129.
Pereira, H.M., Belnap, J., Brummitt, N., et al., 2010. Global biodiversity monitoring. Front.Ecol. Environ. 8, 459–460.
Pereira, H.M., Navarro, L.M., Martins, I.S., 2012. Global biodiversity change: the bad, thegood, and the unknown. Annu. Rev. Environ. Resour. 37, 25–50.
Pereira, H.M., Ferrier, S., Walters, M., et al., 2013. Essential biodiversity variables. Science339, 277–278.
Pettorelli, N., Wegmann, M., Skidmore, A., et al., 2016. Framing the concept of satelliteremote sensing essential biodiversity variables: challenges and future directions.Remote. Sens. Ecol. Conserv. http://dx.doi.org/10.1002/rse2.15.
Pimm, S.L., Jenkins, C.N., Abell, R., et al., 2014. The biodiversity of species and their rates ofextinction, distribution, and protection. Science 344, 1246752.
Pimm, S.L., Alibhai, S., Bergl, R., et al., 2015. Emerging technologies to conserve biodiver-sity. Trends Ecol. Evol. 30, 685–696.
Schmeller, D.S., 2008. European species and habitat monitoring: where are we now?Biodivers. Conserv. 17, 3321–3326.
Schmeller, D.S., Henry, P.Y., Julliard, R., et al., 2009. Advantages of volunteer-basedbiodiversity monitoring in Europe. Conserv. Biol. 23, 307–316.
Schmeller, D.S., Julliard, R., Bellingham, P.J., et al., 2015. Towards a global terrestrialspecies monitoring program. J. Nat. Conserv. 25, 51–57.
Scholes, R.J., Walters, M., Turak, E., et al., 2012. Building a global observing system forbiodiversity. Curr. Opin. Environ. Sustain. 4, 139–146.
Skidmore, A.K., Pettorelli, N., Coops, N.C., et al., 2015. Agree on biodiversity metrics totrack from space. Nature 523, 403–405.
: From data sources to Essential Biodiversity Variables, Biological Con-

8 V. Proença et al. / Biological Conservation xxx (2016) xxx–xxx
Tittensor, D.P., Walpole, M., Hill, S.L., et al., 2014. A mid-term analysis of progress towardinternational biodiversity targets. Science 346, 241–244.
Turner, W., 2014. Sensing biodiversity. Science 346, 301–302.van Strien, A.J., Swaay, C.A., Termaat, T., 2013. Opportunistic citizen science data of animal
species produce reliable estimates of distribution trends if analysed with occupancymodels. J. Appl. Ecol. 50, 1450–1458.
Van Swaay, C.A.M., Brereton, T., Kirkland, P., Warren, M.S., 2012. Manual for ButterflyMonitoring. Report VS2012.010. De Vlinderstichting/Dutch Butterfly Conservation,Butterfly Conservation UK & Butterfly Conservation, Europe, Wageningen.
Please cite this article as: Proença, V., et al., Global biodiversity monitoringservation (2016), http://dx.doi.org/10.1016/j.biocon.2016.07.014
Vanderbilt, K.L., Lin, C.C., Lu, S.S., et al., 2015. Fostering ecological data sharing: collabora-tions in the International Long Term Ecological Research Network. Ecosphere 6, 1–18.
Velasco, D., García-Llorente, M., Alonso, B., et al., 2015. Biodiversity conservation researchchallenges in the 21st century: a review of publishing trends in 2000 and 2011.Environ. Sci. Pol. 54, 90–96.
Wetlands International, 2016. International Waterbird census. Available at https://www.wetlands.org/casestudy/international-waterbird-census/ (accessed 02.06.2016).
Wieczorek, J., Bánki, O., Blum, S., et al., 2014. Meeting report: GBIF hackathon-workshopon Darwin Core and sample data (22–24 May 2013). Stand. Genomic Sci. 9, 585–598.
: From data sources to Essential Biodiversity Variables, Biological Con-