deep learning for large scale biodiversity monitoring
TRANSCRIPT

Deep Learning for Large Scale Biodiversity MonitoringDavid J. Klein Matthew W. McKown Bernie R. Tershy
Conservation Metrics, Inc.100 Shaffer Rd.
Santa Cruz, CA 95060{djklein, matthew.mckown, bernie.tershy} @ conservationmetrics.com
ABSTRACT Healthy ecosystems with intact biodiversity provide human societies with valuable services such as clean air and water, storm protection, tourism, medicine, food, and cultural resources. Protecting this natural capital is one of the great challenges of our era. Species extinction and ecological degradation steadily continues despite conservation funding of roughly U.S. $20 billion per year worldwide. Measurements of conservation outcomes are often uninformative, hindering iterative improvements and innovation in the field. There is cause for optimism, however, as recent technological advances in sensor networks, big data processing, and machine intelligence can provide affordable and effective measures of conservation outcomes. We present several working case studies using our system, which employs deep learning to empower biologists to analyze petabytes of sensor data from a network of remote microphones and cameras. This system, which is being used to monitor endangered species and ecosystems around the globe, has enabled an order of magnitude improvement in the cost effectiveness of such projects. This approach can be expanded to encompass a greater variety of sensor sources, such as drones, to monitor animal populations, habitat quality, and to actively deter wildlife from hazardous structures. We present a strategic vision for how data-driven approaches to conservation can drive iterative improvements through better information and outcomes-based funding mechanisms, ultimately enabling increasing returns on biodiversity investments. Keywords Environment, biodiversity, deep learning, endangered species, adaptive management, conservation outcomes, big data, sensor networks, automated monitoring, evidence-based.
1. INTRODUCTION Ecosystem services [1], being the contribution of nature to human well-being are valued at excess of US$125 trillion per year [2]. This includes such diverse services as air and water filtration, crop pollination, seafood, medicine, and tourism. Humans, long ignorant of how their actions impact ecosystem services, are steadily eroding its value to the tune of close to US$1 trillion per year [2,3]. In recent decades, multilateral treaties such as the UN-recognized Convention for Global Biodiversity [4] have encouraged nations to increase investment in the conservation of biodiversity. Unfortunately, the current rate of investment, estimated at US$20 billion per year [5], has not slowed the rate of biodiversity and ecosystem service loss [6]. It has been estimated
that an order of magnitude greater investment is required just to maintain the status quo [7].
Clearly it is important to direct the limited funds to effective solutions. An evidence-based approach to conservation, built on rigorous measures of conservation outcomes, can help identify techniques that work, point out approaches that are not working as planned, facilitate outcomes-based funding and, ultimately, drive innovation in the field [8,9,10]. Effective wildlife monitoring techniques are a key component of a conservation measures program. However, counting organisms is a tricky business [11,12]. The inherent stochasticity of natural systems – storms, droughts, diseases – add noise to biological surveys. As a result, many monitoring programs fail to provide results with the statistical power needed to measure the effectiveness of conservation actions [13,14,15]. Rigorous monitoring programs can be expensive and difficult to maintain over time. Better and more cost-effective conservation monitoring methods are needed to improve inference and drive adaptive management of conservation projects.
2. TRADITIONAL APPROACH TO MONITORING
The standard approach to biodiversity monitoring involves periodically sending observers to a pre-determined set of survey sites to collect data over relatively short survey windows. Logistical hurdles, personnel costs, and time constraints make it difficult to scale these traditional surveys to meet the increasing demands of global conservation. Add to this the fact that repeated visits to sensitive habitats by human observers can lead to a host of negative ecological impacts and it is not surprising that current biodiversity monitoring efforts are typically small, sporadic and short-lived. Thus, typical monitoring efforts suffer from severe under sampling of space and time, and sometimes from the variable skills and biases of different field workers [16,17]. This combination of small sample sizes, stochastic natural systems, and fallible human observations can complicate the analysis of data from traditional surveys. Consequently, many conservation monitoring efforts provide inconclusive results [15] and few can be implemented at scale. Our approach to monitoring leverages technological innovations to fundamentally improve the quality of conservation monitoring and to scale monitoring programs to meet the global need. Advances in sensor hardware and big data analytics make it possible to survey much larger numbers of sites nearly continuously. Using a variety of sensors including microphones, cameras (visual, thermal, IR, and hyperspectral), accelerometers, Bloomberg Data for Good Exchange Conference.
28-Sep-2015, New York City, NY, USA.

raw data are collected and transmitted back to a central data store. From there, the data may be analyzed with a variety of different algorithms. As a whole, we’ve found this approach helps to alleviate the sampling, variability, and bias problems associated with traditional surveys. Further, the costs are reduced – the cost of transporting and sustaining field crews in remote locations is instead applied to less frequently serviced sensor hardware. The primary challenge for this approach is handling, processing, and analyzing the sheer volume of data generated by regional sensor networks. This challenge has two components, one being the technology infrastructure required to handle big data, and the other having to do with the amount of labor required to process and analyze the data.
3. NEW MONITORING TECHNOLOGY Rapid advances in technology now offer managers a number of tools that can improve conservation monitoring. For example, advances in battery technology, global positioning systems, and cellular networks have revolutionized wildlife telemetry and added a wealth of information about animal movements at continental scales [18,19]. Visual sensor networks and images collected by satellites, airplanes, wave gliders, and un-manned aerial vehicles have made it easier to track of changes at the landscape scale [20,21,22,23,24,25]. These innovations provide cost-effective ways to collect biological data at large spatial scales over long survey windows, thereby increasing the statistical power of these survey efforts. However, the rise of cheap and powerful sensors has created an ever-increasing data glut. To be effective, these new tools must be coupled with new automated approaches to processing and analyzing wildlife data streams. Here we describe examples of how we are leveraging advances in the areas of big data and deep learning to help researchers extract meaningful information from the torrent of new sensor data, and improve the adaptive management of natural systems.
4. DEEP LEARNING FOR BIODIVERSITY 4.1.Big data infrastructure
We are primarily focused on processing and analyzing large, high-bit-rate datasets such as audio (high sample rate) and image (large amount of data per sample) streams. Other environmental sensor data, like temperature or air quality, utilize much lower data rates. For example, to record bird vocalizations, we typically record 16-bit stereo audio at a moderate sample rate of 22,000 samples per second (22 kHz) at each monitoring site. In another example, for tracking populations of invasive snakes we ingest 2048-by-1536 8-bit 4:2:2 color images taken at least once every thirty seconds at each site. Data are often collected with a 30% duty cycle over each day, and light (lossless or near-lossless) data compression is employed. A typical survey point can easily generate more than 5 gigabytes (GB) of data per day, and an entire monitoring project, integrating multiple sites in a region over a multiple-month monitoring season, can generate over 50 terabytes (TB) annually. We are currently operating dozens of projects worldwide, and will be producing petabytes (PB) of data every year as projects scale up to the demand. Technology infrastructure capable of transmitting, processing, and storing this amount of data has only recently become widely available and cost effective thanks to advances in the areas of the “Internet of Things” (IoT) [26] and cloud computing and storage. We have repurposed inexpensive, programmable mobile phones to
gather and telemeter sensor data from the field [27], and off-the-shelf sensor hardware is increasingly equipped with data transmission radios and on-board processing capabilities. The sensors are configured in a communication network [28], enabling data to flow from remote areas into a smaller number of accessible base stations. The base stations then transmit data through the internet, satellite, microwave, or cell networks, or act as data-loggers to be recovered at the end of the survey period. Once collected, we store data at a co-located data center using off-the-shelf computers, and managed and served with freely available software including Spark [29]. Third-party data centers such as those of Amazon Web Services (AWS) are increasingly becoming an option as prices steadily decrease, and we are already using this solution for cold-storing data from previous field seasons.
4.2.Data analysis With the infrastructure for handling big data becoming economically viable, the greater challenge for large-scale wildlife monitoring projects is the ability to analyze data to quantify events of interest (vocalizations, images of individuals, area covered by vegetation type, etc.) in a cost-effective manner. Our automated monitoring projects typically collect two orders of magnitude more data than would typically be gathered by observers in traditional field surveys. Scaling the number of analysts in the lab to manually review these large datasets is not viable; instead we have developed techniques to speed up and semi-automate the data analysis process. We do this in two ways, which are elaborated in the following sections. First, we use custom user interfaces (UIs) that can greatly speed up the exploration and analysis of the data by a limited number of analysts. Second, using machine learning (ML) techniques, such as deep learning (DL), we progressively train computational models to detect and classify events of interest, and reduce the amount of wildlife data reviewed by human analysts by orders of magnitude.
4.2.1.User Interface for Data Exploration and Labeling
In traditional wildlife surveys, field workers are constrained to observe multiple events in the environment in real time. In contrast, our system presents high probability events in a nonlinear-time presentation while also allowing analysis to repeatedly review complex or ambiguous events. We use our software to perform three specific tasks: (1) we use tools for audio and image data exploration to search for expected species and flag unknown or unexpected events, (2) we create labeled datasets to train and refine our DL models, and (3) we manually review and audit the output of our existing DL models trained to classify events of interest. These are addressed below. Data exploration Data exploration is required at the initial phases of the analysis process. Analysts sort and filter the data according to date ranges, time of day, or site location. Additionally and importantly, they also apply conditionals regarding the elemental attribues of the signals. For example, for audio signals, analysts can sort the data frequency ranges, click-like or whistle-like sounds, rising tones or falling tones, repetitive pulses, and so on. Visually, one can specify fast or slow moving objects, large or small objects, the presence of eye-shine, and certain colors. Modalities are combined as well. For example, images can be selected according to time periods when a specified sound occurs. These exploration tools have proven critical for rapidly building datasets to train DL models for new species, and for finding novelty in the data for

which no models yet exist. A roadmap of improvements is envisioned for further enhancing analysts' ability to explore and search large volumes of sensor data, including providing a richer set of elemental signal attributes, a more natural-language interface, and also the ability to search by exemplars. Other exploration tools are more focused on visualizing the data
en masse to identify common signal types or anomalies. For example, analysts can view and graphically select the data in two-dimensional (2D) scatter plots and heat maps, according to multiple attributes at once, such as frequency range vs. time, or object size vs. speed. They can also use state-of-the-art data clustering techniques such as t-SNE [30] to view and select data samples according similarity to other data samples. Viewing data according to such similarity clusters can help alert analysts to the recurring and distinct entities or events in the data.
!
Figure 2: The use of t-SNE data clustering to identify distinct signal types in the data. The input is a 384-dimensional feature vector of elemental signal descriptors. Data is colored according to audit labels, if any. The spectrogram panel on the right corresponds to the currently selected data point.
Finally, our software expedites auditing – the manual review of classification model output. We run existing DL models against our survey data to automatically classify and detect species or events of interest for each project. These models output the relative probability that an event is from a specific data class (usually corresponding to a species or event), and analysts can sort the data accordingly. Analysts are then presented with ranked
pages containing a large number of panels, where each panel contains a visualization of an individual data sample. Using keyboard shortcuts, the panels are efficiently labeled. For images, the visualization consists of image cropping around the object of interest, contrast enhancement, and consecutive frame differences. For audio, 2D spectrograms of an appropriate duration (e.g., 2 seconds) are displayed per panel. This gives a visual representation of the sound clip; distinct sounds have different spectrograms, enabling analysts to quickly learn to visually spot sounds of interest when presented with many sounds simultaneously on a page. They also have the ability to play the audio corresponding to each spectrogram, and view more temporal context around it in order to help with their auditing decision. Periodically, we test the efficacy of UI improvements using A/B testing on a small number of projects. For example, when we enabled analysts to use keyboard shortcuts to audit multiple soun panels on each page, we were able to increase our audit throughput by a factor of two.
4.2.2.Deep Learning for Classification and Detection
Above, we have described how, in order to meet the global scale required for effective biodiversity monitoring, the old methods of relying on workers in the field must be augmented with large scale sensor networks that generate petabytes, growing to exabytes, of data each year. We have summarized how innovations in big data infrastructure and analysis UI can be used to support this data load. The most critical piece, however, is the need for Artificial Intelligence (AI) and ML approaches to reduce the amount of data human analysts need to review to measure the changes in biodiversity (both positive and negative) with greater precision than traditional techniques.
Figure 1: The representation of sounds by spectrograms allowing analysts to view multiple sounds at once for fast auditing
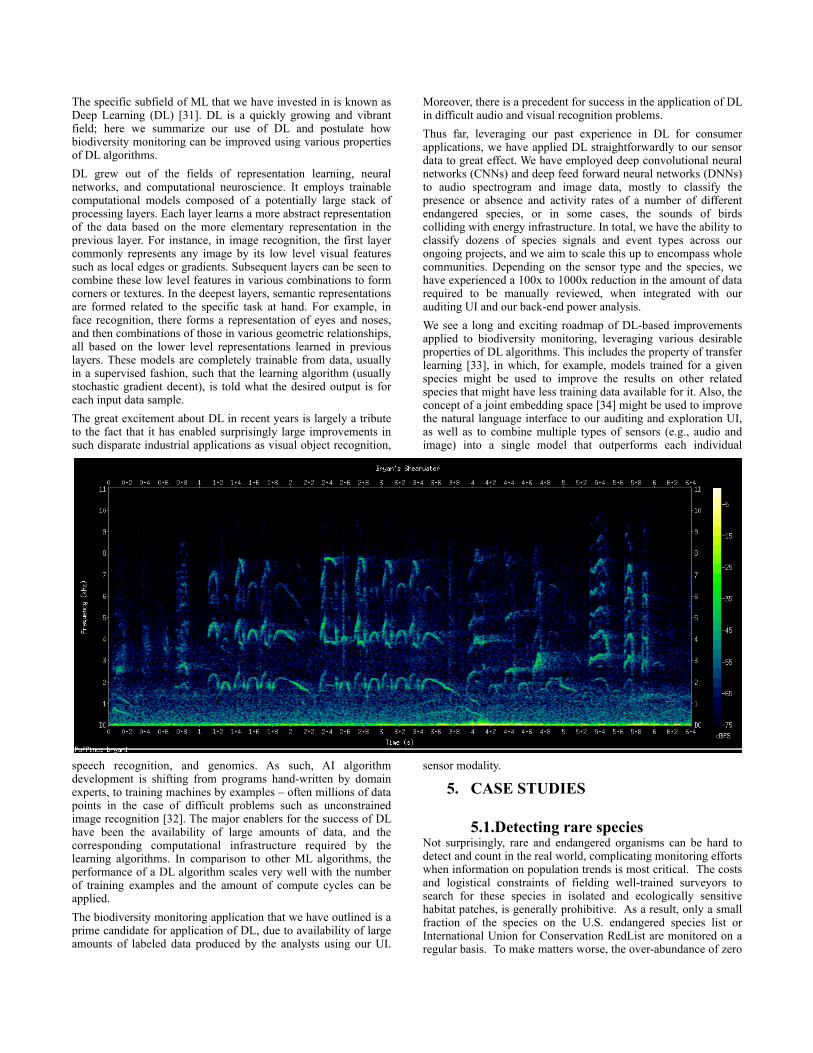
The specific subfield of ML that we have invested in is known as Deep Learning (DL) [31]. DL is a quickly growing and vibrant field; here we summarize our use of DL and postulate how biodiversity monitoring can be improved using various properties of DL algorithms. DL grew out of the fields of representation learning, neural networks, and computational neuroscience. It employs trainable computational models composed of a potentially large stack of processing layers. Each layer learns a more abstract representation of the data based on the more elementary representation in the previous layer. For instance, in image recognition, the first layer commonly represents any image by its low level visual features such as local edges or gradients. Subsequent layers can be seen to combine these low level features in various combinations to form corners or textures. In the deepest layers, semantic representations are formed related to the specific task at hand. For example, in face recognition, there forms a representation of eyes and noses, and then combinations of those in various geometric relationships, all based on the lower level representations learned in previous layers. These models are completely trainable from data, usually in a supervised fashion, such that the learning algorithm (usually stochastic gradient decent), is told what the desired output is for each input data sample. The great excitement about DL in recent years is largely a tribute to the fact that it has enabled surprisingly large improvements in such disparate industrial applications as visual object recognition,
speech recognition, and genomics. As such, AI algorithm development is shifting from programs hand-written by domain experts, to training machines by examples – often millions of data points in the case of difficult problems such as unconstrained image recognition [32]. The major enablers for the success of DL have been the availability of large amounts of data, and the corresponding computational infrastructure required by the learning algorithms. In comparison to other ML algorithms, the performance of a DL algorithm scales very well with the number of training examples and the amount of compute cycles can be applied. The biodiversity monitoring application that we have outlined is a prime candidate for application of DL, due to availability of large amounts of labeled data produced by the analysts using our UI.
Moreover, there is a precedent for success in the application of DL in difficult audio and visual recognition problems. Thus far, leveraging our past experience in DL for consumer applications, we have applied DL straightforwardly to our sensor data to great effect. We have employed deep convolutional neural networks (CNNs) and deep feed forward neural networks (DNNs) to audio spectrogram and image data, mostly to classify the presence or absence and activity rates of a number of different endangered species, or in some cases, the sounds of birds colliding with energy infrastructure. In total, we have the ability to classify dozens of species signals and event types across our ongoing projects, and we aim to scale this up to encompass whole communities. Depending on the sensor type and the species, we have experienced a 100x to 1000x reduction in the amount of data required to be manually reviewed, when integrated with our auditing UI and our back-end power analysis. We see a long and exciting roadmap of DL-based improvements applied to biodiversity monitoring, leveraging various desirable properties of DL algorithms. This includes the property of transfer learning [33], in which, for example, models trained for a given species might be used to improve the results on other related species that might have less training data available for it. Also, the concept of a joint embedding space [34] might be used to improve the natural language interface to our auditing and exploration UI, as well as to combine multiple types of sensors (e.g., audio and image) into a single model that outperforms each individual
sensor modality.
5. CASE STUDIES
5.1.Detecting rare species Not surprisingly, rare and endangered organisms can be hard to detect and count in the real world, complicating monitoring efforts when information on population trends is most critical. The costs and logistical constraints of fielding well-trained surveyors to search for these species in isolated and ecologically sensitive habitat patches, is generally prohibitive. As a result, only a small fraction of the species on the U.S. endangered species list or International Union for Conservation RedList are monitored on a regular basis. To make matters worse, the over-abundance of zero
counts (i.e. surveys where no individuals were observed) makes surveys less statistically robust complicating inference [12]. Finally, human observers may further complicate matters by missing or misidentifying species in the field [16]. Automated approaches to wildlife monitoring, can help to overcome many of these challenges. First, small cheap sensors can increase the spatial and temporal scale of wildlife surveys, increasing the probability that individuals will be detected. This added survey effort can be achieved at a fraction of the cost of equivalent traditional survey effort. The increased survey effort increases statistical power facilitating inference about the status of endangered species, or the effectiveness of management actions. Finally, automated data streams can be archived and re-analyzed in the future to correct errors or ask new questions. Traditional
surveys are typically not re-producible. For example, our automated monitoring approach was a critical tool that helped our collaborators in the Channel Islands National Park detect the first nest of a threatened seabird on Anacapa Island (Ashy Storm-petrel, Oceanodroma homochroa) ten years after the removal of invasive predators [35]. Acoustic monitoring was also a key tool that helped collaborators in Japan detect the first known breeding site for Bryans Shearwater (Puffinus bryani) a newly discovered species [36] (see Figure 2).
5.2.Monitoring populations through time
As natural habitats become more fragmented by human development, species that are currently common may begin to decline. Automated monitoring approaches carried out over regional scales can improve the power of long-term monitoring programs to detect population trends. This, in turn, can provide managers and policy makers with early warnings that species are in in decline and can initiate mitigation before species become endangered.
We are working with wildlife agencies in Queensland, Australia and the U.S. to test and deploy regional scale automated monitoring projects in the Great Barrier Reef Marine Park, and the California Coastal National Monument, reserves spread over huge spatial scales. Pilot work in Australia has confirmed that our automated approach can provide population data with the required statistical power at a lower cost than the traditional approach.
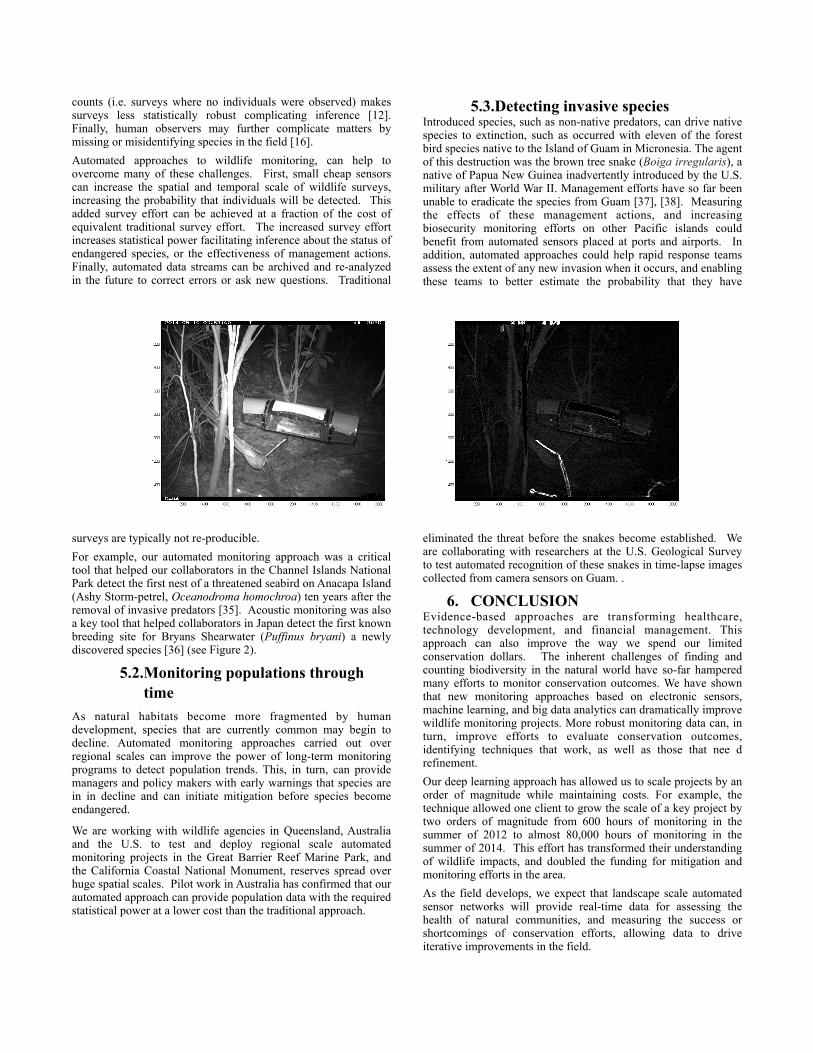
5.3.Detecting invasive species Introduced species, such as non-native predators, can drive native species to extinction, such as occurred with eleven of the forest bird species native to the Island of Guam in Micronesia. The agent of this destruction was the brown tree snake (Boiga irregularis), a native of Papua New Guinea inadvertently introduced by the U.S. military after World War II. Management efforts have so far been unable to eradicate the species from Guam [37], [38]. Measuring the effects of these management actions, and increasing biosecurity monitoring efforts on other Pacific islands could benefit from automated sensors placed at ports and airports. In addition, automated approaches could help rapid response teams assess the extent of any new invasion when it occurs, and enabling these teams to better estimate the probability that they have
eliminated the threat before the snakes become established. We are collaborating with researchers at the U.S. Geological Survey to test automated recognition of these snakes in time-lapse images collected from camera sensors on Guam. .
6. CONCLUSION Evidence-based approaches are transforming healthcare, technology development, and financial management. This approach can also improve the way we spend our limited conservation dollars. The inherent challenges of finding and counting biodiversity in the natural world have so-far hampered many efforts to monitor conservation outcomes. We have shown that new monitoring approaches based on electronic sensors, machine learning, and big data analytics can dramatically improve wildlife monitoring projects. More robust monitoring data can, in turn, improve efforts to evaluate conservation outcomes, identifying techniques that work, as well as those that nee d refinement. Our deep learning approach has allowed us to scale projects by an order of magnitude while maintaining costs. For example, the technique allowed one client to grow the scale of a key project by two orders of magnitude from 600 hours of monitoring in the summer of 2012 to almost 80,000 hours of monitoring in the summer of 2014. This effort has transformed their understanding of wildlife impacts, and doubled the funding for mitigation and monitoring efforts in the area. As the field develops, we expect that landscape scale automated sensor networks will provide real-time data for assessing the health of natural communities, and measuring the success or shortcomings of conservation efforts, allowing data to drive iterative improvements in the field.

7. ACKNOWLEDGMENTS
8. REFERENCES [1] R. Costanza, R. d’Arge, R. de Groot, S. Farber, M.
Grasso, B. Hannon, K. Limburg, S. Naeem, R. V. O’Neill, J. Paruelo, R. G. Raskin, P. Sutton, and M. van den Belt, “The value of the world’s ecosystem services and natural capital,” Nature, vol. 387, no. 6630, pp. 253–260, May 1997.
[2] R. Costanza, R. de Groot, P. Sutton, S. van der Ploeg, S. J. Anderson, I. Kubiszewski, S. Farber, and R. K. Turner, “Changes in the global value of ecosystem services,” Glob. Environ. Chang. - Hum. Policy Dimens., vol. 26, pp. 152–158, 2014.
[3] A. Balmford, A. Bruner, P. Cooper, R. Costanza, S. Farber, R. E. Green, M. Jenkins, P. Jefferiss, V. Jessamy, J. Madden, K. Munro, N. Myers, S. Naeem, J. Paavola, M. Rayment, S. Rosendo, J. Roughgarden, K. Trumper, and R. K. Turner, “Economic reasons for conserving wild nature.,” Science, vol. 297, no. 5583, pp. 950–953, 2002.
[4] “Convention on Biological Diversity, Framework for monitoring implementation of the achievement of the 2010 target and integration of targets into the thematic programmes of work, COP 8 Decision VIII/15,” 2006.
[5] A. Waldron, A. O. Mooers, D. C. Miller, N. Nibbelink, D. Redding, and T. S. Kuhn, “Targeting global conservation funding to limit immediate biodiversity declines,” Proc. Natl. Acad. Sci., vol. 110, no. 29, pp. 12144–12148, 2013.
[6] S. H. M. Butchart, M. Walpole, B. Collen, A. van Strien, J. P. W. Scharlemann, R. E. a Almond, J. E. M. Baillie, B. Bomhard, C. Brown, J. Bruno, K. E. Carpenter, G. M. Carr, J. Chanson, A. M. Chenery, J. Csirke, N. C. Davidson, F. Dentener, M. Foster, A. Galli, J. N. Galloway, P. Genovesi, R. D. Gregory, M. Hockings, V. Kapos, J.-F. Lamarque, F. Leverington, J. Loh, M. a McGeoch, L. McRae, A. Minasyan, M. Hernández Morcillo, T. E. E. Oldfield, D. Pauly, S. Quader, C. Revenga, J. R. Sauer, B. Skolnik, D. Spear, D. Stanwell-Smith, S. N. Stuart, A. Symes, M. Tierney, T. D. Tyrrell, J.-C. Vié, and R. Watson, “Global biodiversity: indicators of recent declines.,” Science, vol. 328, no. 5982, pp. 1164–1168, May 2010.
[7] D. P. McCarthy, P. F. Donald, J. P. W. Scharlemann, G. M. Buchanan, A. Balmford, J. M. H. Green, L. a Bennun, N. D. Burgess, L. D. C. Fishpool, S. T. Garnett, D. L. Leonard, R. F. Maloney, P. Morling, H. M. Schaefer, A. Symes, D. a Wiedenfeld, and S. H. M. Butchart, “Financial Costs of Meeting Global Biodiversity Conservation Targets: Current Spending and Unmet Needs,” Science (80-. )., vol. 338, no. 6109, pp. 946–949, 2012.
[8] W. J. Sutherland, A. S. Pullin, P. M. Dolman, and T. M. Knight, “The need for evidence-based conservation,” Trends Ecol. Evol., vol. 19, no. 6, pp. 305–308, 2004.
[9] A. S. Pullin and T. M. Knight, “Doing more good than harm - Building an evidence-base for conservation and
environmental management,” Biol. Conserv., vol. 142, no. 5, pp. 931–934, 2009.
[10] M. Keene and A. S. Pullin, “Realizing an effectiveness revolution in environmental management,” J. Environ. Manage., vol. 92, no. 9, pp. 2130–2135, 2011.
[11] N. G. Yoccoz, J. D. Nichols, and T. Boulinier, “Monitoring of biological diversity in space and time,” Trends Ecol. Evol., vol. 16, no. 8, pp. 446–453, 2001.
[12] W. L. Thompson, Sampling rare or elusive species: concepts, designs, and techniques for estimating population parameters. 2004.
[13] C. Wood, B. Dipper, and C. Jones, “Auditing the Assessment of the Environmental Impacts of Planning Projects,” J. Environ. Plan. Manag., vol. 43, no. 1, pp. 23–47, 2000.
[14] D. B. Lindenmayer, M. P. Piggott, and B. a. Wintle, “Counting the books while the library burns: Why conservation monitoring programs need a plan for action,” Front. Ecol. Environ., vol. 11, no. 10, pp. 549–555, 2013.
[15] C. J. Legg and L. Nagy, “Why most conservation monitoring is, but need not be, a waste of time,” J. Environ. Manage., vol. 78, no. 2, pp. 194–199, 2006.
[16] J. B. Theodore R. Simons, Kenneth H. Pollock, John M. Wettroth, Mathew W. Alldredge, Krishna Pacifici, “Sources of Measurement Error, Misclassification Error, and Bias in Auditory Avian Point Count Data,” in Modeling Demographic Processes in Marked Populations, 2009, pp. 237–254.
[17] B. T. McClintock, L. L. Bailey, K. H. Pollock, and T. R. Simons, “Experimental Investigation of Observation Error in Anuran Call Surveys,” J. Wildl. Manage., vol. 74, no. 8, pp. 1882–1893, 2010.
[18] E. S. Bridge, K. Thorup, M. S. Bowlin, P. B. Chilson, R. H. Diehl, R. W. Fléron, P. Hartl, R. Kays, J. F. Kelly, W. D. Robinson, and M. Wikelski, “Technology on the Move: Recent and Forthcoming Innovations for Tracking Migratory Birds,” Am. Inst. Biol. Sci., vol. 61, no. 9, pp. 689–698, 2011.
[19] S. M. Tomkiewicz, M. R. Fuller, J. G. Kie, and K. K. Bates, “Global positioning system and associated technologies in animal behaviour and ecological research.,” Philos. Trans. R. Soc. Lond. B. Biol. Sci., vol. 365, no. 1550, pp. 2163–2176, 2010.
[20] C. B. Thaxter and N. H. K. Burton, “High Definition Imagery for Surveying Seabirds and Marine Mammals : A Review of Recent Trials and Development of Protocols,” Br. Trust Ornithol. Rep. Comm. by Cowrie Ltd., no. November, 2009.
[21] R. Bagree, V. R. Jain, A. Kumar, and P. Ranjan, “TigerCENSE: Wireless image sensor network to monitor tiger movement,” Lect. Notes Comput. Sci. (including Subser. Lect. Notes Artif. Intell. Lect. Notes Bioinformatics), vol. 6511 LNCS, pp. 13–24, 2010.
[22] P. T. Fretwell, M. a. LaRue, P. Morin, G. L. Kooyman, B. Wienecke, N. Ratcliffe, A. J. Fox, A. H. Fleming, C. Porter, and P. N. Trathan, “An emperor penguin population estimate: The first global, synoptic survey of a

species from space,” PLoS One, vol. 7, no. 4, p. e33751, 2012.
[23] C. Vermeulen, P. Lejeune, J. Lisein, P. Sawadogo, and P. Bouché, “Unmanned aerial survey of elephants.,” PLoS One, vol. 8, no. 2, p. e54700, Jan. 2013.
[24] R. Schiffman, “Drones Flying High as New Tool for Field Biologists,” Science (80-. )., vol. 344, no. May, pp. 459–459, 2014.
[25] L. E. Ogden, “Drone Ecology,” Bioscience, vol. 63, no. 9, pp. 776–776, 2013.
[26] F. Mattern and C. Floerkemeier, “From the internet of computers to the internet of things,” pp. 242–259, Jan. 2010.
[27] M. W. McKown, M. Lukac, A. Borker, B. Tershy, and D. Croll, “A wireless acoustic sensor network for monitoring wildlife in remote locations,” J. Acoust. Soc. Am., vol. 132, no. 3, p. 2036, 2012.
[28] R. Faludi, Building Wireless Sensor Networks: with ZigBee, XBee, Arduino, and Processing. “O’Reilly Media, Inc.,” 2010.
[29] M. Zaharia, M. Chowdhury, M. J. Franklin, S. Shenker, and I. Stoica, “Spark: Cluster Computing with Working Sets,” HotCloud’10 Proc. 2nd USENIX Conf. Hot Top. cloud Comput., p. 10, 2010.
[30] L. Van Der Maaten and G. Hinton, “Visualizing Data using t-SNE,” J. Mach. Learn. Res., vol. 9, pp. 2579–2605, 2008.
[31] Y. LeCun, Y. Bengio, and G. Hinton, “Deep learning,” Nature, vol. 521, no. 7553, pp. 436–444, 2015.
[32] O. Russakovsky and L. Fei-Fei, Trends and Topics in Computer Vision, vol. 6553. Berlin, Heidelberg: Springer Berlin Heidelberg, 2012.
[33] D. Ciresan, U. Meier, and J. Schmidhuber, “Transfer Learning for Latin and Chinese Characters with Deep Neural Networks,” Neural Networks (IJCNN), 2012 Int. Jt. Conf., pp. 1–6, 2012.
[34] A. Karpathy and L. Fei-Fei, “Deep visual-semantic alignments for generating image descriptions,” arXiv Prepr. arXiv1412.2306, 2014.
[35] M. W. McKown, B. Tershy, and D. Croll, “Passive acoustic surveys for Ashy Storm-Petrel vocal activity on Anacapa Island in 2011 and 2012, Conservation Metrics, Inc., Internal Report,” 2012.
[36] K. Kawakami, M. Eda, K. Horikoshi, and H. Suzuki, “Bryan’s Shearwaters Have Survived on the Bonin Islands, Northwestern Pacific,” Condor, vol. 114, no. 3, pp. 507–512, 2012.
[37] J. Engbring and T. H. Fritts, “Demise of an insular avifauna: the brown tree snake on Guam,” Trans. West. Sect. Wildl. Soc., vol. 24, pp. 31–37, 1988.
[38] G. H. Rodda, T. H. Fritts, and P. J. Conry., “Origin and population growth of the brown tree snake, Boiga irregularis, on Guam,” Pacific Science, vol. 46, no. 1. University of Hawai’i Press, pp. 46–57, 01-Jan-1992.