global alliance for clean cookstoves...haiti’s growth has been erratic over the past decade, and...
TRANSCRIPT

1
Global Alliance for Clean CookstovesHaiti—Cookstoves and Fuels Market Assessment
Preliminary Report

2
Introduction
▪ The “Haiti Cookstoves and Fuels Market Assessment” was conducted by the Global Alliance for Clean
Cookstoves (“the Alliance”) based on consultations with cookstoves and fuels manufacturers and
distributors, NGOs, government representatives, academics, donors, and other in-country
stakeholders. The work was supported by Global Affairs Canada, for whom the Alliance is designing a
comprehensive strategy and action plan for catalyzing the clean cookstoves and fuels market in Haiti.
▪ The Alliance has completed market assessments on the cookstoves and fuel sector in 23 countries.
These assessments have:
▪ Enhanced sector market intelligence and knowledge;
▪ Contributed to country and region prioritization for the Alliance;
▪ Supported stakeholders in developing country action plans for clean cooking.
▪ This document is meant to provide a snapshot of the cookstoves sector in Haiti in terms of supply,
demand, and the enabling environment, and begins to highlight emerging opportunities and
challenges. It can and should be used in conjunction with a number of research papers, consumer
surveys, and other sources to enhance the sector’s understanding of the market. It builds on the
previous research and work of many organizations, including the Government of Haiti’s Bureau of
Mines and Energy, Ministry of Environment, USAID, the World Bank, UNEP, and many others.
▪ In this first phase of market research, Alliance staff led the data collection and analysis on Haiti over a
period of 3 months using a combination of literature review, dataset analysis, key informant interviews,
and field visits throughout Haiti. The process was designed to build on and synthesize the research
that has already been conducted in the sector (see bibliography).

3
Executive summary
Fuel usage and trends
Sector mapping
Market assessment approach
Macro environment
Cookstoves and fuels supply and financing
Table of Contents
Cookstoves and fuels policy environment
Consumer segmentation
Environmental, health, and social impact

4
Executive Summary (1/3)
Improved cookstoves entered the market in the 1980s with the Recho Mirak charcoal stove. The
introduction of the Recho Mirak was initially successful, however the project faced resource constraints
and was plagued by counterfeiting. Despite several subsequent efforts to revive the Recho Mirak over
the years, stove production remains largely artisanal. Repeated natural disasters lead to short-term
influxes of ICS during times of crisis, but did not lead to sustainable market development.
Solid fuels remain a critical part of the energy formula for almost all households. 93% of
households (equivalent to ~2.2 million households) use wood or charcoal as their primary source of
cooking fuel. More than 80% of urban households use charcoal as their primary cooking fuel, compared
to only 24% of rural households. Firewood use shows similar differences between urban and rural
consumers – 72% of rural households use wood as their primary cooking fuel, versus only 7.1% of
urban households. Only 3% of total households (6.2% of urban households) use LPG, natural gas, or
biogas. Less than 1% cook with electricity, kerosene, or other improved fuel sources (DHS, 2012).
The importance of the charcoal value chain is a distinguishing feature of the Haitian market.
Charcoal production is a significant source of income for rural households, women vendors, and those
who transport the charcoal to urban markets. Initiatives that encourage fuel switching need to consider
the potential negative consequences for this value chain.
Historically, many have considered Haiti to be a hotspot for the use of non-renewable biomass
and attributed deforestation and degradation to woodfuel harvesting for cooking fuel. Globally,
the fraction of non-renewable biomass (fNRB) is 27-34%. While there is significant debate about the
fNRB in Haiti, a research analysis (2016) by Stockholm Environment Institute using the best available
data determined the fNRB to be 9%. Further research, including more robust inputs, would deepen
understanding of the link between the use of solid fuels and environmental degradation.

5
Executive Summary (2/3)
The use of solid fuels and inefficient cookstoves has a significant impact on health outcomes
and livelihoods, particularly for women. Household air pollution (HAP) from cooking is the second
leading risk factor for mortality in Haiti – the only greater risk factor for mortality in Haiti is high blood
pressure (GBD, 2015). In 2015, over 8,000 deaths occur due to illness attributable to HAP from cooking
with solid fuels. Women account for approximately 58% of these deaths, and 13% of HAP-attributable
deaths are among children under 5 (IHME, 2015). In addition to health impacts, inefficient cookstoves
and cooking practices result in a significant unpaid work burden for women.
Based on the overall population, current cookstove ownership and fuel use patterns, and
income segments, there is a clear market opportunity for cleaner and more efficient cookstoves
and fuels – but there are substantial challenges to realizing that opportunity. The overall market
size in Haiti is 2.4 million households (HHs). As others have observed, urban charcoal purchasers are
a critical segment to address – a market of over 1 million HHs. A slightly smaller and more challenging
market would be rural firewood users who make up 42.7% of the market – the geographic spread of this
population and their comparative poverty make this segment more challenging to reach than the urban
consumers. A key challenge for all segments will be to ensure that improved cookstoves and fuels are
affordable for the end-consumer (either by reducing the price point or by enhancing the availability of
consumer financing).

6
Executive Summary (3/3)
Clean cooking enterprises in the biomass space, both for-profit and non-profit, are small and
early-stage, face significant business model challenges around supply chain, product
demand/consumer behavior, ability to pay, etc. The sector comprises a small number of low-
profit/low-growth trajectory, highly risky enterprises. Due to the riskiness of investing in the sector,
access to traditional capital remains a key challenge for all enterprises.
Despite various projects over the past 30 years implemented by local and international
organizations, governments, and the private sector, the Haitian market for clean cookstoves and
fuels remains nascent. Since the 1980s, there have been over 20 cookstoves and fuels projects and
national strategies of various scope and scale. Though many plans and projects were well designed, a
significant number were never implemented, and several terminated early due external factors. Yet,
even when projects continued to the end of their timelines, the majority found that they had fallen short
of projected impacts and expectations. The limited literature evaluating these projects and strategies in
combination with key informant interviews identified three common barriers to realizing sustained
impacts—price, limited timeframes, and lack of institutions and regulation.

7
Executive summary
Fuel usage and trends
Sector mapping
Market assessment approach
Macro environment
Cookstoves and fuels supply and financing
Table of Contents
Cookstoves and fuels policy environment
Consumer segmentation
Environmental, health, and social impact

8
We conducted the assessment across six dimensions.
Macro
environment
Fuel usage and
trends
Environmental,
health & social
impact
Cookstove and
fuels supply
and financing
Consumer
segmentation
Cookstove and
fuels policy
environment
What are the
governmental, economic,
social, and demographic
forces shaping Haiti?
What types of fuels do
Haitian consumers use,
how much do they use
and what are the
implications of this on the
cookstove sector?
What are the primary
environmental, health, and
social impacts of inefficient
and unclean cookstoves in
Haiti?
What is the technology
landscape for cookstoves
and fuels in Haiti, who are
the major players and what
are the challenges they
face?
Who are the key customer
segments for cookstoves
and what are the
opportunities and
challenges of addressing
their preferences?
How have government
agencies, multilaterals and
donors approached
cookstoves and what are
their likely future policy
priorities?

9
We conducted a literature review of research and project assessments,
interviewed key stakeholders, and conducted field visits throughout Haiti.
This market assessment was undertaken over the course of 3 months. It builds on existing
work in the sector and seeks to consolidate findings.
Key sources for this market assessment include:
• Data from a variety of surveys including information on household size, demographics,
cookstove use, fuel use, and other indicators. Key sources included: the Global Burden of
Diseases, Injuries (IHME); Risk Factors Study (GBD); Demographic and Health Surveys (DHS);
and World Bank World Development Indicators.
• Research from academic papers, dissertations, and industry briefs.
• Interviews with stakeholders including local and international cookstoves and fuels
manufacturers and distributors, government representatives, donors,
energy/environment/agriculture academics, NGOs, and other key stakeholders.
• Direct observation of traditional charcoal production sites, clean cookstove and fuel
manufacturing facilities, local markets, school kitchens, and bakeries throughout Port-au-Prince,
Port Salut, Les Anglais, La Cawane, Gonaives, and Cap-Haitien.
Some notes on the data and analysis:
• For a detailed understanding of the Haitian market and demographics, we relied on data from the 2013 Global Burden of
Diseases, Injuries, and Risk Factors Study (GBD), the 2012 Haiti Demographic and Health Survey (DHS), and the 2014 World
Bank World Development Indicators. We accept that there may be errors and variance in these data sets and this analysis can
be updated with improved data if/when it comes available.
• In some analyses, totals may not add up exactly (i.e., percentages may not add up to exactly 100%) due to rounding.
10
Executive summary
Fuel usage and trends
Sector mapping
Market assessment approach
Macro environment
Cookstoves and fuels supply and financing
Table of Contents
Cookstoves and fuels policy environment
Consumer segmentation
Environmental, health, and social impact

11
• The country is divided into 10 departments (states): Artibonite, Centre, Grand'Anse,
Nippes, Nord, Nord-Est, Nord-Ouest, Ouest, Sud, and Sud-Est.
• These 10 departments are further divided into 42 arrondissements (districts), which are
further divided into 145 communes and 571 communal sections.
• After the October 2015 elections were overturned due to allegations of voter fraud, Jocelerme
Privert served as interim president during 2016.
• The October 2016 elections were delayed due to Hurrican Matthew until November 2016 during
which Jovenel Moise of the Tet Kale Party won the presidency with 55.6% of the vote.
• President Moise was a business man prior to taking office. He ran a banana export company and
campaigned in part on a rural development platform.
• The new government was sworn in under the leadership of Prime Minister Jack Guy Lafontant in
March 2017.
•Working with the government will be an important component of any nation-wide clean
cookstove and fuel strategy. The strategy should seek to align with the new priorities of
The Bureau of the Mines and Energy, the Ministry of Environment, the Ministry of
Agriculture, and the Ministry of Women.
CIA Factbook, 2016; Government of Haiti, 2016; Haiti Libre, 2015; key informant interviews.
• Haiti is a semi-presidential republic. The President is the head of the state and appoints the Prime
Minister who is head of the government. There is a bicameral legislature of the Senate and the
Chamber of Deputies.
• Presidential elections are held every five years; the last election was held on 25 November 2015,
but a runoff election scheduled for 24 April 2016 was postponed.
After delayed elections, a new government took power in 2017 and each ministry
received a roadmap to guide policy priorities under the new administration.
Working with
the government
Current government
Administrative
structure
Political
structure

12
Haiti’s growth has been erratic over the past decade, and has been impeded by
natural disasters and political upheaval.
• After a 5.5% contraction in GDP in 2010 due to the
earthquake, Haiti experienced from 2011 to 2015 a real
growth rate averaging 3.4% and a per capita GDP
growth of 2.0%, spurred in part by high levels of
reconstruction aid and remittances.
• Overall economic activity last year only expanded by
1.7 percent, down from 2.8 percent the previous year.
This expansion was supported by relatively strong
growth in manufacturing and hospitality (growing at 3.5
percent and 5.0 percent, respectively), but was
hampered by agriculture (contracting by 3.5 percent).
• Inflation has accelerated to 14.4%, mostly driven by
higher local food prices following droughts. Large
influxes of remittances can also drive inflation.
The GDP of Haiti is $8.713 billion with a per capita GDP per capita of $846 in 2014. Haiti ranks 168 out of 188
countries on the United Nations Human Development Index (HDI). More than 6 million out of 10.4 million (59%)
Haitians live under the national poverty line of $2.42 per day.
World Bank Data, 2014
2.7%
201420122010200820062004
-3.5% 2.3% 0.8% -5.5% 2.9%Growth rate:
-6
-5
-4
-3
-2
-1
0
1
2
3
4
2004 2006 2008 2010 2012 2014
GD
P g
row
th (
annual %
)
Year
Haiti GDP growth rate (annual %), 2004-2014
2010 Earthquake
2004 Tsunami and coup d'état
2006 Democratic elections
2008 Food riots
& tropical storms
2012-2014 Slow recovery

13
Wealth Quintiles and Residence
DHS, 2012
Wealth Quintiles by Urban/Rural Residence
0%
10%
20%
30%
40%
50%
60%
70%
80%
90%
100%
Lowest Second Middle Fourth Highest
Urban Rural
Wealth Quintile Breakdown in Urban Areas
Second Quintile
1%
Middle Quintile
19%
Fourth Quintile
37%
Highest Quintile
43%
Wealth Quintile Breakdown in Rural Areas
Lowest Quintile
33%
Second Quintile
33%
Middle Quintile
21%
Fourth Quintile
8%
Highest Quintile
5%The Haiti DHS 2012 data shows that, in general,
poorer families live in rural areas while wealthier
families live in urban areas.
Note: Some irregularities were found with these data when
further analysis was conducted. While the specific statistics
presented may be somewhat flawed or outdated, we believe
that the general trends shown on this slide hold true.

14
Wealth Quintiles and Administrative Districts
DHS, 2012
Wealth Quintiles in Administrative Districts
Population Size of Administrative Districts
L'ouest
L'artibonite
Nord
Sud
Centre
Nord-Ouest
Sud-Est
Grande Anse
Nord-Est
Nippes
0 10 20 30 40 50 60 70 80 90 100
L'Ouest - P-a-P metro
L'Ouest - outside P-a-P
Nord
Sud
Centre
Nord-Ouest
Sud-est
Grande Anse
Nord-Est
Artibonite
Nippes
Lowest Quintile
Second Quintile
Middle Quintile
Fourth quintile
Highest Quintile

15
Formal banking sector
The commercial banking sector provides formal credit to only about 1% of the Haitian population
(approx. 90,000 people). Haiti’s central bank, the Banque de la République d’Haïti, oversees nine
commercial banks and two foreign banks operating in the country (see Annex F). Most banking takes
place in the capital city of Port-au-Prince. For large scale importers, manufacturers, and distributors of
LPG, financing from local banks and private investors is available and financing is not a major
constraint, but it is a limiting factor for small businesses.
Microfinance institutions (MFIs)
There are five active Microfinance Institutions (MFIs) in Haiti (ACME, FINCA-HTI, Fonkoze, MCN,
SOGESOL) that in 2009 reported 96,315 borrowers and 155,517 savers, with savings totaling
US$11.8 million and credit totaling US$50 million. The average loan per borrower was about US$500.
Credit cooperatives
There are over 220 credit cooperatives in Haiti, which in 2009 served more than 340,000 Haitians, with
savings totaling US$36.1 million and credit totaling US$35.5 million.
Remittances
Remittances from the Haitian diaspora (approximately 1 million people) make up about 20% of Haitian
GDP and are an important source of finance. In 2014, Haitians received almost $2 billion in
remittances.
Mobile money
As of 2015, only about 60,000 Haitians held mobile money accounts.
USAID/Nexant, 2010; World Bank, 2014; Mercy Corps, 2015.
Financial Sector Overview
16
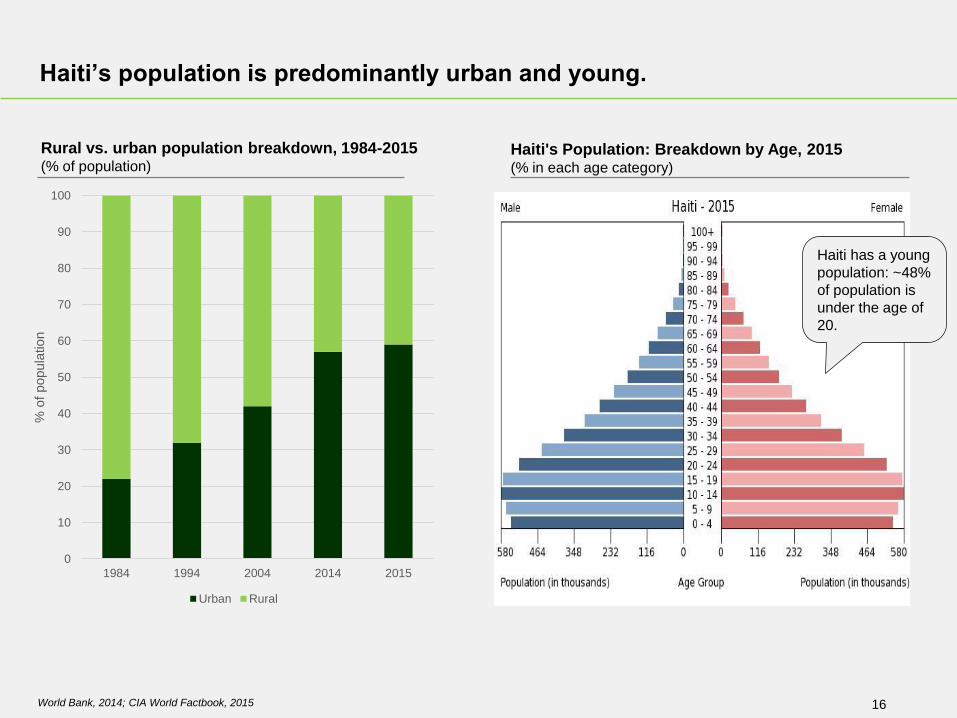
Rural vs. urban population breakdown, 1984-2015(% of population)
World Bank, 2014; CIA World Factbook, 2015
Haiti’s population is predominantly urban and young.
Haiti's Population: Breakdown by Age, 2015(% in each age category)
Haiti has a young
population: ~48%
of population is
under the age of
20.
0
10
20
30
40
50
60
70
80
90
100
1984 1994 2004 2014 2015
% o
f popula
tion
Urban Rural

17World Bank, 2014; HRW, 2014; World Bank, 2015; GBD, 2010
While literacy rates are improving, a lack of education infrastructure continues
to hamper Haiti’s growth trajectory.
Although it has comparably low levels
of literacy, Haiti is making an effort to
educate its younger generations…
…however, the infrastructure to
support the change is
inadequate
Primary school completion(% of children enrolled)
Pupil teacher ratio in primary
schools - 2014
• Lack of public schools: 90% of Haiti’s schools
are private, and parents spend on average $130
every year to enroll their children.
• Lack of trained teachers: Less than 40% of
teachers have gone through a training program.
• Lack of basic infrastructure: Nearly 60% of
Haiti’s schools have no toilets and more than
three-quarters lack access to water.
Literacy rate (Age 15+)

18
Electricity consumption per capita(Electricity consumption in kilowatt-hours per capita)
World Bank, 2015; Google Data Visualizer
Haiti is largely reliant on fossil fuels for electricity generation. Reliable
access is a challenge, and household use remains low.
70%
30%
Source of electricity(% of Megawatts)
Oil and gas
Hydroelectric
Access to electricity is non-existent for the
majority of Haitian households.
Haiti relies heavily on fossil fuels as its main
source of electricity.
~70% of Haiti’s
electricity is
obtained from
oil and gas

19
Haiti’s communications infrastructure relies primarily on mobile phones,
radio, and television.
DHS, 2012
Access to mass communication modes - Rural(% of households)
1
46
5
11
68
Telephone
(land line)
Radio Print
media
Television
(TV)
Mobile
phone
Access to mass communication modes - Urban(% of households)
91
56
20
67
3
Mobile
phone
Television
(TV)Print
media
RadioTelephone
(land line)
Mobile phone penetration has increased
exponentially in the past decade. With the pace of
technological change, mobile phones will likely be
used even more frequently to access other
communication mediums (i.e., internet, FM radio,
etc.)

20CIA Factbook, 2016; IDB, 2015
Haiti’s transportation infrastructure is extremely limited – it ranks 156th out of
223 countries.
Roadways
• Only 18% of Haiti’s
roads are paved (768
km of paved roads,
out of 4,266km of
roads total). In
comparison, the
Dominican Republic
has 9,833km of
paved roads.
Railways Waterways Airways
• There are no
functioning railways
in Haiti. The
Dominican Republic
has 496km of
railways.
• Haiti has 4 main
ports: Cap-Haitien,
Gonaives, Jacmel,
and Port-au-Prince.
This is comparable
to 5 in the
Dominican Republic.
• Haiti has 4 airports
with paved runways.
In contrast, the
Dominican Republic
has 16.
Cu
rre
nt
sit
uati
on
Go
ve
rnm
en
t a
nd
do
no
r p
rio
riti
es The Inter-American Development Bank (IDB) approved a $27 million
grant in May 2015 to help modernize and improve the management
of Haiti’s roads and ports, in cooperation with the Ministry of
Economics and Finance. The project was projected to be complete
by the end of 2016.

21World Bank data, 2016; Google Public Data Visualizer, 2016.
The overall health landscape in Haiti lags when compared to other developing
countries, but it is a key priority in national policy.
While improving, key health
indicators in Haiti are lower than
other developing countries…
… and the infrastructure
required to address these issues
remains inadequate
The government has made health a
national priority area.
Physicians(per 1,000 people)
Hospital beds(per 1,000 people)
Public health expenditure(% of total GDP)
Mortality rate – under age 5 (per 1,000 live births)
Maternal mortality ratio(per 100,000 live births) )

22UNICEF, 2012; World Bank, 2012; UNDP, 2015
Gender equality statistics
UNDP gender inequality index 142 out of 188 countries (2015 index)
% of women in national government 3.5%
Sex ratio 1.01 male per 1 female
Maternal mortality ratio 630 deaths per 100,000 live births
Adolescent fertility rate
(births per 1,000 girls aged 15-19)
77 (rural); 53 (urban)
Male Female
Literacy
rate by age
bracket
(DHS, 2012)
15-19 years 82.9 86.2
20-29 years 84.7 82.8
30-39 years 77.3 65.7
40-49 years 61.5 46.2
Women manage 40% of the country’s households and around 50% of Haitian women engage in
economic activity outside the home to support their families. Additionally, more than 75% of the
informal economy is comprised of women.
Women have significant decision-making ability at the household level, but
are less represented in political and managerial spheres.
• The 2014 gender parity index (GPI) was 0.99 for primary school enrolment
and 0.81 for tertiary enrolment.
• 17.5% of women are married by the age of 18.
• Female participation in labour force is 63.2% overall.
Legal frameworks on gender
YES Law prohibits or invalidates child or early
marriage
YES Law mandates paid or unpaid maternity
leave
YES Mothers are guaranteed an equivalent
position after maternity leave
YES Non-pregnant and non-nursing women can
do the same jobs as men
NO Law mandates equal remuneration for
females and males for work of equal value
NO Law mandates nondiscrimination based on
gender in hiring
NO Legislation exists on domestic violence
Gender-based violence
• 15% of women experienced domestic violence
during 2012

23
• The most important food in Haiti is rice (diri), Other
important grains include corn, wheat, and millet
(which the poorest families eat).
• Beans are another important component of the
Haitian diet, and are consumed on a daily basis with
rice as part of most families’ main meal at noon.
• Poultry, especially chicken, is consumed more
frequently than other types of meat.
• In some households, the noontime meal is the only
one eaten by adults, given the lack of money to cook
a meal for the entire family.
• While breakfast or supper need fairly short cooking
time, the midday meal requires a longer cooking
time, particularly in the case of mashed dry peas
(sos pwa). Meals such as meat stew, braised
vegetables and braised “leaves” with meat take a
longer time to prepare.
• Regional variation is limited. Cashews are more
prominently used in the North around Cap Haitien,
and fish and seafood is more often eaten in the
South near Jacmel and Jérémie.
Food types
There is great diversity in food types, flavors and preparation styles, but
there are several common cooking habits across the country.
Cooking habits
ESMAP, 2007; Food Cultures of the World, 2011
• Most cooks are women and girls. Women and girls
are responsible for the majority of cooking, which
adds to their unpaid care work burden.
• Wealthy families often hire cooks, while others have
restaveks (unpaid child servants that help cook).
• Most urban families cook seated with one-burner
stoves called rechos, fuelled with small gas or
propane tanks or charcoal (charbon). Rural
households typically cook with firewood and a three-
stone fire.
• The most used cooking techniques are boiling,
frying, sautéing, and grilling.
• Cast aluminum rice pots (chodye) are used for
cooking nearly every meal. The majority of
households also use a narrow, thin bean pot (bom)
which is used for cooking beans and heating water
for bathing or boiling for water purification.
• Breakfast is typically eaten between 6:30am and
7:30am, and is consumed with sweetened coffee
with milk. Food can include bread with peanut
butter, cornmeal mush, oatmeal, spaghetti, or boiled
plantains and eggs.
• Lunch is usually eaten around noon during the
midday break that lasts several hours. It is usually
rice and beans, with ham hocks, peas, or meat in a
sauce if the family can afford it.
• Dinner is usually small. It consists of oatmeal,
plantain puree, or boiled sweet potatoes with rice
and beans.
24
Executive summary
Fuel usage and trends
Sector mapping
Market assessment approach
Macro environment
Cookstoves and fuels supply and financing
Table of Contents
Cookstoves and fuels policy environment
Consumer segmentation
Environmental, health, and social impact

25
Environmental and Climate Impacts
Haiti has long been an archetype of
woodfuel driven deforestation. However,
recent analysis indicates that woodfuel
harvesting is not a contributor.
Clearing for agricultural production is
considered the dominant driver of past
deforestation in Haiti.
By examining higher resolution images that
better capture the patchiness of Haiti’s
existing tree cover, Churches and
colleagues find that forest cover in Haiti
could exceed 30% (Churches, Wampler et
al. 2014), and other analyses support these
findings (Tarter, 2016).
Today, there is no indication that woodfuel
harvesting contributes to deforestation.
Despite the loss of much of the country’s
original forest cover, Haitians continue to
meet their wood and charcoal demand. It is
likely though, that in some areas woodfuel
harvesting is contributing to forest
degradation.
Cumulative fNRB in the business as usual scenario for the simulation
period 2003-2027 (Bailis et al)
Stockholm Environment Institute, 2016; Churches et al. 2014; Tarter, 2016
A recent analysis (2016) by Stockholm Environment
Institute (SEI) supports this conclusion; they found that
the fraction of non-renewable biomass is 9% ±3%.
However, the analysis also identified “hot-spot areas”
where biomass sustainability is a major concern.

26
Haiti’s natural resources are being depleted and greenhouse gases / carbon
emissions are increasing.
World Bank Data, 2014; Google Data Visualizer
•Natural resource depletion is due
in large part to heavy dependence
on natural resources for domestic
cooking fuel.
•GHG emissions in Haiti have been
steadily rising for the past decade.
Natural resources depletion (the value of net forest depletion, energy depletion,
and mineral depletion as a % of gross national
income)
Greenhouse gas emissions(CO2 emissions - kg per PPP $ of GDP)
0.00%
0.50%
1.00%
1.50%
2.00%
2.50%
3.00%
3.50%
2006 2007 2008 2009 2010 2011 2012 2013 2014

27
Health Impacts
Household air pollution (HAP) from cooking with solid fuels is responsible for over 8,410 deaths each year
in Haiti, 10 times the number of HAP related deaths in the Dominican Republic.
GBD, 2015
0 100 200 300 400
Partial breastfeeding
Unsafe sanitation
Alcohol use
High body mass index
Unsafe water
Diabetes
Household air pollution
High blood pressure
Childhood wasting
Unsafe sex
Disability Adjusted Life Years (DALYs ‘000)
LEADING DRIVERS OF DISEASE BURDEN IN HAITI
Household air pollution (HAP)
is the 2nd highest risk factor
for premature deaths in Haiti
at over 8,000 deaths in 2015.
HAP is the 4th highest risk
factor for combined
morbidity and mortality
measured in disability
adjusted life years (DALYs).

28DHS, 2012
• In both urban and rural
areas, over 40 percent of
households cook
outdoors (weather
permitting).
• Households in urban
areas also frequently
cook within the main
living area, while
households in rural
areas are more likely to
cook in a separate
building.
• Living areas and
separate kitchens both
tend to be poorly
ventilated, increasing the
risk of inhaling smoke,
gases, and particulates.
The health impacts from household air pollution are caused primarily by the
burning of solid fuels in poorly ventilated conditions.
31.8%
4.9%
19.0%
44.8%
44.5% 47.5%
4.4% 2.7%
0.0%
10.0%
20.0%
30.0%
40.0%
50.0%
60.0%
70.0%
80.0%
90.0%
100.0%
Urban Rural
Location of Cooking, 2012
Don't cook
Cook outdoors
Cook in separatebuilding
Cook inside living space

29
Gender-informed approaches can be
critical to scaling up use of clean
cookstoves and fuels in Haiti because of
the role women have in household and
economic decision-making.
• Women manage 40% of the
households
• 50% of women engage in economic
activity outside the home
• More than 75% of the informal
economy is comprised of women
Women can influence adoption of cleaner
cookstoves and fuels at both the household
and enterprise level as household cooks,
product designers, sales agents, and
business owners.
Gender and Women’s Empowerment Impacts
• Women & children are more exposed
to HAP than the rest of the household –
for 3-7 hours cooking each day in Haiti.
• Burning solid fuels causes household
air pollution (HAP) leading to acute
lower respiratory infections, chronic
obstructive pulmonary diseases, lung
cancer, cataracts and other illnesses.
• Burns from open fires and unsafe
cookstoves are another risk – globally
more than 500,000 women suffer
moderate to severe burns every year.
ILF interviews, 2016; Dalberg analysis; World Bank – “Household Cookstoves: Environment, Health, and Climate Change”; GACC- “Igniting Change ”; Trust.org;
Guardian.co.uk; Glob Public Health. 2013; 8(7): 822–830. http://www.ncbi.nlm.nih.gov/pmc/articles/PMC4476790/
• Regularly carrying heavy loads for long
durations can expose women and
children to head and spinal injuries and
pregnancy complications.
• The amount of wood collected ranges
from 6 to 35 lbs per day.
Impacts Role of Women
Collection of fuels
Cooking

30
The environmental, health, and social impacts of current cooking practices are particularly large in Haiti,
which makes cooking a pressing development issue. Sustained resources dedicated to addressing the
issue would have a substantial positive impact on the environment, health, and gender.
The environmental impacts of cooking practices have been the principal motivation behind cookstoves
and fuels projects in Haiti. However, the extent to which cooking practices, particularly the production and
combustion of charcoal, drives environmental degradation are a matter of recent debate. Recent
estimates already put the fraction of non-renewable biomass (fNRB) consumed in Haiti much lower than
previously thought. Further studies are underway (World Bank, Alliance, USAID) to deepen
understanding of the issue. Greater clarity is critical to prioritizing and understanding the potential cost-
effectiveness of the range of potential interventions that reduce pressure on biomass.
Awareness of the health impacts of current cooking practices appears to be limited in Haiti. Greater
understanding of these impacts is starting to change the policy environment in a number of countries, but
for many cookstove projects, health remains an afterthought. The weight that national policymakers give
to health impacts relative to environmental impacts should also inform the selection of potential
interventions. In some countries, an interest in health impacts has led to greater emphasis on switching to
the cleanest fuels in the short-term. There is also potential for health funding to benefit cookstove
programs that emphasize cleaner fuels.
Lastly, more research is needed to understand the time poverty and time burden aspects of clean cooking
for women. Anecdotally, we know that women and girls are the primary fuel collectors in rural areas and
this contributes significantly to time poverty, however further research should be conducted to quantify
these impacts.
Insights – Impacts

31
Executive summary
Fuel usage and trends
Sector mapping
Market assessment approach
Macro environment
Cookstoves and fuels supply and financing
Table of Contents
Cookstoves and fuels policy environment
Consumer segmentation
Environmental, health, and social impact

32
~93% of Haitian households rely primarily on solid fuel (wood or charcoal)
for cooking. Charcoal dominates the urban market; wood dominates in
rural areas.
DHS, 2012
Primary fuel usage breakdown (2012)
(% of households)
% of households relying
on solid fuels:
Rural TotalUrban
87.6% 96.2% 92.7%
The graphic here represents
primary sources of fuel only –
fuel stacking is a common
practice.
80.4
24
47.2
7.1
72.2
45.4
6.2
0.9
3.1
0
10
20
30
40
50
60
70
80
90
100
Urban Rural Total
Other
Kerosene
Electricity
LPG/naturalgas/biogas
Wood
Charcoal
Levels of solid fuel use have not decreased significantly over time – in 2000, 95% of households used solid fuels.

33DHS, 2012; Alliance analysis.
However, charcoal use has become more prevalent than wood use, likely
driven by urbanization.
53% 52%
45%
42% 42%
47%
0%
10%
20%
30%
40%
50%
60%
2000 2006 2012
Wood vs. Charcoal use for cooking in Haiti, 2000-2012% of Households using as primary fuel
Wood Charcoal

34
Three of the ten departments (L’Ouest, L’Artibonite, and Nord) account for
62% of all household solid fuel use in Haiti.
Rémi Kaupp, 2009: Wikimedia Commons; DHS, 2012
1.6 million
using solid
fuels – 41%
charcoal,
54% wood
1 million using solid
fuels – 47%
charcoal, 49% wood
3.8 million
using biomass
(918k in Port-
au-Prince) –
41% charcoal,
52% wood

35DHS, 2012; Alliance analysis; USAID, 2015.
According to surveys conducted by USAID, two of the main barriers to conversion from solid fuel to LPG are
lack of money for upfront investments and fear of fire or explosion associated with the use of LPG.
LPG is used by only 3% of total households in Haiti, primarily among
wealthy families in Port-au-Prince.
7.10%
10.80%
10.00%
0.90%
3.30%2.80%
0.00%
2.00%
4.00%
6.00%
8.00%
10.00%
12.00%
2000 2006 2012
LPG use in Haiti, 2000-2012
Port-au-Prince L'Ouest Department
L’Ouest department (where Port-au-Prince is located) is the only department in which more than 2% of
households use LPG.

36
83% of rural households primarily using wood
for fuel; 15.6% primarily use charcoal. Less
than 1% are using LPG. The vast amount of
cooking takes place outdoors.
In 2015, rural households accounted for 41%
of the population (over 4.4 million people).
However, per capita income for rural people is 1/3
of the income of urban households.
Rural populations suffer from extremely limited
access to basic services; 10% have access to
electricity and less than 8% have access to
drinking water.
Agriculture and commerce accounts for more
than 85% of all economic activity in rural areas,
but 80% of farmers cannot produce enough food to
feed their households and look elsewhere for
additional income, including charcoal production.
Charcoal production accounts for the largest share
of secondary income (49%) for rural households in
the South Department.
Rural Households
Rural households rely predominately on wood for fuel. Yet, they are often engaged in the charcoal
value chain as either producers, transporters, or resellers.
2016 UNEP, 2010 Nexant/USAID, 2007 ESMAP/World Bank, 2003 CARE-BME; Rural Poverty Portal, IFAD; World Bank Indicators 2014; ECVMAS 2012;

37
An estimated 1,300 bakeries operate in Haiti
using wood, LPG, and diesel. Annual
consumption is estimated between 156,000 to
208,000 tons of wood per year.
Rural bakeries exclusively use wood for fuel and
are an important source of food for communities.
Local resellers purchase bread from bakeries and
then distribute it to the extended rural community.
Rural bakeries predominately use wood for
fuel. A UNEP survey of 50 bakeries in the South
Department (63% of bakeries in the South)
found that 92% of surveyed bakeries use wood, 1
uses electricity, and 3 use LPG. The LPG fueled
bakeries use 34 kilos of LPG every 3 days.
Firewood is sold in bundles called “douzaines”; on
average rural bakeries use 8.6 douzaines of wood
per week at 1 USD per douzaines. National
estimates for rural bakeries calculate wood use at
200 kgs of wood per day for 3.2 sacks of flour.
In the South Department, men ran 76% of the
bakeries and women ran 24%.
Additionally, leasing is a common practice amongst
bakeries in Haiti. UNEP found that 74% of bakeries
surveyed lease their bakeries to others (6 people
on average).
Bakeries express a willingness to change to
alternative fuels. 74% of surveyed bakeries
expressed desire to switch to another energy
source, complaining about the difficulty of obtaining
wood and health concerns around dust and smoke
fumes from wood use.
Large Consumers – Bakeries
Large consumers of fuel in Haiti include institutions (orphanges and schools) and small and medium
enterprises (SMEs) (bakeries, laundries, dry cleaners, street vendors etc.).
USAID/Chemonics,2014; Nexant/USAID, 2010

38
Dry cleaners/laundries do not represent a
significant share of fuel consumption when
compared to households. There are only 140
operating in Haiti using wood and diesel (23,000
to 25,000 tons of wood per year).
Laundries and dry cleaners generally do not
consume charcoal and very few use wood. The
2010 Nexant report concluded that given the
small number of laundries/dry cleaners in Haiti
and the even smaller proportion using biomass,
that laundries do not represent a significant
source of deforestation or of negative health
emissions.
Rural dry cleaners/laundries almost
exclusively use wood to fuel boilers. However,
there are few cleaners operating in rural areas. In
the UNEP survey, the 4 identified rural cleaners
received 1 truck load of wood per week and paid
800 gourdes a load.
On the other hand, street vendors constitute a
significant portion of charcoal demand. In Port-
au-Prince there are an estimated 6,417 street
vendors cooking on a variety of fuels, including
charcoal, LPG, wood, etc.
Street vendors play an important role for food
security and nutrition, as many households rely on
street vendors for at least one meal a day.
Additionally, street vendors are predominately
women and offer an opportunity to enhance
women’s empowerment and involvement as
leaders in clean cooking.
Large Consumers – SMEs
LPG consumption for SMEs in metropolitan Port-au-Prince has doubled between 2014 and 2016.
However, rural and non-metro PAP SMEs continue to rely heavily on wood for fuel.
UNEP, 2016; Nexant/USAID, 2010; ESMAP/World Bank, 2007; CARE-BME, 2003; key informant interviews

39
Schools represent a significant share of the
fuel consumption in Haiti through school
lunch programs. 35% of the country’s 13,599
primary schools cook and provide lunch for their
students. Of the 4,464 schools with meal
programs, 961 are public and 3,503 are private.
35% of the country’s 13,599 primary schools
cook and provide lunch for their students.
58.3% are rural and 41.7% are urban.
The World Food Program currently feeds
400,000 children each day in public Haitian
schools. Private schools that provide meals
typically include the cost in tuition fees. Private
schools are more likely to have LPG and other
improved stoves.
On average, schools using charcoal require
0.4kg of charcoal per student, resulting in a coast
of 0.83 gourdes/student for charcoal and up to 32
metric tons of charcoal per school per day. The cost
of fuel is a significant constraint on schools financial
resources.
Rural schools face the difficulties of transportation,
intermittent supply, and high fuel costs when
considering switching to LPG.
Stove stacking is a common practice when old
stoves are not removed from schools because of
cultural beliefs about cooking beans and sauces on
traditional stoves. Durability and the cost of repairs
of improved stoves was cited as a concern and the
primary reason for reverting back to charcoal
stoves from LPG.
Decision makers are the administrators, not
cooks, when it comes to who decides which type of
stoves and fuels will be used.
.
Large Consumers – Schools
Schools represent a significant amount of charcoal and wood consumption due to the number of
schools providing feeding programs for students.
Ministère de l’Education Nationale et de la Formation Professionnelle (MENFP), 2011; Nexant 2010; WFP, Haiti Country Brief
September 2016; International Lifeline Fund 2010.

40
Though there is a variety of data on fuel usage available, much of it is out of date. Challenges in
comparability across datasets makes trend analysis difficult. More consistent data collection over time
would greatly contribute to improvements in program design and evaluation.
Solid fuel use for cooking is dominant in Haiti, and does not appear to have changed greatly over time,
which calls for greater understanding of the strengths and weaknesses of previous attempts at change.
The upward trend in the % of households using LPG between 2000 and 2006 does not appear to have
continued between 2006 and 2012 – understanding why will be important. Anecdotally, LPG use in urban
areas appears to have increased significantly since the last nationwide survey in 2012, but additional data
is needed to confirm this finding.
More data is needed on households that rely primarily on wood, particularly in regard to collection vs.
purchase practices; conventional wisdom suggests that there is little wood purchase, which would align
Haiti with other countries, and would present a challenge in changing practices, since financial savings is
often a motivation for change.
More data is needed on the practices of institutions (schools, bakeries, etc.) to determine which are
appropriate targets for interventions aimed at achieving large-scale impacts.
Insights – Fuel Usage

41
Executive summary
Fuel usage and trends
Sector mapping
Market assessment approach
Macro environment
Cookstoves and fuels supply and financing
Table of Contents
Cookstoves and fuels policy environment
Consumer segmentation
Environmental, health, and social impact

42
Consumer Segmentation and Behavior Change
Consumer segmentation is an approach to grouping a population by certain
characteristics, such as income and awareness levels, to better understand barriers to
behavior change and to design behavior change interventions. Commercial firms often
use segmentation to identify potential customers, such as those most poised to transition
from traditional cooking to cleaner cooking methods. Consumer segmentation relies
heavily on household level data.
For Haiti, we have so far encountered sparse formal data focused on consumer attitudes
and motivations related to clean cooking. There is, however, data on fuel use and wealth
levels from the 2012 Haiti Demographic and Health Survey (DHS) 2012 and the 2003
Enquête sur les Conditions de vie en Haïti (Survey of Living Conditions in Haiti),
implemented by the Institut Haïtien de Statistique et d’Informatique (IHSI, Haitian Institute
of Statistics and Information). We also reviewed previous research conducted by the
Alliance and other institutions in other countries that identify key indicators influencing
clean cookstove and fuel use.
While most of our data was from the 2012 DHS, the data looking at fuel use by income
distribution is based on the IHSI’s 2003 survey. We used available knowledge regarding
change in fuel use from 2003 to 2012 to adjust these data, but these estimates may not be
perfectly accurate.
43
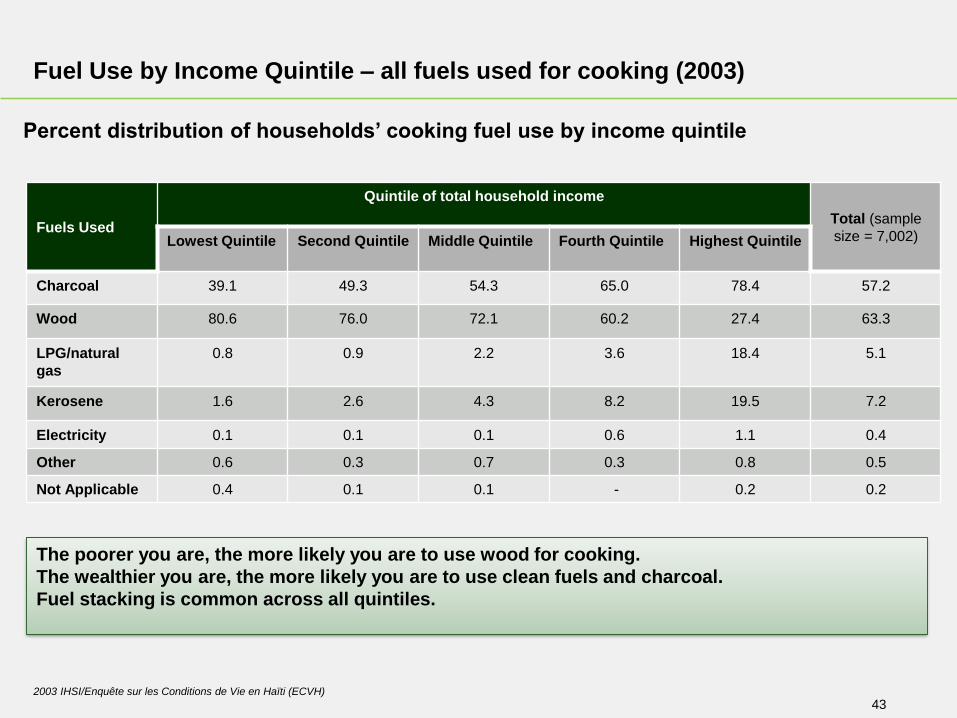
Fuels Used
Quintile of total household income
Total (sample
size = 7,002)Lowest Quintile Second Quintile Middle Quintile Fourth Quintile Highest Quintile
Charcoal 39.1 49.3 54.3 65.0 78.4 57.2
Wood 80.6 76.0 72.1 60.2 27.4 63.3
LPG/natural
gas
0.8 0.9 2.2 3.6 18.4 5.1
Kerosene 1.6 2.6 4.3 8.2 19.5 7.2
Electricity 0.1 0.1 0.1 0.6 1.1 0.4
Other 0.6 0.3 0.7 0.3 0.8 0.5
Not Applicable 0.4 0.1 0.1 - 0.2 0.2
Fuel Use by Income Quintile – all fuels used for cooking (2003)
Percent distribution of households’ cooking fuel use by income quintile
2003 IHSI/Enquête sur les Conditions de Vie en Haïti (ECVH)
The poorer you are, the more likely you are to use wood for cooking.
The wealthier you are, the more likely you are to use clean fuels and charcoal.
Fuel stacking is common across all quintiles.

44
Primary Fuel
Used
Quintile of total household income
Total (sample
size = 2,300)Lowest Quintile Second Quintile Middle Quintile Fourth Quintile Highest Quintile
Charcoal 25.2 28.4 31.1 38.2 50.4 36.4
Wood 71.8 69.1 62.3 53.5 24.3 53.1
LPG/natural
gas- 0.3 0.6 2.5 10.2 3.4
Kerosene 3.0 1.9 6.0 5.7 15.1 7.1
Electricity - 0.3 - - - 0.0
Total 100% 100% 100% 100% 100% 100%
Fuel Use by Income Quintile – primary fuel used for cooking (2003)
Percent distribution of households’ primary cooking fuel use by income quintile
2003 IHSI/Enquête sur les Conditions de Vie en Haïti (ECVH)
Charcoal and wood are used across all quintiles.
LPG and kerosene are used mostly by the higher income quintiles.

45DHS, 2012; 2003 IHSI/Enquête sur les Conditions de Vie en Haïti (ECVH); Numbers are estimations based on best available data.
How can we apply segmentation to prioritize efforts?
Main fuel by income group and locality
Income Quintile
Lowest Second Middle Fourth Highest Total
Charcoal 47.3%
Urban 0% 0.3% 6.4% 14.4% 18.0% 39.1%
Rural 1.5% 3.0% 2.1% 0.9% 0.6% 8.2%
Wood 45.4%
Urban 0% 0.1% 0.8% 1.2% 0.6% 2.7%
Rural 17.2% 15.1% 7.0% 2.8% 0.7% 42.7%
LPG/natural gas 3.1%
Urban 0% 0% 0.05% 0.68% 2.33% 3.06%
Rural 0% 0% 0% 0% 0% 0%
Kerosene 0.83%
Urban 0% 0% 0.01% 0.25% 0.57% 0.826%
Rural 0% 0% 0% 0% 0% 0%
Lowest Second Middle Fourth Highest
Charcoal
Urban 7,900 155,400 349,800 438,200
Rural 36,500 74,000 50,500 21,900 15,500
Wood
Urban 1,300 20,400 29,800 14,900
Rural 418,000 366,600 170,400 68,300 16,400
Commercial interest
Public interest

46
Segment Justification Approximate market
size
1. High and middle
income urban charcoal
users
High and middle income urban charcoal users make up
over a third of the population of Haiti, creating potential for
a significant shift in clean fuel and cookstove use if this
segment is targeted successfully. Their middle and high
income status will allow them to invest in cleaner cooking
solutions, and since they already purchase (rather than
collect) fuel, they have an incentive to transition to more
efficient fuels. Additionally, their urban residence means
that they are easier to reach through mass media and
community events.
38.8% of total
population
943,400
households
2. Middle income rural
wood users
Middle income rural wood users represent a significant
opportunity for marketers of clean cooking solutions.
Although, the cost of fuel is a less of an issue for them,
their purchasing power enables them to invest in modern
home appliances. In areas where wood is becoming
harder to collect in particular, they might have an
additional incentive to consider clean and efficient
cookstoves. In addition, they may be sensitive to other
incentives such as convenience, cleanliness or speed-of-
use.
7.0% of total
population
170,400
households
How might a commercial firm apply segmentation to prioritize efforts?

47
100%2.43 million
households
All Haitian
households
47.2%1.149 million
households
All households
primarily cooking
with charcoal
39.10%951k households
All urban
households
primarily cooking
with charcoal
38.8%943k households
All urban households
in the top three
income quintiles
primarily cooking with
charcoal
Target population segment
Consumer Segmentation Applied - illustrative

48
100%2.43 million
households
All Haitian
households
45.4%1.11 million
households
All households
primarily cooking
with wood
42.7%1.04 million
households
All rural
households
primarily cooking
with wood
7.0%170k households
All rural households in
the middle income
quintile primarily
cooking with wood
Target population segment
Consumer Segmentation Applied - illustrative

49Expert interviews; Dalberg analysis; GACC stakeholder consultations
Economic savings: monetary savings due to decreased need for
fuel (greater efficiency) lower cost of fuel (due to fuel switching) or
more durable stove (limited replacement costs)
Consumers’ willingness to adopt new technology will vary depending on
the customer segment – what we know globally
“Willingness to adopt” drivers Likely target audience
• Solid fuel purchasers (primarily male as the
economic decision maker)
• Educated consumers
• Commercial/institutional buyers
Time savings: recouped time from time not spent collecting fuel
or from decreasing long cooking times (through more efficient
stoves)
• Higher income/educated rural consumers (with
opportunities for alternatives livelihood)
• Solid fuel collectors (primarily female who have
the most time burden from cooking)
Health concerns: key issues include ensuring healthier children
and mitigating chronic health issues such as eye irritation,
difficulty breathing etc
• Female consumers (as primary caretakers of
the house and children)
• Donor agencies and “mission-driven”
institutional purchasers
Cleanliness: improving the look and overall cleanliness of the
kitchen, utensils and home• Female consumers (as primary cooks and
presence in the kitchen)
Aspirational technology: perception that certain technologies or
fuels indicate a higher social status
• Both female and male consumers
The customer segment to be targeted is critical in determining the design, price point and distribution strategy
of any cookstove initiative

50
We conducted a review of previous BCC and Social Marketing interventions implemented in Haiti, including
3 campaigns aimed at promoting improved cookstoves, as well as several focused on HIV/AIDS
prevention, WASH, and family planning. Some key findings from these interventions include:
Effective channels of communication:
•Television and radio: raising awareness of new products and reaching wide audiences can be
successfully realized through traditional mass media channels such as TV and radio.
•Interpersonal communication/demonstrations: to realize actual uptake and behavior change, these
channels should be complemented by one on one and group level communication, as well as
demonstration and other community level events where consumers have an opportunity to see and
experience products first hand.
Locations and Partners:
•If considering expanding programs to rural areas, consult (and partner with) local organizations to
facilitate social marketing and behavior change components.
Key Messaging:
•Affordability/availability of stoves: Advertise projected daily or weekly fuel savings. Explain payment
options, such as monthly installments, available to consumers. Direct consumers to where stoves/fuels
can be purchased.
•Perceived safety of stoves/counterfeiting of stoves: Implement and advertise a labeling program to
provide assurance to consumers that they are purchasing a genuine improved cookstove. Seek
endorsements from trusted leaders.
•Aspirational quality of stoves: Focus on building social status of using an improved cookstove.
Behavior Change Communication in Haiti
• .

51
Effective segmentation – and therefore effective communication strategy design – is made more difficult
by the relative lack of data on consumer attitudes. We need to know more about what motivates
consumers and what they perceive to be the barriers to change to be able to help them change practices.
Anecdotally, there is likely a large segment of the population for whom the upfront investment in a new
stove is the likely barrier. This suggests that consumer financing will play an important role in behavior
change, complemented by communications efforts focused on benefits that matter to the consumer
segment. More research is needed into which consumer financing schemes will show the most promise.
If institutional cooking practices are verified to have a large impact on the environment and/or health, then
more study is required to understand the behavioral barriers to change in that segment.
The most easily addressable consumer segment of the market from a commercial point of view would be
the large group of urban solid fuel purchasers; most cookstove projects have focused on that segment.
However, that would leave a large rural segment largely unaddressed.
There is considerable “stove stacking” (use of different stoves and fuels in the same home), which
suggests there is still a behavior change challenge within households that have already acquired a
cleaner/more efficient technology.
Insights – Consumer Segmentation and Behavior Change

52
Executive summary
Fuel usage and trends
Sector mapping
Market assessment approach
Macro environment
Cookstoves and fuels supply and financing
Table of Contents
Cookstoves and fuels policy environment
Consumer segmentation
Environmental, health, and social impact

53
Cookstoves Supply
54
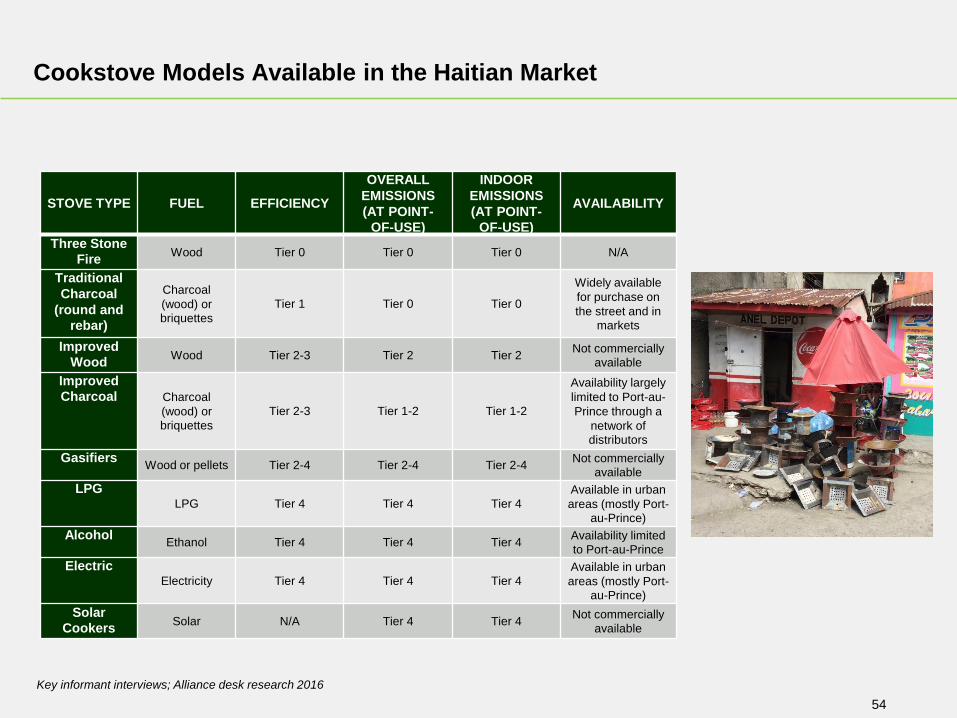
Key informant interviews; Alliance desk research 2016
Cookstove Models Available in the Haitian Market
STOVE TYPE FUEL EFFICIENCY
OVERALL
EMISSIONS
(AT POINT-
OF-USE)
INDOOR
EMISSIONS
(AT POINT-
OF-USE)
AVAILABILITY
Three Stone
FireWood Tier 0 Tier 0 Tier 0 N/A
Traditional
Charcoal
(round and
rebar)
Charcoal
(wood) or
briquettes
Tier 1 Tier 0 Tier 0
Widely available
for purchase on
the street and in
markets
Improved
WoodWood Tier 2-3 Tier 2 Tier 2
Not commercially
available
Improved
Charcoal Charcoal
(wood) or
briquettes
Tier 2-3 Tier 1-2 Tier 1-2
Availability largely
limited to Port-au-
Prince through a
network of
distributors
GasifiersWood or pellets Tier 2-4 Tier 2-4 Tier 2-4
Not commercially
available
LPGLPG Tier 4 Tier 4 Tier 4
Available in urban
areas (mostly Port-
au-Prince)
AlcoholEthanol Tier 4 Tier 4 Tier 4
Availability limited
to Port-au-Prince
ElectricElectricity Tier 4 Tier 4 Tier 4
Available in urban
areas (mostly Port-
au-Prince)
Solar
CookersSolar N/A Tier 4 Tier 4
Not commercially
available

55
Three Stone Fire
Traditional charcoalLow-level improved charcoal
Mid-level improved charcoalHigh-level improved charcoal
Biogas
LPGElectric
SolarEthanol
Kerosene
Forced Draft gasifier
IND
OO
R E
MIS
SIO
NS
-P
M2
.5 S
UB
-TIE
R
HIGH POWER THERMAL EFFICIENCY SUB-TIER
Thermal Efficiency v. Indoor PM2.5 Emissions by Stove Type
0 1 2 3 4
0 1
2
3
4
How clean and efficient are the stoves in the market?
(illustrative mapping)
Note: The Alliance defines (1) stoves that achieve Tier 2 or higher for efficiency as efficient, (2) stoves that achieve Tier 3 or higher for overall emissions as clean as it relates to potential environmental
impacts, and (3) stoves that achieve Tier 3 or higher for indoor emissions as clean as it relates to potential health impacts.

56
Supply: Very few improved biomass cookstove models are available on the market in Haiti, unlike in many
other countries the Alliance works in. No biomass cookstoves are currently imported, and none of the local
improved options are sold nationwide.
Condition: According to the USAID/Chemonics/CQuest study, after a year of use only 30% of improved
stoves remained in “good” condition. Most of the damage was due to the corrosion of the combustion
chamber and to the cracks in the clay based liners. Unlike traditional stoves the ICS were mostly stored
indoors offering them greater protection.
Design: According to the USAID/Chemonics/CQuest longitudinal study, ICS are overwhelmingly perceived
as easier to use than their traditional counterparts. The main design change requested by users are for 2
burners, and for a stove that is higher from the ground. Wooden handles are appreciated. Imported, factory
made stoves are not always considered more “modern” than local stoves to Haitian households.
Fuel savings and cooking speed: USAID/Chemonics/CQuest‘s real life measurement of fuel consumption
for a variety of improved cookstoves in Haiti showed a significant decrease in charcoal consumption. Users
also reported that the improved stoves cook the food faster than the traditional ones. However, additional
verified testing data is needed for several models to enable accurate comparability.
Value: The user-estimated price of stoves was higher for imported stoves than for local ones. However,
users estimated a price that was above the actual retail price for the local stoves, but below retail price for
imported stoves. 20% of users said they were willing to consider borrowing money to buy ICS – but no
consumer financing options are widely available.
Adapted from the USAID/Chemonics/CQuest report, 2014
Insights – Cookstoves Supply

57
Fuel Supply

58
Fuel Availability, Cost, and Production
FUELS PRODUCTION DISTRIBUTION AVAILABILITY UNITS PRIMARY USERS
Charcoal (wood)
Mostly by rural households
using traditional methods, on
either a full-time basis, or on
occasion when extra money
is needed; percentage of
supply may come from DR
but exact quantity unknown
Sold on roadside and
markets often by women in
rural areas and transported
to cities by truck; highest
profit to transporters
Very widely available
(multiple vendors on every
street and on all roads and
markets in rural areas)
Marmite (occasionally other
single servings), small,
medium, and large sack
Urban and rural households,
urban food vendors, urban
schools with feeding
programs.
WoodMostly from trees grown on
rural, privately owned land
Rural households collect
from nearby fields/forests
Vendors cut on privately
owned land
Widely available for free
collection in rural areas
Specialized vendors sell
wood to institutions/
industries in rural areas and
some urban areas
Wood typically collected for
free by rural households.
Purchase is usually only by
institutions in units of 28-
30kg (called 'large packet,'
'charge,' & 'macoute')
Rural households, rural
schools with feeding
programs, rural bakeries.
LPG (propane)Imported from international
sources
Most LPG is transported by
truck from PaP, with a small
amount coming from across
the DR border by smaller
LPG companies
Widely available in urban
areas (especially PaP and
Cap Haitian), but supply very
limited in rural areas.
Bip (5lb), 12lb, 25lb, 50lb,
100lb
Wealthy urban households;
some urban schools; and
urban bakeries
Carbonized briquettes
(from bagasse)Produced in Cap Haitien
Distribution from Cap Haitien
to bulk buyers (who distribute
to small vendors) and CRI-
branded shops
Available in urban areas of
PaP and Cap Haitien
Sold by marmite or large
sack
Urban households previously
using wood charcoal
EthanolProduced in USA by POET,
shipped to Haiti
Distribution at designated
retail shops in PaP Available only in PaPSold in 20oz, 1.5L, and 5L
containersUrban households

59
Price of A Day’s Cooking by Fuel Type(modeled based on prices observed in Alliance market visits in 2016)
0
20
40
60
80
100
120
TraditionalStove
ImprovedStove
TraditionalStove
ImprovedStove
Ethanol LPG
Charcoal Briquettes Liquid Fuels
HT
G/H
ou
se
hold
/Da
y
Average Household Fuel Expenditure by Stove-Fuel Type

60
• The average weight of wood collected per trip
varies, with estimates ranging widely from 3.3
lbs per trip (undertaken daily) to 35 lbs per trip
(undertaken once or twice per week).
• The majority of cooking with wood is done
over three-stone fires.
• Rural families reportedly will not spend the
money for an improved cookstove because
there is no fuel cost savings for them.
• To reach rural consumers, past initiatives
suggest that marketing should focus on
saving cooking time instead of cost.
Firewood Collection and Purchase
The majority of firewood users collect small branches from areas near their home – there is not a
strong culture of firewood purchase. Quantitative data on collection practices, however, is limited and
should be examined more closely.
Key informant interviews with International Lifeline Fund; USAID/Nexant 2010.

61
Charcoal production is a necessity for many
rural households, constituting on average 25%
of rural income. In the South Department,
charcoal production can account for over 50% of
monthly incomes (31% of primary economic
activities for rural households and 49% of
secondary economic activity).
While people in rural areas spend more time
engaged in agriculture and livestock activities,
charcoal contributes far more to rural incomes
(25% versus 4%). In rural areas firewood does
not factor significantly into people’s income as it
is primarily consumed as a cooking fuel.
Charcoal production is seasonal, with
production levels higher between September and
December. Many rural households are occasional
charcoal makers, especially around the beginning
of school when extra money is needed to pay
school fees and purchase uniforms.
When surveyed, families list three main
motivators for producing charcoal: to buy food
(38%), to pay school fees (28%), and to earn
cash for household needs (27%). Additionally,
charcoal producers tend to come from households
with a high number of dependents (6.5 on
average, compared to 4.4 at the national level).
Charcoal producers are predominately male
(77%), whereas women account for the
majority of charcoal vendors. However,
charcoal trading represents 49% of primary
economic activity for women in the South
Department and 40% of secondary economic
activity.
Charcoal Value Chain
Charcoal is a significant source of livelihood for many rural Haitians.
USAID/Chemonics, 2015; USAID/Nexant, 2010; UNEP Haiti Sustainable Energy Programme, 2016.
39%
49%
4%5% 3%
Secondary Economic Activity
Agriculture andlivestock
Charcoal
Firewood
Commerce
Commerce &Other
57%31%
6%4% 2%
Primary Economic Activity
Data Source: UNEP, 2016.

62
On average traders receive 75 gourdes more
per sack than charcoal producers. Charcoal
transportation accounts for 50% of the profit
earned on a bag of charcoal. Revenues realized
from the charcoal value chain increase
substantially between rural areas and Port-au-
Prince.
Trees for charcoal are generally cut on one’s
own land (47%), purchased (22%), or a
combination of both (23%). An additional 8% of
producers pay to harvest wood from other’s
land. Land is purchased for approximately
3,000-4,000 gd (~$75-100) for a little over a
hectare.
Many rural communities are now exploring
sustainable solutions to restore the severely
depleted wood stocks in their areas by cutting
trees using a method that allows them to
naturally regenerate.
27% of respondents in the South have
participated in a reforestation program.
However, the extent of sustainable domestic
charcoal production is a topic of debate, with
little data available.
There is some charcoal trade between the
Dominican Republic and Haiti through trucks
crossing the border and in small boats leaving
Anse-a-Pitre. However, the extent of the
cross-border charcoal trade is debated –
some estimates suggest that 70-86% of
charcoal used in Haiti comes illegally from the
Dominican Republic (Checo, 2009), while
other sources claim the fraction of charcoal
coming from DR is almost insignificant. Better
data is needed to understand the cross-
border dynamics.
Charcoal Value Chain
The largest beneficiaries of the charcoal trade are the transporters who bring charcoal to urban
centers, in particular Port-au-Prince.
USAID/Chemonics, 2015; USAID/Nexant, 2010; UNEP Haiti Sustainable Energy Programme, 2016.

63
Also as of 2010, Sodigaz
accounted for 60 percent of
imports or about 9,000 tons
annually. Sodigaz had 850 tons in
total storage capacity, of which
actual working capacity is 745
tons. Because of limited capacity,
Sodigaz imported LPG by ship
every 2-3 weeks.
Total, which accounted for the
remaining 40 percent of LPG
imports, has 1,000 tons of
working capacity and received
900 tons of LPG every two
months.
LPG Importation
LPG primarily enters Haiti through Sodigaz and Total, which are the only two companies with port
facilities to land LPG from the sea. As of 2010, the terminals combined had the capacity to handle
potentially up to 50,000 tons annually depending on the frequency of resupply. A smaller amount is
also imported from the Dominican Republic via trucks by Ecogaz and Gazel.
USAID/Nexant, 2010

64
The LPG market in Haiti includes three broad
categories of companies: importers (Total and
Sodigaz); large distributors (Ecogaz and Canez);
and small distributors (Progaz and others). The
importers set LPG prices and operate all along
the value chain from LPG procurement to
distribution.
Although Sodigaz and Total import 60 percent
and 40 percent respectively of all LPG in Haiti,
Canez and Ecogaz account for an estimated 70
percent of final distribution to customers, which
include other smaller distributors like Progaz.
Ecogaz’s model is based on micro-filling sales
and developing the operations of independent,
smaller micro-filling operators. Ecogaz provides
and installs micro-filling equipment in return for
exclusive long-term supply contracts.
LPG Value Chain
USAID/Nexant, 2010 – Based on key informant interviews this information is still accurate
Business Importation Bulk Supply to Other
Distributors
Bulk Supply to
End Users
Micro-Filling
Stations
Retail
Cylinder
Exchange
TOTAL Important Important Important Negligible
Sodigaz Important Important Important Important Significant
Ecogaz* Important Important Important
Canez Distribution Important Important Important
Prograz (small
distributors)
Important
LPG Operators by Business Line
*Used to fill cylinders until plant exploded in April 2009

65
Electricity
Only 0.2% of all households in Haiti cook using
electricity, due in large part to unreliable or non-
existent supply.
Kerosene
Kerosene is used by 0.7% of households. Several
types of kerosene cookstoves are available on
the market, including brass pressurized stoves,
gravity fed wick stoves with fuel bottles (single,
double, and triple-burner models), and multi-wick
stoves (e.g., with 10-22 cotton wicks in a circle,
which can be raised or lowered to adjust heat
output). However, households complain that the
taste of kerosene gets into the food and as a
result it is unpopular.
Ethanol
Ethanol fuel is currently imported from the United
States and is available in the market in Haiti along
with ethanol cookstoves. Several organizations
have plans to produce ethanol domestically in the
near future using sugarcane.
Biomass pellets
While some pellet stoves have been piloted in Haiti,
pellets are generally not found on the market.
Briquettes from waste paper
Small-scale briquette production using paper waste
has been tried by several organizations throughout
Haiti. The largest project was in Carrefour Feuilles
and is no longer operating.
Solar
Haiti has a moderately high level of sunshine, with
an index in the range of 5.0 hours per day of
average sunshine. A range of solar cookers have
been promoted throughout Haiti over the past
decade, the majority of which were contributed via
charitable donations.
Carbonized briquettes from agricultural waste
At least two companies in Haiti have produced
carbonized briquettes from sugarcane waste at
moderate scale. Carbon Roots International is still
operating with a base in Cap Haitien, while Ticadaie
has closed operations.
Other Alternative Fuels
Less than 1% of households cook with other alternative fuels such as electricity, kerosene, solar, or
ethanol.
DHS, 2012; USAID/Nexant, 2010
66
Despite previous efforts, there is relatively little local production and distribution of alternative fuels at
scale in Haiti. Additional study (some ongoing by the Alliance) is needed to better assess the viability of
locally-produced alternative fuels, particularly from a feedstock availability point of view, and on the
impacts of scaling up production of feedstocks.
Though there are challenges in purchasing small quantities, when viewed from the perspective of the
average cost of preparing meals, alternatives to charcoal become financially attractive, some fuels
perhaps reaching price parity in some areas. This could open up opportunities for long-term commercially
viable production, if the barriers to stove acquisition can be addressed.
More analysis (some ongoing by the Alliance) is required to understand the viability of importing
alternative fuels at much greater scale over the long-term, particularly from a balance of payments
perspective.
Insights – Fuel Supply

67
Cookstoves and Fuels Financing Landscape

68
Haiti Investor Landscape – Key Findings
Demand
• Most commercial activity at scale within a small
number of influential, wealthy families
• Anecdotally, have been told >90-95% of start-
ups/social enterprises in this market ultimately fail
• Pipeline of for-profit cookstoves enterprises is very
limited; limited number of non-profits as well
• Significantly more demand for grant capital; logical
given greater donor activity versus investment in
SME/social enterprise space
• Enterprises, both for-profit and non-profit, are small
and early-stage, face significant business model
challenges around supply chain, product
demand/consumer behavior, ability to pay, etc.
• Therefore sector currently is a small number of low-
profit/low-growth trajectory, highly risky enterprises –
given unattractive risk/return ratio, unlikely near-term
access to commercial capital
Supply
• Foreign investment (debt and equity) limited by
country risk factors/political instability, low ease
of doing business
• However, domestic and (limited) foreign equity
capital is accessible for demonstrably profitable
business models
• Domestic debt capital is accessible to
profitable businesses, and in particularly to
wealthy families given their diverse business
interests and ability to provide collateral
• Given risk/return profile of cookstoves models
at present, limited involvement of wealthy
domestic entrepreneurs and investors with
access to capital
• Over past 5+ years, limited impact-first
investment through post-earthquake
interventions e.g. Bush-Clinton Fund, but much
of this is no longer active
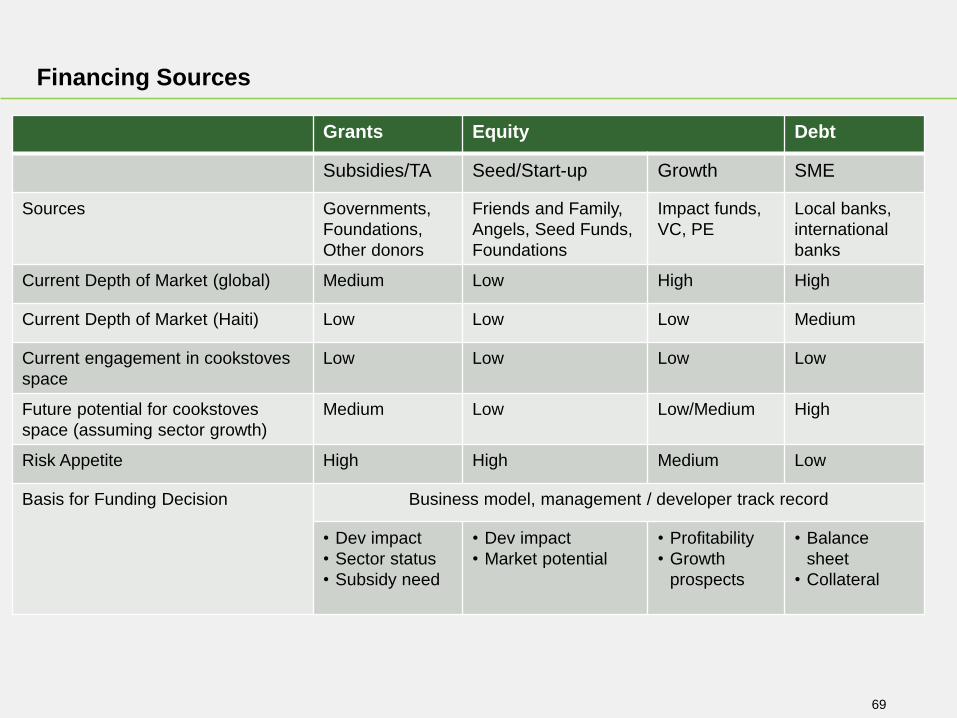
69
Grants Equity Debt
Subsidies/TA Seed/Start-up Growth SME
Sources Governments,
Foundations,
Other donors
Friends and Family,
Angels, Seed Funds,
Foundations
Impact funds,
VC, PE
Local banks,
international
banks
Current Depth of Market (global) Medium Low High High
Current Depth of Market (Haiti) Low Low Low Medium
Current engagement in cookstoves
space
Low Low Low Low
Future potential for cookstoves
space (assuming sector growth)
Medium Low Low/Medium High
Risk Appetite High High Medium Low
Basis for Funding Decision Business model, management / developer track record
• Dev impact
• Sector status
• Subsidy need
• Dev impact
• Market potential
• Profitability
• Growth
prospects
• Balance
sheet
• Collateral
Financing Sources
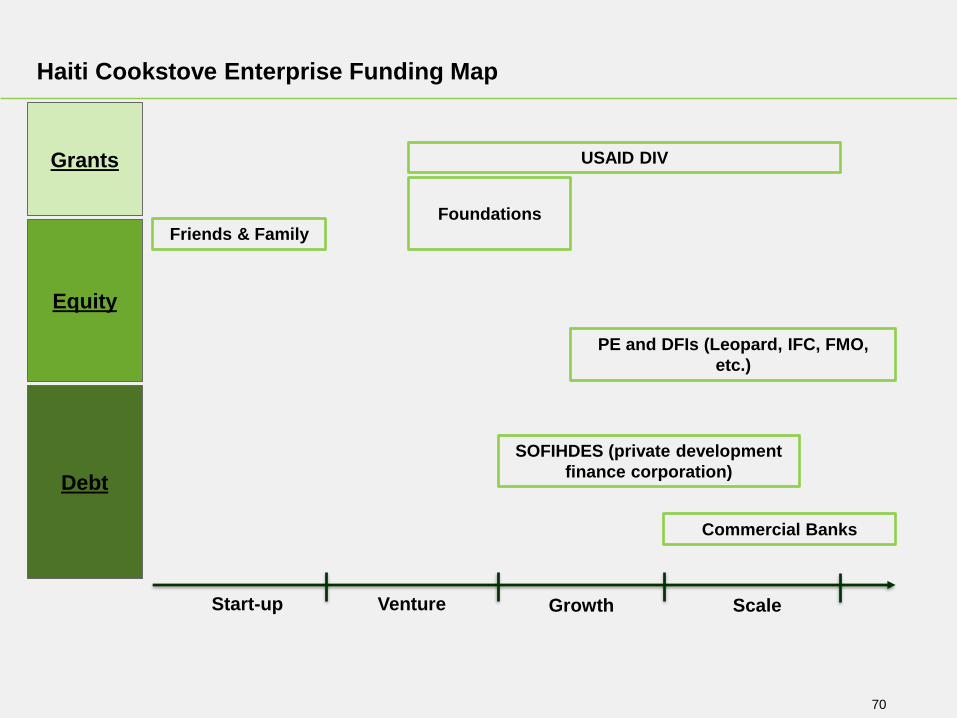
70
Haiti Cookstove Enterprise Funding Map
Grants
Start-up Venture Growth Scale
Equity
Debt
PE and DFIs (Leopard, IFC, FMO,
etc.)
Commercial Banks
SOFIHDES (private development
finance corporation)
Foundations
USAID DIV
Friends & Family
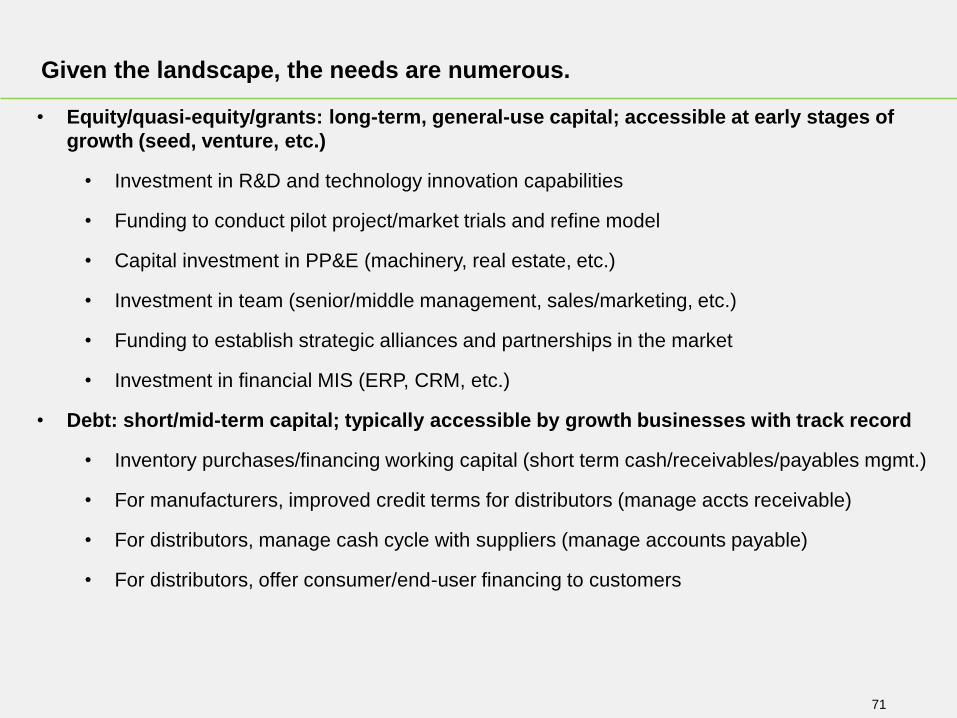
71
• Equity/quasi-equity/grants: long-term, general-use capital; accessible at early stages of
growth (seed, venture, etc.)
• Investment in R&D and technology innovation capabilities
• Funding to conduct pilot project/market trials and refine model
• Capital investment in PP&E (machinery, real estate, etc.)
• Investment in team (senior/middle management, sales/marketing, etc.)
• Funding to establish strategic alliances and partnerships in the market
• Investment in financial MIS (ERP, CRM, etc.)
• Debt: short/mid-term capital; typically accessible by growth businesses with track record
• Inventory purchases/financing working capital (short term cash/receivables/payables mgmt.)
• For manufacturers, improved credit terms for distributors (manage accts receivable)
• For distributors, manage cash cycle with suppliers (manage accounts payable)
• For distributors, offer consumer/end-user financing to customers
Given the landscape, the needs are numerous.

72
Three carbon credit projects are currently in implementation or in the registration process in Haiti.
• Since 2013, D&E Green enterprises has had a POA with ENEL, a European Electricity Company. The
project title is “Replacement of traditional charcoal stoves with efficient EcoRecho stoves in Haiti” and
it has a 28-year lifetime.
https://cdm.unfccc.int/ProgrammeOfActivities/poa_db/45N2WHPB9DJYUFTELKR8ZIC7OQSAM6/vie
w
• The USAID/Chemonics project facilitated the development of a POA with C-Quest, “Improved
Cookstoves for Haiti,” which has a 28-year lifetime.
https://cdm.unfccc.int/ProgrammeOfActivities/poa_db/Y3SFOP8EVW7DQXRBCLHJG014KNZ2MA/vie
w
• Lastly, Entrepreneur du Monde, a French entity involved in energy projects in Haiti has registered their
LPG access project with the Gold Standard Foundation.
USAID/Chemonics, 2015.
Carbon Finance Programs
USAID/Chemonics identified three major constraints to register and implement carbon credit
projects in Haiti, including the high cost of registration (over $150 USD); the long duration of the
registration process (over 2 years); and institutional weaknesses (the National Designated
Authority – ANDH – in Haiti is not fully functional).

73
Executive summary
Fuel usage and trends
Sector mapping
Market assessment approach
Macro environment
Cookstoves and fuels supply and financing
Table of Contents
Cookstoves and fuels policy environment
Consumer segmentation
Environmental, health, and social impact

74
• Haiti is a signatory on the Paris Agreement to
combat climate change and to accelerate and
intensify the actions and investments needed for a
sustainable low carbon future.
UNFCCC, 2016; Agence France-Presse, 2015
Government of Haiti’s Engagement on International Energy
Policies and Agreements
• Haiti is a signatory on the Sustainable
Development Goals (SDG) Agenda for 2030,
which includes affordable and clean energy
access as Goal #7.

75
Ministry of Environment – Intended Nationally Determined Contributions (INDCs), 2015
• Specific 2030 targets for clean cookstoves, fuels, and energy:
• Reduce use of wood for fuel (charcoal and firewood) by 32%
• Promote the replacement of traditional cookstoves with fuel-efficient cookstoves (with fuel
savings of 25-30%)
• Improve the energy efficiency of wood charcoal production (improving yields from 10-15% to 30-
45%)
• Create 10,000 hectares of managed forests for energy use by 2030.
• The status of funding and implementation of this plan is not clear.
Ministry for Public Works, Transportation and Communications, Bureau of Mines and Energy –
Haiti National Energy Sector Development Plan (NESDP) 2007 – 2017
• Specific 2017 targets for clean cookstoves and fuels:
• 669,000 households converted to LPG (at cost of $12 million USD)
• 287,000 households converted to kerosene (at cost of $2.8 million USD)
• 166,000 new biomass stoves in households (at cost of $997,000 USD)
• 143,000,000 tons of charcoal imported to relieve pressure on national forests (at cost of $4.7
million USD)
• According to meetings with Bureau of Mines and Energy officials, sufficient funding did not come
through for this plan, so it has not yet been implemented at scale.
Haiti INDC, 2015; Canada, 2016; BME, 2006
Government of Haiti Priorities on Clean Cookstoves and Fuels

76
Ministry for Public Works, Transportation and Communications, Bureau of Mines and Energy
• Haiti Energy Sector Development Plan 2007 – 2017
• Lays out ambitious plans for 25% of urban biomass-using households (total target of 509,400
households) to convert from wood and charcoal to alternative fuels by 2015; the dissemination of
improved stoves to 17% of the families in the urban area by the year 2015 (166,000
households); and an overall goal for 36% of the households using either kerosene, LPG or
improved stoves by the year 2015.
• Not achieved, due to lack of resources to implement.
• National Strategy for Improved Stoves in Haiti, 2011
• Long-term objective for 2020 was a decrease in wood consumption of 20% by 2016 and 30% by
2020.
• Plan was not finalized or fully funded.
World Bank Energy Sector Management Assistance Program (ESMAP)
• Haiti: Strategy to Alleviate the Pressure of Fuel Demand on National Woodfuel Resources, 2007
• The overall charcoal consumption was targeted to decrease by 20% over a 10-year period.
• LPG and kerosene consumption targeted to grow twofold in 10 years.
• Targeted reduction of CO2 emissions by 3,200,000 tons in 5 years and 99,400,000 tons over 20
years.
• However, funding for plan was cut and program was never implemented.
BME, 2006; key informant interviews; ESMAP, 2007
Previous Nation-wide Programs and Plans

77
There are no national policies in place on standards, testing, or labelling in Haiti. Cookstove
manufacturers are not required to conduct testing or seek certification unless they want to
access the carbon market. Many are uninterested in certification because they do not see the
benefits of doing so.
The absence of legislation for the protection of intellectual property prevents some
manufacturers from pursuing certification. The most well-known example cited by stove
manufacturers is a case study of the Mirak stove, which was created by BME and the World Bank. The
Mirak is a high-performing stove model that is sold at 500 gourdes. Unfortunately, some local stove
makers counterfeited the model and sell a poor-quality version for 100 gourdes. Consumers can’t tell
the difference between the certified and non-certified version, so the certification becomes useless.
Through the USAID/Chemonics project, a national testing laboratory was created at the Faculté
des Sciences, within the Université d’Etat d’Haiti (UEH). Very few stoves have been tested at
this facility, and manufacturers are not yet confident in the quality of results. There is only one
part-time staff member at the facility, so there is often a long wait for results.
Costs of testing can be significant. Producers pay 34,000 gourdes ($543 USD) to test stoves made
in Haiti and 40,000 gourdes ($639 USD) to test imported stoves. BME then requires the payment of
$400 USD for locally made stoves or $500 USD for imported stoves for the certification.
USAID/Chemonics, 2016
Cookstove Standards, Testing, and Labeling

78
In Haiti, LPG has had special legal status
since 1987 which makes it exempt from
the customs tax. However, there are no
quality control or testing mechanisms
currently in place. Prices are not
regulated, nor is the establishment or
operating of filling stations. According to
key informant interviews and the
literature, better regulatory framework is
necessary to enable LPG market
expansion.
Between 2012 and 2015, several groups
attempted to develop additional
legislation on LPG, including
USAID/Chemonics, Total Haiti, the Mevs
Group, and the Ministry of Commerce
and Industry. None of these succeeded in
passing through the government.
The latest compromise bill, put together
by the BME, is currently under
consideration by the government but is
getting little traction.
USAID/Chemonics, 2015; key informant interviews.
LPG Policy Framework

79
Selection of Past Projects
Organization Project Date Location # stoves/fuels Type of stove/fuel
BME, World Bank,
Canada
Recho Mirak – design
and distribution
1980s Port-au-Prince 6,000
(AFVP)
Improved charcoal stove
Shell-Sodigaz Distribution of LPG
cookstoves
1990-1993 Port-au-Prince 80,000 Bip ti Cheri stoves
CARE, Bureau des
Mines et de l’Energie
(BME)
Promotion of improved
charcoal stoves
1996-2002 Port-au-Prince 20,000 Recho Mirak stoves
World Bank and local
contractors
Project Recho Mirak 2008-2009 Port-au-Prince 30,000 Recho Mirak stoves
COSAN Project Gaia Ethanol
Stove and Fuel Pilot
2010-2011 Léogane, Marigot, Port-
au-Prince
no data CleanCook Ethanol Stove, One-
Burner
Chemonics, USAID Improved Cooking
Technology Program
2012-2015 MAP Improved charcoal stove, LPG
CDIFEEH SA Rechauds Ameliores:
une bonne affaire
Proposed in
2012
Port-au-Prince 200,000
proposed
Recho Mirak Stoves

80
The Chemonics/USAID Improved Cooking Technology
Program (ICTP) was the most recent and largest scale
cookstoves and fuels project implemented in Haiti in
almost 30 years of efforts. During the formative research
stage and in multiple informant interviews the Alliance
identified the USAID/Chemonics project as a key resource
for gaining insights into the Haitian clean cooking and fuels
market. Given that the final evaluation was published in
November 2015 and that many key stakeholders were
involved in the project, a thorough understanding of the
projects successes and shortcomings informed the
Alliance’s work.
Between 2012 and 2015 Chemonics implemented the
ICTP under a USAID-awarded contract of 8.2 million USD
with the objective of reducing wood demand for cooking.
The Chemonics projected followed several years of
research and market evaluation (Nexant 2010).
The projects four goals were as follows:
1. Promote the use of more efficient biomass
cookstoves in individual households;
2. Expand the use of cleaner, more efficient commercial-
grade LPG stoves in individual households and
businesses such as street vendors, schools,
orphanages, which consume large amounts of
charcoal;
3. Strengthen the legal and regulatory framework for the
safe distribution and commercialization of LPG; and
4. Increase the program’s impact and sustainability
through carbon financing.
The project was implemented in the metropolitan area of
PaP with mixed results. The final evaluation found that 6%
of households in the program area adopted improved
cookstoves, and 44% of orphanages, 12% of schools, and
22% of street food vendors adopted LPG (Chemonics
2015). While the project established and strengthened
local institutions and entities of the Government of Haiti to
produce cookstoves and made progress towards
regulating LPG, the increase in production was not
deemed significant.
The final evaluation of the project identified five areas
on which future projects should improve:
(1) The financial burden associated with
purchasing/switching to ICS is the most significant factor
preventing adoption of the stoves as well supporting the
sale of products that have been shown to not be durable in
the local environment. (2) The perceived explosion risk
and the question of funding prevented users from
switching to LPG. (3) A more focused awareness project
on benefits to health and the environment of fuel switching
is needed. (4) External factors, i.e. the lack of a functional
parliament and ineffective government prevented the
establishment of a regulatory framework for LPG. The
project recommended that a team of technicians be set up
to reconcile and contextualize various draft bills. (5)
Projects should include all potential partners from the
beginning of any process in order to prevent friction and
promote transparency.USAID/Chemonics, 2015.
Case study of a large-scale cookstove and fuel program in Haiti:USAID/Chemonics Haiti Improved Cooking Technology Program 2012-2015(ICTP)

81
From the 1980s until present, Haiti saw over 20 different cookstoves
and fuels projects.
•Volume: Projects ranged in volume from few thousand stoves
distributed in less than a year to 80,000 distributed over three years.
•Technology: biomass cookstoves, ethanol, and propane (LPG). The
vast majority of projects targeted populations in the metropolitan area.
•Organizations and donors in this space: large development
organizations (World Bank, USAID, UNEP, CEPALC), local government
(BME and Ministry of Environment), major energy companies (Shell, Elf,
Total, Sodigaz), international non-profits (CARE, International Lifeline
Fund), and local enterprises.
•Though many plans and projects were well designed, a significant
number were never implemented, and several terminated early due
external factors.
The limited literature evaluating these projects and strategies in
combination with key informant interviews identified three common
barriers to realizing sustained impacts:
Price—all projects noted the price of the stoves compared to traditional
stoves as the principal barrier to entry in the market. Few projects were able
to reduce the price through a market-based approach and many turned to
stove giveaways and direct subsidies to catalyze the market. Inability to
coordinate the private sector and limited scale prevented long-term and
substantial impact. Those who attempted to overcome the price barrier with
strategic subsidies did not have an exit strategy or long-term sustained
financing.
Limited timeframe— the vast majority of projects lasted less than three
years. The short timeframes of past projects and plans hindered even the
most well-developed proposals. Due to the many challenges of operating in
Haiti, projects found that 1 to 5-year funding cycles were simply not sufficient
amount of time to realize impacts.
Lack of institutions and regulation—the lack of standards and
regulations, as well as the coordinating mechanisms, institutions, and
distribution channels necessary to support the market have prevented
enterprise scale-up. Specifically, for LPG and ethanol, the lack of existing
regulation and high taxes and tariffs inhibit increased imports and scale.
Additionally, the importance and pervasiveness of informal charcoal
production with little clarity in government regulation challenged projects
promoting alternative fuels.
Key lessons learned from past projects include:
1. Sustained, long-term financing is needed for a large-scale
cookstoves and fuels strategy to succeed in Haiti.
2. Coordination and buy-in across sectors is imperative to ensure
that the impacts on health, environment, agriculture, livelihoods,
and women are measurably achieved.
3. Government support is crucial to ensure that the policy
environment in Haiti is conducive to the scale up of cleaner,
more efficient cookstoves and fuels.
Insights from 20+ Years of Cookstoves and Fuels Programs

82
Guiding Principles for a Successful Large-scale Cookstoves and
Fuels Strategy
• Inclusive market-based interventions have proven more effective than stove giveaways at achieving the adoption of cleaner and more efficient cookstoves and fuels.
Market-based approach.
• While wood charcoal will remain a cooking fuel for the foreseeable future, consumers must be able to choose from a variety of cleaner and more efficient cookstoves and fuels.
Technology and fuel neutrality.
• Capitalizing on women’s role as clean energy entrepreneurs and leaders in national and local efforts lead to the development of effective, culturally-appropriate, and sustainable solutions.
Women’s empowerment.
• The substantial barriers to accessing cleaner and more efficient cooking energy requires a sustained investment to transform the market.
Long-term and sustained efforts.
• Local ownership drives sustainability; building on lessons learned from past projects, and relying on the expertise of Haitian managers lends itself to more effective program design and implementation.
Local expertise.
• Building on the ongoing work, knowledge, and expertise of local sector partners – including the many complementary donor, civil society, and private sector initiatives underway in Haiti, prevents duplication and allows for the design of more effective interventions.
Collaboration.

83
Auch, J. 2014. Wasteland – Charcoal in Haiti. Retrieved October 27, 2016, from http://jonathanauch.com/charbon/
Bailis, R., Drigo, R., Ghilardi, A., & Masera, O. 2015. The Carbon Footprint of Traditional Woodfuels. Nature Climate Change, 5, 266-272.
Bailis, Rob, Adrian Ghilardi, and Andrew Tarter. 2016. Geospatial Mapping of Charcoal and Fuelwood Renewability in Haiti and Potential
Environmental Benefits from Woodfuel Interventions. Stockholm Environmental Institute and Universidad Nacional Autonoma de
Mexico. Prepared for Global Affairs Canada and the Global Alliance for Clean Cookstoves.
Batliwala, S., and Reddy, A., (1996), “Energy for Women and Women for Energy: Empowering Women though Energy Entrepreneurship”, in:
ENERGIA New, Vol. 1, No. 1.
Berkeley Air Monitoring Group and the Institute Haitien de l’Energie (2016) “Rapid Assessment of User Perceptions of Carbonized
Agricultural Waste Briquettes Fuels: Haiti 2016,” prepared for Global Affairs Canada and the Global Alliance for Clean Cookstoves
Bond et al. 2013. Bounding the role of black carbon in the climate system: a scientific assessment. Journal of Geophysical Research:
Atmospheres, Vol. 118: 5380-5552.
Booker, K., Han, T., Granderson, J., Jones, J., Lask, K., Yang, N., Gadgil, A., 2011. “Performance of Charcoal Cookstoves for Haiti, Part 1:
Results from the Water Boiling Test,” Environmental Energy Technologies Division, Lawrence Berkeley National Laboratory.
http://cookstoves.lbl.gov/haiti/lbnl-5021e.pdf
Bureau of Mines and Energy. 2006. Haiti Energy Sector Development Plan 2007-2017. Ministry for Public Works, Transportation and
Communications and Electricity Haiti.
Charles, Gregory, Colette Vilgrain and Mildred Regis 2002. « Evaluation des effets du project Energie et Environnement » CARE-Haiti.
CEPALC 2005, « Analyse de la substitution entre combutibles dans le secteur residentiel en Haiti. »
Charles, Gregory; Colette Vilgrain and Mildred Regis (2002), « Evaluation des effets du project : Energie et Environnement,” CARE-Haiti,
2002.
Churches, C. E., Wampler, P. J., Sun, W., & Smith, A. J. (2014). Evaluation of forest cover estimates for Haiti using supervised classification
of Landsat data. International Journal of Applied Earth Observation and Geoinformation, 30, 203-216. doi:
http://dx.doi.org/10.1016/j.jag.2014.01.020
CLASP. 2016. Transforming the Cookstove Market through Standards and Labels in Haiti,” prepared for Global Affairs Canada and the
Global Alliance for Clean Cookstoves.
Clean Cookstoves Catalog. 2015. http://catalog.cleancookstoves.org/
Cobb, C. 1987. Haiti: Against All Odds. National Geographic, 172(5), 645–670.
CSU. 2016. Haitian Stove Testing Final Report. Colorado State University Energy Institute, prepared for Global Affairs Canada and the
Global Alliance for Clean Cookstoves.
Bibliography

84
Dalberg (2016. Analysis of Taxes and Tariffs for Clean and Efficient Cookstoves and Fuels in Haiti. Prepared for Global Affairs Canada and
the Global Alliance for Clean Cookstoves.
DHS. 2012. “Enquete Mortalite, Morbidite et Utilisation des Services EMMUS-V,” Ministere de la Sante Publique et de la Population (MSPP).
Diamond, J. M. (2005). Collapse: How Societies Choose To Fail Or Succeed: Viking Penguin.
Ducasse J. 2008. Comprendre et Avancer-Propane et destruction environnementale. Radio Kiskeya.
http://radiokiskeya.com/spip.php?article5325
Earth Institute (2012) “Integrated Baseline Study Ten Communes of the Southwest Coast, South Department, Haiti.” Columbia University, p
154
ECVMAS Database. “The Survey of Household Living Conditions After the Earthquake,” (ECVMAS). Haitian Institute of Statistics and
Information (IHSI). (2012). http://www.ihsi.ht/produit_enq_nat_ecvmas.html
ENEA. 2016. Cooking fuels in Haiti; environmental, economic and social assessment of cooking fuels in Haiti for the Global Alliance for
Clean Cookstoves. Prepared for Global Affairs Canada and the Global Alliance for Clean Cookstoves.
Ernest and Young. 2012. Scaling up; Why women-owned businesses can recharge the global economy.
http://www.ey.com/Publication/vwLUAssets/Scaling_up_-_Why_women-
owned_businesses_can_recharge_the_global_economy/$FILE/Scaling%20up%20-
%20why%20women%20owned%20businesses%20can%20recharge%20the%20global%20economy.pdf
ESMAP. 2007. Haiti: Strategy to Alleviate the Pressure of Fuel Demand on National Woodfuel Resources. Washington, DC: Energy Sector
Management Assistance Program.
FAO. 2010. Global Forest Resources Assessment 2010. Rome
Food Cultures of the World, 2011
Ghilardi, A., Bailis, R., Mas, J. F., Skutsch, M., Elvir, J. A., Masera, O., . . . Vega, E. 2016. Spatiotemporal modeling of fuelwood
environmental impacts: towards an improved accounting of non-renewable biomass. Environmental Modelling & Software, 82, 241-254.
Global Burden of Disease. 2015. Country Profiles, Haiti. Insitute for Health Metrics and Evaluation. http://www.healthdata.org/haiti
Global Burden of Disease. 2015. Results Tool. Insitute for Health Metrics and Evaluation. http://ghdx.healthdata.org/gbd-results-tool
Global Burden of Disease. 2013. Results Tool. Insitute for Health Metrics and Evaluation. http://ghdx.healthdata.org/gbd-results-tool
Gronewold, N. 2009. Environmental destruction, chaos bleeding across border. GreenWire. Retrieved October 31, 2016, from
http://www.eenews.net/stories/85634
Bibliography
85
Global Alliance for Clean Cookstoves. 2016. Haiti Cookstoves and Fuels Market Assessment: Preliminary Report.
Haiti – The World Factbook. 2016. Central Intelligence Agency
Bureau des Mines et Energie. 2006. Haiti Energy Sector Development Plan 2007-2017, Bureau des Mines et Energie; National Strategy.
DHS. 2012. Haiti: Demographic and Health Surveys, USAID
Global Alliance for Clean Cookstoves. Household Air Pollution Intervention Tool for Comparing Health Impacts of Cooking Technologies.
IEA. 2014. Haiti: Renewables and Waste for 2014. International Energy Agency Statistics.
https://www.iea.org/statistics/statisticssearch/report/?country=Haiti&product=RenewablesandWaste
Institut Haitien de Statistique et D’informatique (IHSI). 2015
Ministère de l’Education Nationale et de la Formation Professionnelle (MENFP). 2011.
Nexant. 2010. Short Term Task Order--Fast Response Technical Expertise to EGAT/I&E; Final Report: Assessment of Haiti Alternative
Cooking Technologies Program. USAID.
Nexant. 2010. Final Report: Assessment of Haiti Alternative Cooking Technologies Program. USAID.
http://pdf.usaid.gov/pdf_docs/Pnadx776.pdf
Phanol, Phillipe; Atonine Wesner and Betonus Pierre. 2015. Haiti Improved Cooking Technology Program (ICTP): Final Performance
Evaluation Report. USAID and Chemonics.
Sagbo, Nicaise S. 2014. Economic Analysis and Willingness to Pay for Alternative Charcoal and Clean Cook Stoves in Haiti. Theses and
Dissertations--Agricultural Economics. Paper 28.
Shankar, Anitak V., Mary Alice Onyura, and Jessica Alderman. 2015. Understanding Impacts of Women’s Engagement in the Improved
Cookstove Value Chain. Johns Hopkins Bloomberg School of Public Health, ESVAK Kenya, and Envirofit International. Commissioned
by the Global Alliance for Clean Cookstoves. http://cleancookstoves.org/resources/356.html
Stevenson, G. G. 1989. The production, distribution, and consumption of fuelwood in Haiti. The Journal of Developing Areas, 59-76.
Stork, Adrienne and Jean Elie Thys. 2016. Haiti South Department Forest Energy Supply Chains. UNEP, Haiti.
Suppy, Steve. 2015. Mission Report: Landscape Restoration Through Wood Energy Production-Haiti. World Bank.
Sweeney, Dan. 2015. Field Evaluation of Alternative and Traditional Cooking Fuels in Haiti. Massachusetts Institute of Technology.
Tarter, Andrew. 2015. Adaptive Arboreal Practices: Haitian Farmer Responses to On-going Deforestation. PhD Dissertation. Department of
Anthropology, University of Florida.
Tarter, Andrew. 2016. Haiti Is Covered with Trees. EnviroSociety.
Tarter, A., Kennedy Freeman, K., & Sander, K. 2016. A History of Landscape-level Land Management Efforts in Haiti: Lessons Learned from
Case Studies Spanning Eight Decades. Washington DC: World Bank Press.
Bibliography

86
Thivillion, Thomas. 2015. The Experience of the Recho Mirak: Feedback from three decades of promoting improved stoves in Haiti. FACTS
REPORT. http://factsreports.revues.org/2824?lang=en
USAID. 2010. Gender Assessment for USAID/Haiti Country Strategy Statement. Prepared by Dalberg Global Advisors.
http://pdf.usaid.gov/pdf_docs/PA00K556.pdf
UNFCCC, 2016; Agence France-Presse, 2015
LeFebvre, Oliver. 2012. Improved cooking Technology Program (Recho Paw): Longitudinal Study of Eight Improved Cookstoves in Port-au-
Prince. USAID.
Van der Plas, R. 2007. Haiti: Strategy to Alleviate the Pressure of Fuel Demand on National Woodfuel Resources Energy Sector
Management Assistance Program: The World Bank Group.
Voltaire, K. 1979. Charcoal in Haiti. Port-au-Prince: USAID.
Woetzel, J. et al. 2015. How advancing women’s equality can add $12 trillion to global growth. McKinsey Global Institute.
http://www.mckinsey.com/global-themes/employment-and-growth/how-advancing-womens-equality-can-add-12-trillion-to-global-growth
WHO. 2006. Household Energy, Indoor Air Pollution and Health. World Health Organization.
http://www.who.int/indoorair/publications/fflsection1.pdf
WHO Guidelines for Indoor Air Quality: Household Fuel Combustion
Williams, Vereda J. 2011. A Case Study of Desertification of Haiti: Canadian Center of Science Education.
World Bank. 2007. Haiti: Strategy to Alleviate the Pressure of Fuel Demand on National Woodfuel Resources. ESMAP Technical Paper
112/07.
World Bank. 2015. World Development Indicators metadata. http://databank.worldbank.org/data/reports.aspx?source=2&country=HTI
World Food Programme. 2016. Haiti Country Brief.
Bibliography