glenn williams, jeff brum, rachel forcino, fred vogt glaxosmithkline xrpd line broadening analyses...
TRANSCRIPT

Glenn Williams, Jeff Brum, Rachel Forcino, Fred Vogt
GlaxoSmithKline
XRPD Line Broadening Analyses to Study Micronization Induced Disorder and Environmental Annealing

Why Study Micronization Induced Disorder?
Non-Micronized Milling
Micronized
Process of micronization results in significant attrition with consistent micron size particles, but the high energy process may also induce an
element of “disorder” in the material.
While this process improves dissolution and particle uniformity of the API the resulting “disorder” may affect stability and physicochemical
properties, ultimately with a potential effect on dissolution and particle uniformity??
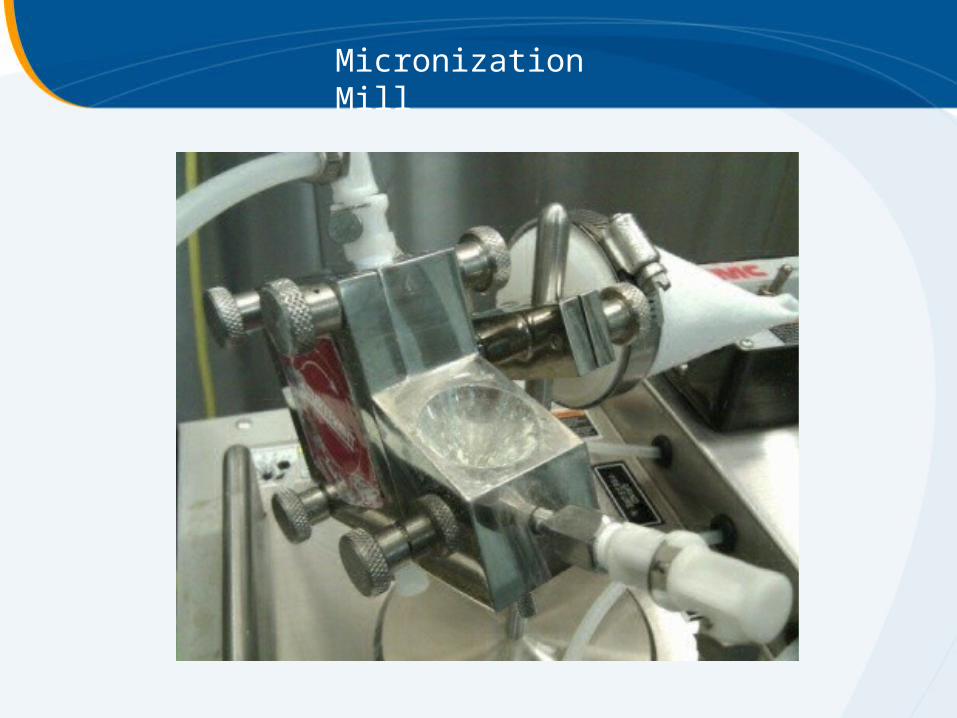
Micronization Mill

Changes in Physical Properties
Are we investigating all the possible changes that may occur and the impact of those changes on the final formulation/processing and product?
-0.14
-0.12
-0.10
-0.08
Heat F
low
(W
/g)
80 100 120 140 160 180 200
Temperature (°C)
Sample: GW786034B (Pazopanib) Bx 108001Size: 4.1240 mgMethod: STANDARD DSC METHODComment: Top of keg. Keg 2 of 8
DSCFile: I:...\GW786034B\108001 TOP KEG DSC.001Operator: COFRun Date: 16-Sep-2010 16:58Instrument: DSC Q2000 V24.2 Build 107
Exo Up Universal V4.2E TA Instruments
-0.5
-0.4
-0.3
-0.2
-0.1
0.0
Heat F
low
(W
/g)
80 130 180
Temperature (°C)
Sample: GW786034B_K074440_DSCSize: 2.5840 mgMethod: DSC_GW786034Comment: EE176981
DSCFile: I:...\GW786034\GW786034B_K074440_DSC.001Operator: RGFRun Date: 07-Jun-2007 14:06Instrument: DSC Q1000 V9.0 Build 275
Exo Up Universal V4.2E TA Instruments
0.0
0.2
0.4
0.6
De
riv.
We
igh
t (%
/°C
)
70
75
80
85
90
95
100
We
igh
t (%
)
0 50 100 150 200 250 300
Temperature (°C)
Sample: GW786034B Ball MilledSize: 10.3660 mgMethod: Standard MethodComment: Ball Milled
TGAFile: GW786034B_US061115667_BALLMILLED_TGA.001Operator: BLRun Date: 01-Jun-2006 10:48Instrument: TGA Q500 V6.3 Build 189
Universal V4.2E TA Instruments
0.0
0.2
0.4
0.6
De
riv.
We
igh
t (%
/°C
)
75
80
85
90
95
100
105
We
igh
t (%
)
0 50 100 150 200 250 300
Temperature (°C)
Sample: GW786034B_K074440Size: 27.5940 mgMethod: Standard MethodComment: EE176981
TGAFile: I:...\GW786034\GW786034B_K074440_TGA.001Operator: MBRun Date: 07-Jun-2007 15:47Instrument: TGA Q500 V6.3 Build 189
Universal V4.2E TA Instruments
Surface Area
Surface Energy
CrystallinityXRPD
ThermalDSC, TGA
Moisture Sorp.GVS

“Disorder”?
Disordered
FRAC
Non-
crys
tallin
e
TURED
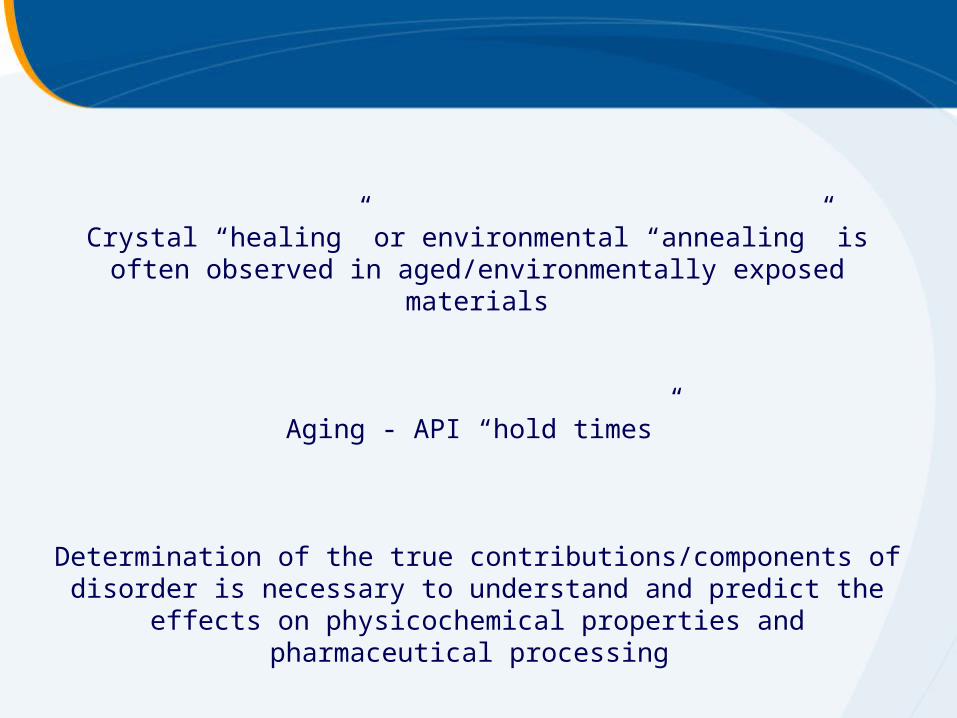
Crystal “healing” or environmental “annealing” is often observed in aged/environmentally exposed materials
Aging - API “hold times”
Determination of the true contributions/components of disorder is necessary to understand and predict the effects on physicochemical
properties and pharmaceutical processing

180.01°C
175.36°C(I)
158.83°C
-1.05
-1.00
-0.95
-0.90
-0.85
Hea
t F
low
(W
/g)
-6
-4
-2
0
2
Hea
t F
low
(W
/g)
-100 0 100 200 300 400
Temperature (°C)Exo Up Universal V4.2E TA Instruments
Micronized
Ball milled
Ball milled
Thermal Analysis Comparison of Milled API
Tg
Tg of amorphous standard higher than exotherm in micronized API

Surface vs Bulk Amorphous
Wu, T.; Sun, Y.; Li, N.; de Villiers, M.; Yu, L. Langmuir 2007, 23, 5148
Lei Zhu & Janan Jona & Karthik Nagapudi & Tian Wu Pharm Res (2010) 27:1558–1567
Sayantan Chattoraj, Chandan Bhugra, Chitra Telang, Li Zhong and Zeren Wang, Changquan Calvin Sun. Pharm Res, 2012, Volume 29, Number 4, Pages 1020-1032

Amorphous griseofulvin 13C T1 and T1ρ measurements
Lower 13C T1ρ and T1 values are consistent with higher molecular mobility in the ground sample
Variable temperature measurements were not performed because of “ground” sample instability – recrystallization occurs rapidly under MAS spinning conditions
13C T113C T1ρ
Melt-quench (initial) 1.60 ± 0.12 s 78 ± 13 ms
Melt-quench(ground) 0.74 ± 0.18 s 45 ± 13 ms

Griseofulvin 13C CP-TOSS spectra

13C CP-TOSS spectra
Micronized API(red trace) shows the signature of amorphous material

145.68°C
153.49°C
-0.2
0.0
0.2
0.4
0.6
0.8
1.0
Hea
t F
low
(m
W)
-0.8
-0.6
-0.4
-0.2
0.0
0.2H
eat
Flo
w (
W/g
)
0 50 100 150 200 250
Temperature (°C)Exo Up Universal V4.2E TA Instruments
Micronized 60 psi
Micronized 20 psi
Thermal Analysis Comparison of API with Varied Micronization Energy
Amorphous component (exotherm) increases with increased micronization energies

Gravimetric Vapor Sorption
Re-crystallization

Post Gravimetric Vapor Sorption
Post GVS
After one GVS cycle the re-crystallization event is gone –consistent with amorphous recrystallization
-0.8
-0.6
-0.4
-0.2
0.0
0.2
0.4
Hea
t F
low
(W
/g)
20 40 60 80 100 120 140 160 180 200
Temperature (°C)
034 MICRONIZED dry 20psi rerun 20Feb.001034 MICRONIZED DRY 20PSI Post GVS RERUN 20FEB.002
Exo Up Universal V4.2E TA Instruments

Separating Components of Disorder
Amorphous
Thermal analysisGVS-recrystallization
SS-NMR
Nano-crystalline content
XRPD – line broadeningGVS/porositySurface area

Why XRPD Line Broadening?
Why study micronized materials by XRPD?
Crystal is essentially a 3D molecular diffraction grating
http://physics-animations.com/Physics/English/DG10/

The Scherrer Equation
cos
2L
KB
Peak width (B) is inversely proportional to the crystallite size (L)
P. Scherrer, “Bestimmung der Grösse und der inneren Struktur von Kolloidteilchen mittels Röntgenstrahlen,” Nachr. Ges. Wiss. Göttingen 26 (1918) pp 98-100.
Short Range vs. Long Range Order

XRPD – Particle vs. Crystallite

XRPD – Instrumental Factors
Same sample – Different instrument settingsNeed quality and consistent data collection

capillary
Capillary sample may be loaded into holder (pre-aligned) and analyzed in standard transmission setup with auto-changer and without need for instrument
reconfiguration to capillary analysis with standard goniometer heads.
Convenient Capillary Analysis Setup
Possible Spinning in both X-Y and X-Z
planes
XRPD – Sample Analysis

XRPD – Sample Analysis – Transmission Setup

Visual Comparison of Raw Patterns
5 10 15 20 25 30 35 40 45 50 552Theta (°)
0
20000
40000
60000
80000Inte
nsity
(cou
nts)

Profile Fitting To Obtain FWHM
Position [°2Theta]
10 20 30 40 50
Counts
0
20000
40000
x2813a1-RoomTempx2813a1 100.0 %
Position [°2Theta]
10 20 30 40 50
Counts
0
20000
40000
x2813a1-RoomTempx2813a1
10 20 30 40 50
Counts
0
20000
40000
FWHM

XRPD – Sample Analysis
Non-micronized and freshly micronized materials show significantdifferences in linewidth – consistent and suitable for analysis
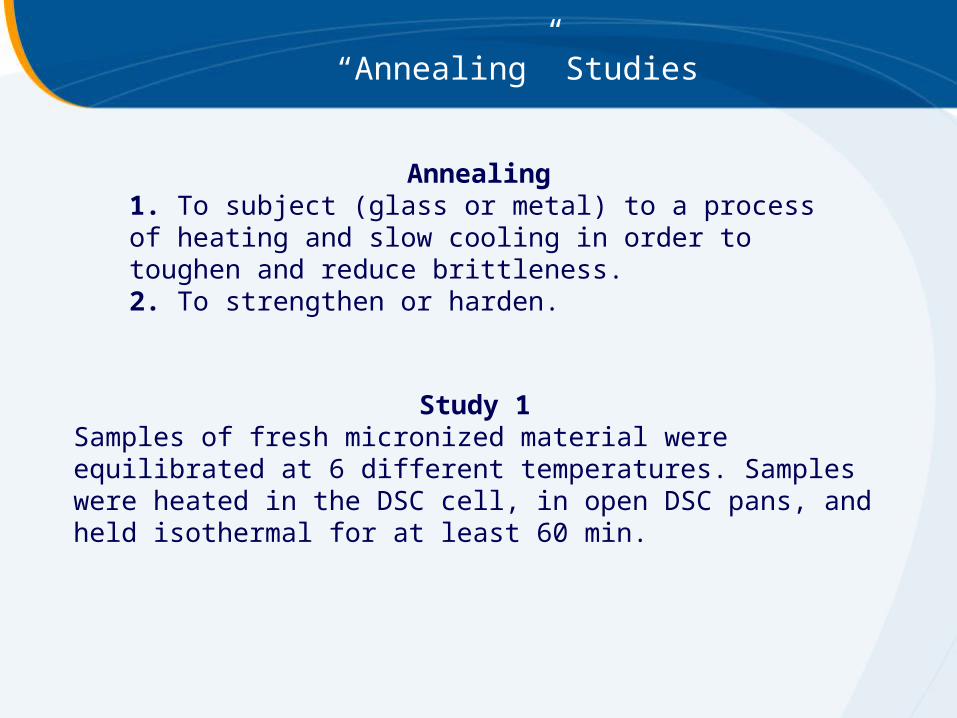
“Annealing” Studies
Study 1 Samples of fresh micronized material were equilibrated at 6 different temperatures. Samples were heated in the DSC cell, in open DSC pans, and held isothermal for at least 60 min.
Annealing1. To subject (glass or metal) to a process of heating and slow cooling in order to toughen and reduce brittleness.2. To strengthen or harden.

Study 1 Results
Linear relationship observed with increasing temperature and XRPD linewidth (FWHM) – Increase in crystallite size as increase temperature

LiCl (~10 %) NaBr ( ~50 %) K2SO4 (~95%)Ambient Ambient Ambient
50 °C 50 °C 50 °C
Study 2 Samples of micronized material lot stored at 3 different RHs and at 2 different temperatures. Samples were pulled periodically over a several week period of time.
Environmental “Annealing”

Study 2 – Time Course
Within 2 weeks all conditions appear to have reached an equilibrium with respect to a reduced FWHM

Study 2 – Temperature Humidity Effect
A synergistic effect on annealing is apparent with increased temperature and relative humidity

Freshly Micronized “Annealed”
Microscope Comparison
No obvious difference in particles post “annealing” - Consistent with healing of fractures/fines.

Healing of Fractures
Increase in averaged crystallite size

“Fresh” “Aged”

“Fresh” “Aged”

Conclusions
With further study we may be able to better understand “disorder” generated in micronized API’s and separate the contributions of true glassy amorphous and nano-crystalline content.
We are currently evaluating the physiochemical changes that are associated with this observed crystal “healing” - related moisture sorption, surface area and porosity, thermal, XRPD, and ssNMR data.
We are applying this same methodology to other projects with similar observations/results.

Acknowledgements
Jeff Brum
Rachel Forcino
Fred Vogt (SS-NMR)
Robert Carlton (SEM)