giwa regional assessment 24
TRANSCRIPT


Global International Waters Assessment
Regional assessments

Other reports in this series:
Russian Arctic – GIWA Regional assessment 1a
Caribbean Sea/Small Islands – GIWA Regional assessment 3a
Caribbean Islands – GIWA Regional assessment 4
Barents Sea – GIWA Regional assessment 11
Baltic Sea – GIWA Regional assessment 17
Caspian Sea – GIWA Regional assessment 23
Gulf of California/Colorado River Basin – GIWA Regional assessment 27
Yellow Sea – GIWA Regional assessment 34
East China Sea – GIWA Regional assessment 36
Patagonian Shelf – GIWA Regional assessment 38
Brazil Current – GIWA Regional assessment 39
Amazon Basin – GIWA Regional assessment 40b
Canary Current – GIWA Regional assessment 41
Guinea Current – GIWA Regional assessment 42
Lake Chad Basin – GIWA Regional assessment 43
Benguela Current – GIWA Regional assessment 44
Indian Ocean Islands – GIWA Regional assessment 45b
East African Rift Valley Lakes – GIWA Regional assessment 47
South China Sea – GIWA Regional assessment 54
Sulu-Celebes (Sulawesi) Sea – GIWA Regional assessment 56
Indonesian Seas – GIWA Regional assessment 57
Pacifi c Islands – GIWA Regional assessment 62

Global International Waters Assessment
Regional assessment 24Aral Sea
GIWA report production
Series editor: Ulla Li Zweifel
Editorial assistance: Matthew Fortnam, Monique Stolte
Maps & GIS: Rasmus Göransson
Design & graphics: Joakim Palmqvist

Global International Waters AssessmentAral Sea, GIWA Regional assessment 24
Published by the University of Kalmar on behalf of United Nations Environment Programme
© 2005 United Nations Environment Programme
ISSN 1651-940X
University of KalmarSE-391 82 KalmarSweden
United Nations Environment ProgrammePO Box 30552,Nairobi, Kenya
This publication may be reproduced in whole or in part and in any form for educational or non-profi t purposes without special permission from the copyright holder, provided acknowledgement of the source is made. No use of this publication may be made for resale or for any other commercial purpose whatsoever without prior permission in writing from the United Nations Environment Programme.
CITATIONSWhen citing this report, please use:UNEP, 2005. Severskiy, I., Chervanyov, I., Ponomarenko, Y., Novikova, N.M., Miagkov, S.V., Rautalahti, E. and D. Daler. Aral Sea, GIWA Regional assessment 24. University of Kalmar, Kalmar, Sweden.
DISCLAIMERThe views expressed in this publication are those of the authors and do not necessarily refl ect those of UNEP. The designations employed and the presentations do not imply the expressions of any opinion whatsoever on the part of UNEP or cooperating agencies concerning the legal status of any country, territory, city or areas or its authority, or concerning the delimitation of its frontiers or boundaries.
This publication has been peer-reviewed and the information herein is believed to be reliable, but the publisher does not warrant its completeness or accuracy.
Printed and bound in Kalmar, Sweden, by Sunds Tryck Öland AB.

CONTENTS
Contents
Preface 9Executive summary 11Acknowledgements 14Abbreviations and acronyms 15Regional defi nition 17Boundaries of the region 17Physical characteristics 18Socio-economic characteristics 22
Assessment 29Freshwater shortage 29Pollution 34Habitat and community modifi cation 39Unsustainable exploitation of fi sh and other living resources 43Global change 43Priority concerns for further analysis 47
Causal chain analysis 48Introduction 48Causal chain analysis 48Conclusions 55
Policy options 56Defi nition of the problem 56Policy options 57Recommended policy options 57Conclusion 59
Conclusions and recommendations 60References 62Annexes 67Annex I List of contributing authors and organisations 67Annex II Detailed scoring tables 68Annex III List of important water-related projects 71
The Global International Waters Assessment iThe GIWA methodology vii


PREFACE 9
Preface
Water has always been the most limiting factor for the inhabitants
of Central Asia. Historically, the countries of the region have adapted
to the water scarce conditions through a legacy of sustainable water
management that dates back several thousand years.
The Global International Waters Assessment (GIWA) of the Aral Sea Basin
describes how since the 1960s water abstraction for economic activities,
particularly irrigated farming, has become unsustainable and now
exceeds the carrying capacity of the region’s ecosystems. Insuffi cient
water is allocated to the lower reaches of the region’s rivers and the
Aral Sea, which has resulted in an environmental catastrophe. The
inhabitants of the region are now forced to survive under conditions
of increasing water stress. Against this backdrop, poverty and poor
health are rife throughout the region, from the Tajik mountains to the
waterlogged wetlands of Karakalpakstan.
The assessment takes a holistic approach to analysing the transboundary
environmental concerns of the region and in identifying the root causes
behind these problems. Specialists of various environmental and socio-
economic disciplines expressed the immanency of the situation and
the need to take urgent action. Recent progress in addressing water
management issues is also discussed in the report and various options
are proposed to reverse the negative trends in the condition of the
aquatic environment of the Aral Sea Basin.
Donors for over a decade have funded various initiatives aimed at
resolving the causes of freshwater shortage in the region, but with
limited progress realised. In fact, a sardonic proverb concludes that, “If
all visiting experts had brought a bowl of water with them the Aral Sea
would have been fi lled up again.”
With the present global agenda set on achieving sustainable
development and eradicating poverty, the countries of Central Asia
must foremost address the root causes of its water problems. The
UN International Decade for Action 2005–2015, Water for Life, was
launched by the President of Tajikistan who also raised international
awareness of the water crisis in Central Asia. In the forthcoming years
water polices, aimed at achieving the Millennium Development Goals,
will be implemented in all the countries of the region.
In this context the GIWA assessment serves as a useful tool for decision
makers when exploring new mechanisms to resolve the situation.
Complementary to the GIWA assessment, the Global Water Partnership
(GWP) provides a neutral forum for regional stakeholders to discuss
relevant water issues and formulate solutions through sustainable and
equitable water management practices.
During the GWP Central Asia and Caucasus stakeholder conference
in Bishkek, Kyrgyzstan, in January 2005, the outcomes of the GIWA
assessment were presented and discussed by participants. While the
global community may assist in catalysing change, restructuring the
water agenda of Central Asia into a sustainable framework must be
undertaken by regional policymakers.
Björn Guterstam
Network Offi cer
Global Water Partnership Secretariat, Stockholm


EXECUTIVE SUMMARY 11
Executive summary
The Aral Sea Basin (GIWA region 24) is located in Central Asia and entirely
or partially, covers Kazakhstan, Kyrgyzstan, Uzbekistan, Tajikistan,
Turkmenistan, Afghanistan and Iran. The transboundary waters of
the region are the Syrdarya and Amudarya rivers, which have a major
hydrological impact on the Aral Sea Basin.
The GIWA Assessment evaluates the current status and the historical
trends of each of the fi ve predefi ned GIWA concerns i.e. freshwater
shortage, pollution, habitat and community modifi cation, unsustainable
exploitation of fi sh and other living resources, global change, and
their constituent issues. The assessment determined that freshwater
shortage exerted the greatest impacts on the Aral Sea Basin. The eff ect
of climate change on freshwater shortage has also been considered in
this report.
Freshwater shortage is a fundamental problem for the countries of
Central Asia which has led to the destruction of ecosystems in the
Aral Sea and the degradation of terrestrial and aquatic ecosystems in
Priaralye. As a result of freshwater shortages, the reuse of return waters
in irrigated farming is becoming more frequent, resulting in heavy
soil salinisation and the pollution of surface and underground waters.
Consequently, poor quality drinking water is having severe health
impacts on the population, particularly in Priaralye.
In the 1960s when the total population in fi ve countries in the region
(excluding Afghanistan and Iran) was approximately 15 million, more
than 50% of the annual water yield of the Syrdarya and Amudarya
rivers was used for economic purposes. Since the beginning of the
1980s the renewable water resources of the Syrdarya and Amudarya
basins are fully exploited and the regional economy is developing under
conditions of increasingly severe water shortages.
In view of this situation the concern of freshwater shortage, and more
specifi cally the issue of stream fl ow modifi cation, was prioritised for
Causal chain analysis (CCA) and Policy options analysis (POA). The GIWA
Task Team identifi ed the following as immediate causes of modifi cation
of stream fl ow:
Increased diversion;
Decreased ice resources;
Inter-annual climatic variability.
The main root causes of increased diversion stem from the regulation
of rivers by reservoirs, which store huge volumes of water for irrigation
and power generation. The collapse of the USSR triggered further
problems for the region. The previously integrated economic system
fragmented, and social and economic turmoil followed, e.g. civil war
in Tajikistan (1992-1997). The quotas from the Soviet era have been
maintained and they regulate water use to some degree. However, in
recent years Kyrgyzstan and Tajikistan have persistently disputed the
current system of quotas and demand that they be revised. There is
insuffi cient coordination between upstream and downstream states
regarding the allocation of water resources and a lack of mechanisms
aimed at regulating the diversion of rivers. Confl icts between the
various water users, particularly hydropower engineering and irrigation,
remain unresolved.
The following were identifi ed as root causes of freshwater shortage in
the region:
Demographic: Increases in population have led to greater pressure on
the water resources of the Aral Sea Basin.
Economic: The collapse of the economic system formed under
Soviet rule, has led to a recession in the region and social upheavals.
Consequently, investment in the agricultural sector reduced, which led
12 GIWA REGIONAL ASSESSMENT 24 ARAL SEA
to a decline in the productivity and the water effi ciency of irrigation
systems. Water users are not given economic incentives to conserve
water resources and there is no common approach to economically
evaluating water.
Legal: There is weak legislation regulating water management. A
mutually acceptable legislative framework for interstate sharing of
transboundary water resources is absent. The current water legislation
was formulated during the Soviet period and is not appropriate under
present-day conditions.
Governance: The transboundary nature of the major watershed basins in
the region makes it impossible to solve the freshwater shortage concern
without inter-state agreements. Many of the agreements made to date
have not been implemented or adhered to by the countries of the
region. For example, despite the governments signing agreements
aimed at resolving the water management issues, all of the countries
in the region intend to increase their irrigated areas. The transboundary
water management system is inadequate as it is based on the principles
of centralised regulation formed in the Soviet period. There is a lack
of clearly formulated national water strategies and each country’s is
signifi cantly diff erent, adopting various approaches to addressing the
problems of interstate use of water resources of transboundary basins
management. The national strategies are not integrated at the regional
level, for example, through a regional water strategy.
Knowledge: The lack of knowledge regarding the contemporary
characteristics of the region’s water resources and future climatically
induced changes in freshwater availability, is severely hindering
policy makers in making informed decisions in order to resolve water
management issues.
Technology: Water resources are not being utilised effi ciently due to
irrigated agriculture employing outmoded technology. Economic
constraints and the lack of economic incentives for farmers to save
water, is preventing the adoption of water saving technologies.
Climatic variability: Freshwater shortage may become even more acute
over the next few decades if as predicted, water resources in the region’s
major river basins reduce by 20-40%. However, some predictions show
anthropogenic induced climate change to play a less signifi cant role
than was previously thought as there is evidence of a compensating
mechanism in the formation of run-off which is maintaining the total
volume of renewable water resources.
The current use of transboundary water resources in Central Asia
is complex due to a range of demographic, socio-economic and
ecological trends. In the post-Soviet period essential diff erences have
been revealed concerning the approaches used by the countries within
the region to the mutual use of regional water resources, especially
regarding the principles and criteria of interstate water sharing and
the legal and economic mechanisms of water use. In addition to
the economic problems encountered during the transitional period
from Soviet rule, coordination between the countries in the sharing
of transboundary water resources and nature protection has also
proved problematic. Despite eff orts by the region’s governments and
the international community, the situation of water supply in Central
Asian states remains critical. One of the main reasons for the lack of
progress is the tendency of governments to take unilateral decisions
and actions, which often exacerbate problems in other countries due
to the transboundary nature of water resources.
A signifi cant reduction in the volume of water resources used in human
activities is unlikely in the region, at least in the immediate future.
However, water management in the forthcoming decades can be
based upon the modern volume of available water resources, as there
is not believed to be signifi cant reductions in freshwater availability
as a result of climate changes. Despite the considerable reduction
in glacial resources, the fl ow rates of the main rivers have remained
relatively unaltered in recent decades, suggesting the existence of a
compensating mechanism. It is believed that an infl ow of freshwater
from the melt-water of underground ice accumulates in the perennial
permafrost. The area of perennial permafrost is many times greater
than the area of present-day glaciers, and therefore even slight melting
of the permafrost could compensate for the reduction in freshwater
supply caused by the decline in the area of the glaciers. This has yet
to be adequately researched by the scientifi c community, despite its
importance when considering the infl uence of climate changes on
freshwater resources.
Increased water abstraction may lead to an ecological disaster by the
year 2010. The situation is so critical that this scenario may transpire if
only one of the countries increases abstraction of surface waters. The
success of interstate agreements on the sharing of water resources
may be jeopardised by the current level of water use, the continued
deterioration of water infrastructure and degradation of the environment.
A prerequisite to resolving the freshwater shortage problem is a
comprehensive knowledge of the hydrodynamics of the region.

EXECUTIVE SUMMARY 13
The report highlights policy options which governments could
implement and incorporate into strategic policies. The main
recommendations are:
The development and enactment of national water strategies
that comply with international water law and take into account
the interests of all the countries in the region. They should aim to
increase the effi ciency of water use, primarily in irrigated farming,
and promote the conversion of water intensive crops, such as rice
and cotton, to less water intensive crops.
To broaden the understanding of socio-economic and
environmental characteristics and their relationship with the water
resources of the region.
To initiate and support scientifi c research on water and the
environmental and socio-economic problems of the region.
At the regional level, it is recommended that: i) the existing system of
water resources management be reorganised; ii) a new multi-lateral
water sharing agreement be created; and iii) water pricing systems be
introduced.
The tasks deserving special attention by the region’s governments and
the international community are:
The creation of an interstate body empowered to implement
eff ective and confl ict-free regional water resources management.
The development of a system of mutually acceptable political
and legislative decisions and measures in order to facilitate the
equitable and sustainable use of the region’s water resources.
Financial, technical and organisational support is required from
international organisations in the:
reconstruction and updating of irrigation systems to increase water
effi ciency;
development of legislative principles and mechanisms for water
use at all levels, and in the implementation of integrated water
resources management principles, and,
monitoring of the environment, particularly regarding climatically
driven glaciosphere dynamics in the zone of run-off formation,
where approximately 75% of the region’s renewable water
resources orginate.
These policy options are intended to considered by the international
scientifi c community, local, regional and international decision-makers,
funding bodies, and the general public, although at present, the latter is
not suffi ciently organised or powerful to act as a key stakeholder.
In conclusion, the water resources of transboundary basins in Central
Asia are not optimally utilised, thus the freshwater shortage situation
remains unresolved and continues to deteriorate. Progress in this area
can be achieved through political rather than technical measures and
fi rstly requires the development of legal agreements at the national,
regional and international level.

14 GIWA REGIONAL ASSESSMENT 24 ARAL SEA
Acknowledgements
This report presents the results of the Global International Waters Assessment
of the Aral Sea Basin, GIWA region 24. The assessment has been carried out by
a multidisciplinary team of international experts that included representatives
from each riparian country. Regional scientifi c institutions, such as the Russian
Academy of Science (RAS), Kazakhstan’s Institute of Geography and Uzbekistan’s
Hydrometeorology Institute all contributed to the assessment. The results were
discussed at the Regional Conference of GWP CACENA Stakeholders on the
17- 18th January 2005 in Bishkek and with the Committee for Water Resources of
the Ministry of Agriculture of Kazakhstan, IFAS, the Ministry of Nature protection of
Turkmenistan, and other local and regional authorities and executive bodies. The
Environment Programme (CEP) was also consulted.

ABBREVIATIONS AND ACRONYMS 15
Abbreviations and acronyms
ASBP-1 First Aral Sea Basin Program
ASBP-2 Second Aral Sea Basin Program
CCA Causal Chain Analysis
CDF Comprehensive Development Framework
CIA Central Intelligence Agency
CIS Commonwealth of Independant States
CNR Commission for National Reconciliation
DDT Dichlorodiphenyltrichloroethane
FSU Former Soviet Union
GDP Gross Domestic Product
GEF Global Environment Facility
GFDL Geophysical Fluid Dynamics Laboratory.
GIWA Global International Waters Assessment
GNP Gross National Product
ICG International Crisis Group
ICSD International Commission on Sustainable Development
ICWC Interstate Coordination Water Commission
IDA International Development Association
IFAS International Fund for saving the Aral Sea
IMF International Monetary Fund
INTAS The Interrnational Association for the Promotion
of Co-operation with Scientists from the
New Independent States (NIS) of the Former Soviet Union
IPPC Intergovernmental Panel on Climate Change
IWP Index of Water Pollution
IWRM Integrated Water Resources Management
MAC Maximum Allowable Concentration
NATO North Atlantic Treaty Organisation
NPRS National Poverty Reduction Strategy
SIC Center of Scientifi c Information
SPECA Special Programme for the Economies of Central Asia
SRC ICWC Scientifi c-Research Center of Interstate Commission for
Water Coordination of Central Asia
TACIS Technical Assistance to the CIS
UNDP United Nations Development Programme
UNEP United Nations Environment Programme
UNESCO United Nations Educational, Scientifi c and Cultural
Organization
USSR Union of Soviet Socialist Republics
UTO United Tajik Opposition
WTO World Trade Organization

16 GIWA REGIONAL ASSESSMENT 24 ARAL SEA
List of figuresFigure 1 Boundaries of the Aral Sea region. . . . . . . . . . . . . . . . . . . . . . . . . . . . . . . . . . . . . . . . . . . . . . . . . . . . . . . . . . . . . . . . . . . . . . . . . . . . . . . . . . . . . . . . . . . . . . . . . . . . . . . . . . . . . . . . . . . . . . . . . . . . . . . 17
Figure 2 Vegetation types in the Aral Sea region. . . . . . . . . . . . . . . . . . . . . . . . . . . . . . . . . . . . . . . . . . . . . . . . . . . . . . . . . . . . . . . . . . . . . . . . . . . . . . . . . . . . . . . . . . . . . . . . . . . . . . . . . . . . . . . . . . . . . . . . 18
Figure 3 Mean air temperatures in January and July. . . . . . . . . . . . . . . . . . . . . . . . . . . . . . . . . . . . . . . . . . . . . . . . . . . . . . . . . . . . . . . . . . . . . . . . . . . . . . . . . . . . . . . . . . . . . . . . . . . . . . . . . . . . . . . . . . . . . 19
Figure 4 Annual precipitation in the Aral Sea region. . . . . . . . . . . . . . . . . . . . . . . . . . . . . . . . . . . . . . . . . . . . . . . . . . . . . . . . . . . . . . . . . . . . . . . . . . . . . . . . . . . . . . . . . . . . . . . . . . . . . . . . . . . . . . . . . . . . 20
Figure 5 Aerial view of meandering Syrdarya River. . . . . . . . . . . . . . . . . . . . . . . . . . . . . . . . . . . . . . . . . . . . . . . . . . . . . . . . . . . . . . . . . . . . . . . . . . . . . . . . . . . . . . . . . . . . . . . . . . . . . . . . . . . . . . . . . . . . . . 25
Figure 6 Correlation between mortality from infectious diseases (per 100 000 people) and a deviation of water quality from the accepted standards . . . . . . . . . . . . . . . . . . 38
Figure 7 Correlation between infant mortality rate (per 1 000 live births) and a deviation of water quality from the accepted standards. . . . . . . . . . . . . . . . . . . . . . . . . . . . . . . . 38
Figure 8 The Toktogul hydroelectric dam on the Naryn (Syrdarya) River, Kyrgyzstan. . . . . . . . . . . . . . . . . . . . . . . . . . . . . . . . . . . . . . . . . . . . . . . . . . . . . . . . . . . . . . . . . . . . . . . . . . . . . . . . . . . . 40
Figure 9 Beached boat in a part of the Aral Sea which was once covered in water. . . . . . . . . . . . . . . . . . . . . . . . . . . . . . . . . . . . . . . . . . . . . . . . . . . . . . . . . . . . . . . . . . . . . . . . . . . . . . . . . . . . . . . 44
Figure 10 Peaks rising from a glacier in the Pamirs, Tajikistan. . . . . . . . . . . . . . . . . . . . . . . . . . . . . . . . . . . . . . . . . . . . . . . . . . . . . . . . . . . . . . . . . . . . . . . . . . . . . . . . . . . . . . . . . . . . . . . . . . . . . . . . . . . . 50
Figure 11 Causal chain analysis model for the Aral Sea region.. . . . . . . . . . . . . . . . . . . . . . . . . . . . . . . . . . . . . . . . . . . . . . . . . . . . . . . . . . . . . . . . . . . . . . . . . . . . . . . . . . . . . . . . . . . . . . . . . . . . . . . . . . . 55
Figure 12 Changes in surface area of the Aral Sea. . . . . . . . . . . . . . . . . . . . . . . . . . . . . . . . . . . . . . . . . . . . . . . . . . . . . . . . . . . . . . . . . . . . . . . . . . . . . . . . . . . . . . . . . . . . . . . . . . . . . . . . . . . . . . . . . . . . . . . . 58
List of tablesTable 1 Land resources of the Aral Sea Basin. . . . . . . . . . . . . . . . . . . . . . . . . . . . . . . . . . . . . . . . . . . . . . . . . . . . . . . . . . . . . . . . . . . . . . . . . . . . . . . . . . . . . . . . . . . . . . . . . . . . . . . . . . . . . . . . . . . . . . . . . . . . 19
Table 2 Mean annual river run-off in the Aral Sea Basin. . . . . . . . . . . . . . . . . . . . . . . . . . . . . . . . . . . . . . . . . . . . . . . . . . . . . . . . . . . . . . . . . . . . . . . . . . . . . . . . . . . . . . . . . . . . . . . . . . . . . . . . . . . . . . . . 20
Table 3 Water reservoirs in the Aral Sea Basin. . . . . . . . . . . . . . . . . . . . . . . . . . . . . . . . . . . . . . . . . . . . . . . . . . . . . . . . . . . . . . . . . . . . . . . . . . . . . . . . . . . . . . . . . . . . . . . . . . . . . . . . . . . . . . . . . . . . . . . . . . 22
Table 4 Ethnic composition of the population. . . . . . . . . . . . . . . . . . . . . . . . . . . . . . . . . . . . . . . . . . . . . . . . . . . . . . . . . . . . . . . . . . . . . . . . . . . . . . . . . . . . . . . . . . . . . . . . . . . . . . . . . . . . . . . . . . . . . . . . . . 22
Table 5 Demographic characteristics. . . . . . . . . . . . . . . . . . . . . . . . . . . . . . . . . . . . . . . . . . . . . . . . . . . . . . . . . . . . . . . . . . . . . . . . . . . . . . . . . . . . . . . . . . . . . . . . . . . . . . . . . . . . . . . . . . . . . . . . . . . . . . . . . . 22
Table 6 Economic characteristics of the Aral Sea countries. . . . . . . . . . . . . . . . . . . . . . . . . . . . . . . . . . . . . . . . . . . . . . . . . . . . . . . . . . . . . . . . . . . . . . . . . . . . . . . . . . . . . . . . . . . . . . . . . . . . . . . . . . . . . 23
Table 7 Scoring table for the Aral Sea region. . . . . . . . . . . . . . . . . . . . . . . . . . . . . . . . . . . . . . . . . . . . . . . . . . . . . . . . . . . . . . . . . . . . . . . . . . . . . . . . . . . . . . . . . . . . . . . . . . . . . . . . . . . . . . . . . . . . . . . . . . . 29
Table 8 Groundwater reserves in the Aral Sea Basin and their uses. . . . . . . . . . . . . . . . . . . . . . . . . . . . . . . . . . . . . . . . . . . . . . . . . . . . . . . . . . . . . . . . . . . . . . . . . . . . . . . . . . . . . . . . . . . . . . . . . . . . . 32
Table 9 Water pollution in Syrdarya River Basin. . . . . . . . . . . . . . . . . . . . . . . . . . . . . . . . . . . . . . . . . . . . . . . . . . . . . . . . . . . . . . . . . . . . . . . . . . . . . . . . . . . . . . . . . . . . . . . . . . . . . . . . . . . . . . . . . . . . . . . . 35
Table 10 Salinity along the Amudarya River. . . . . . . . . . . . . . . . . . . . . . . . . . . . . . . . . . . . . . . . . . . . . . . . . . . . . . . . . . . . . . . . . . . . . . . . . . . . . . . . . . . . . . . . . . . . . . . . . . . . . . . . . . . . . . . . . . . . . . . . . . . . . 35
Table 11 Change in salinity along some rivers. . . . . . . . . . . . . . . . . . . . . . . . . . . . . . . . . . . . . . . . . . . . . . . . . . . . . . . . . . . . . . . . . . . . . . . . . . . . . . . . . . . . . . . . . . . . . . . . . . . . . . . . . . . . . . . . . . . . . . . . . . . 35
Table 12 Historical changes in salinity in some rivers in the Amudarya and Syrdarya basins. . . . . . . . . . . . . . . . . . . . . . . . . . . . . . . . . . . . . . . . . . . . . . . . . . . . . . . . . . . . . . . . . . . . . . . . . . . . . 36

REGIONAL DEFINITION 17
Regional defi nition
This section describes the boundaries and the main physical and
socio-economic characteristics of the region in order to defi ne the
area considered in the regional GIWA Assessment and to provide
suffi cient background information to establish the context within
which the assessment was conducted.
Boundaries of the region
According to the GIWA regional boundaries, the Aral Sea region includes
the territory of three closed water basins - the Aral Sea, Lake Balkhash
and Lake Issyk Kul. Each of these basins has specifi c natural and socio-
economic features which should be evaluated separately. This report
focuses on the Aral Sea Basin exclusively, which is
situated between 55°00’ E and 78°20’ E and 33°45’ N
and 51°45’ N and has a total area of 2.7 million km2
(2.4 million km2 within the border of fi ve former
republics of the USSR) (Bortnik & Chistijaeva 1990)
(Figure 1).
The Aral Sea Basin includes the basins of the Syrdarya
and Amudarya rivers which fl ow into the Sea, and
the Tedzhen and Murgabi rivers, the Karakum canal,
and shallow rivers fl owing from Kopet Dag and
western Tien-Shan, as well as closed areas near these
rivers and the Aral Sea (Figure 1). Administratively,
the region entirely covers Uzbekistan and Tajikistan,
some parts of Kazakhstan (the Kyzylorda and
Shimkent regions and the southern part of the
Aktyubinsk region), Kyrgyzstan (the Osh and Naryn
regions), Turkmenistan (excluding the Krasnovodsk
region), and part of northern Afghanistan and
northeastern Iran. This assessment does not focus
on the latter two countries and when the report
discusses ‘the fi ve countries of the region’ it does
not include these, but is referring rather to the fi ve
former Soviet countries of the region.
A r a l S e a
Kazakhstan
IranAfghanistan
Uzbekistan
Turkmenistan
Kyrgyzstan
Tajikistan
Russia
Chu
Am
udarya
Syrd
arya
Sarysu
Harirud
Vakhsh
Turgay
Pyan
dzh
Naryn
Karakumskiy Kanal
Karambar
Tobol
Tedz
hen
Syrdarya
Sarysu
Mur
gab Murgab
Mashhad
Bishkek
Dushanbe
Tashkent
Elevation/Depth (m)
4 0002 0001 0005001000-50-200-1 000-2 0000 500 Kilometres
© GIWA 2005
Figure 1 Boundaries of the Aral Sea region.

18 GIWA REGIONAL ASSESSMENT 24 ARAL SEA
Physical characteristics
Geological composition and reliefThe geological composition and relief form the lithogenic background
of the geographical landscape. Figure 1 shows the main physio-
geographical features of the Aral Sea region. The territory is
heterogeneous in terms of its geology. The plain-lands belong to the
Turanian plate of the Gercian platform, where a deep covering layer
(more than 10 km thick) of Mesozoic and Cenozoic sediments lies upon
highly rugose Paleozoic sediments.
The mountainous areas of the region (the Pamirs, Tien-Shan, Pamiro-
Alay) comprise of newly formed rugose geological structures, which
originate from the same plate formed in the Neogene period of the
Cenozoic aeon. Continental neogene-quaternary sediments are found
above this layer, which were formed by river processes and temporary
water fl ows, as well as sea transgressions and aeolic (dust) processes.
The geological constitution has a signifi cant impact on the relief and
landscape of the territory. The relief of the territory can be divided into
two types: plain and mountainous.
The plain relief is found in the Kazakh tableland (nipple-land) and
Turanian lowland. The Kazakh nipple-land covers the northern part
of the plain and is actually a peneplain (hilly, elevated plain), which in
some places is occupied by low-lying residual mountains. It is generally
200-500 m high, but the residual mountains of Ulu-Tau are over 1 100 m
in height.
The Turanian lowland is situated on the Turanian plateau, which
has predominantly fl at monotonous relief (-43 m in Sary-Kamysch
depression), which rises to about 200 m above sea level (Sultan-
Wis-Dag). This area contains alluvial and sea formed lowland plains,
with benches and dry seabeds. It encompasses the southern areas
of the plain territory. The arenaceous deserts Karakum, Kyzilkum
and Muyunkum are characterised by aeolic sandhills and ridges. The
elevated plateau of Usturt is located in the south of the region.
The Turanian lowland is bordered by the foothills of the Kopet-Dag
mountains and Parapamize (in Turkmenistan). To the southeast of the
territory, the catchment area is partially occupied by foothills and the
high mountains of Pamirs, Pamiro-Alai and Tien Shan, which are covered
by more than 800 mountain glaciers.
Soil and vegetationThe region is dominated by zonal semi-desert, semi-bush and desert
dispersed bush and graminaceus vegetation (Figure 2). Semi-deserts
and deserts cover approximately one third of the regions’ surface.
The region contains the following soil and vegetation zones:
Dry steppe with feather grass and tipchack vegetation, found upon
the chestnut (brown) soils, which cover approximately one quarter
of the territory (northern part);
Semi-deserts with grass and shrubby vegetation, situated on lurid
(dark brown) semi-desert soils;
Deserts of the temperate climatic belt with grey and brown soils;
Sands of semi-deserts and deserts with sporadic vegetation cover,
which support a high diversity of plant species, but with limited soil
cover. For example the Karakum desert hosts 827 species of higher
plants. The area is characterised by the anthropogenic degradation
of forests;
Grey soils of semi-deserts where trees and perennial vegetation
prevail. Desertifi cation is observed and there has been degradation
of steppes (grassy communities) as a result of agricultural activities,
and the savannahs (complexes of trees and grassy vegetation) due
to the salinisation of soils;
Xerophytic forests and bushes of the foothills and low mountains,
found upon brown and grey-brown soils;
Wide-leaf forests situated upon mountainous grey and dark brown
soils.
A r a lS e a
Kazakhstan
Iran Afghanistan
Uzbekistan
Turkmenistan KyrgyzstanTajikistan
Russia
Mashhad
Bishkek
Dushanbe
Tashkent
© GIWA 2005
Zone
Desert
Forest
Intrazonal
Open woodland
Semidesert and desert
Steppe
Figure 2 Vegetation types in the Aral Sea region.

REGIONAL DEFINITION 19
Intrazonal soils are formed locally in river valleys and especially along
broad deltas, and under “tugays” (periodically inundated forested
areas). Permanent or periodically excessive humidifi cation results in
the growth of tugay forests and bushes on alluvial soils.
Land useCentral Asia’s prosperity is strongly linked with the patterns of land
use development. At present, the total area of potential arable land is
59 million ha, of which only 10 million ha are actually being cultivated
(Table 1).
Half of the cultivated land belongs to the oasis, where it is naturally
drained and the soil is fertile. The rest of the potential arable land would
require complex and costly development, including drainage, landscape
modifi cation and improvements in soil structure (SPECA 2004).
BiodiversityBiodiversity in the region is determined by the plain, sub-mountain and
mountain landscapes, as well as the considerable latitudinal extension
of the region (almost 20° latitude). Mountain regions are characterised
by altitudinal and horizontal zoning with a high level of heterogeneity
caused by relief peculiarities. The highest numbers of endemic species
are observed in the isolated habitats. The relatively homogeneous
structure of the fl at landscapes of the region becomes more complex
closer towards the mountain areas. The regional fl ora includes 1200
species of anthophyta (fl owering plants) and 560 species of woody
vegetation, including 29 endemic species of Central Asia. The fl ora of
the Aral Sea coast includes 423 species of plant (Novikova 2001).
Climate and climatic variabilityOwing to the extreme remoteness of the region from the oceans, it
has a distinct continental climate. It is not subject to the monsoons of
Southern Asia as it is separated by high mountains, and it is seldom
subject to cyclones from the west.
The radiation balance (kkal/ cm2 annually) in the marine area of the
Aral Sea averages as R=55.7. It is characterised in this region by an
absolute predominance of turbulent fl ows of heat compared with the
expenditures of heat from the transpiration of moisture, whereas on
the majority of the earth’s surface there is a reverse interrelationship
between these two parameters.
Table 1 Land resources of the Aral Sea Basin.
CountryTotal area
(ha)
Potential arable area(ha)
Arable area(ha)
Irrigated area(ha)
Kazakhstan* 34 440 000 23 872 400 1 658 800 786 200
Kyrgyzstan* 12 490 000 1 570 000 595 000 422 000
Tajikistan 14 310 000 1 571 000** 874 000 719 000
Turkmenistan 48 810 000 7 013 000 1 805 300 1 735 000
Uzbekistan 44 884 000 25 447 700 5 207 800 4 233 400
Aral Sea Basin 154 934 000 59 474 100 10 140 900 7 895 600
Notes: *Territories within the Aral Sea Basin. ** Areas suitable for irrigation.
(Source: FAO 1997)
Aral Sea
Kazakhstan
IranAfghanistan
Uzbekistan
Turkmenistan Kyrgyzstan
Tajikistan
Russia
Chu
Am
udar'ya
Syrd
ar'y
a
Sarysu
Harirud
Vakhsh
Turgay
Pyan
dzh
Naryn
Karakumskiy Kanal
Karambar
Tobol
Tedzhen
Syrdar'ya
Sarysu
Mu
rgab
MurgabMashhad
Bishkek
Dushanbe
Tashkent
Aral Sea
Kazakhstan
IranAfghanistan
Uzbekistan
TurkmenistanKyrgyzstan
Tajikistan
Russia
Chu
Am
udar'ya
Syrd
ar'y
a
Sarysu
Harirud
Vakhsh
Turgay
Pyan
dzh
Naryn
Karakumskiy Kanal
Karambar
Tobol
Tedzhen
Syrdar'ya
Sarysu
Mu
rgab
MurgabMashhad
Bishkek
Dushanbe
Tashkent
Temperature (˚C)
-40
-30
-20
-10
0
10
20
30
more
JulyJanuary
GIWA 2005
Figure 3 Mean air temperatures in January and July.

20 GIWA REGIONAL ASSESSMENT 24 ARAL SEA
The region is characterised by large variations in temperature and
precipitation (Figure 3 and 4). The aridity of the climate increases in the
centre of the region. Annual precipitation ranges from 1 500 -2 500 mm
at the glacier belts of West Tien Shan and West Pamir, to 500-600 mm at
the foothills, and to 150 mm at the latitude of the Aral Sea. To the north
of this latitude, in Northern Kazakhstan, annual precipitation increases
to between 250 and 350 mm.
Hydrological characteristicsThe term “water resources” in this region refers to the annual volume
of river fl ow measured where headwaters leave the mountains for the
lowlands and upstream of water intake structures used for irrigation.
Table 2 shows the mean annual surface river run-off in the Aral Sea
Basin. The Amudarya Basin receives far greater water in the area of run-
off formation (0.256 km3/km2 per year compared to 0.170 km3/km2 per
year in the Syrdarya Basin), with 62% of its annual river run-off formed
on the territory of Tajikistan. The Aral Sea is supplied with 68% of its
renewable water resources by the Amudarya Basin. It should be noted
that table 2 does not take into account the run-off from the Chu and
Talas rivers, which orographically belong to the Aral Sea Basin. Taking
these waters into account, the total water resources in the Aral Sea Basin
is 123.6 km3 (Chub 2000).
Water supply in the region is not only aff ected by the modifi cation
of the main transboundary rivers in the region, but also by their
hydrological regime, which is characterised by an extremely irregular
territorial distribution of renewable water resources and a high degree
of variation in inter-annual run-off . About 43% of the Aral Sea Basin
resources are formed in the territory of Tajikistan and more than 24%
in the territory of Kyrgyzstan. A considerable fraction of surface run-
off resources (18.6%) is also formed in the territories of Afghanistan
and Iran (table 2). The main consumers of water resources, however,
are Uzbekistan, Turkmenistan and Kazakhstan. The annual river run-
off fl uctuates between a maximum volume 1.5-2.5 times greater,
and a minimum 2.0-2.2 times less, than the average annual run-off
(Shultz 1965, Bolshakov 1974, Kipshaskbayev & Sokolov 2002). With an
arid climate and increasingly defi cient water resources such run-off
variations present an extreme risk for irrigated farming.
Rivers
The majority of the Aral Sea region belongs to the basins of the two
major rivers - the Amudarya and Syrdarya. The territory of the Tadjen,
Murghab, Chu and Talas rivers orographically belong to the Aral Sea
Basin but the waters are exploited for irrigation or are lost on the sub-
mountain plain and do not reach the Aral Sea.
The mountainous areas play an important role in maintaining the
ecological integrity and food security for the entire region. They only
occupy about 20% of the total area of the Aral Sea Basin but are the
source of approximately 75% of renewable water resources and contain
freshwater resources within glaciers and underground ice; a reliable
guarantee of stable river fl ow for the future.
The Aral Sea
Origins of civilisation and farming in the Aral Sea Basin can be traced
back 2 000 years. Natural environmental variance and human activity
have led to signifi cant ecological changes in the Aral Sea Basin.
Aral Sea
Kazakhstan
IranAfghanistan
Uzbekistan
Turkmenistan Kyrgyzstan
Tajikistan
RussiaPrecipitation (mm/year)
0-100
100-200
200-600
600-1 400
1 400-2 800
2 800-5 600
5 600-10 000
GIWA 2005
Figure 4 Annual precipitation in the Aral Sea region.
Table 2 Mean annual river run-off in the Aral Sea Basin.
CountryAnnual river run-off (km3)
Aral Sea Basin (%)Syrdarya
BasinAmudarya
BasinAral Sea
Basin
Kazakhstan 2. 43 - 2.43 2.1
Kyrgyzstan 26.85 1.60 28.45 24.4
Tajikistan 1.00 49. 58 50.58 43.4
Turkmenistan - 1.55 1.55 1.3
Uzbekistan 6.17 5.06 11.22 9.6
Afghanistan and Iran - 21.59 21.59 18.5
China 0.756 - 0.756 0.7
Total for the Aral Sea Basin 37.20 79.38 116.58 100
(Source: Kipshakbayev & Sokolov 2002)

REGIONAL DEFINITION 21
Prior to the 1960s, the Aral Sea comprised an area of 68 300 km²,
including a water surface area of 66 100 km² and islands of 2 200 km².
The volume of seawater amounted to 1 066 km³ (Hurni et al. 2004,
Bortnik & Chistjaeva 1990). The maximum depth of the Sea is 69 m,
but depths of less than 30 m are common in a large proportion of
the sea. The average sea level, meanwhile, fl uctuates between 52 to
53 m. Mineralisation of the Aral Sea waters over the past 100 years
of instrumental observations has varied within a range of 10-12 g/l
(Glazovsky 1990 and 1995, Amirgaliev & Ismuchanov 2002).
Historically, the Sea has risen and fallen considerably. During the
Quaternary period, variations in the level of the Aral Sea were as much
as 36 m. In the fi rst half of the twentieth century the variance in sea level
did not exceed 1 m, and the ecological situation was quite stable up to
the end of the 1950s. However, substantial variations have taken place
during the last 40 years, and this report focuses on this time period.
Decreased river infl ow since the early 1960s has changed the water
budget of the Aral Sea. By 1990, the area of the Sea had decreased to
34 800 km² and its volume to 304 km³ (Glazovsky 1995), and since the
end of the 1950s the level of the Sea had fallen by more than 22 m
(Amirgaliev & Ismuchanov 2002). A signifi cant proportion (about
33 000 km²) of the sea fl oor has dried up, the confi guration of the
shoreline has changed, and water mineralisation has increased from
10-12‰ in the 1930-1960s to 83-85‰ in 2002 (Amirgaliev & Ismuchanov
2002). Today the inland sea covers about half of its former area and its
water volume has decreased by about 75%. As water mineralisation
increased, the spawning sites of fi sh disappeared and the forage reserve
depleted, which led to a decline in fi sh resources. Only fi ve species of
fi sh remain and nearly all limnoplankton and numerous haloplankton
became extinct (Aladin 1999, Aladin & Kotov 1989, Aladin et al. 2001,
Treshkin 2001).
Lakes
There are more than 5 000 lakes in the Aral Sea Basin, of which more
than 4 000 are situated in the Amudarya and Syrdarya basins. Most
of the lake water reserves are concentrated in the Amudarya Basin
(46 km3), whereas water reserves in the Syrdarya Basin only amount to
4 km3 (Chub 2000&2002, Chub & Myagkov 2002). The majority of these
lakes are of small area and limited volume, with many low-lying plain
lakes drying out in extremely dry years.
Lake Karakul, a high-mountainous closed lake located in the Eastern
Pamirs, is the largest lake in the region with a water volume of more
than 26 km3. Lake Sarez was formed as the result of a tremendous
landslide during an earthquake in 1911 and is also located in the Pamirs
Mountains. The total lake volume is 17 km3. Lake Sarez is under constant
observation by the government of Tajikistan and the international
community due to the possibility that the lake’s dam could burst,
putting an area of more than 5 000 km2 and over 5 million people at
risk (Olimov 2001).
The largest lakes in the low-lying areas of the Aral Sea Basin are
situated in Uzbekistan and partially in Kazakhstan, in the lower and
middle reaches of the Amudarya and Syrdarya. The largest of them
were formed by drainage waters, which today consist predominantly
of drainage effl uent from irrigated areas. The largest of these lakes
are Aydarkul (surface area of 30 km2), Sarykamysh (8 km2), Sudochye
and Parsankul (2 km2 each). The fi rst of the above-mentioned lakes
is situated in the Arnarsay depression at the boundary between
Kazakhstan and Uzbekistan; its total volume is about 30 km3. It was
formed by the discharge of excess water from Chardarya water reservoir
(mainly due to winter water discharges from Tokhtogul water reservoir)
and drainage waters from the irrigated fi elds of the Golodnaya steppe
in Uzbekistan and Kazakhstan.
The majority of the once numerous and biologically productive
freshwater lakes in the delta of the Amudarya and Syrdarya have
completely dried up or lost their economic value, constituting one
of the most important and dramatic consequences of the irrational
use of water resources in the Aral Sea Basin. It has caused the rapid
degradation of the delta landscapes and an abrupt reduction in the
biodiversity of aquatic and terrestrial ecosystems.
Water reservoirs
The total volume of water reservoirs in the Aral Sea Basin is over 74 km3
(Table 3). The largest is Tokhtogul reservoir, which has a total volume
of 19.5 km3 and a useful volume of more than 14 km3. All of the large
water reservoirs have multi-purposes, but are mainly used for power
generation and irrigation. On the territory of Uzbekistan, in addition to
numerous ponds and small-capacity water reservoirs used for irrigation,
50 relatively large reservoirs with a total volume of 19 km3 have been
constructed.
A total of 45 hydropower plants with a total capacity of 34.5 GWh/year
were constructed on the largest reservoirs. The Nurek hydropower
station on the Vakhsh River in Tajikistan (2 700 MWh/year) and the
Tokhtogul hydropower station (1 200 MWh/year) on the Naryn River in
Kyrgyzstan are the largest (Kipshkbayev & Sokolov 2002, Duskayev 2000,
Burlibayev et al. 2002, Mamatkanov 2001). Of all the countries of the Aral
Sea Basin Tajikistan has the greatest hydroelectric potential of all the
countries in the Aral Sea Basin - more than 52 000 GWh/year.

22 GIWA REGIONAL ASSESSMENT 24 ARAL SEA
According to estimations it is technically feasible to harness about half
of this potential energy. Until now only about 4 GWh/year have been
utilised.
Socio-economic characteristics
Demographic characteristicsRecent population growth fi gures may not be representative of future
trends. There is likely to be a decline in population growth rates, but it is
not known by how much and when this is to occur. In principle, smaller
families will be desirable for the urban population, but for subsistence
farmers it will remain attractive to have larger families, with more than 4
children. In any case, in the next 25 years the population of the region is
predicted to grow due to the age structure of the present population.
Table 4 shows the ethnic breakdown of the population of each country
in the Aral Sea Basin, excluding Afghanistan. There are three dominant
ethnic groups in the region: Uzbeks, who account for more than 40%
of the population, Kazakhs (16.8%) and Russians (13.4%). In the fi ve
countries of the region the indigenous population dominate, especially
in Uzbekistan (80%) and Turkmenistan (77%). The highest percentage
of small ethnic groups united in the table under the heading “Other”
is registered in Kyrgyzstan (11.8%) and Kazakhstan (8%). These are the
most ethnically diverse countries.
In general, the region is characterised by high population growth rates
(except in Kazakhstan), a negative balance of migration and a high infant
mortality rate. The demography of Kazakhstan diff ers from the other
countries due to its low rate of population growth (0.1), the greatest
negative balance of migration (-6.16 migrants/1 000 population) and
the smallest percentage of the population living below the poverty line
(26% as compared with 34-80% in other countries of the region).
Kazakhstan has the smallest percentage of young people (under 15
years old) in the region, accounting for only 26% of the population,
whereas in the other countries of the region this fi gure ranges from 34
to 40%. Kazakhstan also has the highest proportion of the population
that are older than 65 (7.5%) (Table 5). These factors combined with the
lowest birth rate (17.83 births/1 000 population as compared with 26-
32/1 000 in other countries) and the highest death rate in the region
(10.69/1000 population in 2002) may induce social and economic
problems in the near future. It is also worth noting that Kazakhstan
Table 3 Water reservoirs in the Aral Sea Basin.
Country
Water-storage reservoirs
Largest water-storage reservoirs
NumberCapacity (km3)
NameCapacity (km3)
River
Kazakhstan 1 5.7 Chadarya 5.7 Syrdarya
Kyrgyzstan 13 23.5
Tokhtogul 19.5 Naryn (Syrdarya)
Kirov 0.55 Talas
Orto-Tokay 0.47 Chuy
Tajikistan 19 29.0
Nurek 10.5 Vakhsh
Kayrakum 4.16 Syrdarya
Nizhne-Kafirighan 0.9 Kafirnighan
Turkmenistan 18 2.86 Naue-Khan 0.88 Karakum canal
Uzbekistan 50 19.0Charvak 1.99 Charvak (Syrdarya)
Andizhan 1.90 Karadarya (Syrdarya)
(Source: Kipshkbayev & Sokolov 2002, Duskayev 2000, Burlibayev et al. 2002, Mamatkanov 2001)
Table 4 Ethnic composition of the population.
StateEthnic group (%)
Kazakh Kyrgyz Uzbek Tajik Turkmen Russian Ukrainian German Other
Kazakhstan 53.4 - - - - 30.0 3.7 2.4 8.0
Kyrgyzstan - 52.4 - - - 18.0 2.5 2.4 11.8
Uzbekistan 3.0 - 80.0 5.0 - 5.5 - - 6.5
Tajikistan - - 25.0 64.9 - 3.5 - - 6.6
Turkmenistan 2.0 - 9.2 - 77.0 6.7 - - 5.1
Total 16.80 4.31 40.3 9.63 6.17 13.40 2.26 0.88 7.26
(Source: CIA 2002)
Table 5 Demographic characteristics.
Country PopulationGrowth rate
(%)
Migration rate
(migrate/1 000)
Infant mortality
rate (deaths/1 000)
Life expectancy at birth Total health expenditureBirth rate
(births/1 000)
Death rate (deaths/
1 000)
Age structure
Female MalePer capita
(USD)% of GDP 0-14 (%) 15-64 (%)
Kazakhstan 16 741 519 0.1 -6.16 58.95 69.01 58.02 211 3.7 17.93 10.69 26.0 66.5
Kyrgyzstan 4 822 166 1.45 -2.51 75.92 67.98 59.35 145 6.0 26.11 9.10 34.5 59.4
Uzbekistan 25 563 441 1.62 -1.94 71.72 67.60 60.38 86 3.7 26.09 7.98 35.5 59.8
Tajikistan 6 719 567 2.12 -3.27 114.77 67.46 61.24 29 2.5 32.99 8.51 40.4 54.9
Turkmenistan 4 688 963 1.84 -0.98 73.21 64.80 57.57 286 5.4 28.27 - 37.3 58.6
Total 58 435 656
(Source: CIA 2002, World Bank 2002)

REGIONAL DEFINITION 23
has a relatively high level of social welfare for its population, which
is explained by the country having the greatest GDP/per capita
(5 900 USD) in the region, the highest percentage of elderly people, and
relatively high expenditure on health care (211 USD per capita) (Table 5).
In contrast, Kyrgyzstan has the lowest percentage of elderly people in
the region (less than 1%), which relates to the low level of social welfare.
Tajikistan has the highest level of infant mortality (114.7deaths/1 000
live births), the highest birth rate (33.0/1 000 population), the lowest
GDP (1 140 USD per capita), the greatest percentage of the population
living below the poverty line and the highest unemployment rate - 20%
compared with 7-10% in the other countries (Table 5).
Economic characteristicsTable 6 outlines the economic characteristics of the countries in the
region. Unfortunately the data for Turkmenistan is not complete.
Kazakhstan has undergone the most successful economic development;
it has the highest GDP (98 billion USD), which is almost one third higher
than that of Uzbekistan and more than ten times that of Tajikistan. The
poorest economic situation can be found in Tajikistan. In general, the
region has experienced positive economic tendencies in recent years.
In Kazakhstan GDP growth has exceeded 6-7% over the last fi ve years.
Kazakhstan
Kazakhstan, the largest of the former Soviet republics excluding
Russia, is rich in fossil fuel resources and has plentiful supplies of other
minerals and metals, including gold, iron ore, coal, chrome and zinc.
It also has a thriving agricultural sector in the areas of livestock and
grain production. There are vast areas of arable land. The agricultural
and the industrial sectors’ share of GDP is estimated at 15% and 30%,
respectively. Kazakhstan’s industrial sector relies on the extraction
and processing of natural resources and also on a growing sector
specialising in the construction of equipment, agricultural machinery
and defence technology.
Kazakhstan has a relatively high standard of infrastructure and the
contribution of the services sector to the GDP is 60%. The economy
of Kazakhstan also has the highest real growth of GDP in the region
(12.2% as compared with 3-10% in other countries), a positive export
and import balance (2.3 billion USD), relatively low infl ation (8.5%)
and low unemployment (Table 6). Kazakhstan also has the lowest
population percentage living below the poverty line. The ratio of the
contribution of the industrial sector in comparison to the agricultural
sector towards the formation of GDP is 3.0, which is 1.8-4.6 times higher
than the corresponding ratio for the other countries in the region. In
2003 GDP increased by 9.2%, the share of industrial output increased
by 8.7%, foreign trade by 8.3%, and investments into fi xed assets by
17.2%. Defi ciency of the budget in 2003 was less than 1% of GDP and
real wages increased by 8.3%. The general fi ve year growth of GDP in
Kazakhstan meant that in 2003, GDP had increased by 6.3% compared
to 1991.
The break-up of the USSR and the severe decline in demand for heavy
industrial products from Kazakhstan resulted in the short-term collapse
of the economy, with the steepest annual decline recorded in 1994.
Between 1995 and 1997, the pace of economic reform and privatisation
quickened, resulting in a substantial shifting of assets to the private
sector. In 1993, Kazakhstan began a comprehensive structural reform
programme aimed at moving towards a market economy which was
internationally supported by bilateral and multilateral donors, including
the World Bank and the International Monetary Fund (IMF).
Today, poverty in the country persists. In 2001, approximately 28% of
the population were earning below the minimum subsistence level. A
considerable proportion of the population has no access to potable
water and suff ers from the eff ects of pollution and environmental
degradation.
In 2000 and 2001, Kazakhstan experienced economic growth due to its
booming energy sector, economic reform, good harvests, and foreign
investment. The opening of the Caspian Consortium pipeline in 2001,
from western Kazakhstan’s Tengiz oilfi eld to the Black Sea, substantially
raised export capacity. The industrial policy in Kazakhstan is designed
Table 6 Economic characteristics of the Aral Sea countries.
StateBudget
(million USD)
GDP Population below
poverty line (%)
Industrial production growth rate
(%)
Export(million USD)
Import(million USD)
Inflation rate (%)
Unemployment rate (%)
Purchasing power parityPer
capitaAgriculture
(%)Industry
(%)Total (billion USD)
Real growth rate (%)
Kazakhstan 4 200 98.1 12.2 5 900 10 30 26.0 11.4 10 500 8 200 8,5 10.0
Kyrgyzstan 207 13.5 5.0 2 800 38 27 55.0 6.0 475 420 7.0 7.2 (1999)
Uzbekistan 4 000 62.0 3.0 2 500 33 24 - 3.5 2 800 2 500 23.0 10.0
Tajikistan - 7.5 8.3 1 140 19 25 80.0 10.3 640 700 33.0 20.0
Turkmenistan 589 21.2 10.0 4 700 27 45 34.4 - 2 700 2 300 10.0 -
(Source: CIA 2002, World Bank 2002)

24 GIWA REGIONAL ASSESSMENT 24 ARAL SEA
to direct the economy away from overdependence on the oil sector
by developing light industry (CIA 2002). Infl ation decreased from an
annual rate of 29% in 1996 to only 6.4% in 2003. In 1996, GDP growth
was estimated at 0.5%, compared to 9.2% in 2003.
Kyrgyzstan
Kyrgyzstan is a small mountainous country with an economy
predominantly based on agriculture. The country has undergone
an economic transformation following the dissolution of the Soviet
Union. Cotton and wool constitute the main agricultural products
and exports. Industrial exports include gold, mercury, uranium, and
electricity. Kyrgyzstan has been one of the most progressive countries
of the former Soviet Union in carrying out market reforms.
Policymakers have had diffi culties dealing with the termination of
budgetary support from Moscow, the disruption of the former Soviet
Union’s trade system and a large deterioration in the Kyrgyzstan
Republic’s terms of trade, primarily owing to large increases in import
prices of oil and natural gas. By 1999, GNP had declined to 260 USD per
capita, with severe declines in living standards.
Early reforms by the Government included the liberalisation of
most prices, the creation of a national currency, the introduction
of a liberal trade regime, and the elimination of most capital fl ows.
Substantive progress in tightening fi scal policies followed in parallel
with a successful reform of the fi nancial sector, and monetary policy
framework and instruments. In 1994, deposit and interest rates were
liberalised, directed credits were discontinued, and domestic fi nancing
of the budget defi cit was sharply curtailed.
On July 17, 1998, the Kyrgyz Republic successfully concluded World
Trade Organization (WTO) accession negotiations, paving the way for
the Kyrgyz Republic to become the 133rd and the fi rst Commonwealth
of Independent States member to join the WTO.
In 2001 infl ation was lowered to an estimated 7%. Much of the
government’s stock enterprises have been sold. Production had
severely declined since the break-up of the Soviet Union, but by 1995
production had begun to recover and increase. Growth increased from
2.1% in 1998 to 5% in 2000, and again 5% in 2001. Nevertheless, poverty
remains acute: approximately 40% of the Kyrgyz population lives in
poverty, with 51% and 41% of the population in 2001 living in poverty in
rural and urban areas, respectively. In September 2002, the Government
released the National Poverty Reduction Strategy (NPRS): 2003-2005,
one element of the Comprehensive Development Framework (CDF) of
the Kyrgyz Republic to the year 2010. Despite substantial international
aid for development programmes in Kyrgyzstan over the past fi ve years,
poverty remains a signifi cant issue in the country (UNDP 2003).
Recent economic development is beginning to show as a result of
these measures. The rate of infl ation declined from 1 000% in 1993 to
15% in 1997. Following a cumulative decline of approximately 51% in
1991-1995, GDP grew by 7% in 1996 and 1997, by 6.7% in 2003 and 7.1% in
2004 (ICWC 2004). After concerted eff orts to attract private capital and
interest to the mining sector, the Kumtor gold mine, the eighth largest
in the world, began production in 1997 and achieved commercial levels
in May 1997, adding 4% to GDP. Agriculture, the largest sector in the
economy of Kyrgyzstan, accounted for 45% of GDP and for half of the
total employment in 1997 (UNESCO 2000).
The production of most crops declined considerably between 1990
and 1995 but has begun to recover more recently. Livestock and wool
production however, two of the mainstays of the rural economy, have
declined severely and still remain depressed. Agro-industry faced crisis
between 1990 and 1996, with annual production declining by over 90%
for most commodities. In recent years state support has stimulated
growth in the agrarian sector.
Government intervention in agricultural marketing has largely
disappeared. The foreign trade regime and prices have been
liberalised. Over 65% of the agro-business has been privatised and
demonopolised.
However, the government and the international fi nancial institutions
have embarked on a comprehensive medium-term poverty reduction
and economic growth strategy. In November 2001, with fi nancial
assurance from the Paris Club, the IMF Board approved a three-year
93 million USD Poverty Reduction and Growth Facility (CIA 2002).
Uzbekistan
Uzbekistan is a dry, landlocked country of which 11% of the territory
consists of intensely cultivated, irrigated river valleys. More then 60%
of its population live in densely populated rural communities. The
country possesses signifi cant economic potential with a well educated
population and qualifi ed labour force. Uzbekistan is rich in natural
resources such as gold, natural gas, oil, coal and copper. It is the world’s
ninth largest producer of gold (with an annual output of approximately
60 tonnes) and is among the largest suppliers of natural gas (with an
annual production of more then 50 billion m3). In spite of its potential,
Uzbekistan presently remains an underdeveloped country. Its GNP per
capita was estimated at 350 USD in 1999.

REGIONAL DEFINITION 25
More than 20% of Uzbekistan’s GDP is generated in agriculture, which
employs about 49% of the country’s labour force. Primary commodities,
such as cotton fi bre, mining and energy products, account for about 75%
of its merchandise exports; cotton alone accounts for 40% of exports.
The cautious approach to reform, combined with a focus on developing
self-reliance in energy and improving the mining and agricultural
sectors including trade diversifi cation (especially of cotton export),
allowed Uzbekistan to avoid an output collapse recorded in many other
former Soviet Union countries during the fi rst years of independence.
Uzbekistan’s GDP declined by less than 145 USD in 1991-1993, compared
with a former Soviet Union average of almost 40% (UNESCO 2000).
Uzbekistan has introduced some elements of a market system over the
past decade (for example privatisation and capital markets). However,
the government has opposed, to varying degrees, the following: trade
liberalisation; currency convertibility and a unifi ed exchange rate; full
price liberalisation; the elimination of government interference into the
key sectors of the economy (e.g. cotton production); and central bank
independence.
In 1997 and during the fi rst half of 1998 economic trends were mixed. In
an eff ort to curb accelerating infl ation and a widening current account
defi cit, the authorities started tightening fi scal policies at the beginning
of 1997. As a result, macroeconomic performance began to improve
again. According to offi cial statistics, real GDP grew by 5.2% in 1997 and
by 4.0% in the fi rst half of 1998, while average monthly consumer price
infl ation fell to 2.1% in 1997 and to 1.7% in the fi rst half of 1998. The IMF’s
estimates suggest that the GDP growth in 1997 may have been only
2.4%, while average monthly infl ation was estimated at about 3.5%.
Uzbekistan is now the second largest cotton exporter, a large producer
of gold and oil, and a regionally signifi cant producer of chemicals
and machinery. Following independence in 1991, the government
sought to support its Soviet-like command economy with subsidies
and tight controls on production and prices. The state continues
to be a dominating infl uence in the economy and has so far failed
to bring about necessary structural changes. The IMF suspended
Uzbekistan’s 185 million USD standby arrangement in late 1996
because of governmental steps that made impossible the fulfi lment
Figure 5 Aerial view of meandering Syrdarya River.(Photo: CORBIS)

26 GIWA REGIONAL ASSESSMENT 24 ARAL SEA
of a Fund contribution. Uzbekistan has responded to the negative
external conditions generated by the Asian and Russian fi nancial crises
by emphasising import substitute industrialisation and tightening
export and currency within its already closed economy. Economic
policies that have repelled foreign investment are a major factor in the
economy’s stagnation. A growing debt burden, persistent infl ation, and
a poor business climate led to disappointing growth in 2001. However,
in December 2001 the government voiced a renewed interest in
economic reform, seeking advice from the IMF and other fi nancial
institutions (CIA 2002).
Tajikistan
The Republic of Tajikistan has inherited a developed infrastructure
and a well-organised and varied industrial and agricultural basis from
its former Soviet period. However, transition to the market type of
economy has led to serious changes in the economic system and in
the economic links between the countries of the region. As a result of
confl ict, economic stagnation, and changes in the structure of export
and import, the level of industrial output dropped by 60%, a fi gure
which only started recovering at the end of the 1990s. The agrarian
sector plays a major role in the modern economy of Tajikistan, but
the industrial sector is less signifi cant. To stop the deterioration in
economic conditions, the government introduced several reform
measures in 1995, including fi scal retrenchment and price liberalisation,
supported by an IMF Stand-by arrangement and an IDA rehabilitation
credit in 1996. In the following two years the policy performance of
Tajikistan was mixed, largely because of the renewed confl ict and
weak institutional capacity. Much of the reform agenda contained in
the above credit was eroded or even reversed because of the confl ict
and the reform programme had been disrupted by mid-1997. The civil
confl ict diverted resources to defence and security purposes to the
detriment of other essential needs, and at the same time revenues
declined. As of June 1997, the fi scal defi cit reached 10% of GDP, social
safety net payments were eight months in arrears, infl ation exceeded
60% and the currency depreciated rapidly. Recognising that the reversal
of this situation required dramatic action in the areas of political and
macroeconomic stability and structural reform, the government and
the United Tajik Opposition (UTO) signed a Peace Agreement in July
1997. The Commission for National Reconciliation (CNR) was created as
the focal point to foster national reconciliation.
The government, in consultation with the IMF and the World Bank, also
moved quickly on the stabilisation and structural reform fronts and
has made signifi cant progress in achieving macroeconomic stability.
Average monthly infl ation for the fi rst four months of 1998 was brought
down to 1.3%, compared with over 20% per month in July 1997. Recent
fi scal performance has also been impressive, with the fi scal defi cit (on
a cash basis) in the last quarter of 1997 narrowing to only 0.2% of GDP.
During the fi rst quarter of 1998, the defi cit was 1.6% of GDP. Owing to
the restored macroeconomic stability and the availability of external
fi nancing for cotton production, GDP grew by 1.7% in 1997; the fi rst
real growth since independence in 1991. The recovery has continued,
with real GDP in the fi rst quarter of 1998 estimated to be 1.3% over the
corresponding period in 1997.
Tajikistan has the lowest GDP per capita among the 15 former Soviet
republics, the highest unemployment in the region and 80% of the
population lives below the poverty line. Tajikistan has a negative
export-import balance and the highest infl ation level. At the same time
Tajikistan has one of the highest rates of GDP growth in the region (only
Kazakhstan has greater GDP growth).
Cotton is the most important crop. Mineral resources, varied but
limited, include silver, gold, uranium, and tungsten. Industry consists
of a large aluminium plant, hydropower facilities, and small obsolete
factories, mostly in light industry and food processing. The availability
of hydroelectric power has infl uenced the pattern and structure of the
industrial sector, with aluminium, chemicals and other energy-intensive
industries as the sector’s mainstays. The civil war (1992-1997) severely
damaged the already weak economic infrastructure and caused a sharp
decline in industrial and agricultural production. On independence in
1991, the collapse of the trade and payments system among former
Soviet Union countries triggered a precipitous decline in output. As a
result, national poverty increased, particularly in the more remote and
war aff ected areas, with as much as 85% of the population considered
poor. A large proportion of the labour force in Tajikistan (as high as
25%) and Kyrgyzstan depends on work abroad (particularly in Russia),
remitting a signifi cant volume of income to their home countries.
Tajikistan has experienced strong economic growth since 1997.
Continued privatisation of medium and large state-owned enterprises
will further increase productivity. Tajikistan’s economic situation,
however, remains fragile due to the uneven implementation of
structural reforms, weak governance, and the burden of external
debt. Servicing of the debt, owed principally to Russia and Uzbekistan,
required as much as 50% of government revenues in 2002, thus limiting
the nation’s ability to address pressing development issues (CIA 2002).
Despite Tajikistan’s current economic problems, the country has
considerable potential for development. The population is well
educated, the land is very fertile and the country has demonstrated
a capacity to produce competitively for international markets. The

REGIONAL DEFINITION 27
country also has an established but idle industrial base with assets
that can be deployed more effi ciently and productively. This industrial
base can serve as the basis for economic growth especially in the
agriculture sector. The development of this potential will, however,
depend on whether peace and security can be maintained throughout
the country.
Turkmenistan
Turkmenistan is a largely desert country with intensive agriculture
in irrigated oasis and huge hydrocarbon resources; the country has
the fi fth largest gas reserves in the world. The cornerstone of the
Turkmenistan economy is energy. With 2.7 trillion m3 in proven and
probable gas reserves and additional indicative reserves estimated at
14 trillion m3, Turkmenistan is the second largest natural gas producer
in the former Soviet Union after the Russian Federation, and the fourth
largest producer in the world. The country also has an estimated
1.1 billion tonnes of oil reserves (UNESCO 2000).
Turkmenistan has considerable potential for diversifi cation into mineral
resource-based industries. However, agriculture still predominates,
accounting for 10% of GDP and 44% of employment. Turkmenistan is
among the top 10 cotton producers in the world. Other major crops
include grains, vegetables, and fruits. Natural gas, oil products and
cotton account for 84% of exports. The main imports in 1997 were
machinery and metalwork (43%), processed food (19%), industrial
chemicals (11%) and non-food consumer products (11%). Real GDP
declined by 30% in 1993-1995 and by 3% in 1996. In 1997, GDP fell a
further 26%, refl ecting the combined eff ect of deep declines in exports
of gas (73%) and cotton fi bre (52%), tempered by a 34% growth in
the domestic sector buoyed by the increase in cotton and wheat
production and a boom in the construction industry.
The underlying fi scal position has weakened markedly over the years, as
budget defi cits were avoided mainly through expenditure compression,
implicit taxes and subsidies. Credit policy has been expansionary, with
large directed credit programmes and enterprises facing lax budget
constraints. Infl ation averaged roughly 1 800% in 1994, 1 000% in 1995,
450% in 1996, and 20% in 1997. From 1993 to 1995, wage adjustments
lagged far behind infl ation, and real minimum monthly wages declined
by an estimated 80%. During 1996-1997, a series of wage increases
raised average real wages by 84%, but only to two-thirds of their 1994
levels. Per capita income (970 USD in 1995, 870 USD in 1996, 630 USD in
1997, and 690 USD in 1999) is now signifi cantly below the Former Soviet
Union (FSU) average.
Economic reforms have lagged in Turkmenistan compared to other
FSU countries. In November 1993, Turkmenistan introduced its own
currency, the manat, and established a dual exchange rate system with
an offi cial rate used for all transactions related to gas exports, and a
commercial rate which was substantially higher. From 1995-1998, the
government took some steps towards a market economy. It removed
price controls on most consumer goods, privatised most micro or
small enterprises and trade and catering establishments, and initiated
a leasehold programme to transfer agricultural land to private farmers.
It also made several attempts at unifying the exchange rate, the last
in April 1998. However, little progress was made in macroeconomic
stabilisation or structural reforms. The government has recently
formulated a ten-year production and investment plan that includes
large investments in infrastructure and energy fi nanced by foreign
direct investment and the fi scal budget.
One half of its irrigated land is used for cotton production, making it the
world’s tenth largest producer. Until the end of 1993, Turkmenistan had
experienced less economic disruption than other former Soviet states
because its economy received a boost from higher prices for oil and gas
and a sharp increase in hard currency earnings. With an authoritarian
ex-Communist regime in power and a tribally based social structure,
Turkmenistan has taken a cautious approach to economic reform,
hoping to use gas and cotton sales to sustain its ineffi cient economy.
Privatisation goals remain limited. In 1998-2001, Turkmenistan suff ered
from the continued lack of adequate export routes for natural gas and
from obligations on extensive short-term external debt. At the same
time, total exports have risen sharply because of higher international
oil and gas prices. Turkmenistan is the most closed, inward-oriented
country in the region, relying heavily on its rich natural gas deposits.
Turkmenistan economic statistics are state secrets, and other GDP and
fi gures are subject to wide margins of error (CIA 2002). Turkmenistan has
good long-term potential for development given its natural resource
base. The large share of the gas sector in the country’s GDP indicates
that even a modest upturn in gas output would imply growth in GDP.
International programmes and agreements related to waterThe sharing of transboundary water resources in Central Asia
has become one of the main problems regarding the relations
between the countries of the region since gaining independence.
Acknowledging that regional water resources management is one of
the most important issues for sustainable development, in 1992 Water
Management bodies of Kazakhstan, Kyrgyzstan, Tajikistan, Turkmenistan
and Uzbekistan signed an agreement on cooperation in the joint usage
and protection of transboundary water resources. The parties agreed

28 GIWA REGIONAL ASSESSMENT 24 ARAL SEA
to coordinate their actions establish rules of water resources usage, to
fi nd joint solutions to ecological problems, and determined minimum
sanitary conditions downstream. It was agreed not to alter the order
of interstate water division and water quotas which existed under the
USSR. In order to take coordinated decisions, the Interstate Coordination
Water management Commission (ICWC) was established.
In March 1993, at the Kyzylorda conference on the Aral Sea, the heads
of the states took the decision to organise the Interstate Council on the
problems of the Aral Sea Basin. The ICWC with its associated divisions;
the Center of Scientifi c Information (SIC) and the Basin’s administration
along the Amudarya and Syrdarya rivers, got the rank of organisations
subordinate to the International Fund for saving the Aral Sea (IFAS)
(Velmuradov 2003, Kipshakbaev 2004, Sarsembekov at al. 2004).
The International Commission on Sustainable Development (ICSD),
organised under the IFAS, became responsible for the coordination
and control of regional cooperation regarding environmental
protection and sustainable development of Central Asian countries.
This included the development of the main principles and criteria for
passing legislative acts concerning the problems of the stabilisation and
improvement of the environment (Esenov & Mamieva 2003, Dzhalavov
2003, Aslov 2003, Nurushev 2003).
A conceptual base for the improvement of water management and the
ecological situation in the Aral Sea Basin was formulated in the joint
declarations on the Aral Sea problems signed by the heads of Central
Asian states in Kzyl Orda (1993), Nukus (1995), Almaty (1997), Ashgabat
(1999), and Dushanbe (2002). These documents stress the necessity of
normative-legal regulation of regional water resources management.
These agreements became central to large-scale international
programmes and projects on the Aral Sea problems, including those
fulfi lled with fi nancial support of international funds and organisations.
The most important projects include;
A programme of concrete actions on the improvement of the
ecological situation of the Aral Sea Basin (ASBP-1). The main
priorities include the development of sustainable strategies
of water resources management and the improvement of the
methods of regional water resources management (Ryabtsev 2003,
Aslov 2003).
A GEF project entitled “Water and environmental management in
the Aral Sea Basin”, fi nanced by the World Bank, and governments
of the Netherlands, Sweden and Central Asian countries which
focussed on the development of a national and regional water
strategy, the improvement of dam safety, the monitoring of
transboundary waters and the formation of public opinion
promoting stability in Central Asia (Aslov 2003).
Special United Nations programme on rational and eff ective use
of energy and water resources of Central Asia (SPECA). Within
the framework of this, a diagnostic report was developed on the
concepts of strategy and regional cooperation on rational and
eff ective usage of regional water and energy resources. These
documents are oriented around the improvement of a normative-
legal base, the creation of an economic mechanism of water usage,
and cooperation in achieving stable development of Central Asian
countries (Koimdodov 2003).
“Programme on concrete actions on improvement of ecological
and socio-economic situation in the Aral Sea Basin for the years
2003-2010” (ASBP-2). The priority issues of the programme were
approved by the regional heads of states at the meeting in
Dushanbe in October, 2002. The programme guides the countries
on the: continual coordination of the mechanisms of water
resources management; rehabilitation of water resources objects;
improvement of the use of water and land resources; struggle
against desertifi cation and natural disasters; implementation
of water saving measures; strengthening of the legal base of
cooperation in the context of sustainable development; and the
improvement of socio-economic conditions for the population of
the Aral Sea Basin (Koimdodov 2003, Esenov & Mamieva 2003).
The governments of the Central Asian countries, IFAS, and its institutions
ICWC and ICSD, and with the help of international aid, are taking steps
to resolve the priority issues of water distribution, ecological safety
and economic development, taking into account the interests of each
country. The creation of water-energy, transport and food consortiums,
a concept which was approved by the presidents of states and members
of the organisation “the Central - Asian Cooperation” in the summer of
2004, aims to develop integration processes (ICWC 2004).

ASSESSMENT 29
Assessment
Table 7 Scoring table for the Aral Sea region. This section presents the results of the assessment of the impacts
of each of the fi ve predefi ned GIWA concerns i.e. Freshwater
shortage, Pollution, Habitat and community modifi cation,
Unsustainable exploitation of fi sh and other living resources,
Global change, and their constituent issues and the priorities
identifi ed during this process. The evaluation of severity of each
issue adheres to a set of predefi ned criteria as provided in the
chapter describing the GIWA methodology. In this section, the
scoring of GIWA concerns and issues is presented in Table 7.
IMPA
CT Freshwater shortage
The rational use of water resources is a major component of the present-
day strategy of nature management and sustainable development.
Problems associated with the sharing of transboundary water resources
can provoke confl icts and are becoming the subject of increasingly
complicated interstate negotiations. The rapid development of irrigated
areas in the region has destabilised the water level of the Aral Sea and is
jeopardising the preservation of ecosystems in Priaralye.
This situation is accompanied by poor water quality as a result of the
discharge of drainage water from irrigated areas. Consequently in the
early 1990s the socio-economic and ecological situation in Priaralye
was assessed as critical.
The freshwater concern is inextricably linked with the other assessed
concerns. In particular, habitat modifi cation of the Aral Sea and the
Syrdarya and Amurdarya river basins, and the resultant changes in
abundance and distribution of biological resources was caused by
the upstream modifi cation of streams for the purposes of irrigated
agricultural. Therefore to obtain a comprehensive understanding of
* This value represents an average weighted score of the environmental issues associated to the concern. For further details see Detailed scoring tables (Annex II).
** This value represents the overall score including environmental, socio-economic and likely future impacts. For further details see Detailed scoring tables (Annex II).
*** Priority refers to the ranking of GIWA concerns.
Increased impact
No changes
Decreased impact
Assessment of GIWA concerns and issues according to scoring criteria (see Methodology chapter).
The arrow indicates the likely direction of future changes.
IMPA
CT
IMPA
CT
IMPA
CT
IMPA
CT
0 No known impact
1 Slight impact
2 Moderate impact
3 Severe impact
Aral Sea
Envi
ronm
enta
l im
pact
s
Econ
omic
impa
cts
Heal
th im
pact
s
Othe
r com
mun
ity
impa
cts
Over
all S
core
**
Prio
rity*
**
Freshwater shortage 3.0* 3.0 2.8 2.3 2.9 1
Modification of stream flow 3
Pollution of existing supplies 3
Changes in the water table 3
Pollution 2.4* 2.4 2.8 2.3 2.5 2
Microbiological pollution 0
Eutrophication 1
Chemical 3
Suspended solids 1
Solid waste 2
Thermal 1
Radionuclide 1
Spills 1
Habitat and community modification 2.4* 2.4 2.4 2.3 2.4 3
Loss of ecosystems 2
Modification of ecosystems 3
Unsustainable exploitation of fish 0* 0 0 0 0 5
Overexploitation of fish 0
Excessive by-catch and discards 0
Destructive fishing practices 0
Decreased viability of stock 0
Impact on biological and genetic diversity 0
Global change 1.0* 1.0 1.0 1.0 1.0 4
Changes in hydrological cycle 0
Sea level change 1
Increased UV-B radiation 1
Changes in ocean CO2 source/sink function 0

30 GIWA REGIONAL ASSESSMENT 24 ARAL SEA
the freshwater shortage concern, refer to the habitat modifi cation
concern.
Environmental impactsModifi cation of stream fl ow
The most acute problem in the Aral Sea region is the irrational use of
surface water resources. The volume of water consumed in the areas
of the region where water is predominantly used is largely determined
by the interests of irrigated farming, which accounts for 50% of GDP
(Schultz 2002). A sophisticated farm-to-farm and inter-farm irrigation
network of a total length of 316 000 km and a drainage system of a total
length of more than 190 000 km have been constructed in the region
(Duskayev 2000). A complex system of river fl ow regulation includes a
large number of river and off -river water reservoirs, and is controlled
by two basin administrations; the Syrdarya and the Amudarya offi ces
which were established before the collapse of the USSR. These offi ces
were incorporated into the Interstate Coordination Water Management
Committee (ICWC) in 1992.
On the territory of Uzbekistan, in addition to numerous ponds and
small-capacity water reservoirs used for irrigation, 50 relatively large
reservoirs with a total volume of 19 km3 have been constructed. The
total volume of reservoirs constructed on the Syrdarya in Uzbekistan
is 5 km3, and 29 water-storage reservoirs with a total capacity of
14 km3 have been built on the Amudarya. The largest water reservoirs
are Charvak water reservoir on the Charvak River near Tashkent and
Andizhan water reservoir in Osh valley on the Karadarya River. The
existing reservoirs have a run-off control rate of 0.94 for the Syrdarya
(i.e. close to its maximum), and 0.78 for the Amudarya, with capacity
for further increases. Upstream fl ow regulation in the Amudarya Basin
is provided by three main reservoirs, namely the Nurek and Baypasin on
the Vakhsh River and the Tuyamuyun on the Amudarya, as well as by
a network of river reservoirs and their associated canals. There are four
river reservoirs on the Karakum Canal, two on the Amubuchara Canal
and one on the Karshin Canal, which can hold a combined volume of
6 km3 (SPECA 2004).
The greatest consumer of water resources is Uzbekistan which, on
average, uses approximately 54% of the region’s total water resources,
a fi gure which rose to 60% in 1999. Turkmenistan uses about 19% of the
regional water resources. The overwhelming proportion of river fl ow
(almost 68%) is formed on the territory of Tajikistan and Kyrgyzstan, yet
the main irrigated areas where most of the total river fl ow is used are
located on the territories of Uzbekistan, Turkmenistan and, to a lesser
extent, in Kazakhstan. It is estimated that more than 90% of total water
resources are used by irrigated farming in these countries, and this
percentage remains relatively consistent from one country to another,
fl uctuating between 88.5% and 92.6% (Kipshakbayev & Sokolov 2002).
Irrigated areas in the Aral Sea Basin grew from 4.51 million ha in 1960 to
6.92 million ha in 1980 and to 7.85 million ha in 2000. Accordingly, total
water intake for irrigation rapidly increased and by the beginning of the
1980s had reached 120.7 km3/year and overall water consumption in the
Aral Sea Basin exceeded the available river water resources. Today, due
to the use of return waters, the volume of water resources used exceeds
available supplies; in the Syrdarya Basin 130-150% of available water
resources are used and in the Amudarya Basin, 100-110% (Kipshakbayev
& Sokolov 2002).
Naturally, the increase in water consumption, particularly in low-water
years, has severely aff ected the numerous rivers in the region. The Irtysh
and Ishym in the east, the Chu, Talas, Syrdarya and Amudarya in the
south, the Ural in the west and the Ishim and Tobol in the north are
transboundary rivers and the largest of these, the Amudarya and the
Syrdarya, cross the borders of three or more countries. In the Amudarya
Basin the reduction in river fl ow following the construction of the
Takhiatash and Tyuyamuyn reservoirs and the excessive use of water
in irrigated areas has modifi ed the delta and fl oodplain environment.
By the year 2000 the total annual run-off of the Amudarya near the
estuary (Chatly-Samanbay measuring station) had reduced by almost
ten times in comparison with 1970. As a result, less than 10% of the total
area of delta lakes in the Amudarya lower reaches remained, and the
once profi table fi shery and water rat fi shery practically disappeared.
Furthermore, some regions in Tajikistan suff er from water defi ciency,
despite being on the territory where the majority of the Amudarya
fl ow is formed and which seems to have an excess of water resources
(Olimov 2001).
The reduction in the fl ows of the Amudarya and Syrdarya rivers
resulted in a decline in the water level of the Aral Sea and threatened
the preservation of the Priaralye ecosystem (Kamalov 2002). The area
of the Aral Sea has reduced more than two-fold. In 1986, the Sea
divided into two independent water reservoirs-the Big and Small
seas-and by July 2002 the water level in the Big Sea had decreased by
22 m (Zholdasova et al. 2002). The dramatic shrinkage of the Aral Sea
since the 1960s is one of the greatest environmental catastrophes ever
recorded. The salinity of the lake’s waters has tripled, killing plant and
animal life. In addition, the climate has been aff ected; both summer
and winter temperatures have become more extreme. Plans have been
made to use less water from the Amudarya and Syrdarya for irrigation
in order that more can fl ow into the Aral, though these eff orts may not
be suffi cient to save the Aral Sea.

ASSESSMENT 31
The extreme degradation of the water and deltas of the Amudarya
and Syrdarya and the multiple reductions in the area of delta lakes and
swamp water areas caused a severe reduction in bio-diversity and a
greater concentration of pollution in surface and groundwater supplies.
The total area of lakes in the Amudarya delta reduced from 300 000
to 30 000 ha and water mineralisation increased to 20-25 g/l, which
resulted in an abrupt reduction of fi sh and animal reproduction.
In 1960 fi sh catches in the Amudarya delta weighed a total of
22 520 tonnes compared with only 1 100 tonnes in 2000. Similarly, the
water rat population decreased from 1 130 000 to 1 000 (Amirbekov et al.
2002). Between 1970 and 1999 the area of tugay forests in the Amudarya
delta reduced ten times from 300 000 to 30 000 ha and no successful
attempts were made to restore the natural forest (Bakhiev & Treshkin
2002). Desertifi cation and the degradation of aquatic ecosystems has
severely aff ected wildlife; in the Amudarya delta, besides a reduction
in the water rat population, about 6 species and subspecies of fauna
disappeared, more than 20 species became rare, and approximately 30
species of ornithofauna disappeared.
Pollution of existing supplies
A considerable part of available (accessible for use) water resources
consist of return waters (drained effl uents from irrigated areas,
industrial wastewaters and municipal sewerage waters). Their average
annual volume in the Aral Sea Basin is 32.4 km3 which between 1990
and 1999 increased from 28 to 33.5 km3 (Kipshakbayev & Sokolov 2002,
Dzhalalov 2003). Some return waters are used repeatedly for irrigation,
more than 51% of return fl ow is discharged into rivers and 31% into
natural relief depressions. More than 95% of the total volume of return
waters is formed by drainage waters from irrigated fi elds, which is
the reason why return waters have high mineralisation and are one
of the main sources of pollution of surface and groundwater in the
region. About 60% of the total volume of return waters is formed in
Uzbekistan.
Approximately 15% of surface water supplies in the Aral Sea Basin
have been contaminated with polluted drainage and wastewaters
(Kipshakbayev & Sokolov 2002). Today, it is severely aff ecting water
quality; mineralisation has increased dramatically, and in some cases
has diminished the ecological and economic functions of reservoirs.
This is particularly true for the numerous water reservoirs that collect
drainage and wastewaters in the lower reaches of the Amudarya and
the Syrdarya. The largest of these are the Sarykamysh (with a volume of
about 26 km3) and the Aydar-Arnasay Lake (about 30 km3) as well as the
Dengizkul, Sudochye and the Solenoye lakes, each containing several
million cubic meters of water. Most of them are stagnating and have
high salinity levels. Subsequently they cannot be used for fi shing, and
fl ora and fauna are unable to survive (SPECA 2004).
The mineralisation of the Amudarya water increases from 0.4-0.5 g/l in
mountain rivers, to 2.0 g/l or more in the deltas (Chembarisov & Lesnik
1995, Khasankhanova & Abdullaev 2001, Chembarisov et al. 2001a).
According to research carried out along the Amudarya and Syrdarya
rivers, copper, zinc and hexavalent chromium concentrations exceed
the Maximum Allowable Concentration (MAC). Along almost the entire
Amudarya River phenol concentrations exceed their MAC. Salinity has
increased from 10 g/l to 40-50 g/l due to a lack of freshwater infl ow to
the rivers.
An average of 11 km3 (36.8%) of return waters are discharged into
natural depressions in the landscape and are subsequently not
used for economic purposes. The overwhelming proportion of such
waters (85.8%) is formed by the drainage waters of the Amudarya
Basin. Drainage effl uents from irrigated fi elds discharged into rivers
are degrading riverbeds and deteriorating the water quality of the
Amudarya. This is adversely aff ecting the ecology of Priaralye.
The waters of the rivers in the Aral Sea Basin as well as the Aral Sea itself
are heavily polluted by salts and chemical pollutants discharged by the
agricultural and industrial sectors. These issues are discussed further in
the assessment of Pollution.
A major environmental problem facing the Aral Sea Basin is the
increasing salinisation of irrigated areas which is reducing their
productivity. Soil salinisation is occurring through the use of inadequate
drainage systems. Following the collapse of the USSR, a programme
of drainage reconstruction and development, and land melioration
was signifi cantly reduced, producing a ten-fold cutback in investment.
This resulted in increased salinisation and the bogging of lands, and
correspondingly a decline in land productivity (ICWC 2004). The high
mineralisation of irrigation water is increasing salinisation; for the last 30
years mineralisation in the Amudarya Basin increased from 0.4-0.6 g/l
to 1.3-2.0 g/l (Dmitriev 1995).
Between 1990 and 1999, the area of salinised soils increased in the
Amudarya Basin from 1.16 to 1.82 million ha (by 57%), and from 0.34
to 0.61 million ha (by 79%) in the Syrdarya Basin. Between 30 and
66% of the total area of irrigated fi elds in the region are polluted, with
concentrations sometimes exceeding the MAC by 20-40 times. The
effi ciency coeffi cient of drainage systems between 1990 and 2000
decreased by 30%, and if this trend continues, over 50% of the drainage
systems in the region will be out of operation by the mid 21st century.

32 GIWA REGIONAL ASSESSMENT 24 ARAL SEA
According to experts, inadequate drainage systems result in annual
losses of about 1 billion USD (ICWC 2004). In some areas soil salinity
and pollution has caused such a decrease in fertility that irrigation
expenses quite often exceed profi t and lead to a reduction in product
quality (Glazovsky 1995).
The increase in salinised soils has necessitated the further use of
water to wash the soils. In Uzbekistan alone it is necessary to wash
up to 2 million ha of salinised soils annually, which requires up to
2 million m3 of water per hectare. Annually, total water consumption
for these purposes in the region ranges between 6 and 8 billion m3. The
process of improving the salinity of soils in irrigated areas would require
considerable quantities of water. It is therefore imperative to implement
such measures as soon as possible.
Changes in the water table
Total groundwater reserves in the region are estimated at 43.49 km3
per year (Table 8), of which 25.1 km3/year is found in the Amudarya
Basin and 18.4 km3/year in the Syrdarya Basin. Over half of total reserves
(58%) are located in the Amudarya Basin. The total volume of approved
groundwater intake in the Aral Sea Basin is 17.0 km3, of which present-
day net intake barely exceeds 11.0 km3/year (Table 8). The greatest
groundwater deposits are found in Uzbekistan and Tajikistan (more
than 42% of regional reserves).
In the Kazakhstan area of the Aral Sea Basin the majority of groundwater
is used for drinking water (more than 68%), compared with about 40%
in Turkmenistan and Uzbekistan. In Kyrgyzstan and Tajikistan accessible
groundwater resources are predominantly used for irrigated farming,
59.4% and 69.5% respectively.
Water logging and salinisation of soils has resulted in groundwater
deterioration. Groundwater levels have changed signifi cantly as a result
of abstraction for anthropogenic activities. Declining water levels in the
region’s rivers and the Aral Sea have aff ected their ability to recharge
groundwater supplies, resulting in a lowering of the water table by up
to 50 cm per year on non-irrigated territories and in some regions by
as much as 10-15 m.
On irrigated land, however, the groundwater levels have risen with
consequential fl ooding of populated centres. For example, groundwater
levels have increased by up to 1.5 m in 70% and over 50% of the total
area of Khorezm oblast and in the lower reaches of the Zeravshan River
respectively (Abdulkasimov et al. 2003). According to estimates, about
30% of the irrigation return waters in the upper watershed percolate
through the soil to the water table. Some of this water eventually returns
to the rivers as saline infl ow, but much does not. In eff ect, much of
the water from the Aral Sea has accumulated in the groundwater. As
the groundwater is used for irrigation applications downstream, even
regions that do not have a high water table are aff ected. Changes in
the biota, unforeseen and often disregarded during the planning of
projects, are associated with irrigation causing the water table to rise
on an area of 3.23 million ha in the Aral Sea Basin.
Socio-economic impactsEconomic impacts
The freshwater shortage concern is severely impacting the regional
economy. The poor quality and lack of freshwater is hindering
industries in need of water for operations. In the Aral coastal zone
economic activity has been suspended, which is additionally aff ecting
inland industries. The rapid drying-up of the Aral Sea and the associated
degradation of its marine ecosystem has led to the collapse of a
previously well-developed fi shery and fi sh processing industries. There
has consequently been a dramatic decrease in available employment
and income for the inhabitants of the Aral Sea region. Since the end of
the 1980s in the Kyzylorda region of Kazakhstan and in Karakalpakstan
of Uzbekistan, unemployment has been continuously increasing.
A serious consequence of the change in the run-off regime of the main
regional rivers is that water is redirected away from pasture lands to fi ll
Table 8 Groundwater reserves in the Aral Sea Basin and their uses.
CountryGroundwater reserves (km3/year)
Used 1999 (km3)
Groundwater use (km3/year)
ExploredApproved for
usageDrinking water
supplyIndustry Irrigation Vertical drainage
Experimental pumping
Other purposes
Kazakhstan 1.846 1.270 0.293 0.200 0.081 0 0 0 0.012
Kuyrgyzstan 1.595 0.632 0.244 0.043 0.056 0.145 0 0 0
Tajikistan 18.230 6.020 2.294 0.485 0.200 1.594 0 0 0.015
Turkmenistan 3.360 1.220 0.457 0.210 0.036 0.150 0.060 0.001 0
Uzbekistan 18.455 7.796 7.749 3.369 0.715 2.156 1.349 0.120 0.040
Total for the Aral Sea Basin 43.486 16.938 11.037 4.307 1.088 4.045 1.409 0.121 0.067
(Source: Kipshakbayev & Sokolov 2002, SPECA 2004)

ASSESSMENT 33
lowland depressions, resulting in reduced pasture land. For example,
in the area surrounding the Anasay-Aidarkul reservoir more than
2.5 million ha of pasture land has disappeared (Abdulkasimov et al.
2003). Furthermore, desertifi cation resulting from freshwater shortages
has also resulted in a reduction of pasture productivity. For the past
15 years pasture productivity in Uzbekistan has reduced by more than
20% and the harvesting of dry mass fed to animals has reduced from
2.4 to 1.8 centner/ha (Abdulkasimov et al. 2003).
A particularly alarming factor is the rapid reduction in the volume of
water consumed per capita. According to available data (Kipshakbaev
& Sokolov 2002), between 1960 and 2000 water intake per capita in the
Aral Sea Basin reduced 1.7 times from 4 270 to 2 530 m3/person and it
may reduce to below sanitary standards within the next 20 years if the
current rate of population growth continues.
A similar situation exists concerning the distribution of arable lands.
Despite a considerable increase in irrigated areas, due to the rapid
increase in population irrigated areas per capita reduced almost two-
fold between 1960 and 2000 from 0.32 ha per person to 0.18 ha per
person (Kipshakbaev & Sokolov 2002). This barely meets the required
minimum level for the production of the daily human bread quota
(Reteyum 2003). If the current rate of population growth is maintained,
four out of fi ve countries in the Aral Sea Basin (besides Kazakhstan
and Afghanistan) will reduce the “irrigated area per capita” factor to
practically zero over the next 50 years (Rodina 2002).
Water shortage and widespread secondary soil salinity cause a
rapid reduction of usable fi elds and the productivity of agriculture.
Thousands of hectares are drying up and becoming salinised. As
a result, the current socio-economic and ecological situation in
Priaralye is considered to be in crisis (Kamalov 2002). There have been
severe economic losses for irrigated farming as a result of freshwater
shortages. In the Amudarya Basin, economic losses were approximately
260 million USD in the harvest of 2000 (Sorokin 2002). The most severe
situation regarding water supply is observed in the lower reaches of the
Syrdarya and Amudarya, resulting in considerable economical losses in
Uzbekistan and Kazakhstan.
Increasingly salinised and polluted soils have exacerbated the chemical
and biological aggressiveness of the air and water environment.
Chemical reagents and microorganisms in the air damage isolators of
high-voltage transmission lines and salinised groundwater threatens
building and construction foundations. As a result, fi nancial expenses
exceed estimated annual investments by 2.8 times (Abdulkasimov et
al. 2003).
The most diffi cult situation is observed in Turkmenistan and Uzbekistan,
where 80-90% of the national economy depends on the water resources
supplied by transboundary rivers from neighbouring states. Currently
the population of Uzbekistan is allocated less than 2 500 m3 of water
per person per year, falling short of sanitary standards. If predicted
rates of population growth are realised, the situation will deteriorate
substantially.
Health impacts
The health impacts of freshwater shortage are considered as severe,
as water quality and quantity is directly associated with the spread of
disease, especially of the central nervous system, the digestive tract, the
vascular system, as well as infectious diseases and immunity defi ciency.
Health issues associated with the region’s ecological crisis include the
spread of anaemia, diminished thyroid function, and renal and liver
diseases.
Although in general the health of the population in all fi ve countries
is relatively good, there has been a deterioration of epidemiological
conditions in the region resulting in greater morbidity. Between 1995
and 2003 in Samarkand oblast (Uzbekistan) incidences of disease
increased by a factor of 3, the incidence of blood circulation diseases
among children increased by a factor of 5, and over the last 8 years the
number of children suff ering from anaemia increased by a factor of 4.
In the Republic of Karakalpakstan, river water is unsuitable for drinking
supply for 10 months a year (its mineralisation goes up to 2.5-2.8 g/l of
solid residue).
As the Aral Sea recedes it leaves behind a harmful layer of chemical
pesticides and natural salts which are blown by the wind into noxious
dust storms, seriously aff ecting the health of the inhabitants of the
area. It is estimated that 100 000 tonnes of salt and sand contaminated
with pesticide residues are carried away each year by storms with
increasing frequency and severity. Cancer and respiratory diseases
have subsequently increased in prevalence as well as the rate of infant
mortality.
The pollution of surface and groundwater is becoming increasingly
alarming and is directly impacting the health of the population.
Only water in the run-off formation zone in the mountains, with rare
exceptions, meets sanitary standards. Further away from the mountains,
the quality of surface and groundwater worsens abruptly and in the
lower parts of the river and in the irrigation canals it is regarded as
harmful for human health.

34 GIWA REGIONAL ASSESSMENT 24 ARAL SEA
Food safety is becoming increasingly alarming due to the lack of
potable water for the population located in the downstream sections
of the rivers, and famine may occur in future (Rakhmonov 2003).
Today, Tajikistan can only provide a quarter of the population with
domestically grown agricultural products (Reteyum 2003). If current
rates of population growth persist, by the middle of this century the
country will experience a catastrophic reduction of arable land per
capita, thus jeopardising food security (Rodina 2002).
Other social and community impacts
The sharing of transboundary water resources between the countries
of the Aral Sea region can provoke confl icts. There have been increased
expenses for deepening wells and pumping and for providing
alternative water distribution. The region has witnessed a permanent
decrease in agricultural effi ciency (including grain crops, livestock, and
aquatic crops). The fi shing industry, which once employed thousands
of people, has practically collapsed. The shores are barren and several
villages and large towns, such as Aralsk and Moynoq which were located
on the shore before 1960, are now stranded inland.
Due to the water shortage many local populations are choosing
to migrate rather than tolerate the unfavourable conditions. There
has been an estimated 100 000 people displaced due to the poor
environmental conditions in the Aral Sea region. Despite eff orts by
the governments of the region and the international community, the
issue of domestic and economic water supply remains serious and is
frequently a subject of political confl ict between the nations of the
region.
Conclusion and future outlookIn the Aral Sea Basin the irrational use of transboundary water resources
is the primary issue aff ecting the ecological health and socio-economic
integrity of the region. Freshwater shortages are severely aff ecting
the welfare of the population and this issue is impeding sustainable
development in the countries of the region.
The most prominent impacts of the modifi cation of stream fl ow and
the pollution of existing water supplies are: the modifi cation of riparian
habitats; the reduction in agricultural and ecological bio-productivity;
depleted fi sh stocks and a reduction in species diversity, including the
extinction of a number of species; a deterioration in water quality of
surface and groundwater; a reduction in the extent of wetlands; and
the reduced capacity of rivers to transport sediments and disperse
pollution. The water table has risen in irrigated areas due to recharge
by polluted drainage water, but lowered in non-irrigated areas due to
abstraction.
The freshwater shortage concern was assessed as severe, and it can
be concluded that surface water resources in the Aral Sea region are
fully exploited and the economy of the region is developing under
conditions of ever increasing water shortages.
IMPA
CT Pollution
Many of the rivers in the Aral Sea Basin are contaminated, except in the
area of run-off formation. Most pollution consists of various chemical
contaminants. The index of water pollution (IWP) is a classifi cation for
the pollution levels in the region. The IWP not only takes into account
whether the concentration of a substance exceeds Maximal Allowable
Concentration (MAC), but also its danger to human health.
Environmental impactsMicrobiological pollution
Poor sanitary standards are evident in the settlements in the Amudarya
and Syrdarya deltas. The standard treatment facilities (settling,
coagulating, fi ltration, chlorination) do not off er adequate bacteria
removal treatment and in 25-50% of samples the water does not meet
national bacterial standards.
Chemical pollution
The excessive application of agro-chemicals has compromised the
quality of surface and groundwater supplies. A large number of
herbicides, pesticides, mineral fertilisers and defoliants are used every
year in the production of cotton, with ecological, social and economic
consequences for the region (Chembarisov 1998, Chembarisov & Lesnik
1995, Chembarisov et al. 2001a&b, National report 1998, Myagkov
1991a&b, Myagkov & Miagkova 1998, Isida et al. 1995, IFAS 2000). In
the coastal zone surrounding Muinak City, pesticides are applied in
quantities ten-fold the average for the former USSR countries, while
the total use of pesticides in Uzbekistan exceed the standard level by
six times.
The agro-chemicals not utilised by the plants and soil are washed
away from the fi elds and into rivers via irrigation canals. By the end
of the 1980s, more than 3 billion m3 of water contaminated with
agro-chemicals from the fi elds of Uzbekistan and Turkmenistan were
discharged annually into the Amudarya River (Chub 2000).
A large amount of industrial and domestic wastes has been stored
on the territory of the Central Asian countries over a long period of
economic activity. The issue of their removal, storage and processing is

ASSESSMENT 35
becoming increasingly important as they are negatively aff ecting the
environment.
The most polluting industries in Kyrgyzstan are the mining, tanning,
cement, chemical, galvanising and textile industries. As the Republic
does not have any special facilities to store and process harmful
industrial waste, nor sites for their disposal, the industrial enterprises
are obliged to store them on their territories.
Until recently, 70 mineral deposits were exploited on the territory of
Tajikistan. The mining and processing industries extract huge amounts
of mountain rocks and use only 3-10% of these as useful raw material.
The rest is stored in tailing dumps and dump pits. Industrial wastes
contain over 400 substances, some of them toxic. The main producers
of toxic wastes are Tajik Aluminium Plant (TAP), the industrial association
“Tajikchimprom,” and other enterprises. There are 3 sites for toxic wastes
in Turkmenistan: Mariinsk velayat “Karipaty”, Lebap velayat “Zerger” and
Dashhovuz velayat “Takhta”. 1 350 tonnes of out-dated and prohibited
chemical pesticides such as keltan, butiphos, metilethylchlorophos
were disposed on these sites.
On the territory of Uzbekistan there are 43 enterprises with more than
80 storage sites for industrial wastes. They occupy about 22 000 ha,
comparable in size to an administrative district. In Uzbekistan,
300 million m3 of contaminated industrial wastes are produced annually,
of which approximately 10% is discharged into water reservoirs without
treatment. More than 25 billion tonnes of industrial wastes from mining
enterprises, a considerable fraction of which is formed by toxic wastes
from non-ferrous industries, have accumulated in the region.
As a result of these economic activities, the rivers of the Aral Sea Basin
are generally highly polluted. However, the water quality of rivers in the
mountainous regions of the Syrdarya and Amudarya basins is relatively
good, though water in the high reaches of some mountainous rivers
(e.g. the Pskem, the Chatcal, the Ugam) has a medium level of pollution
and a satisfactory IWP (1-3).
Downstream of the mountains the level of river pollution intensifi es.
Although in some rivers and canals self-cleaning of the water is evident,
the general situation of water quality in the Syrdarya Basin is poor and
in the lower reaches of the rivers and canals the index of water quality
is bad. Water quality is unsatisfactory and contains concentrations of
phenols, copper, zinc and chromium higher than their MACs in the rivers
of Ahangaran (below the Tuyamuyunskoe reservoir) and Karadarya
(near the city of Andijan). Table 9 shows the water quality of the rivers
in the Syrdarya Basin.
The situation in the Amudarya Basin is
no better. The discharge of drainage
water results in the deposition of
contaminants on the riverbeds.
Consequently, mineralisation increases
along the course of the River, from
0.7 g/l at the boundary of Turkmenistan
and Uzbekistan to 1.7-2.0 g/l at the
river delta (Table 10). Furthermore,
the salinity of water also increases
progressively along the course of the
rivers in the Aral Sea Basin (Table 11).
According to sanitary research the amount of chemical pollutants
discharged every year into the Amudarya amounts to 300 tonnes of
oil products, 1.35 million tonnes of sulphates, and 19 000 tonnes of
surface-active substances. Similarly, 23 000 tonnes of oil products,
Table 9 Water pollution in Syrdarya River Basin.
River/channel Location of the site of water quality assessment
Index of water pollution
(IWP)
Syrdarya 5.0 km above the Keles river mouth 3.75
Naryn 0.2 km above the mouth 2.67
Karadarya 5.0 km below the dam of the Andijan reservoir 3.30
Northern Baghdad channel 0.5 km above the mouth 2.97
Tadjigen 0.2 km above the mouth 3.15
Ahangaran 0.5 km above the mouth 3.56
Kyzylcha At the mouth 1.50
Karasu channel(northern banc) 3.0 km above the mouth 3.55
Chirchik 3.5 km above the mouth 3.81
Akbulak At the mouth 2.09
Bozsu channel At the mouth 3.79
Shuruzyac collector At the mouth 3.03
(Source: Rubinova 2000)
Table 10 Salinity along the Amudarya River.
River Salinity (g/l)
Upper Amudarya 0.71
Kelif 0.73
Kerki 0.84
Chardjou 0.91
Il’chik 0.98
Tuyamuyun 1.27
Nukus 1.69
Kizildjar 1.92
(Source: Rubinova 2000)
Table 11 Change in salinity along some rivers.
River Upper river (g/l) River mouth (g/l)
Amudarya 0.700 2.000
Surhandarya 0.385 1.500
Kashkadarya 0.270 2.500
Zaravshan 0.255 1.800
Karakum channel 0.700 0.900
Syrdarya 0.650 1.800
Naryn 0.250 0.500
Karadarya 0.345 0.520
Ahangaran 0.140 0.660
Chirchik 0.190 0.500
(Source: Rubinova 2000)

36 GIWA REGIONAL ASSESSMENT 24 ARAL SEA
787 000 tonnes of sulphates, 925 000 tonnes of chlorides, 5 tonnes
of phenols and 7 tonnes of surface active substances are discharged
into the Syrdarya every year. In certain sections of the Amudarya
(Temirbai) and the Syrdarya (Kyzylorda and Kazalinsk) mineralisation
of water between the early 1930s and the late 1980s has increased by
2-3 times. In the Aral Sea, until the year 2000, mineralisation increased
5-6 times compared to the beginning of the 1960s. Today, the rate of
mineralisation in the rivers is static. The mineralisation trends at the
main sections of the Amudarya and Syrdarya basins during the last 6
decades are given in Table 12.
In the region around the city of Nukus, the waters of the Amudarya
River are contaminated with heavy metals, hexachloran, sodium and
magnesium. At the section of Kyzylzhar, pesticides are 20-30 times the
MAC and the water is classifi ed as dangerous.
The discharge of wastewater causes a rapid deterioration in the
ion composition of the river water. Thus, at the narrowing of the
Kyzyldzhar River, concentrations of calcium ions increase by 240%,
magnesium by 420%, hydrocarbons by 120%, sulphates by 620% as
compared with the zone of run-off formation. One of the most polluted
rivers is the Zeravshan. Mineralisation of water in this river increases
from 0.27-0.30 g/l at the headwaters to 1.5-1.6 g/l at the estuary and
concentrations of pesticides exceed the MAC by 5.8-6.2 times. High
concentrations of antimony have also been detected which implies
grave health implications for the population. Water in the lower section
of the Zeravshan River is classifi ed as dangerous. Over the past few years
increases in concentrations of sulphate and chloride and magnesium
and potassium have been recorded (Chub 2000).
According to research only 8% of water in Uzbekistan are categorised as
polluted or very polluted, but 25% are moderately polluted, i.e. they are
at the “red line” which determines a conventional boundary between
satisfactory and unsatisfactory water quality. The water bodies in
Uzbekistan have a total area of 173 600 km2, of which 8.6% is classifi ed as
good quality water, 35.2% as satisfactory, and 44% as bad quality water.
In addition, 5.2% of the country’s water quality is classifi ed as harmful
for human health and in 7.2% very harmful. Only 2.3% of the population
live within the area of good water quality, yet more than 49% live in the
areas of bad water quality, 2.4% use harmful and 0.2% use very harmful
water (Chembarisov et al. 2001a&b).
Fortunately, only background concentrations of heavy metals and oil
products are observed in the majority of the region’s rivers, and most
pollution is concentrated around industrial and urban conglomerations.
The discharge of heavy metal compounds, chlorine and organic
pesticides into the Aral Sea has resulted in the mortality of game-fi sh,
fi sh tumour diseases, and changes in cytogenetic parameters. In 1970
maximum levels of oil hydrocarbons were recorded in the Aral Sea.
However, since 1978 recorded pollution from oil hydrocarbons has been
within the national standards (Chembarisov et al. 2001a&b, Myagkov &
Myagkova 1998, Bragin et al. 2001).
Solid waste
Billions of tonnes of solid industrial wastes have been stored in
Kazakhstan. The non-ferrous industry was responsible for more than
5.2 billion tonnes of wastes, of which 4 billion tonnes are stored in the
waste disposal sites of the mining industry, the ore-dressing industry
more than 1.1 billion tonnes and metallurgical processing 105 million
tonnes of waste.
Radionuclides
The level of radiation contamination in the region varies relatively little.
The dosage rate of gamma radiation ranges between 5-25 mR/hour,
with an average value of 14.4 mR/hour. The density of precipitation
of beta-ionising radionuclides from the atmosphere ranges between
0.5 Bq/m2 per day in Kazakhstan to 5.0 Bq/m2 per day in Uzbekistan,
the average value for the region was 2.6 Bq/m2 per day (excluding
Tajikistan).
Table 12 Historical changes in salinity in some rivers in the Amudarya and Syrdarya basins.
RiverSalinity (g/l)
1932-1950 1951-1960 1961-1970 1971-1980 1981-1990 1991-1999
Amudarya Basin
Surkhandarya - Zhdanov - Manguzar
0.3-0.57 0.32-0.6 0.35-0.88 0.38-1.08 0.40-1.2 0.42-1.2
Amudarya - Kerki - Samanbai
0.5-0.51 0.51-0.52 0.57-0.64 0.59-0.75 0.57-1.2 0.57-1.2
Kashkadarya - Varganza -Karatikon
0.26-0.38 0.27-0.49 0.28-1.01 0.3-1.82 0.31-2.57 0.35-2.57
Zerafshan - Dupuli - Navoi
0.22-0.3 0.23-0.55 0.24-0.73 0.24-0.88 0.24-1.22 0.25-1.22
Syrdarya Basin
Naryn - Toktogul - Uchkurgan
0.24-0.28 0.24-0.29 0.25-0.29 0.25-0.3 0.26-0.3 0.26-0.3
Karadarya - Uchtepe - Kampyrravat
0.3-0.48 0.31-0.49 0.32-0.5 0.35-0.52 0.40-0.53 0.42-0.53
Chirchik - Khodjikent - Chinaz
0.17-0.34 0.18-0.4 0.18-0.44 0.19-0.65 0.23-0.72 0.25-0.72
Angren - Turk - Soldatskoie
0.12-0.32 0.13-0.33 0.13-0.44 0.13-0.68 0.13-0.85 0.13-0.85
Syrdarya - Kal - Kyzylkishlak
0.4-0.42 0.45-0.59 0.62-1.03 1.04-1.2 1.1-1.25 1.12-1.26
(Source: Rubinova 2000)

ASSESSMENT 37
Socio-economic impactsEconomic impact
Pollution is currently one of the most pressing issues in the region and
its impact on the economy was assessed as severe. There is a lack of
eff ective preventative measures to tackle the problem of pollution and
its consequences. Pollution has had signifi cant impacts on industrial
development, competition and investment within the regional
economy.
The economic impacts of pollution in the region include: increased
expenses for animal protection; loss of economically important
species; a decline in the productivity of agricultural land; and the cost
of remediation programmes. Commercial fi shing in the Aral Sea, which
peaked in the 19th century when more than 40 000 tonnes of fi sh were
caught annually, had almost ceased operations by the beginning of
the 1980s as a result of increased water mineralisation and pollution
(Glazovsky 1995, SPECA 2004).
One of the most alarming consequences of the irrational use of land
and water resources is the degradation of arable lands. This has resulted
primarily from increasing soil salinity and contamination due to the
excessive application of herbicides and fertilisers. Nowadays, out of a
total of 7.8 million ha of irrigated land in the Aral Sea Basin, more than
50% has experienced increased salinisation. In the last 20 years humus
concentrations, the main factor determining soil fertility, has reduced by
at least 40% (Abdulkasimov et al. 2003).
In Uzbekistan, moderately and severely salinised soils increased by
more than 50% and by 80% in the irrigated areas of the Fergana valley
(Glazovsky 1995). More than 30% of irrigated land is salinised in Tajikistan,
up to 40% in Kyrgyzstan (Khamidov 2002) and in Turkmenistan as much
as 95% (Yermolov 2003). As a result of soil salinisation and contamination,
the productivity of the main agricultural products - grain crops,
vegetables, cotton and berries - has decreased since the 1980s. Even with
minimal soil salinisation, cotton productivity can decrease by 50-60%,
barley by 30-40%, corn productivity by 40-60%, and wheat by 50-60%
(Askarova 2002). Total reduction in crop yield from irrigated areas caused
by soil salinisation was 30% in Uzbekistan, 40% in Turkmenistan, 18% in
Tajikistan, 30% in Kazakhstan, and 20% in Kyrgyzstan (Abdulkasimov et al.
2003). In addition, the productive quality of irrigated lands in Central Asia
is declining due to toxicants deposited by contaminated water being
washed onto the low-lying areas of the region.
Health impacts
There has been an increase in the rate of morbidity and the spread of
disease in the region. Populations residing within the coastal zone of
Kazakhstan and Uzbekistan have experienced a permanent increase in
respiratory, infectious and internal diseases (Khasankhanova & Abdullaev
2001).
The issue of deteriorating water quality is having a detrimental impact on
the health of the population of the Aral Sea Basin. This is most prominent
in the lower reaches of the Amudarya and the Syrdarya, especially in
the ecologically unstable territory of Priaralye. Serious health problems
concerning the population of Priaralye were registered at the end of
the 1980s (Rudenko 1989). The mineralisation of drinking water was
equal to 2-4 g/l and bacteria exceeded MAC by 5-10 times. By the end
of the 1980s the health of the population in the region had reduced
dramatically; 60% of the local population examined had serious health
problems, 80% of pregnant women suff ered from anaemia, and cases
of infant mortality were 82 per 1000 children born alive (Glantz 1998;
Rudenko 1989). The incidence of tuberculosis, mortality from infectious
and parasite-caused diseases as well as infant mortality is much worse in
Priaralye than in the rest of the region. From the 1970s to the 1980s the
death rate in diff erent areas of Priaralye increased by a factor of between
3 and 29 (Tsukatani 1998). In addition, pests are abundant in the desert
zone of Priaralye and act as a vector for diseases. For example, in 1999,
4 cases of plague and two cases of Crimean gemmorogical fever were
registered in Kyzylorda oblast (Tokmagambetova 2000).
A major factor causing the high level of morbidity is the mineralisation
of drinking water and the high concentrations of chemical fertilisers,
pesticides and defoliants introduced into cotton fi elds, such as the
DDT, methyl mercaptophos, ostametyl, dutifos, milbex, hexachlorane,
lenacil, and ronit (Ro-Neet), Yalan which are contaminating surface and
groundwater supplies and the atmosphere.
Furthermore, the disinfection of drinking water using chlorine causes
the formation of the highly hazardous organo-halogen compounds
in concentrations that exceed local health standards 2-4 times. The
genotoxicity of mother’s milk, revealed in the urban areas of Nukus and
Turtku, is likely connected with the use of chlorinated water.
These pollutants are also contaminating food products. As early as the
mid 1980s pesticides, mineral fertilisers, various microorganisms and
their toxic derivatives became the main pollutants of food products in
Kazakhstan and particularly in Priaralye (Sharmanov 1998). Analysis of
diff erent fi sh species caught in the Syrdarya delta showed an increase
in the concentrations of insecticides and heavy metals in their organs
and tissues.

38 GIWA REGIONAL ASSESSMENT 24 ARAL SEA
Increased concentrations of lead, cadmium and manganese have been
found in children’s organisms, resulting in considerable damage to the
functions and structure of their cells. The number of people suff ering
from oncological diseases is increasing at an alarming rate. For example,
in Kyzylorda oblast 800 people reportedly suff er from oncological
diseases every year; primarily from oesophagus cancer (46.6 cases
per 100,000 people) and stomach cancer (Tokmagambetova 2001).
A signifi cant correlation (0.80-0.99) between the salt composition of
drinking water and the number of oncological oesophagus diseases
has been established.
Poor quality drinking water is recognised as a major factor for the high
morbidity rate in the region. This conclusion is supported by the data
of fi gures 6 and 7, which show a correlation between the percentage of
infant mortality and mortality from infectious diseases in Karakalpakstan
and Khorezm oblast (data presented by the Public Health Ministry of
Uzbekistan) and the disparity of water quality from the standards of
Uzbekistan (Khasankhanova & Abdullaev 2001). A deviation in water
quality from the standards by only 25% causes an increase in mortality
from infectious diseases by 25 to 60 cases per 100 000 people (Figure 6).
As the deviation from water quality standards increased from 20% to
80%, infant mortality increased from 18-20 to 50-55 per 1 000 live births
(Figure 7).
In the majority of the Aral Sea Basin sanitary conditions are similar.
For example, in Kyrgyzstan, where in general the ecological situation
exceeds that of Priaralye, the sanitary-epidemiological situation is
relatively poor. Every year more than 200 000 cases of infectious
diseases are registered in this republic. The number of reported cases
of acute intestinal infections (20.4% in 2000) and hepatitis (9.3%) is also
very high, especially in the areas with an insuffi ciently developed central
water supply network. The main reason for this situation is poor water
quality, with drinking water receiving inadequate treatment. About 36%
of water supply sources in the republic have inadequately wide sanitary
protection zones, more than 8% of water supply receives no treatment
and more than 60% of water does not pass preliminary disinfection.
Overall 700 000 residents (1/6 of Kyrgyzstan’s population) are not
connected to the central water-pipe network. The unsatisfactory state
of rural water-pipes obliges the population to use water from surface
water reservoirs and irrigation systems (Vashneva & Peredkov 2001).
As a consequence, the incidence of acute intestinal diseases is very high
in Kyrgyzstan. The sanitary-epidemiological situation in the Osh oblast
is particularly alarming, due to it having the fewest number of houses
with access to running water in Kyrgyzstan. The incidence of common
intestinal diseases in Kyrgyzstan (382.2-637.7 per 100 000 people
between 1990 and 1999) is often greater than that of Priaralye. During
the last decade only in Kyzylorda oblast did cases increase more
persistently than in Kyrgyzstan. Cases of enteric fever have been
recorded in Kyrgyzstan and in 1998 there was an outbreak of enteric fever
with 1 200 cases (Vashneva & Peredkov 2001).
The declining quality of the region’s water resources has been a
primary cause of the deterioration in the health status of the region,
but socio-economic factors and the general degradation of the region’s
environment have also played an important role. Since the beginning
of the 1990s, higher unemployment, a reduction in family income and
associated poverty and unbalanced nutritional intake, combined with
a degrading medical service have undoubtedly aff ected the health of
the region’s inhabitants.
Other social and community impacts
Many communities have lost the recreational and amenity value of their
local environment due the reduction in species diversity. The social
and cultural integrity of communities in the most aff ected areas has
been threatened by the deterioration in the environmental quality of
the region. Pollution has led to a loss of ecosystem services resulting in
increased unemployment, greater prevalence of diseases and economic
hardship. The quality of agricultural products, and subsequently their
nutritional value, has been reduced. Governmental support has been
required to assist the public and implement remediation measures.
80
70
60
50
40
30
20
10
00 5 10 15 20 25 30
Disparity in drinking water quality standards (%)
per
100
000
peo
ple
Figure 6 Correlation between mortality from infectious diseases (per 100 000 people) and a deviation of water quality from the accepted standards.(Source: Khasankhanova & Abdullaev 2001)
0
20
40
60
80
100
0 10 20 30 40 50 60
per 1 000 live births
Dis
par
ity
in d
rin
kin
g
wat
er q
ual
ity
stan
dar
ds
KarakalpakstanKhorezm
Figure 7 Correlation between infant mortality rate (per 1 000 live births) and a deviation of water quality from the accepted standards.(Source: Khasankhanova & Abdullaev 2001)

ASSESSMENT 39
Overall, other social and community impacts of pollution were assessed
as moderate.
Conclusion and future outlookOverall pollution was considered as severe. The issue of chemical
pollution has the most devastating transboundary impacts. The
excessive application of agro-chemicals is compromising water quality as
drainage water from the irrigated fi elds is discharged into surface water
and leaches into groundwater supplies, thus increasing mineralisation
and salinity, particularly in the lower reaches of the rivers. Industrial,
mining and domestic waste is inadequately disposed and contaminates
aquatic ecosystems. Pollution is hindering economic development and
increasing the prevalence of disease. Unless eff ective measures are
established and adhered to, the extent of pollution in regional surface
and groundwater is expected to increase in the future.
IMPA
CT Habitat and community
modificationLarge-scale irrigation projects, particularly for cotton production, have
resulted in signifi cant habitat modifi cation, especially in the vicinity
of the drying Aral Sea. The ecosystems of the Sea have been severely
degraded, particularly those of the Syrdarya and Amurdarya river
deltas. Habitat modifi cation has been largely caused by the diversion of
freshwater resources for irrigated farming and the pollution of existing
water supplies, and therefore this concern needs to considered with the
freshwater shortage concern.
Environmental impactsThe drying-up of the Aral Sea has resulted in: a more arid climate, with an
intensifi cation of desertifi cation; increases in groundwater mineralisation
and the salinisation of soils; greater wind blown salt and dust from the
dried-up sea bottom; and a sharp reduction in biodiversity. The Syrdarya
and Amurdarya deltas have suff ered the greatest impacts. The area of
natural lakes in the Amudarya and Syrdarya delta were reduced from
640 and 833 km2 to 80 and 400 km2, respectively. Alluvial-meadow
and marsh-meadow soils were transformed into meadow-takyr and
meadow-desert soils. Over 1 million ha of fl ood-lands have dried-up
and the productivity of reeds have decreased by a factor of 30-35. The
area of Tugai forests was reduced by almost 90% as a result of reduced
water availability. Consequently, 18 species of higher plant were lost,
and 54 species of higher plants are now threatened with extinction,
including relict and endemic plants. The degradation of nesting sites
resulted in a severe reduction in bird fauna in river deltas from 173 to 30
species (Amirgaliev & Ismukhanov 2002, Ashirbekov et al. 2002, Askarova
2002, Bakhiev & Treshkin 2002, IFAS 2000, Novikova 1999, Novikova et
al. 2001).
Changes to the Aral Sea ecosystem
The reduction of the water infl ow to the Aral Sea has resulted in
irreversible changes to the Sea’s hydrological and hydrochemical
characteristics and its ecosystems. The changes in the saline balance
have trebled the salinity, and subsequently transformed the Aral Sea
into a biological desert.
The early 1980s witnessed great changes in water fauna. The freshwater
and brackish water fauna, for example phytoplankton and zooplankton
species, were replaced by more salt tolerant marine and haline species.
There has been a four to fi ve-fold reduction in microorganisms (bacteria
and yeast) that inhabit the waters and saline sediments. The population
and biomass of the phytoplankton decreased three to fi ve-fold, and
was replaced by diatom algae. The diversity of zooplankton was also
impoverished, but its biomass remained at a similar level. Even more
striking shifts were observed in the macro-zoobenthos. In the late
1970s, colonising marine species from adjacent saline waters practically
replaced the indigenous species. 44 species existed in the benthos in
1970, 15 in 1978, and 32 in 1982. When the mean salinity of the sea
exceeded 17‰, only 9 species remained from the native fauna (Aladin &
Kotov 1989, Aladin et al. 2001).
The ichthyofauna of the Aral Sea has undergone considerable changes.
The addition of colonising fi sh has increased the number of fi sh species
from 20 to 34. Previously the dominant species were freshwater fi sh,
including bream, sazan, vobla (Caspian roach) and harbel. The
continuing salinisation of the sea has not favoured reproduction,
resulting in decreased catches (except of pike, perch and chub). In the
early 1960s the fi sh catch in the Aral Sea was 46 000 tonnes per year
(over 15% of the total freshwater catches in the USSR), of which nearly
70% was large fi sh. By 1970 annual catches had fallen from 41 000
to 10 000 tonnes and in the early 1980s the total catch had fallen to
1 000 tonnes. Nowadays fi shing has practically ceased altogether
(Aladin 1999).
An increase in salinity to over 23‰ has led to the brackish water
Caspian invertebrates dying out or retreating into the delta waters. The
only survivors were the marine forms and salt-tolerant hydrobionts,
which arrived in the Aral Sea from hypersaline waters. In recent
decades the invertebrate fauna has consisted exclusively of colonising
species, the majority of which have remained untouched due to the
exhaustion of fi sh stocks. Today, salinity in the Big Aral Sea is nearly

40 GIWA REGIONAL ASSESSMENT 24 ARAL SEA
63‰ and consequently very little is able to survive in these waters
(Zholdasova 1999).
The drained tract of the Aral Sea Basin is characterised by a lower
biodiversity in comparison with the coast. Among the plant species of
the Aral Sea coast, 30 species are valuable fodder plants, there are more
than 30 species of medicinal plants and 31 species of weed plants. More
than 60 species of local fl ora are potential phytomeliorants for the dried
coasts (Novikova 2001).
The area aff ected by irrigation practices is not restricted merely to the
land which is actually irrigated but instead includes the feed source
(the river), the reservoirs, the main and subsidiary canals, the man-made
lakes (for accumulation of the collector-drainage waters) and the river
valleys, deltas, and fi nal lakes. All these components of irrigation cause
signifi cant changes in the region’s terrestrial and aquatic ecosystems
(Bakhiev & Treshkin 2002, Novikova 1999, Novikova et al. 2001, Treshkin
2001).
The development of irrigated agriculture in the Aral Sea Basin has
replaced natural desert ecosystems of an area of 7.2 million ha with
agricultural coenoses. To regulate water feed to the fi elds, reservoirs
(Chardara on the Syrdarya River; Takhiatash and Tyuyamuyun
on the Amudarya River) were created, inundating 277 000 ha of
fl oodplain and desert ecosystems. Furthermore, canals were created,
destroying 40 000 ha of the natural environment. The total length
of the irrigation and drainage channels in Uzbekistan is 180 000 km.
Thus, as a result of irrigation development over the last 30 years,
approximately 4.5 million ha of natural ecosystems have been lost,
with a total biological productivity of 5.4 million tonnes (including
1.8 million tonnes of useful products). The total biological production
of the agro-coenoses on irrigated areas is 120 million tonnes,
10 million tonnes of useful production (Kuksa et al. 1991).
Changes in the biota, unforeseen and often disregarded during
the planning of projects, are associated with raising the water table
by irrigation. In removing the collector/drainage waters from the
oases, 530 000 ha of desert ecosystems have undergone fl ooding,
waterlogging and salinisation. Thus, as a result of the processes
accompanying irrigation, salty solonchak-type ecosystems have
developed on an area of 4.06 million ha, where weedy halophile
mixed herbs and halophile shrubs and sub-shrubs dominate, with an
impoverished diversity of fauna. Remembering that about half of the
present irrigated lands have become saline and parts of them are not
sown every year, the total area of anthropogenic solonchak systems
approaches 5 million ha.
A change in the water balance of the rivers and increased water
mineralisation has resulted in the loss of unique biocenosis and a
number of endemic animal species. Until 1960 over 70 species of
mammals and 319 species of birds inhabited the river deltas. Nowadays
these numbers have been reduced to 32 species of mammals and 160
species of birds. In the low-lying areas of Syrdarya more than 100 000 ha
of alluvial soils have become alkali soils and more than 500 000 ha of
wetlands have dried up. This has resulted in the modifi cation and
destruction of 5-7 food sources for sheep, goats, horses and camels
(Saiko 2000).
Changes to the wetland (tugai) ecosystem
Syrdarya delta
The ecological changes to the Syrdarya delta began slightly earlier
than in the Amudarya delta. As early as the 1960s, the renewable water
resources of the Syrdarya Basin were fully exploited, and in the 1970s
this level was exceeded as return waters also began to be exploited.
The further increase in river-water abstraction led to a reduction in
fl ow in the lower reaches of the delta. In the late 1970s, only an average
of 4% of the annual resources formed in the catchment area actually
Figure 8 The Toktogul hydroelectric dam on the Naryn (Syrdarya) River, Kyrgyzstan.(Photo: CORBIS)
ASSESSMENT 41
entered the Syrdarya delta. The summer-spring fl oods on the Syrdarya
ceased as early as 1971. Simultaneously, there was a rapid fall in the
level of the Aral Sea, which led to desertifi cation on the delta plain. By
1978 approximately 114 000 ha of alluvial meadow soils had turned into
solonchaks and 532 000 ha of marshy and meadow-marshy soils had
dried out and 31 000 ha had become desert. Thus, 732 000 ha eff ectively
went out of agricultural use. The productivity of the grass/mixed-herb
and mixed-herb meadows was reduced to one-third of its former level
(Bakhiev et al. 1987).
Formerly rich areas of hydrophile vegetation (hay and fodder areas)
died on a large part of the delta. Total fodder resources fell from 1.5
to 0.5 million tonnes. The area of riparian woodland was halved, and
the remaining was severely degraded and desertifi ed. Desert species
of plants and animals started to expand in the delta and fl oodplain,
and impoverished desert ecosystems began to form (Novikova 1999).
Colony-forming birds relocated away from the lower reaches of the
Syrdarya.
Amudarya delta
The reduction in river fl ow following the construction of the Takhiatash
and Tyuyamuyn reservoirs and the excessive use of water in irrigated
areas has modifi ed the delta and fl oodplain environment. The area
occupied by plant communities found in the fl oodplain habitats only
under annual spring-summer fl ood inundation was reduced from 35%
to 8% and plant communities characteristic of periodically fl ooded
habitats above the fl oodplain were reduced from 40 to 20%. At the
same time, the number of communities associated with salinised and
desertifi ed parts of the fl oodplains and delta rose from 25 to 75%
(Novikova 1999).
Vast reed thickets occupied more than 300 000 ha in the Amudarya
delta. They were a rich habitat for bird fauna, inhabited by 21 species
of waterfowl (including 11 nesting species, the Khivin pheasant, 9
species of waders, including spoonbills), several species of raptors and
more than 10 species of passerine birds. Wild boar and reed cat were
widespread and until the late 1930s the Central Asian tiger inhabited the
fl ood plains. By the mid 1980s the area of reed thickets had reduced fi ve-
fold, and the green weight yield decreased from 30 000-40 000 kg/ha in
the 1960s to 4 000-12 000 kg/ha in the 1980s. The populations of reed
dwelling animals were considerably depleted. By the 1980s the wild
boar population had declined almost six-fold (Kuksa et al. 1991).
In the maritime area of the delta, a large muskrat population inhabited
lakes. In the early 1980s this whole network of lakes had dried up,
putting an end to hunting and trade. The muskrat continued to be
caught on a non-commercial scale until 1990 on Lakes Togus -Tore and
Sudochye.
With the persisting and worsening aridity and desertifi cation of the
environment in the Amudarya river delta, the productivity of the
meadow and pasture communities continues to decline in the current
environmental conditions of the Aral Sea region.
Desertifi cation in the delta is leading to the replacement of highly
productive reed communities by mixed communities of low growing
reed, annual Salsola spp., often by bushes of tamarix and in some
places by Karelinia caspica and Alhagi pseudalhai. The yield of these
communities does not exceed 400-500 kg/ha. By 1985 only 70 000 ha of
watered reedy hay lands remained in the Amudarya delta. Commercially
valuable reed areas can only be preserved by irrigation on the bottom
of the drying up lakes and depressions between the streambeds for
about 2 months a year.
The increasing aridity of the Amudarya fl oodplain and delta, and
the practice of unsustainable forestry have threatened the existence
of the unique riparian woodland ecosystems. In the early 1930s the
riparian woodlands occupied 300 000 ha in the lower reaches of the
River, but by 1986 this had been reduced to 33 000 ha. In 50 years their
area within the lower reaches and Amudarya delta had decreased by
nearly 90%. The degradation and loss of the riparian woodlands gained
impetus in the late 1970s and 1980s. In 8 years (1978-1986) the area of
riparian forests in the delta halved. The rate of mortality of the riparian
woodland reached a “record” of 5 778 ha per year. Today these forests
form less than 3% of the total forest resources of Karakalpakstan. Many
of the stands that have persisted are now dieing, and illegal felling
continues (Treshkin & Kuzmina 1993).
Floristically the Amudarya riparian forests are the richest ecosystem
in Central Asia and include 567 species of higher plants, including
29 endemic species and many relict plants of the Tertiary geological
period. Presently, the profound disruptions in habitat have led to the
near extinction of 54 species of plants (in 46 genera and 26 families).
Even by the end of the 1980s, white and yellow water-lilies, Aldrovanda,
Agropyrum repens, and ferns no longer existed (Novikova 2001).
The number of mammals has declined. The Khangul-Bokhara deer, the
typical inhabitant of the riparian woodlands, has virtually disappeared
from the wild. Only about 10 semi-wild deer in the Baday-Tugai reserve
survive today.

42 GIWA REGIONAL ASSESSMENT 24 ARAL SEA
Environmental degradation has resulted in a reduction in the trophic
potential for birds and mammals. The fi sh mortality in the Aral Sea and
the impoverishment of food sources in the delta waters makes survival
diffi cult for fi sh of higher trophic levels and insectivorous birds of the
water-swamp ecosystem.
There was widespread migration of waterfowl and aquatic-swamp birds
both within the Aral Sea region and further a fi eld. As early as 1978, a
complex of birds including thousands of red-legged and red-crested
pochards and river ducks, whooper swans, spoonbills, cormorants and
white and Dalmatian pelicans left the Syrdarya delta, which had lost its
fl ooded areas, and migrated to the Turgai lakes, 350-400 km north. The
total number of species which relocated amounted to several hundred
thousand (Zaletaev 1989).
Socio-economic impactsEconomic impacts
The impacts caused by habitat and community modifi cations aff ect
practically all economic sectors. Considering the signifi cant and
continual damage caused by this concern, and the high gravity of the
consequences, economic impacts were assessed as severe.
Changes in vegetation caused a reduction in pasture productivity
from 1.2 million to 600 000 tonnes, and the productivity of cereal
mixed-grass meadows and mixed-grass meadows decreased three-
fold. Commercial use of water-marsh areas has ceased completely
(Kuksa et al. 1991).
Desertifi cation led to a decline in the areas of hay and pastures and
a reduction in their yields. Since 1960, the area of hay was reduced
from 420 000 ha to 70 000-75 000 ha by the end of the 1980s. Along
with this 6-fold reduction in area, the hay yield on the periodically
watered areas fell from 1 500-4 000 to 300-1 600 kg/ha (dry plant
weight) and to 70-80 kg/ha on the non-watered decertifying areas.
Only a third of pastures in the Amudarya delta remained, falling from
348 000 to 120 000 ha, and pasture productivity fell from 100-1 400 to
50-500 kg/ha. The reason for the sharp fall in biological productivity of
the meadow communities in the Amudarya delta was the reduction
in water supply to the terrestrial ecosystems by 3-4 classes according
to Ramenskii’s scale, from moist-meadow to dry-steppe and desert
(Novikova et al. 1998 & 2001).
In the Syrdarya Basin the commercial potential of the water-marsh areas
was lost. In the 1950s the yield of muskrat skins was 70 000 to 230 000. In
1968 this fi gure was reduced to 9 000 skins, and by 1978 only 72. There
is now no muskrat trade (Kuksa et al. 1990).
In the Aral Sea itself, salinisation has led to a severe decline in the fi sheries.
Fish catches fell from 46 000 tonnes in the early 1960s, to 10 000 tonnes
in the 1970s and by the 1980s only 1 000 tonnes were landed. Today, the
fi sheries industry has practically collapsed (Aladin 1999).
Health impacts
Habitat and community modifi cation has had detrimental eff ects on
the health of the population. In areas where severe habitat modifi cation
has occurred, living conditions have deteriorated, and subsequently
incidences of anaemia, diminished thyroid function, and renal and liver
diseases has increased. The morbidity rate over the last 10-12 years has
been permanently rising and this trend is predicted to continue. The
decline in productivity of the regional ecosystems has reduced their
nutritional value for humans, for example, from pasture lands and the
fi sheries. The health impacts associated with this concern were assessed
as severe.
Other social and community impacts
The population of the region is now forced to survive upon poor quality
and scarce food supplies. The ecosystems have lost their assimilate
capacity for human activities, and it has become diffi cult to utilise
alternative territorial resources without infl icting further environmental
degradation. The employment structure has changed as individuals
are forced to adopt alternative livelihood strategies due to the collapse
of traditional industries, such as the fi sheries. There has been a loss
in the cultural and recreational value of the natural environment for
the communities of the region. The impacts are occasional but long-
term, and the degree of gravity is medium. Overall, other social and
community impacts were assessed as severe.
Conclusion and future outlookThe modifi cation of habitats has been severe in the Aral Sea region.
However, it is primarily a function of freshwater shortage rather than
a result of direct habitat modifi cation by humans. For example, the
loss and modifi cation of the habitats associated with the Aral Sea
and the river deltas is attributed to the reduction of stream fl ow as a
result of water abstraction for irrigation purposes. This concern was
therefore not selected as the region’s priority concern despite its severe
environmental and socio-economic impacts.
The intensity of anthropogenically induced desertifi cation, secondary
soil salinisation and destruction of the region’s biodiversity, especially in
Priaralye, has not decreased in recent years. Since the end of the 1980s
no research has been carried out in the zones of run-off formation, and
there is little information available on the degradation of mountain
ecosystems (i.e. concerning reductions in the area of woodland

ASSESSMENT 43
vegetation and intensive erosion). Furthermore, the recreational amenity
provided by the mountain regions is being developed; if this is not
suffi ciently regulated there may be ecological consequences. According
to GIWA experts, besides developing a network of protected areas for
conservation in all countries of the region, the rehabilitation of degraded
ecosystems necessitates the establishment of national and regional
ecological programmes aimed at evaluating ecosystem degradation and
understanding the dynamics of natural processes in order to identify the
impacts of development trends and future proposals.
IMPA
CT Unsustainable exploitation of
fish and other living resourcesThe fi shing industry has practically collapsed in the Aral Sea Basin.
Annual fi sheries production declined from 46 000 tonnes in the early
1960s to 1 000 tonnes in the 1980s and today very little fi shing is
practiced. There have also been signifi cant changes in the taxonomic
composition and diversity of fi sh species. For example, freshwater
species have been replaced by more salt-tolerant marine and haline
species. However, this has not been the result of the unsustainable
exploitation of fi sh and other living resources, but resulted rather from
the habitat and community modifi cation concern. This in turn has
been driven by the diversion of water for irrigated agriculture, which
has prevented the suffi cient allocation of water for the downstream
habitats of fi sh and other aquatic organisms.
Environmental impactsThe former thriving ecosystem, which supported 24 game fi sh species,
has been severely impoverished. Fish species included carp, grouper,
sturgeon, salmon, met sheat-fi sh and sea-pike. The fi shing industry was
based primarily on the three fi sh species: bream, carp, and Aral dace.
In the Aral Sea, the valuable fi sh species of sawyer and white-eye fi sh
were fi shed near the coastal areas and in the lower reaches of the rivers.
Changes in the saline structure of the Aral Sea and a loss of biota have
resulted in the collapse of the fi shing industry in the Sea by the year
2000, although some fi shing still continues in the water bodies of the
Syrdarya and Amudarya basins.
Since the mid-1970s members of the Aral department of Kazakhstan
Scientifi c and Research Institute of Fisheries have conducted research into
salt-aff ected fi sh species, including Caspian sturgeon, kurin salmon, azov
and chernomor plaice-gloss and plaice-calcan. With its high ecological
plasticity and ability to spawn in water with a salinity level of 17-60‰,
the plaice-gloss has proven the most successful species to survive in the
current physical conditions. Today, the plaice-gloss accounts for more
than 30% of the total amount of fi sh caught in the Aral Sea.
Socio-economic impactsEconomic impacts
The decline in the fi sheries has impacted the economy of the region
due to the importance of the industry to many communities. The
impact on the regional GDP from the collapse of the fi shing industry
can be assessed as medium to high. However, it should be noted that
the economic impacts have been primarily a result of environmental
changes rather than the overexploitation of fi sh.
Health impacts
This concern has limited direct aff ects on the health of the population,
and there is consequently limited available data.
Other social and community impacts
Fishers surrounding the Aral Sea have been forced to migrate or change
their livelihood strategy as the Sea receded. The communities have lost
a valuable source of nutrition and income, in addition to the loss of
many other ecosystem services. Consequently, the quality of life for
these communities has been diminished.
Conclusion and future outlookGIWA experts agreed that the concern of unsustainable exploitation of
fi sh and other living resources is irrelevant and non-applicable to the
region under the current freshwater shortage scenario.
The restoration of marine biota may be possible following the
construction of the Kokaral Dam which will considerably raise the
water level of the Small Sea. Opportunities to improve the ecological
situation in the critical zone of Priaralye, as well as in the entire basin, are
dependent on freshwater availability and the allocation of water. In order
to rehabilitate the fi sheries water needs to be equitably distributed, the
sea level needs to be regulated and suffi cient minimum discharges from
the Amudarya and Syrdarya need to be maintained.
IMPA
CT Global change
Environmental impactsChanges in the hydrological cycle
Variations in precipitation and temperatures
The recession of the Aral Sea has, to a certain extent, changed the
climate of the Aral Sea region (Molostnova et al. 1987, Zolotokrylin &

44 GIWA REGIONAL ASSESSMENT 24 ARAL SEA
Figure 9 Beached boat in a part of the Aral Sea which was once covered in water.(Photo: SPL)

ASSESSMENT 45
Tokarenko 1991, Zolotokrylin 2003). Summer and winter air temperatures
at measuring stations near the shore have increased by 1.5-2.5°C and
diurnal temperatures have increased by 0.5-3.3°C. At coastal stations
the mean annual relative air humidity decreased by 23%, reaching 9%
in spring and summer. The number of days the region experienced
drought increased by 300%.
The annual cycle of precipitation has also changed. In 1959 maximum
precipitation fell during February and March and the minimum in
September, whereas between 1970 and 1979 the maximum was
observed in April and the minimum in July. A three-fold increase in
refl ected solar radiation in the Aral area due to a seven-fold rise in the
albedo of the area previously occupied by the Aral Sea has contributed
to the increase in climate continentality (Kondratyev & Donchenko 1999).
Although the drying of the Aral Sea and anthropogenically induced
global warming have played roles in changing the climate, the
temperature increases and changes in precipitation rates recorded
over the last 40 years in Southern Priaralye are more likely a refl ection
of natural cyclic fl uctuations in the climate (Zolotokrylin 2003).
According to estimations by the Intergovernmental Panel on Climate
Change (IPPC), the mean global temperature of the atmosphere has
increased by 0.3-0.6°C during the last century. This factor, together
with rising trends in the concentration of CO2 in the atmosphere, has
led to conclusions that the climate, including that of Central Asia, will
warm up signifi cantly in the immediate decades resulting in further
environmental changes (Chichasov & Shamen 1997, Eserkepova et al.
1996, Chub 2000).
According to predictions, the water resources in the main watersheds
of Kazakhstan will reduce by at least 20-22%, droughts will increase in
frequency, and the grain crop productivity will decrease by 20-23%.
The scale of probable alterations in the availability of water resources
in the Aral Sea Basin according to four established scenarios of climate
changes is rather broad, ranging from positive values (GFDL model) to
a decrease in the Syrdarya run-off by 25% and the Amudarya run-off
by 40%. It is obvious that such a decrease in water resources will result
in serious consequences for the countries of the region.
Contemporary and predicted changes in snow-ice and renewable water
resources
In Central Asia melted snow and ice water contribute to the formation
of renewable water resources. Therefore the evaluation of possible
changes in water resources in the foreseeable future requires a reliable
prediction of the changes in snow resources. According to analysis
in Northern Tien Shan, over the last decades the average maximum
snow-water equivalent (the main component of snow resources) has
not changed (Pimankina 1998, Schröder & Sevrskiy 2004). Similar results
were found by Artemjeva and Tsarev (2003) for Western Tien Shan and
Gissaro-Alai. In addition, the volume of river run-off has also been
consistent (Schröder & Sevrskiy 2004, Chub 2000).
The situation concerning the evaluation of the dynamics of ice
resources is more complicated. Investigations (Shchetinnikov 1993, 1998,
Shchetinnikov & Likhacheva 1994, Dikih 2001, Dikih et al. 2001, Vilesov &
Uvarov 2001, Cherkasov 2002, Cherkasov et al. 2002, Durgerov et al. 1997,
Glazirin & Kodoma 2003, Severskiy & Tokmagambetov 2004) confi rm
that the glacial systems of Central Asian mountains develop in the same
direction and have similar rates of change. Therefore, over the last few
decades the area of glaciers in diff erent regions of Tien Shan, Gissaro-Alai,
Pamirs and Dzhungarskiy Alatau has decreased at the average annual
rate of 0.8-1.0% (Shchetinnikov 1993, Shchetinnikov & Likhacheva 1994,
Dikih 2001, Cherkasov 2002, Severskiy & Tokmagambetov 2004). These
results therefore suggest that contemporary and prognostic changes
in ice resources of Central Asian mountains can be assessed using the
example of a single representative area that has reliable information on
its glacier dynamics. In Central Asia one such area is the Balkhash Lake
Basin (southeast Kazakhstan and China). The state of the glaciers of this
basin was analysed for 1956, 1972 (the Dzhungarskiy Glacier System),
1975 (the Zailiyskiy-Kungeiskiy Glacier System) and 1979, and 1990 (the
Northern Slope of Zailiyskiy Alatau’s glacier system).
According to the results of the comparative analysis the average annual
rate of decrease in the glacier area on the northern slope of the Zailiyskiy
Alatau was 0.92% between 1955 and 1990 and the decrease in the net
glacier volume was 1.0%. As previously mentioned, ice resources of the
Ili-Balkhash Lake Basin have decreased by more than 30%. The rate of
glacier retreat has not remained constant over the last few decades. An
increase of nearly 50% took place between 1975 and 1979, in comparison
with the previous 20 years. The rates of glacier retreat has continued to
increase, however not so sharply. Similar glacier characteristics were
observed for the Jazgulem River Basin on the Western Pamir (Glazirin
& Kodama 2003). Moreover, this is consistent with data from recent
research (Batyrov & Yakovlev 2004). Glacial retreat in four large basins
of Gissaro-Alai between 1980 and 2001 is half the rate of that over the
period 1957-1979. Thus, the increasing rate of glacier retreat slowed
between the mid 1970s and the early 1980s.
As the level of precipitation in the mountains of Central Asia has
remained constant, there is a basis to assume that the reduction in the
rate of glacier retreat can be attributed to the rise in air temperature.
There is further evidence from long-term observations of the perennial

46 GIWA REGIONAL ASSESSMENT 24 ARAL SEA
permafrost in Zailiyskiy Alatau. According to this data, the temperature
of the top layer of the perennial permafrost increased steadily during
the 1970 and 1980s and has stabilised since the mid-1990s.
If glaciers continue to reduce in area and volume at the current rate, it
can be assumed that by the middle of the 21st century the glaciers on
the mountains of Central Asia will reduce by only one third and will
not disappear by the end of the century as was previously expected
(Cherkasov 2002, Dikih 2001, Glazirin 1996, Golodkovskaya 1982, Vilesov
& Uvarov 2001). Taking into account the recurrence of the climatic cycles
over the last 100 years in the region, there may be more favourable
climatic conditions for glaciation in the future.
Changes in glaciation were confi rmed by the results of the comparative
analysis of photogrammetric surveys of the glaciers in the Small
Almatinka River Basin carried out by German experts between 1958 and
1998. The thickness of ice on each glacier has been signifi cantly reduced
over most of their extent. For 40 years the thickness of the bottom layer
of the Tuyuksu tang glacier, for example, has decreased by more than
45 m, and total losses of ice amounts to more than 40 million m3 (Eber
et al. 2005). A reduction in the thickness of the buried parts of glaciers
is also typical.
Similarly, on the majority of the area of a zone of a feed of glaciers the
mass balance of ice for the specifi ed period was close to zero (changes
have made from - 5 up to 5 m). Moreover, according to a survey of 1998
in a zone of a feed of all glaciers signifi cant sites on the area where the
mass balance for the specifi ed period appeared positive. The common
increment of thickness of ice (fi rn) in a zone of a feed of Tuyuksu glacier
has made 15-25 m. Last circumstance in a combination to stability
of norms of an atmospheric precipitation gives the basis to assume
probability of forthcoming change of a sign on mass balance of glaciers
with negative on positive.
The fact that despite a considerable reduction in glacier resources the
fl ow rates of the main rivers have practically not changed in recent
decades suggests that there is some compensating mechanism. One
explanation is that water from the melting of underground ice has
accumulated as perennial permafrost. The area covered by perennial
permafrost in Central Asia is many times greater than the area of present-
day glaciers (Gorbunov & Severskiy 1998, Gorbunov et al. 1997). Therefore
even slight melting of the permafrost could compensate for the loss of
water caused by the reduction in the region’s glaciers. Until now this has
not been considered by the scientifi c community and deserves further
attention given the importance of freshwater availability on the ecology
and socio-economic development of the region.
There are at least two pieces of evidence that suggest such a mechanism
exists. According to the results of long-term geocryological studies
carried out at the Zhusalykezen Pass (Northern Tien Shan, Zailiiskiy Alatau
Range) between 1973 and 1996, the temperature of frozen grounds has
increased signifi cantly. Although there have been signifi cant inter-annual
fl uctuations, in Northern Tien Shan there have been general trends of
rising annual ground temperatures, increased depths of thawing and
decreases in the thickness of the seasonally frozen layer (Gorbunov et
al. 1997). The ground depth of seasonal thawing, measured in boreholes
at the Zhusalykezen Pass, increased by over 1.1 m between 1973 and
1996 (Gorbunov et al. 1997). Thus, for the specifi ed period melt waters
from a 1.1 m thick layer of recently frozen ground may have contributed
freshwater to the run-off in the Aral Sea Basin.
Isotope analysis used to study the genesis of water resources also gave
evidence of a compensatory mechanism. According to the results of
the study, 40-50% of water, and in some cases all of the water, in the
lake-dam complexes of alpine areas of Kyrgyzstan (Top-Karagai, Tuyuk-
Tor, Kashka-Suu) are comprised of melt-water from buried moraine ice
(Tuzova 2002).
Socio-economic impactsSince the 1960s, climatic variations have changed the community
structure of fl ora and fauna in the region. A reduction in the biodiversity
and quality of freshwater has been caused by increasing salinity. The
greater aridity of the territory surrounding the Aral Sea has reduced
agro-productivity and resulted in the loss of ecosystem services.
Consequently, the employment structure has changed and there are
fewer investment opportunities.
There is not suffi cient evidence to suggest that global climate changes
are responsible for all these impacts. There is no doubt that the primary
factor responsible for the acute aggravation of the ecological and socio-
economic situation in the Aral Sea Basin is freshwater shortage as a
result of the modifi cation of stream fl ow rather than a consequence of
global climate changes.
There is no proof to suggest that there is a link between global changes
and the health status of the region’s population. There is cause to hope
that the present upward trend in average annual air temperatures may
start to reduce during this century and consequently improve the
environmental conditions of the region.
Conclusion and future outlookThe impacts from the concern of global changes were assessed as
slight. Present-day warming refl ects a cyclic trend in the climate and

ASSESSMENT 47
the role of the anthropogenic component in this process is not believed
to be as signifi cant as often diagnosed. Hence, there is not enough
evidence to rely on the predicted warming of between 2 and 6°C in
the next few decades.
The conclusions diff er considerably from contemporary and prognosis
changes of climate and renewable water resources. Contrary to the
established estimations which state that due to global warming,
regional water resources will reduce by 20-40% in the near future (Chub
2000, SPECA 2004), there are grounds to argue that the volumes of river
run-off will remain stable, at least over the next few decades.
Gradual air temperature increases are believed to be attributable to
natural climatic changes. The glacier resources in the mountainous
countries of Central Asia have reduced by more than one third
during the last 30-35 years. Scientifi c explorations confi rm that glacier
resources in the Tien Shan Mountains have reduced over the past
30-40 years; by 0.92% in area and by 1% in volume annually (Severskiy
& Tokmagambtov 2004). Experts predict that this process will continue
for at least 100 years (Cherkasov 2002).
For the past 40 years the maximum snow storage (snow-water
equivalent) volume has remained constant and the volume of river
run-off has not changed signifi cantly. The reduction in the area of
glaciers has changed the inter-annual distribution of run-off , as it now
contributes slightly less run-off during the vegetation period.
Despite a considerable reduction in glacier resources, the fl ow rates
of the main rivers have remained relatively constant over the last
few decades. One possibility for this could be that water infl ow from
underground melted ice accumulated in the perennial permafrost,
which is now melting and contributing freshwater to the region’s rivers.
Until now this issue has not received scientifi c attention, but taking
into account the extreme importance of probable changes in water
resources as a reaction to climate changes, this aspect of the problem
deserves particular consideration.
It has been forecasted that a signifi cant diminution of water resources
over the next few decades due to anthropogenic caused warming of
the climate is unlikely. There are insuffi cient reasons to fear signifi cant
climate warming, a corresponding reduction in water resources or
consequential economic losses.
Though this optimistic conclusion gives us the opportunity to predict
the development of the situation in the near future, it does not make the
problem less acute: water shortage in the region is one of the limiting
factors of sustainable development. However, the water shortages
are a result of the diversion of water for human activities rather than
a reduction in the supply of freshwater resources. The transboundary
nature of these regional water resources is one of the main premises for
the development of international processes in Central Asia.
Priority concerns for further analysis
The GIWA concerns were prioritised in the following order:
1. Freshwater shortage
2 Pollution
3. Habitat and community modifi cation
4. Global change
5. Unsustainlable exploitation of fi sh
Considering the above impacts, the GIWA experts concluded that
freshwater shortage was the priority issue in the Aral Sea region, as
it is driving the other environmental issues facing the region. The
priority issue of freshwater shortage was identifi ed as the modifi cation
of stream fl ow, which by GIWA Task Team estimations accounts for
approximately 70% of the development of the concern. The second
most important issue for the region is pollution of existing supplies,
which, it is estimated, accounts for 30% of the development of the
situation in the region.
There has been an abrupt decrease in the natural run-off of the largest
rivers in the region - the Amudarya and Syrdarya - which resulted
in the rapid drying up of the Aral Sea. This has led to severe habitat
modifi cation including deterioration of the landscape, intensive
desertifi cation, secondary soil salinisation, an increase in the extent of
climate continentality and more frequent recurrence of droughts and
dust storms. The above processes caused severe degradation of both
water and land ecosystems and a reduction in biodiversity. The impacts
are most pronounced in the Priaralye zone.
48 GIWA REGIONAL ASSESSMENT 24 ARAL SEA
Causal chain analysis
This section aims to identify the root causes of the environmental
and socio-economic impacts resulting from those issues and
concerns that were prioritised during the assessment, so that
appropriate policy interventions can be developed and focused
where they will yield the greatest benefi ts for the region. In order
to achieve this aim, the analysis involves a step-by-step process
that identifi es the most important causal links between the
environmental and socio-economic impacts, their immediate
causes, the human activities and economic sectors responsible
and, fi nally, the root causes that determine the behaviour of those
sectors. The GIWA Causal chain analysis also recognises that,
within each region, there is often enormous variation in capacity
and great social, cultural, political and environmental diversity.
In order to ensure that the fi nal outcomes of the GIWA are viable
options for future remediation, the Causal chain analyses of the
GIWA adopt relatively simple and practical analytical models and
focus on specifi c sites within the region. For further details on the
methodology, please refer to the GIWA methodology chapter.
Introduction
Freshwater shortage was selected as the priority concern for the Aral
Sea region. The focus of the Causal chain analysis (CCA) is to determine
the root causes of freshwater shortage in the region and, specifi cally,
the prioritised GIWA issue of stream fl ow modifi cation, so that the
driving forces of the issues can be addressed by policy makers. The
Causal chain analysis traces the cause-eff ect pathways associated
with the freshwater shortage concern in the Aral Sea Basin from the
socio-economic and environmental impacts back to the root causes.
The analysis will consider the entire Aral Sea region due to the spatial
scale of the region’s freshwater shortage concern and the necessity to
manage water resources at the regional level.
Causal chain analysis
Environmental and socio-economic impactsFor further detail of environmental and socio-economic impacts,
please refer to the concerns of freshwater shortage and habitat and
community modifi cation in the Assessment section.
Environmental impacts include the following:
By the year 2000 the discharge of the Amudarya had reduced
almost ten-fold compared with 1970. As a result, less than 10% of
the total area of delta lakes in the Amudarya lower reaches remains
(Olimov 2001).
The area of the Aral Sea has reduced more than two-fold and there
has been a sharp decrease in sea level (by mid-2002 the Big Sea had
decreased by 22 m).
The salinity of the Sea’s waters has tripled, killing plant and animal
life.
Summer and winter temperatures have become more extreme.
A severe reduction in biodiversity and a greater concentration of
pollution in surface and groundwater supplies.
The total area of lakes in the Amudarya delta reduced from 300 000
to 30 000 ha and water mineralisation increased to 20-25 g/l, which
resulted in an abrupt reduction in fi sh and animal reproduction.
Between 1970 and 1999 the area of tugay forests in the Amudarya
delta reduced ten times from 300 000 to 30 000 ha (Bakhiev &
Treshkin 2002).
Change in the taxonomic composition of aquatic ecosystems from
brackish water species to more salt-tolerant species.

CAUSAL CHAIN ANALYSIS 49
Socio-economic impacts include the following:
The collapse of a previously well-developed fi shery and fi sh
processing industries.
Industrial development is hindered by the lack and poor quality of
freshwater.
In the Aral coastal zone economic activity has ceased, also aff ecting
inland industries.
Unemployment has continuously increased.
Loss and decreased productivity of agricultural and pasture land.
Epidemiological conditions have deteriorated in the region
resulting in greater morbidity.
As the Aral Sea recedes, it leaves behind a harmful layer of
chemical pesticides and natural salts which are blown by the
wind into noxious dust storms, seriously aff ecting the health of the
inhabitants of the area.
An estimated 100 000 people have been displaced due to the poor
environmental conditions in the Aral Sea region.
Immediate causesAccording to GIWA experts, the following are the immediate causes of
the modifi cation of stream fl ow:
Increased diversion;
Reduction in ice resources;
Inter-annual climate variability.
Increased diversion
The increased diversion of water to supply irrigated agriculture is the
primary reason for the change in the regime of the region’s major rivers.
Between 1960 and 2000 the area of irrigated land increased almost two-
fold, from 4.51 million ha to 7.85 million ha. Consequently, by the early
1980s total water intake from the Aral Sea Basin exceeded available
water resources, with over 120 km3 abstracted per year (Kipshakbaev &
Sokolov 2002).
Today, there is an annual shortfall of water resources of approximately
17.0 km3/year, and if the use of return waters is included the volume of
consumed water resources actually exceeds available supplies; in the
Syrdarya Basin 130-150% of available water resources are used and in the
Amudarya Basin, 100-110% (Kipshakbayev & Sokolov 2002). Taking into
account inter-annual run-off variability, an estimated 50-60% of surface
run-off is a threshold volume in order to sustain current water use in
the region. Water availability is at a critical level in all of the countries in
the region, and they are highly dependent on climatic fl uctuations to
meet water demand (Rodina 2002). Irrigated land in the Aral Sea region
is expected to increase in the immediate future and by 2020 could reach
an estimated 8.4 million hа (Ruziev & Prichodko 2002). Thus, natural
run-off resources in the Aral Sea region are fully exhausted and the
economy of the region is developing under conditions of increasing
water shortage.
The natural run-off regime has only been preserved within the
run-off formation zone in the mountains. Further downstream the
rivers become increasingly regulated due to water requirements by
economic activities. Changes in water run-off have resulted from the
construction of numerous water reservoirs for irrigation and power-
generation. There are more than 100 water reservoirs with a total
capacity of over 74 km3 in the Aral Sea Basin and numerous ponds and
small capacity water reservoirs. The largest are the Tokhtogul reservoir
on the Naryn River, with a capacity of 19.5 km3, Nurek reservoir on the
Vakhsh River (10.5 km3), Tuyamujun on the Amudarya River (7.3 km3)
and Charvak reservoir on the Syrdarya River (5.2 km3). More recently
there has been a switch in the function of the main water reservoirs in
Kyrgyzstan and Tajikistan from irrigation to power generation, further
altering the regime of the Amudarya and Syrdarya rivers.
Reduction in ice resources
During the last century the extent of glaciation declined on the
Central Asian mountains (Pamir, Tien Shan, Gissaro-Alai, Dzhunghar
Alatau). Between the 1950s and 1980s, the average annual rate of
glacier retreat was approximately 0.9%, and the ice volume of glaciers
reduced by more than a third. Contrary to expectations, this has not
essentially aff ected the run-off characteristics of the main rivers in the
region: the average run-off and its inter-annual fl uctuations over the last
40-50 years have practically remained constant.
Observations of the Tuyuksu glacier (Northern Tien Shan) has shown
that the proportion of thawed glacial waters in the total river run-off
has gradually reduced, owing to the reduction in the area of glaciers.
During the period of glacier retreat there was an increase in melt waters
due to the increased thawing of ice in response to a warmer climate. The
additional melt water was not enough to compensate for the reduction
in glacial run-off due to the decline in the area of glaciers (Vilesov &
Uvarov 2001). The dominant factor controlling the amount of glacial
run-off was therefore found to be the reduction in glacier area rather
than changes in glacial run-off caused by global warming.
The fact that despite the considerable reduction in glacial resources
the fl ow rates of the main rivers have not altered signifi cantly in recent
decades suggests a compensating mechanism exists. It is believed
that an infl ow of freshwater from the melt-water of underground
ice accumulates in the perennial permafrost. The area of perennial
permafrost is many times greater than the area of present-day glaciers

50 GIWA REGIONAL ASSESSMENT 24 ARAL SEA
(Gorbunov et al. 1997, Gorbonov & Severskiy 1998), and therefore even
a slight melting of the permafrost could compensate for the reduction
in freshwater supply caused by the decline in the area of glaciers. As
the area of perennial permafrost repeatedly exceeds the area of modern
glaciation, and stocks of underground ice are comparable to the volume
of glacial ice of glaciers, it is possible that even if the majority of glaciers
disappear, it may not aff ect the availability of regional water resources,
at least not in the forthcoming decades. This has not been adequately
studied by the scientifi c community and is particularly important when
considering the infl uence of climate changes on freshwater resources,
particularly if average temperatures increase in the future.
Inter-annual climatic variability
Fluctuations in climatic conditions cause annual water resources to
vary considerably. The Syrdarya River Basin has approximately 23.6 km3
(63% of the average run-off ) of water resources in scarce water years
and 51.1 km3 (137%) in abundant years. In the Amudarya River Basin
annual water resources range from 58.6 km3 (74%) to 109.6 km3 (138%).
Thus, in the Syrdarya River Basin there is essentially a more critical water
situation; available freshwater resources in dry years are 37% below the
long-term average, compared to 24% in the Amudarya River Basin.
Irrigated agriculture in Uzbekistan, Turkmenistan and Kazakhstan is
particularly aff ected by the water shortages. In extremely dry years
there are severe economic losses. For example, in the year 2000 irrigated
agriculture suff ered economic losses of 77 million USD in Turkmenistan
and 187 million USD in Uzbekistan (Sorokin 2002).
Root causesDemographic
Increases in population have led to greater pressure on the natural
resources of the Aral Sea Basin, including the water resources. The
annual population growth rate is over 3%.
Economic
Collapse of Soviet economic mechanisms
Since the early 1990s the disintegration of the USSR and the pursuing
collapse of its integrated economic system, the catastrophic decline
in the economy of the countries of the region and associated social
upheavals, for example the civil war in Tajikistan and confl icts in
Uzbekistan and Kyrgyzstan, have not favoured regional cooperation
and the equitable sharing of transboundary water resources.
Figure 10 Peaks rising from a glacier in the Pamirs, Tajikistan.(Photo: CORBIS)

CAUSAL CHAIN ANALYSIS 51
The transition to a market economy was accompanied by an economic
crisis in the region’s agricultural sector and the collapse of economically
powerful agricultural cooperatives. A subsequent lack of investment in
agriculture has led to the deterioration of agricultural machinery, and
irrigation and other water infrastructure. This has caused a decline in the
water effi ciency of irrigated farming and agricultural production. The
productivity of irrigated farming decreased from 1 600-2 000 USD to
500-900 USD per ha and the effi ciency of using 1 m3 of irrigation water
decreased from 0.18-0.25 USD to 0.03-0.10 USD (Duchovny 2002a&b).
Furthermore, the introduction of water saving technology has been
impeded by the economic downtown in the agricultural sector.
Despite eff orts by the governments of the region and the international
community this situation remains problematic.
Lack of economic incentives
There is a lack of economic mechanisms aimed at regulating water use,
particularly in irrigated farming, which is a major obstacle in improving
water resource management at all levels, local to regional. There
are no economic incentives to conserve water resources. Currently
irrigation farmers do not pay for the water they apply to their fi elds
and consequently there is no incentive for them to employ irrigation
systems that are more water effi cient.
A joint approach to economically evaluating river water is absent
in the region. There is no uniform understanding of even the most
fundamental economic principles of river fl ow regulation, let alone
questions of water pricing (Petrov & Leonidova 2003).
Overdependence on the agricultural sector
Agriculture, and more specifi cally irrigated farming, constitutes the
largest proportion of GNP in Uzbekistan, Turkmenistan and Tajikistan.
Development in most countries of the region is determined by the
economic success of irrigated farming. Due to a long recession in the
agricultural sector following the collapse of the Soviet Union, in the
1990s the governments of the region supported farmers through special
programs. Productivity subsequently increased, especially in Kazakhstan,
Uzbekistan and Turkmenistan, but the fundamental problems regarding
the management of the region’s water resources were not resolved.
Legal
Weak legislation
There is a lack of a clearly formulated and mutually accepted legislative
framework for inter-state use of water resources. There is subsequently
opposing national legislation which impedes regional cooperation
in the management of water resources. The highly ineffi cient use of
water by irrigated farming and unauthorised water diversion has been
attributed, in part, to the weak legislative and regulatory system in the
region. The absence of regulations governing the use of return water
in irrigated farming has resulted in negative consequences, such as the
salinisation of agricultural fi elds and a reduction in productivity.
Water rights
The current water legislation is in need of revision as it was formulated
during the Soviet period and is inappropriate for present-day conditions.
Countries abstracting the most water resources insist on maintaining
the quotas established in the Soviet era and claim transboundary waters
to be common property, whereas countries in the run-off formation
zone, namely Kyrgyzstan and Tajikistan, argue that the quotas are
unfair and demand payment for water which fl ows to the countries
located downstream, which is categorically refused by Uzbekistan and
Kazakhstan (SPECA 2004, Mazakhirov 2003, Babaev 2003). Uzbekistan
maintains that, to achieve an equitable distribution, water resources
should be allocated per capita. The other countries disagree with
this proposal, especially Kyrgyzstan and Tajikistan. There are also
discrepancies between countries on the joint usage of interstate
facilities, such as power generation stations which were constructed
in the Soviet era (Mambetov 2003, SPECA 2004).
There is no common legal approach among the countries of the region
towards the allocation of transboundary water resources, though there
is a general opinion that all actions concerning the use of regional water
resources are to be based on the statement that it is necessary to keep
the existing system concerning use of regional water resources, including
quotas on water (Dzhalalov 2003). But it has been demonstrated
worldwide that, even in areas with very high average precipitation rates,
relations between countries concerning the sharing of transboundary
water resources can be problematic (Petrov & Leonidiva 2003).
An alternative principle governing the rights of any state over the use
of hydropower resources and its aff ect on other states is as follows: “A
sovereign state has the right to establish any regime of river run-off
regulation in accordance with its national interests on the territory of
its water reservoirs. If the regime aff ects or contradicts the interests of
any other state, the state-owner is obliged to change the regime in
favour of the aff ected state and provide corresponding compensation”
(Petrov & Leonidiva 2003).
Governance
Lack of integrated water management
The collapse of the Soviet Union required the reliance of the new
independent states on their own resources for economic development.

52 GIWA REGIONAL ASSESSMENT 24 ARAL SEA
Naturally, this has resulted in diff ering development strategies and rates
of economic growth in the countries of the region. The governments
also re-evaluated former priorities, including those for the management
of water resources. States in the zone of run-off formation (e.g. Tajikistan
and Kyrgyzstan) found it more economically attractive to use water
resources for hydroelectricity generation (including export) rather than
irrigated farming which had limited expansion prospects due the relief
of the area (Duchovny 2002a&b, Sokolov 2001). Water use strategies
have consequently diverged and cooperation between the various
national water management institutions has become problematic.
Despite declarations by regional governments to coordinate water
policies, there remains a tendency to take unilateral decisions and
actions favouring national, rather than regional, interests. ICG experts
have stated “the problems of coordination of water and energy
resources in the Central Asian region as a current source of tension
are so important that they can be considered only less important than
Islamic extremism” and the “struggle for water resources will become
more intensive unless more eff ective mechanisms to solve the problems
are not created” (ICG 2002).
The decision to create a water-power generation consortium was made
by the presidents of all Central Asian countries in 1997 and confi rmed in
July, 2003. Unfortunately, despite fi ve years of eff orts, there has been no
success in establishing the consortium (Koimdodov 2003).
The regulations governing interstate water management are
unsystematic, poorly coordinated, and often contradictory, impeding
the implementation of water management systems (Petrov & Leonidiva
2003).
This situation, combined with unilateral and uncoordinated decisions
and actions, is leading to signifi cant changes in the hydrological
regime of the region’s transboundary rivers, thus demonstrating the
ineff ectiveness of the current system of interstate water allocation. This
has led to complications in international relations in the region.
Expansion of irrigated farming
Despite the fact that the majority of regional water resources (more than
90%) are used for irrigated farming, particularly for the production of
water intensive crops, such as cotton and rice, practically all countries in
the region intend to increase their irrigated areas. Tajikistan is planning
to increase its irrigated area by 700 000 ha in the near future, which will
require an additional annual intake of more than 9 km3 of water from
the Amudarya River. Moreover, Tajikistan, following the construction of
the Ragun water reservoir with a capacity of 10 km3, intends to construct
the Sangtudin reservoir and several other water reservoirs which will
be mainly used for power generation (ICG 2002, Rakhmonov 2003).
Turkmenistan also plans to increase its irrigated areas by 450 000 ha
and create a lake with a volume of 5-6 km3 in the Karakum desert called
“Lake of the Gold Century”. It plans to use the accumulated drainage
water to irrigate between 700 000 and 1 million ha of desert pastures.
According to estimates made by Uzbek experts, the maintenance of
this lake will necessitate an additional intake of approximately 13.5 km3
of Amudarya river water (ICG 2002). There are plans in Uzbekistan to
construct 15 hydroelectric power stations and a long-term vision to
construct a further 140 (ICWC 2004).
Inadequate and confl icting water use strategies
Inadequate political strategies have developed a water-dependent
regional economy which is reliant on irrigated farming and the
production of water intensive crops, i.e. cotton and rice. The confl ict
of interests regarding the use of water resources by the irrigation and
power generation industries has not yet been resolved. At present,
interrelations between these activities are regulated by the Syrdarya
agreement of 17th March, 1998, which runs counter to the interests of
the upstream countries (Petrov & Leonidova 2003).
Power resources were previously guaranteed to Krygyzstan and
Tajikistan, but since the collapse of the USSR deliveries are only possible
through interstate agreements, which are often not fully implemented.
The discontinuation of power resources to Kyrgyzstan and Tajikistan
and additional economic diffi culties forced the governments of
these countries to convert the Tokhtogul and Nurek reservoirs from
irrigation to power generation. This action dramatically changed the
hydrodynamics of the major rivers in the region, the Amudarya and
Syrdarya, resulting in signifi cant economic losses to the agricultural
sector in Uzbekistan and Kazakhstan. This stimulated diffi cult interstate
negotiations and agreements between the relevant nations.
The hydroelectric power stations operate at maximum capacity during
the winter, when demand for electricity is greatest. Therefore, a greater
volume of water is released during the winter from the reservoirs,
resulting in a defi ciency of water for irrigated agriculture during warmer
periods of the year. This change in water use policy has resulted in the
ineffi cient use of water resources, the degradation of downstream
ecosystems, and dangerously high water levels in the lower reaches of
the Syrdarya in the winter.
Despite annual agreements between the upstream and downstream
nations regarding the release of water from the hydropower reservoirs
on the Naryn-Syrdarya cascade, communities in Kyzylorda oblast

CAUSAL CHAIN ANALYSIS 53
in Kazakhstan are threatened by fl oods practically every year. This
has necessitated regular consultations and negotiations between
representatives and heads of the relevant states. For example, the
release of water to the Arnasays’ hollow was only increased when in
the winter of 2004/2005 concern over the safety of the dam of the
Shardara water reservoir was raised and there was intervention by the
heads of the states of Kazakhstan and Uzbekistan.
There are plans for the further development of hydropower engineering
in Tajikistan and Kyrgyzstan. Future projects include the construction of
the Kambaratin hydropower station in Kyrghyzstan and the Sangtudin
and Ragun hydroelectric power stations in Tajikistan. Kyrgyzstan
plans to supply electricity to the CIS countries and Pakistan, and
Tajikistan to Iran and other neighbouring countries. It is feared that the
construction of new water reservoirs will further aggravate the confl ict
between the interests of hydropower and irrigation. At the same time,
the introduction of new power capacities can promote economic
integration between the countries of region and stimulate industrial
growth, and subsequently reduce the dependence of the economy on
water-intensive irrigated farming.
Following the collapse of the USSR, the countries on whose territory
the headwaters originated became responsible for the maintenance
of water distribution systems, including the large water reservoirs and
channels. Tajikistan and Kyrgyzstan insist on shared participation in the
funding of these systems.
Lack of compliance with inter-governmental agreements
The sharing of the regions transboundary water resources has become
the subject of increasing interstate negotiations. Approximately 30
interstate agreements were negotiated concerning the distribution
of the Amudarya River water. Unfortunately, political agreements have
been diffi cult to implement in practice and are frequently disregarded.
For example, an agreement between Kazakhstan, Kyrgyzstan and
Uzbekistan on water discharges from the Tokhtagul and Shardarya
reservoirs in the Syrdarya Basin was impractical. Winter fl oods in the
lower reaches of the Syrdarya in November to January, 2003-2004
destroyed water regulatory structures and fl ooded some settlements in
Kyzylorda oblast in Kazakhstan. In the post-Soviet period, an agreement
was made to consider the Aral Sea as an independent (along with the
states of the region) consumer of water resources. However, river
discharges to the Sea were below the stipulated volume and in some
years there was no infl ow at all.
Afghanistan only utilises 10 km3 of a total 19 km3 of the Pyandzh run-off
it was allocated in the agreement signed by Afghanistan and the USSR in
1946. If Afghanistan fulfi ls its quota, there will be considerable changes
in the Amudarya run-off (ICG 2002).
Kazakhstan was the only Central Asian country to participate in the 1992
Helsinki water convention and the 1997 Convention on non-navigable
river usage. Some items of the legislation of the countries contradict
clauses of the above conventions. The national legislation of each of the
Central Asian countries diff er considerably and requires coordination,
especially regarding transboundary river fl ows (Koimdodov 2003).
Approval of the Kyzylorda declaration of March 1993 required that all
Central Asian states: recognise the system of regulation; improve water
use discipline in the basin; develop corresponding interstate legal and
normative documents envisaging regional principles of reimbursement
of losses and damages as common problems for the region. However,
practical results to these problems are yet to be seen, and only
theoretical plans in the form of reports, presentations and proposals
exist, which do not always correspond to each other in either content
or principles (Ashirbekov & Zonn 2003).
The countries of the region have only succeeded in signing one
agreement on the regulation of hydropower generation, the 1998
Bishkek agreement on the use of hydropower resources of the Syrdarya,
with alterations and amendments according to the protocol of June
1999. A similar agreement on the Amudarya, which was prepared by
Tajikistan in 1988 and presented to all other republics, has not yet been
considered. Other regional agreements on water resources used for
power generation including those prepared by SRC ICWC have also not
been signed. The main agreements are:
Agreement on the development of cooperation and diff erentiation of
the functions of interstate organisations in protection, management
and development of water resources in the Aral Sea Basin (1996);
Agreement on joint usage of transboundary water resources
(1996);
Agreement on the organisational structure of joint control,
protection and development of water resources in the Aral Sea
Basin (1997);
Agreement on cooperation in the joint usage of water objects,
water resources and water facilities (1998);
Agreement on information exchange and the creation of the Aral
Sea Basin database on the transboundary water resources of the
Aral Sea (1999).
Thus even the preparation and signing of joint agreements remains
a contentious issue. Signed agreements often remain unfulfi lled.
In particular, Kazakhstan does not adhere to the agreement on the

54 GIWA REGIONAL ASSESSMENT 24 ARAL SEA
Syrdarya regarding the mutual payment for changes in the operational
regime of Kayrakkum water reservoir. Agreed quotas of electricity
are supplied to Tajikistan by Uzbekistan, with some deviations from
the agreement. In addition, Kazakhstan and Uzbekistan disregard
their obligations stipulated by the agreement by not compensating
Kyrgyzstan (Petrov & Leonodova 2003).
Inappropriate international support
The international community has inadequately contributed to solving
the problems of the region (Mambetov 2003). Up to 50% of the projects
initiated by donor countries have failed (Duchovny 2002a&b). The
countries of the region doubt the effi ciency of foreign participation on
account of the following reasons:
Predisposition of donor countries to adopt technical solutions,
which often do not achieve their aims because they are not
supported by legislative and political policies (ICG 2002);
Irrational use of project funds;
Incompetence of offi cial decision making;
Inadequately funded fi nancing systems for research by the State
Budget and donor funds;
Insuffi cient use of local scientifi c resources in solving regional
problems;
Inappropriate foreign specialists employed by international projects
who often lack an interest in the fi nal results and have insuffi cient
knowledge of local conditions.
Knowledge
Literacy in the former Soviet Union countries of Central Asia is among
the highest in the world. Scientifi c human resources are of a high
standard and infrastructure, such as laboratories, is well maintained.
However, there is an extensive ‘brain-drain’ to other economic activities
and countries. There are a limited number of young scientists, and
institutions can only survive with foreign contracts (UNESCO 2000).
Greater investment in the scientifi c capacity of the region may enable
constructive solutions to the ecological and social problems.
There is a lack of knowledge regarding the natural dynamics of the region,
particularly in the run-off formation zone, which is fundamental to solving
the region’s problems. The last estimation of total water resources was
made 40 years ago. Since then, considerable changes have occurred in
the run-off formation zone, including the depletion of glaciers, which
have undoubtedly aff ected conditions of run-off formation.
The region lacks a common system for the collection and processing
of real data on the hydrometeorological regime of the region and the
water resources used. Such a system ceased operating following the
collapse of the USSR and the newly independent states now have
limited access to the monitoring data of the other nations in the region.
Information offi cially presented by the countries of the region to form
regional databases by the ICWC is limited and unreliable regarding the
use of water resources (Ginijatullin 2002a&b, SPECA 2004).
Scientifi c investigations in the mountainous areas of the region through
regular expeditions and mountain monitoring stations ceased with the
collapse of the USSR. Moreover, at the planning stage of most water
projects, changes in the hydrological regime of mountain territories are
often not considered at all or out-of-date information on water resources
is used, thus the real situation becomes less reliable every year.
The monitoring of the climatically-driven dynamics of the high-
mountain belt glaciosphere (which includes glaciers, snow fi elds,
ice mounds, snow cover, and underground ices above 3000-3200 m
above sea level) deserves particular attention. It constitutes the region’s
glaciers and the majority of underground ice and snow resources, and
therefore the main sources of renewable water resources. Unfortunately,
the region’s glaciosphere has not been comprehensively investigated.
An inadequate capacity to predict future water resource dynamics is
resulting in poorly planned water use strategies. The current defi cit
in appropriate scientifi c studies has resulted in policy-makers lacking
reliable information to make informed decisions regarding the
conservation and allocation of water resources. However, warnings
by scientists of environmental impacts were not heeded, when the
governments decided to increase irrigated areas in the Aral Sea Basin
(Glazovsky 1995).
Technology
The irrigation canals are highly outmoded and ineffi cient, resulting in
the unproductive use of the region’s scarce water resources; up to 50%
of irrigation water is lost before reaching the fi elds (Ginijatullin 2002a & b,
Glazovsky 1995). During the economic recession of the post-Soviet
period water infrastructure was not suffi ciently maintained. Following
the collapse of collective farming (kolkhozes and sovkhozes) many
irrigation canals which connected the various farms were not privatised
and were poorly maintained. This is considered as one of the primary
obstacles to a large scale introduction of modern irrigation techniques
in the region. During this period hydraulic structures, water-distributing
systems, and hydrological monitoring stations deteriorated.
Today, farmers lack the investment to update or adopt water saving
technologies in irrigated farming. Large-scale reconstruction of irrigation
systems is vital but not feasible due to economic constraints and the lack

CAUSAL CHAIN ANALYSIS 55
of technical human resources. In addition, there is a lack of awareness
about the benefi ts of employing water effi cient technologies.
Climate change
The problem of freshwater shortage may become even more acute over
the next few decades if, as is predicted, water resources in the region’s
major river basins reduce by 20-40% (Chub 2000, SPECA 2004). Such
a reduction in water resources will have severe ecological and socio-
economic consequences unless drastic measures are taken to reduce
the region’s water requirements.
However, some predictions show that anthropogenic induced climate
changes may play a less signifi cant role than was previously thought;
estimations of a 2-4°C rise in temperature in the near future cannot
be relied upon (Severskiy 1999a&b, Kondratyev & Demchenko 1999,
Kondratyev et al. 2001). The fact that run-off volumes have remained
stable despite considerable reductions in glacier resources suggests the
existence of a compensating mechanism in the formation of run-off .
Such a mechanism may become increasingly active as underground ice
melts as the result of a warmer climate and accumulates as permafrost.
Conclusions
The Causal chain analysis indicated the root causes that are driving the
Freshwater shortage concern (Figure 11). According to GIWA experts,
the majority of the root causes stem from the inadequate legislation
that regulates water management. The transboundary nature of the
major watershed basins in the region makes it impossible to solve the
problems of rational water use without inter-state agreements. Many of
the agreements made to date have not been implemented or are not
strictly adhered to by the countries of the region.
The transboundary water management system is inadequate as it
is based on the principles of centralised regulation formed in the
Soviet period. There is a lack of clearly formulated water strategies in
the countries of the region and the absence of a mutually acceptable
legislative framework for interstate sharing of transboundary water
resources.
The lack of knowledge regarding the dynamics of the region’s water
resources, primarily in the run-off formation zone, is severely hindering
the capacity of policy makers to resolve the issues. Water resources
are not being utilised effi ciently due to the employment by irrigated
agriculture of outmoded technology. Irrigation canals are ineffi cient and
there is limited technical capacity in the region necessary to renovate
or construct a new irrigation system. Economic constraints and the lack
of economic incentives for farmers to save water are preventing the
adoption of water saving technologies.
IssueImpacts Immediate causes Sectors/Activities Root causes
Environmental:- Reduction of river discharge- Reduction of Aral Sea area
and sea level- Increased salinity- Reduction of biodiversity and
changes in species composition- Reduction of forest area
Socio-economic:- Collapse of fisheries- Industrial development is
hindered- Increased unemployment- Loss and decreased productivity
of agricultural land- Increased risk for epidemics- Displacement of people
Stream flow modification
Increased diversion
Decreased ice sources
Climate variability
Agriculture
Domestic water supply
Water allocation mechanisms
Demographic
Economic
Legal
Governance
Knowledge
Technology
Climate change
Figure 11 Causal chain analysis model for the Aral Sea region.

56 GIWA REGIONAL ASSESSMENT 24 ARAL SEA
Policy options
This section aims to identify feasible policy options that target
key components identifi ed in the Causal chain analysis in order to
minimise future impacts on the transboundary aquatic environment.
Recommended policy options were identifi ed through a pragmatic
process that evaluated a wide range of potential policy options
proposed by regional experts and key political actors according
to a number of criteria that were appropriate for the institutional
context, such as political and social acceptability, costs and benefi ts
and capacity for implementation. The policy options presented in
the report require additional detailed analysis that is beyond the
scope of the GIWA and, as a consequence, they are not formal
recommendations to governments but rather contributions to
broader policy processes in the region.
Definition of the problem
The situation in the sphere of water management remains both
regionally and locally contentious. There is no regionally accepted
water strategy or eff ective regional agreements to provide a regulatory
framework for the allocation and conservation of river water. The current
interstate status of regional water resources and water management
infrastructure has not been defi ned (Mambetov 2003, Nazirov 2003,
Nurushev 2003).
Despite considerable eff orts by the governments of the region and the
international community, the freshwater shortage situation remains
critical and is adversely aff ecting the socio-economic development
(ICG 2002) and ecological integrity of the Aral Sea region.
Following the breakdown of the Soviet Union, the fi ve Aral Sea Basin
states (excluding Iran and Afghanistan) came to an agreement on the
principles of water sharing and in 1992 established the Interstate Water
Commission, ICWC. The results of the Commission’s activities and
recommendations formed the basis of numerous interstate agreements
on the use of water resources, including 25 agreements on joint usage
and annual agreements on joint usage of the Syrdarya resources for
power generation.
International organisations have attempted to resolve the regional
problems, primarily those concerning water. Projects executed/
sponsored by the World Bank, UNEP, UNESCO, UNDP as well as a
number of research and applied projects funded by INTAS, NATO,
TACIS, INCO-COPERNICUS, MACCARTUR have contributed to the
understanding of the situation in the region, suggested solutions,
and implemented projects with an aim of achieving sustainable
development. However, the countries of the region have expressed
doubt towards the effi ciency of foreign participation, as outlined in
the Causal chain analysis.
The actual situation in the region was far more severe than was
fi rst envisaged by the region’s governments and the international
community. Consequently, much of what was planned in the
region has not been fulfi lled: approximately half the projects
which had international fi nancial and technical support have failed
(Duchovny 2002a&b).
In the Aral Sea, signifi cant improvements to the Small Sea ecosystem
are likely with the construction of the Korakal dam between the Small
Sea and the Big Sea. As a result, between 1996 and 1999 the water level
of the Small Sea rose by 2.5 m, mean salinity reduced by 14.5%, and a
vast freshwater zone formed where freshwater creatures reappeared
(Amirbekov at al. 2002).

POLICY OPTIONS 57
The transferral of water from Siberian rivers to the Aral Sea Basin is seen
as one solution to the freshwater shortage concern in the Aral Sea Basin.
A project developed in the early 1980s redirected water from the Ob
River via a channel running through the Turgai defl ection to Central Asia.
However, in 1986 due to pressure from scientists and the public, the
project was suspended but has been reactivated in recent years. In Russia,
certain ambiguities surround the validity of this project for ecological and
economic reasons. According to GIWA experts, the region should not rely
upon the transfer of water from Siberian rivers but rather should maximise
the effi ciency of using the region’s available water supplies.
Policy options
The policy options need to address the freshwater shortage concern
through the development of political and legislative measures. The
principles of inter-state water allocation in the region were formulated
by the SPECA-Programme and presented in a report entitled
‘Strengthening cooperation for the rational and effi cient use of water
and energy resources in Central Asia (SPECA 2004). As determined in
this report, water will be allocated among Central Asian states according
to the following principles:
Water resources subject to allocation are summed up in each
transboundary river basin as per the agreed list of basins;
Each state retains the right to use its territorial water resources
within its agreed quotas;
Quotas are adjusted on the basis of mutually acceptable criteria and
procedures are addressed in intergovernmental agreements;
The long-term and seasonal fl ow regulation of transboundary rivers
by storage reservoirs used for irrigation and power generation are
subject to agreement. The fi lling and discharge schedules for
storage reservoirs are established to ensure integrated use of water
and energy resources and to meet environmental requirements;
The schedules governing water intake and discharge at facilities
on transboundary rivers and in water-management systems
supplying water to neighbouring countries and capable of having
transboundary impacts are subject to agreement;
Water use should not lead to a signifi cant deterioration in water
quality in transboundary river basins, and pollutant concentrations
should not exceed agreed limits.
The complexity of the freshwater shortage concern and the danger
of its spontaneous development are recognised by all relevant parties
and eff orts to solve this problem continue. In order to increase the
effi ciency of regional water management there have been discussions
on the creation of an interstate water-power generation consortium,
with much wider powers than the ICWC.
Although the countries of the region have demonstrated a commitment
to solving the freshwater shortage concern, the fact that each of the
countries of the region intend to expand their irrigated areas or to
construct new water reservoirs to satisfy their own needs indicates an
exacerbation of the problem with likely disagreements regarding the
sharing of transboundary water resources.
Thus, the problem of sharing transboundary water resources in Central
Asia remains complicated. The solution to this problem requires
the development of legislative agreements based on the following
principles:
Equal representation of the countries of the region in inter-state
agencies responsible for water management, including basin
administration. In the interstate management institutions there
are practically no representatives from the main water users,
i.e. farming and water user associations, industrial and scientifi c
organisations;
Fairness when allocating water quotas and in the regulation of
stream fl ow;
Between November 2000 and June 2001, Vozrojdeniya Island joined the
mainland to the south
In 1989-1990, the Aral Sea separated into two parts:
the 'Big Sea' and the 'Small Sea'
1957from a map
1977from satellite images
1982from satellite images
1984from satellite images
1993from a map
November 2000from satellite images
June 2001from satellite images
Figure 12 Changes in surface area of the Aral Sea.(Source: UNEP 2002)

58 GIWA REGIONAL ASSESSMENT 24 ARAL SEA
Obligatory compensation for mutual damage. It is only possible
to come to mutually acceptable decisions if this principle is
observed;
Consider ecosystems as an equal consumer of water resources to
human uses. Under the existing system of regional water resources
management the interests of the environment are considered last
or not at all;
Equal access to information on the hydrometerorological dynamics
of all countries in the Aral Sea Basin, including the volume and
regime of each country’s water abstraction.
Recommended policy options
National levelGovernance
Revision and enactment of national water strategies, based on the
principles laid down in the IWRM. These should be established in
accordance with international water law and take into account the
interests of all the countries in the region;
The governments of each country should recognise the importance
of interstate (regional) agreements over national legislation and
regulations regarding the use of water resources;
Creation of water user associations with an aim to improve water
effi ciency, particularly amongst farmers;
Participation of water users’ associations in the decision making
process;
Enhance administrative and legal mechanisms for regulating water
use;
Increase the administrative and legal responsibility of water users
for ineffi cient use of water, particularly in irrigated farming.
Knowledge
Initiate and support scientifi c research in the following fi elds:
Monitor natural processes in the run-off formation zone, primarily
in the high-mountain belt, where the majority of renewable water
resources are formed;
Develop environmental approaches to water resource management;
Monitor desertifi cation and landscape degradation dynamics in the
zone where the water is predominantly consumed;
Assess available water and energy resources, forecast future demand.
Technology
Optimise the productivity of agricultural land by assessing the
appropriateness of crops for the agro-climatic conditions;
Adapt water saving technologies for irrigated farming to the
specifi c physical conditions of the Aral Sea region;
Monitor the soil contamination dynamics and agro-climatic
conditions, including through the application of remote sensing;
Develop technical methods and techniques for the rehabilitation
of salinised and highly contaminated soils;
Increase the effi ciency of irrigation systems.
Regional levelGovernance
Revise the interstate legislative framework regarding the sharing
and equitable use of the Aral Sea Basin transboundary waters;
Develop a regional strategy for the integrated management of
water and power resources, including the allocation of water
quotas and the coordinated control and enforcement of the
established water regime based on the IWRM principles;
Formulate and ratify regional agreements which require shared
participation of the countries situated in both the zone of
predominant water resource usage and in the run-off formation
zone in the management and funding of maintenance of the major
water distribution systems;
Each country should adhere more strictly to the obligations
they made when ratifying agreements aimed at addressing the
freshwater shortage issues of the region;
Develop legal procedures for the implementation of the ‘polluter
pays’ principle;
Create regional databases on the distribution, availability and use
of water resources;
Reform existing, or create new, interstate organisations with
suffi cient authority to enable the effi cient and unbiased governance
of regional water and power resources of the Aral Sea Basin.
A solution to this problem is to reform the ICWC by:
Providing equal representation of all the countries in the ICWC;
Extend the Commission’s mandate to include interstate water and
power generation issues;
Strengthen the enforcement capacity of agreements regarding
water quotas and the operation of reservoirs;
Implement new legislative norms and rules, which express the
authority and independence of the ICWC.
Economic
Introduce market prices for water, taking into account the ecological
health, water quality and the reliability of its delivery to the consumer.
The loss in ecosystem services and the cost of protecting and

POLICY OPTIONS 59
rehabilitating ecosystems should be economically evaluated and
considered in the pricing system (Khristoforov 2001). This will
encourage a more effi cient use of water by human activities.
Develop and introduce economic mechanisms for the regulation
of land-water use, protection and improvement in water quality
(Babaev 2003, Sarsembekov at al. 2004, Kipshakbaev 2004).
Conclusion
The transboundary nature of the major basins in the region makes
it impossible to solve the freshwater shortage concern without the
implementation of inter-state agreements. The adoption of the IWRM
principles constitutes the most viable option for the region. A signifi cant
obstacle in achieving the integrated management of regional water
resources is the lack of a regional organisation with the authority to
facilitate eff ective and confl ict-free management, taking into account
the interests of all the countries in the region. A successful solution to
this problem necessitates the development of a legislative framework
which ensures the equitable use of water resources, whilst preventing
unilateral actions capable of changing the hydrological regime of the
region. Despite regional disagreements regarding water resources, all
of the countries in the region understand the necessity of interstate
cooperation in resolving the freshwater shortage issues.

60 GIWA REGIONAL ASSESSMENT 24 ARAL SEA
Conclusions and recommendations
The Aral Sea Basin contains the territories of six countries, Kazakhstan,
Kyrgyzstan, Uzbekistan, Tajikistan, Turkmenistan, and Afghanistan. The
priority concern of the region is that of freshwater shortage. The water
defi ciency became apparent in the early 1960s when the population
in fi ve countries of the region (excluding Afghanistan and Iran) was
approximately 15 million. In this period more than 50% of the annual
water yield of the Syrdarya and Amudarya river basins was used for
human activities. However, since the beginning of the 1980s practically all
renewable water resources are being used, predominantly for irrigation,
and the regional economy is developing under conditions of increasing
freshwater shortages. This scenario has arisen from two main factors,
fi rstly, the rapid increase in the region’s population and, secondly, by the
orientation of the regional economy towards irrigated agriculture.
Accordingly, GIWA experts selected freshwater shortage as the priority
concern, and specifi cally the issue of modifi cation of stream fl ow.
Pollution, and most importantly pollution of existing water supplies,
was identifi ed as the second most signifi cant concern.
The Causal chain analysis (CCA) aimed to identify the root causes behind
freshwater shortage to serve as a foundation for the selection of policy
options. The immediate causes of the modifi cation of Stream fl ow were
defi ned as the following:
Increased diversion;
Decreased ice resources;
Inter-annual climatic variability.
The root causes behind freshwater shortages were identifi ed to serve as
a foundation for the selection of policy options. The collapse of the USSR
led to the fragmentation of the previously integrated economic system,
which was followed by social and economic turmoil. Investment in the
agricultural sector reduced due to economic recession in the region,
which led to a decline in agro-productivity and the water effi ciency
of irrigation systems. Outmoded and ineffi cient irrigation technology
continues to be employed, and the continued economic diffi culties
and the lack of fi scal incentives for farmers to save water prevents the
adoption of water saving technologies.
Water use is controlled by weak legislation and the region lacks a
mutually acceptable legislative framework for interstate sharing of
transboundary water resources. The current water legislation was
formulated during the Soviet period and is not appropriate under
the present-day conditions. The transboundary nature of the major
watershed basins in the region makes it impossible to solve the
Freshwater shortage concern without inter-state agreements. Many
past agreements have not been implemented or the countries have
not fulfi lled their obligations. Governments lack clearly formulated
national water strategies and management is not integrated at the
regional level. Contrary to governmental eff orts to resolve the water
management problems, all of the countries in the region intend to
increase their irrigated areas.
Freshwater shortage may become even more acute over the next
few decades if, as is predicted, water resources in the region’s major
river basins reduce by 20-40%. However, some predictions show that
anthropogenic induced climate change may play a less signifi cant
role than was previously thought due to evidence of a compensating
mechanism in the formation of run-off which is maintaining the total
volume of renewable water resources. Thus, further research is needed
regarding the dynamics of the region’s water resources, primarily in
the run-off formation zone, as policy makers cannot make informed
decisions without accurate predictions of future renewable water
resources.
Experience of the countries in the region cooperating in the
management of transboundary water resources in the post-Soviet
CONCLUSIONS AND RECOMMENDATIONS 61
period has revealed essential diff erences in their approaches to
resolving key issues. This is particularly true for the equitable use
of regional water resources, in defi ning the principles and criteria
for interstate water sharing, and in establishing legal and economic
mechanisms for water use. Economic pressures experienced during
the transitional period from Soviet rule, common to all countries
in the region, has predetermined not only diffi culties in achieving
coordinated solutions, but has led to failures in the implementation of
accepted interstate agreements and obligations at the national level.
Despite the eff orts of the region’s governments and the international
community, the situation of water supply in Central Asia remains critical
and is anticipated to increase in severity. The tendencies of nations in
the region to take unilateral decisions and actions is provoking political
confl icts, and thus complicating and hindering the resolution of the
situation to the mutual benefi t of all states.
By the year 2010, the escalating water abstraction in the region
is predicted to result in an ecological disaster. The situation is so
critical that the situation could escalate to a crisis if only one of the
countries increases water abstraction from surface supplies. Thus the
equitable use of transboundary water resources in Central Asia remains
problematic and is likely to worsen in future.
Progress in this area can be achieved through political rather than
solely technical means and requires development of a package of
legal agreements at the national, regional and international level. The
following policy options are recommended as a priority:
Reconstruction and more effi cient operation of irrigation systems;
Development of legislative principles and mechanisms for water
use;
Support of research projects to develop monitoring databases,
water saving technologies and techniques to rehabilitate salinised
lands;
Development of a central water supply system and medical service
for the population, especially in ecological crisis zones;
Institutional and legislative support for water user associations and
the creation of a legislative framework which facilitates participation
of stakeholders in water management at all levels - from regional to
local;
Consideration of the specifi c environmental conditions of the
region in the adoption of progressive water technologies for
irrigated farming.

62 GIWA REGIONAL ASSESSMENT 24 ARAL SEA
References
Abdulkasimov, H.P., Alibekova, A.V., Vakhabov, A.V. (2003). Desertifi cation
Problems in Central Asia and its Regional Strategic development.
Abstracts, NATO Advanced Research Workshop. Samarkand 11-14
June, 2003. p 4-7.
Aladin N. (1999). Creeping changes in biological communities in the
Aral Sea. In: Glantz, M.H. (ed.) Creeping environmental problems
and sustainable development in the Aral Sea Basin. Cambridge,
Cambridge University Press. p 261-282.
Aladin, N.V. and Kotov, S.V. (1989). Natural state of Aral Sea ecosystem and
its changes under anthropogenic impact. Issue of zoology institute
of the AS of USSR. Vol. 199:4-25 (in Russian).
Aladin, N.V., Fillippov, A.A., Plotnikov, I.S. and Egorov, A.N. (2001). Modern
Ecological state of the Small Aral Sea. In: Ecological research
and Monitoring of the Aral Sea deltas. A basis for restoration.
Book 2. UNESCO Aral Sea Project 1997-2000 Final Scientifi c
Reports. p 79-82.
Amirbekov, U.A., Kurbanbaev, E.K., Karimov, O.Yu. (2002). Desertifi cation
of Amudarya delta and ratify of dried bottom of Aral Sea. Problems
of desert development. Nr. 1:27-30 (in Russian).
Amirgaliev, N.A. and Ismukhanov, N.K. (2002). Hydroecological situation
and questions of fi sh economy in Aral -Syrdarya Basin. Ecological
problems of Turkestan Region. Issue of International Ecological
conference. p 94-97 (in Russian).
Artemjeva, S.S. and Tsarev, B.R. (2003). Climatical changes of winter
period West Tien Shan Mountains. Risk-2003, Tashkent, Uzbekistan,
p 138-142 (in Russian).
Ashirbekov, U., Zonn, I. (2003). Aral: the history of Sea disappearance.
Dushanbe, Tajikistan. 86p. (in Russian).
Ashirbekov, U.A. (2003). The Aral Sea’s Ecological crisis: the ways for
surmounting. IFAS: a way to rational cooperation. Dushanbe,
Tajikistan. p 89-97 (in Russian).
Ashirbekov, U.A., Kurbanbaev, E.K., Karimova, O.Yu. (2002). Desertifi cation
of Amudaria delta and stabilization of dried bottom of the Aral
Problems of desert development. Vol. 1:27–30 (in Russian).
Askarova, M.A. (2002). Transformation of geosystems under the human.
Ecological problems of Turkestan’s Region. Issue of International
Ecological Conference Turkestan. p 175–178 (in Russian).
Aslov, S.M. (2003). IFAS: prospects and new tasks, a way to rational
cooperation. Dushanbe, Tajikistan. p 56-64 (in Russian).
Babaev A.G. (2003). Transboundary probems in Amudarya basin.
Transboundary problems of NIS countries. Moskow. p 224-233 (in
Russian).
Bakhiev, A.B. and Treshkin, S.E. (2002). Desertifi cation problems of the
south Priaral region. Problems of Desert Development, Nr. 1:31-35
(in Russian).
Bakhiev, A.B., Novikova, N.M., Shenkareva, M.E. (1987). Changes of the
vegetation resources under of decreasing of watering of the delta
plains. Water resources, Nr. 2:167-169 (in Russian).
Batyrov, R.S., Jakovlev, A.V. (2004). Monitoring of mountain glaciers of
some areas Gissaro-Alai with use of space images ASTER TERRA.
Glaciology of mountain areas. Works. Hydrometeorological
Scientifi c Research Institute. Release 3 (248). Tashkent, Uzbekistan.
p 22-27.
Bolshakov, M.N. (1974). Water resources of northern Tien Shan rivers.
Frunze, Ilim. 308p. (in Russian).
Bortnik, V.N., Chistjaeva, S.P. (ed.)(1990). Hydrometeorology and
hydrochemistry of the USSR’s. Seas. Volume VII. Aral Sea. Leningrad,
Hydrometeoizdat. 195p. (in Russian).
Bragin, B.I., Sokolov, S.B., Jashenko, R.V. (2001). Organic pesticides in
components and trophic chains of water areas of the Sirdarya
River delta. In: Ecological Research and Monitoring of the Aral Sea
Deltas. A basis for restoration. Book 2. UNESCO Aral Sea Project. Final
Scientifi c Report. p 55-72.
Burlibayev, M.Zh., Dostay, Zh.D., Tursunov., A.A. (2002). The Aral -
Syrdarya basin. Hydroecological problems and problems of water
division. Almaty, Dayir. 180p. (in Russian).

REFERENCES 63
Chembarisov, E.I. (1998). Hydrochemistry of Irrigated Areas (by an
example of the Aral Sea), Tashkent, Uzbekistan. 104p. (in Russian).
Chembarisov, E.I. and Lesnik, T.V. (1995). To the preserve of surface waters
of Central Asia Trudy of SANIGMI. Fresh Water, Tashkent, Uzbekistan.
p 64-71 (in Russian).
Chembarisov, E.I., Lesnik T.V. and Ranneva I.V. (2001b). Contemporary
River’s water quality of Uzbekistan. Water and Sustainable
development of Central Asia, Bishkek, Kyrgyzstan. p.39-41. (in
Russian).
Chembarisov, E.I., Lesnik, T.V. and Ranneva, I.V. (2001a). Hydroecological
state of the Amudaria river. Problems of Desert development, 4:
56-58 (in Russian).
Cherkasov, P.A. (2002). Preliminary analyses of quantity and area of
glaciers change on the Zailiyskiy Alatau northern slope during the
1955-1990 years period. Hydrometeorology and ecology, 1:135-140
(in Russian).
Cherkasov, P.A., Eriskovskaya, L.A., Udartsev, S.V, Solodovnikova, T.V.
(2002). Contemporary status of the Ili-Balkhash basin glaciers.
Contemporary ecological Chichasostatus of Balkhash Lake. Almaty,
Kaganat. p 141-198 (in Russian).
Chichasov, G.N. and Shamen, A. (1997). Long-time changes of climate
and their consequence for grain agriculture of Kazakhstan.
Hydrometeorology and ecology, 3:29-41 (in Russian).
Chub, V.E. (2000). Climate change and its infl uence on natural resource
potential of the republic of Uzbekistan, Tashkent. 252p. (in
Russian).
Chub, V.E., Myagkov, S.V. (2002). Water resources of Central Asia and their
Variability. Port-au-Prince, HAITI, Int. Colloqium.
Chub, V.E. (2002). Meteorological and hydrological monitoring of water
resources in Central Asia. Water resources of Central Asia. Tashkent,
Uzbekistan. p 99-104 (in Russian).
CIA (2002). The World Factbook. US Central Intelligence Agency.
Dikih, A.N. (2001). Problem and prognosis of glaciation and river water
content in Central Asia. Water and sustainable development in
Central Asia. Bishkek, Kyrgyzstan. p 88-92 (in Russian).
Dikih, A.N., Usubaliyev, R. and Dzhumashev, K. (2001). Dynamics of
glaciation of the Kyrgyz Alatoo northern slope and its infl uence on
river water content (on example of the Ala-Archa). Meteorology and
hydrology in Kyrgyzstan, issue 1. Bishkek. p 19-25 (in Russian).
Dmitriev, L. (1995). The Problem of Agricultural Crop Diversity in the
Lower Part of the Syrdarya Basin. Forum On the Caspian, Aral and
Dead Seas. Perspectives of Water Environment Management and
Politics. Symposium On the Aral Sea and the Surrounding Region.
Osaka/Shiga. p 49-52.
Duchovny, V.A. (2002a). Science in the system of the Aral Sea Basin.
Melioration and water economy, 1:28-31 (in Russian).
Duchovny, V.A. (2002b). Water economy problems of the Aral Sea Basin
countries, 10 years of cooperation and perspectives. Melioration
and water economy, 1:66-70 (in Russian).
Durgerov, M.B., Shaohay, L. Zichu, S. (eds). (1997). Tien Shan glaciation.
Moscow, 233p.
Duskayev, K.K. (2000). Transboundary problems of water division in
Central Asia. International Ecological Forum Balkhash-2000, Almaty.
p 354-359 (in Russian).
Dzhalalov, A.A. (2003). Aral’s crisis: problems and tasks on the future.
IFAS: a way to rational cooperation. Dushanbe, Tajikistan. p 49-55
(in Russian).
Eber, K., Geib, T., Rentsch, H., Kokorev, A. and Uvarov, V. (2005). Surveying
and mapping of the Tuyuksu glacier region, Tien Shan. Fluctuations
of glaciers 1995-2000 (in press)
Esenov, P. and Mamieva, I. (2003). Regional cooperation in Central Asia
in sphere of environment protection and sustainable development.
IFAS: a way to rational cooperation. Dushanbe, Tajikistan. p 112-120
(in Russian).
Eserkepova, I.B., Piliphosova, O.V., Chichasov G.N. and Shamen, A. (1996).
About research of infl uence global warming on natural resources
and economy of Kazakhstan and action for mitigation of negative
consequences of possible changes of climate. Hydrometeorology
and ecology, 2:58-75 (in Russian).
Geldieva, G. V., Budnikova T.I. and Gobernik, I.A. (1998) Assessment of
deertifi cation process in natural complexes in the lower Amu -
Dar’ya and Syr-Dar’ya deltas. UNESCO Aral Sea Project, 1992 - 1996,
Final Scientifi c reports. Paris.
Ginijatullin, R.A. (2002a). Serving your country. Melioration and water
economy, 1:4-5 (in Russian).
Ginijatullin, R.A. (2002b). Regional cooperation on rational usage of
water resources in the Aral Sea Basin. Water resources of Central
Asia, Proceedings. Tashkent, Uzbekistan. p 8-19 (in Russian).
Glantz, M.H. (1998). Creeping environmental problems in the Aral Sea
Basin. In: Kobori, I and Glantz, M.H. (eds). Central Eurasia Water Crisis.
United Nations University Press, New York. p 25-52.
Glazirin, G.E. (1996). The reaction of glaciers in West Tien Shan to climate
changes. Zeitschrift fur Gletscherkunde und Glacialgeologie, Band
32:33-39.
Glazirin, G.E. and Kodama, Yu. (2003). Assessment of glaciation change
in transitional regime under climate change. Materials of glaciology
investigation, 94:212-215 (in Russian).
Glazovsky, N.F. (1990). The Aral’s crisis. Moscow (in Russian).
Glazovsky, N.F. (1995). The Aral Sea Basin. In: Kasperson, J.X., Kasperson,
R.E. and Turner, B.L. (eds). Regions at risk: comparison of threatened
environments. United Nations University Press, New York. p.. 92-
139.

64 GIWA REGIONAL ASSESSMENT 24 ARAL SEA
Golodkovskaya, N.A. (1982). Reconstruction of the Central Caucasus
freezing in XIII-XX centuries (on lichenometric data). Thesis of
candidate dissertation. Moscow. 27p. (in Russian).
Gorbunov, A.P. and Severskiy, E.V. (1998). Evaluation of underground ice
reserves in northern Tien Shan. Hydrometeorology and ecology,
No.3-4:138-150. (in Russian).
Gorbunov, A.P., Marchenko, S.S., Severskiy, E.V. and Titkov, S.N. (1997).
Geocryological condition changes in the Northern Tien Shan in
connection with global climate warming. Hydrometeorology and
Ecology, Nr. 3 (in Russian).
Hurni, H., Wiesmann, U. and Schertenleib, R. (Ed). (2004). Research
for Mitigating Syndromes of Global Change. A Transdisciplinary
Appraisal of Selected Regions of the World to Prepare Development-
Oriented Research Partnerships. Perspectives of the Swiss National
Centre of Competence in Research (NCCR) North-South, University
of Berne, Vol. 1. Berne: Geographica Bernensia. 468p.
ICG (2002). Central Asia: Water and Confl ict. International Crisis Group.
Asia Report Nr. 34. 47p.
ICWC (2004). Interstate Coordination Water Commission of Central Asia.
Press releases. Retrieved from http://sic.icwc-aral.uz (in Russian).
IFAS (2000). State of the Environment of the Aral Sea Basin. The World
Bank, Norwegian Trade Council, IFAS, UNEP/GRID.
Isida, N., Tsuimura, S., Kubota, N. and Izumi, K. (1995). Environmental
Problems in the Area of Syrdarya and the Aral Sea. Forum On the
Caspian, Aral and Dead Seas. Perspectives of Water Environment
Management and Politics. Symposium On the Aral Sea And the
Surrounding Region. Osaka/Shiga. p 58-63.
Kamalov, T.K. (2002). Water crisis of southern Priaralje, contemporary
status and perspectives. Water resources of Central Asia. Tashkent,
Uzbekistan. p 74-78 (in Russian).
Khamidov, M.N. (2002). Ten years interstate water-sharing in Syrdarya
Basin. Melioration and Water Economy, 1:42-48 (in Russian).
Khasankhanova, G and Abdullaev, U. (2001). Water and Human Health:
Water Quality and Health of Population in the Amudarya basin.
Water Security-Opportunity for Development and Cooperation
in the Aral Sea Area. Proceedings SIWI/RSAS/UNIFEM Seminar,
Stockholm, Sweden, August 13. p 51-56.
Khristoforov, A.V. (2001). Hydroecological security of the river basins.
The methods of assessment and ways its availability. In: Water and
Sustainable Development of Central Asia. Tuzova,T.V. (ed.). Materials
of the projects ”Regional cooperation on the usage of water and
power resources in Central Asia (1998)” and ”Hydroecological
problems and sustainable development of Central Asia”. Bishkek,
p 85-87. (in Russian).
Kipshakbaev, N. (2004). The regional problems of Water Economy.
Almaty, Kazakhstan. 466p. (in Russian).
Kipshakbayev, N.K. and Sokolov, V.I. (2002). Water resources of the Aral
Sea Basin-formation, distribution, usage. Water resources of Central
Asia. Tashkent, Uzbekistan. p 63-67. (in Russian).
Koimdodov, K.K. (2003). International cooperation on use of water
resources in Aral Sea basin. IFAS: a way to rational cooperation.
Dushanbe, Tajikistan. p 13-20 (in Russian)
Kondratyev, K.Ya. and Donchenko, V.K. (1999). Economics and
Geopolitics. Vol.1 The Global Problems. St.Petersburg. 1039p. (in
Russian).
Kondratyev. K.Ya., Adamenko, V.N., Demirchian, K.S., Baliunas, S.,
Boehmer-Christianes S., Idso, S.B., Kukla, G., Postmentier, E.S. and
Soon, W. (2001). Global Climate Change: conceptual aspects.
St.Petersburg. 125p. (in Russian).
Kuksa, V.I., Zaletaev, V.S. and Novikova, N.M. (1991). The ecological
aspects of the Aral sea problem. Water resources, 5:143-154.
Mamatkanov, D.M. (2001). Contemporary status and perspectives of
regional cooperation on rational usage of water and hydropower
potentials of Central Asia. Water and sustainable development in
Central Asia. Bishkek, Kyrgyzstan. p 14-17 (in Russian).
Mambetov, B.E. (2003). Improvement of regional cooperation on
water resources management in the Aral Sea basin. Requirements
and alternatives. IFAS: a way to rational cooperation. Dushanbe,
Tajikistan. p 31-37 (in Russian).
Mazachirov, Sh.N. (2003). Role of Tajikistan’s water resources in economic
development of Central Asia// IFAS: a way to rational cooperation.
Dushanbe, Tajikistan. p 107-111 (in Russian).
Molostnova, T.I., Subbotina, O.I. and Chanysheva, S.G. (1987). Climatic
eff ects of humane activity in Aral Sea’s zone. Moskow. GIMIZ.
p.119.
Myagkov, N.V. and Myagkova, E. (1998). Prognosis of the runoff of
collector-drainage waters in the Amudarys basin. Tashkent,
Uzbekistan (in Russian).
Myagkov, S.V. (1991a). Mathematical modeling of water-salt regime
of irrigated areas in the Amudarya lower reaches. Tashkent,
Uzbekistan. (in Russian).
Myagkov, S.V. (1991b). Modelling of the process of salt transfer along the
Amudarya. SANIIRI . Tashkent, Uzbekistan (in Russian).
National report (1998). On the state of the environment and usage of
natural recourses in Uzbekistan in 1996. Tashkent, Uzbekistan (in
Russian).
Nazirov, A.A. (2003). A Regional cooperation and participation of
Tajikistan in water resources management in the Central Asia.
IFAS: a way to rational cooperation. Dushanbe, Tajikistan. p 75-88
(in Russian).
Novikova, N.M. (1999). Priaralye ecosystems and creeping environmental
changes in the Aral Sea. In: Glantz, M.H. (ed.) Creeping

REFERENCES 65
environmental problems and sustainable development in the Aral
Sea Basin. Cambridge, Cambridge University Press. p 100–127.
Novikova, N.M. (2001). Ecological basis for Botanical diversity
conservation within the Amudarya and Syrdarya river deltas. In:
Breckle, S.-W., Veste, M., and Wucherer, W. (Eds). Sustainable land
use in deserts. Springer, Berlin. p 84-94.
Novikova, N.M., Kust, G.S., Kuzmina, J.V., Dikareva, T.V. and Trofi mova,
G.Yu. (1998). Contemporary plant and soil cover changes in the
Amudarya and Syrdarya deltas. Ecological research and monitoring
of the Aral Sea deltas. UNESCO. Aral Sea project 1992-1996. Final
scientifi c reports, Paris. p 55-80.
Novikova, N.M., Kuzmina, J.V., Dikareva, T.V., Trofi mova, T.U. (2001).
Preservation of the tygai bio-complex diversity within the
Amu-Darya and Syr-Darya River deltas in aridization conditions.
Ecological research and Monitoring of the Aral Sea deltas. A basis
for restoration Book 2.UNESCO Aral Sea Project 1997-2000 Final
Scientifi c Reports. p 155-188.
Nurushev, A.N. (2003). For sustainable regional development. IFAS: a way
to rational cooperation. Dushanbe, Tajikistan. p 80-88 (in Russian).
Olimov, M. (2001). Hydro-resources of Tajikistan: Resources and
problems. Water and sustainable development of Central Asia. Fund
Soros-Kyrgyzstan. Materials of the projects: Regional cooperation
on the usage of water and power resources in Central Asia (1998)
and Hydroecological problems and sustainable development of
Central Asia (2000). Bishkek, Kyrgyzstan. p 46-48 (in Russian).
Petrov, G.N. and Leonidova, N.V. (2003). Interstate problems of
interrelations between irrigation and hydraulic energy in Central
Asia and crisis of Aral Sea. IFAS: a way to rational cooperation.
Dushanbe, Tajikistan. p 132-154 (in Russian).
Pimankina, N.V. (1998). Tendencies of changes of snow conditions in
Kazakhstani part of the Tien Shan for the last 30 years. Geographical
principles of sustainable development of Kazakhstan. Almaty,
Kazakhstan. p 75-79 (in Russian).
Rakhmonov, E.S. (2003). Clear water - a long life. IFAS: a way to rational
cooperation. Dushanbe, Tajikistan. p 6-12 (in Russian).
Reteyum, A.Yu. (2003). The factors and results of desertifi cation of central
Asia. Desertifi cation Problems in Central Asia and its Regional
Strategic development. Abstracts, NATO Advanced Research
Workshop. Samarkand 11 -14 June. p 69-70 (in Russian).
Rodina, E.M. (2002). Ways of sustainable natural use in Aral Sea basin.
Problems of Desert development, 1:38-42 (in Russian).
Rubinova, F. (2000). Regularities of anthropogenic changes of fl ow of
the Central Asia Rivers. SANIGMI. Tashkent, Uzbekistan.
Rudenko, B. (1989). The salty sands of the Aral. Nauka i zhizn. 44p (in
Russian).
Ruziev, M.T. and Prichodko, V.G. (2002). Estimation of prospects of
sustainable development of the states of the Aral Sea Basin with the
help of modeling calculations. Melioration and a water economy,
1:54-56 (in Russian).
Ryabtsev, A.D. (2003). Strengthening of interstate cooperation - a
way to the decision of Priaralye problems. IFAS: a way to rational
cooperation. Dushanbe, Tajikistan. p 65-74 (in Russian).
Saiko, T. (2000). Environmental Crises: Geographical Case Studies in Post-
socialist Eurasia. Prentice Hall, New York.
Sarsembekov, T.T., Nurushev, A.N., Kozhakov, A.E. and Ospanov, M.O.
(2004). Use and protection of transboundary rivers in Central Asia.
Almaty, Kazakhstan. 271p. (in Russian).
Schröder, H. and Severskiy, I. (eds.) (2004). Water resources in the basin
of the Ili River (Republic of Kazakhstan). Berlin. 310p.
Schultz, E. (2002). Water for food and ecological stability in rapidly
changing conditions. Water resources of Central Asia. Tashkent,
Uzbekistan. p 36-46.
Severskiy, I.V. (1999). To the problem of changes in climate. Reports
Ministry of Science and Higher Education, National Academy of
Sciences, Republic of Kazakhstan. Almaty, Nr. 2:86-93.
Severskiy, I.V. (1999). Trustworthiness of the Long-term Series of the
Climatological Characteristics. Issue of Russian Academy Sciences,
Geographical series, Nr. 4:22-28 (in Russian).
Severskiy, I.V. and Tokmagambetov, T.G. (2004). Modern Glaciation
degradation of the Southeastern Kazakhstan mountains.
Hydrometeorology and ecology, Nr. 1:72-86 (in Russian).
Sharmanov, T.S. (1998). Nutrition and Health in Relation to Ecology.
Vestnik Akad. Nauk SSSR. p 27-30 (in Russian).
Shchetinnikov, A.S. (1993). Changes in water resources in the Pamiro-
Altai glaciers from 1957 to 1980. MGI, Issue 76:83-89 (in Russian).
Shchetinnikov, A.S. (1998). Morphology and regime of the glaciers of
Pamir-Alai. Tashkent, Trudy SANIGMI. 219p. (in Russian).
Shchetinnikov, A.S. and Likhacheva, L.I. (1994). Changes in glaciation
and runoff from the glaciers of Central Asia caused by climate
changes by the year 2005. SANIGMI transactions. Tashkent. p 63-77
(in Russian).
Shultz, V.L. (1965). Rivers of Central Asia. Hydrometeoizdat, 692p. (in
Russian).
Sokolov, V. (2001). Formulation and analysis of Regional Strategies on
Land and Water Resources Management in the Aral Sea Basin. Water
Security - Opportunity for Development and Cooperation in the
Aral Sea Area. p 65-72.
Sorokin, A.G. (2002). Modelling of management of transboundary river
water resources in the Amudarya and Syrdarya basins. Melioration
and water economy, Nr. 1:48-50 (in Russian).
SPECA (2004). Strengthening cooperation for rational and effi cient use
of water and energy resources in Central Asia. Special Programme

66 GIWA REGIONAL ASSESSMENT 24 ARAL SEA
for the Economies of Central Asia, UN, New York. 75p.
Tokmagambetova, R.Yu. (2001). Human health in Kyzylorda oblast under
the conditions of desertifi cation. Geographic science in Kazakhstan:
results and perspectives of development. Almaty, Kazakhstan. p
209-214 (in Russian).
Treshkin, S.E. (2001). Transformation of tugai ecosystems in the
fl oodlands of the lower reaches and delta of the Amudarya and
their protection. Ecological research and Monitoring of the Aral Sea
deltas. A basis for restoration Book 2. UNESCO Aral Sea Project 1997-
2000 Final Scientifi c Reports. p 189 - 202.
Treshkin, S.E. and Kuzmina, Zh.V. (1993). The present situation of
fl ood forest ecosystems of the Amudarya and Sumbar Rivers in
connection with anthropogenic infl uence. Problems of desert
development. Ashkhabad: Ylym, Nr. 2:14-19 (in Russian).
Tsukatani, T. (1998). The Aral Sea and socio-economic development.
Central Eurasia Water Crisis. Caspian, Aral and Dead Seas. p 53-74.
Tuzova, T.V. (2002). Usage of isotope methods to study water resources
and to control hydroecological situation in Central Asia. Water and
sustainable development in Central Asia, Bishkek, Kazakhstan. p
110-113 (in Russian).
UNDP (2003). Strategy for Central Asia 2003-2005.
UNEP (2002). Vital Water Graphics – An Overview of the State of the
World’s Fresh and Marine Waters. UNEP, Nairobi, Kenya.
UNESCO (2000). Water related vision for the Aral Sea Basin. UNESCO,
Paris, France. 237p.
Vashneva, N.S. and Peredkov, A.V. (2001). Water and Health. Water and
Sustainable Development of Central Asia. Fund Soros-Kyrgyzstan,
p 122-125 (in Russian).
Velmuradov, T.M. (2003). The International Fund of rescue the Aral
Sea and its structure as historical necessity. IFAS: a way to rational
cooperation. Dushanbe, Tajikistan. p 38-48 (in Russian).
Vilesov, E.N. and Uvarov, V.N. (2001). The evolution of modern glaciation
of the Zailiyskiy Alatau in 20th century. Almaty, Kazakh State
University. 252p. (in Russian).
World Bank (2002). World development indicators. Washington DC,
US.
Yermolov, A. (2003). After a drop of water. IFAS: a way to rational
cooperation. Dushanbe, Tajikstan. p 195-199 (in Russian).
Zaletaev, V.S. (1989). Ecologically destabilized environment. Nauka.
189p. (in Russian).
Zholdasova, I. (1999). Fish population as an ecosystem component and
economic object in the Aral Sea. In: Glantz, M.H. (ed.) Creeping
environmental problems and sustainable development in the Aral
Sea Basin. Cambridge, Cambridge University Press. p 204-224.
Zholdasova, I.M., Pavlovskaya, L.O. and Urazymbetova, B.K. (2002).
Transformation of river’s hydrological regime of Aral Sea basin as
the factor of succession of fi sh population. Issue of International
Water Conference. Turkestan. p 169-172. (in Russian).
Zolotokrylin, A.H. and Tokarenko, A.A. (1991). About variations of climate
in the Aral Region during the last 40 years. Proceedings of the USSR
Academy of Sciences. Geographical series, Nr. 4:69-75 (in Russian).
Zolotolkrylin, A.N. (2003). Climatical diversifi cation. Moscow. 245p. (in
Russian).

ANNEXES 67
Annexes
Annex I List of contributing authors and organisations
Name Institutional affiliation Country
Dr Igor Severskiy Institute of Geography of the Ministry of Education and Science. Kazakhstan
Prof. Felix Stolberg Kharkiv State Academy of Municipal Economy Ukraine
Dr. Yevgeniy Ponomarenko Kharkiv State Academy of Municipal Economy Ukraine
Dr.Olena Borysova Kharkiv State Academy of Municipal Economy Ukraine
Prof. Georgy Sukhorukov Ukrainian Institute for the Ecological Problems Ukraine
Dr. Valery Barannick Ukrainian Institute for the Ecological Problems Ukraine
Prof. Igor Chervanyov Department of Geographical Monitoring and Environmental Protection Ukraine
Prof Victor Sapozhnikov Marine Ecology Laboratory, Russian Federal Research Institute of Fisheries and Oceanography Russia
Dr. Natali Movchan Ministry of ecology and natural resources Ukraine
Prof. Valery Michailov Ukraine Scientific Center of Sea Ecology Ukraine
Prof. Nina Novikova Laboratory of the Terrestrial ecosystems dynamics under water factor Russia
Dr. Sergey Mjagkov Central Asian Hydrometeorological Institut (SANIGMI) Uzbekistan
Dr Valeriy Lysenko department of georesearches of Institute of ecology and steady development Kazakhstan
Dr.Rowshan Mahmudov Caspian Center for Pollution Control Azerbaijan
Dr. Radu Mihnea Marine Pollution Monitoring Program Rumania
Dr. Svetoslav Chesmedjiev ‘Water Monitoring Department’-Executive Environmental Agency Bulgaria
Dr.Ylia Kopanina Ukrainian Institute for the Ecological Problems Ukraine
Dr.Lilian Mara Ministry of Water and Environmental Protection Romania

68 GIWA REGIONAL ASSESSMENT 24 ARAL SEA
I: Freshwater shortage
Environmental issues Score WeightEnvironmental
concern
Weight averaged
score
1. Modification of stream flow 3 N/a Freshwater shortage 2.9
2. Pollution of existing supplies 3 N/a
3. Changes in the water table 3 N/a
Criteria for Economics impacts Raw score Score Weight %
Size of economic or public sectors affectedVery small Very large0 1 2 3
N/a N/a
Degree of impact (cost, output changes etc.)Minimum Severe0 1 2 3
N/a N/a
Frequency/DurationOccasion/Short Continuous0 1 2 3
N/a N/a
Weight average score for Economic impacts 3.0
Criteria for Health impacts Raw score Score Weight %
Number of people affectedVery small Very large0 1 2 3
N/a N/a
Degree of severityMinimum Severe0 1 2 3
N/a N/a
Frequency/DurationOccasion/Short Continuous0 1 2 3
N/a N/a
Weight average score for Health impacts 2.8
Criteria for Other social and community impacts
Raw score Score Weight %
Number and/or size of community affectedVery small Very large0 1 2 3
N/a N/a
Degree of severityMinimum Severe0 1 2 3
N/a N/a
Frequency/DurationOccasion/Short Continuous0 1 2 3
N/a N/a
Weight average score for Other social and community impacts 2.3
N/a = Not applied
Annex II Detailed scoring tables
II: Pollution
Environmental issues Score WeightEnvironmental
concern
Weight averaged
score
4. Microbiological 0 N/a Pollution 2.5
5. Eutrophication 1 N/a
6. Chemical 3 N/a
7. Suspended solids 1 N/a
8. Solid wastes 2 N/a
9. Thermal 1 N/a
10. Radionuclides 1 N/a
11. Spills 1 N/a
Criteria for Economics impacts Raw score Score Weight %
Size of economic or public sectors affectedVery small Very large0 1 2 3
N/a N/a
Degree of impact (cost, output changes etc.)Minimum Severe0 1 2 3
N/a N/a
Frequency/DurationOccasion/Short Continuous0 1 2 3
N/a N/a
Weight average score for Economic impacts 2.4
Criteria for Health impacts Raw score Score Weight %
Number of people affectedVery small Very large0 1 2 3
N/a N/a
Degree of severityMinimum Severe0 1 2 3
N/a N/a
Frequency/DurationOccasion/Short Continuous0 1 2 3
N/a N/a
Weight average score for Health impacts 2.8
Criteria for Other social and community impacts
Raw score Score Weight %
Number and/or size of community affectedVery small Very large0 1 2 3
N/a N/a
Degree of severityMinimum Severe0 1 2 3
N/a N/a
Frequency/DurationOccasion/Short Continuous0 1 2 3
N/a N/a
Weight average score for Other social and community impacts 2.3
N/a = Not applied

ANNEXES 69
III: Habitat and community modification
Environmental issues Score WeightEnvironmental
concern
Weight averaged
score
12. Loss of ecosystems 2 N/aHabitat and community
modification2.4
13. Modification of ecosystems or ecotones, including community structure and/or species composition
3 N/a
Criteria for Economics impacts Raw score Score Weight %
Size of economic or public sectors affectedVery small Very large0 1 2 3
N/a N/a
Degree of impact (cost, output changes etc.)Minimum Severe0 1 2 3
N/a N/a
Frequency/DurationOccasion/Short Continuous0 1 2 3
N/a N/a
Weight average score for Economic impacts 2.4
Criteria for Health impacts Raw score Score Weight %
Number of people affectedVery small Very large0 1 2 3
N/a N/a
Degree of severityMinimum Severe0 1 2 3
N/a N/a
Frequency/DurationOccasion/Short Continuous0 1 2 3
N/a N/a
Weight average score for Health impacts 2.4
Criteria for Other social and community impacts
Raw score Score Weight %
Number and/or size of community affectedVery small Very large0 1 2 3
N/a N/a
Degree of severityMinimum Severe0 1 2 3
N/a N/a
Frequency/DurationOccasion/Short Continuous0 1 2 3
N/a N/a
Weight average score for Other social and community impacts 2.3
N/a = Not applied
IV: Unsustainable exploitation of fish and other living resources
Environmental issues Score Weight %Environmental
concern
Weight averaged
score
14. Overexploitation 0 N/aUnsustainable
exploitation of fish0
15. Excessive by-catch and discards
0 N/a
16. Destructive fishing practices 0 N/a
17. Decreased viability of stock through pollution and disease
0 N/a
18. Impact on biological and genetic diversity
0 N/a
Criteria for Economics impacts Raw score Score Weight %
Size of economic or public sectors affectedVery small Very large0 1 2 3
N/a N/a
Degree of impact (cost, output changes etc.)Minimum Severe0 1 2 3
N/a N/a
Frequency/DurationOccasion/Short Continuous0 1 2 3
N/a N/a
Weight average score for Economic impacts 0
Criteria for Health impacts Raw score Score Weight %
Number of people affectedVery small Very large0 1 2 3
N/a N/a
Degree of severityMinimum Severe0 1 2 3
N/a N/a
Frequency/DurationOccasion/Short Continuous0 1 2 3
N/a N/a
Weight average score for Health impacts 0
Criteria for Other social and community impacts
Raw score Score Weight %
Number and/or size of community affectedVery small Very large0 1 2 3
N/a N/a
Degree of severityMinimum Severe0 1 2 3
N/a N/a
Frequency/DurationOccasion/Short Continuous0 1 2 3
N/a N/a
Weight average score for Other social and community impacts 0
N/a = Not applied

70 GIWA REGIONAL ASSESSMENT 24 ARAL SEA
V: Global change
Environmental issues Score WeightEnvironmental
concern
Weight averaged
score
19. Changes in the hydrological cycle 0 N/a Global change 1.0
20. Sea level change 1 N/a
21. Increased UV-B radiation as a result of ozone depletion
1 N/a
22. Changes in ocean CO2
source/sink function0 N/a
Criteria for Economics impacts Raw score Score Weight %
Size of economic or public sectors affectedVery small Very large0 1 2 3
N/a N/a
Degree of impact (cost, output changes etc.)Minimum Severe0 1 2 3
N/a N/a
Frequency/DurationOccasion/Short Continuous0 1 2 3
N/a N/a
Weight average score for Economic impacts 1.0
Criteria for Health impacts Raw score Score Weight %
Number of people affectedVery small Very large0 1 2 3
N/a N/a
Degree of severityMinimum Severe0 1 2 3
N/a N/a
Frequency/DurationOccasion/Short Continuous0 1 2 3
N/a N/a
Weight average score for Health impacts 1.0
Criteria for Other social and community impacts
Raw score Score Weight %
Number and/or size of community affectedVery small Very large0 1 2 3
N/a N/a
Degree of severityMinimum Severe0 1 2 3
N/a N/a
Frequency/DurationOccasion/Short Continuous0 1 2 3
N/a N/a
Weight average score for Other social and community impacts 1.0
N/a = Not applied
Comparative environmental and socio-economic impacts of each GIWA concernTypes of impacts
ConcernEnvironmental score Economic score Human health score Social and community score
Overall score RankPresent (a) Future (b) Present (a) Future (b) Present (a) Future (b) Present (a) Future (b)
Freshwater shortage 3.0 3.0 3.0 3.0 2.8 3.0 2.3 3.0 2.9 1
Pollution 2.4 3.0 2.4 2.0 2.8 3.0 2.3 2.0 2.5 2
Habitat and community modification
2.4 2.4 2.4 2.4 2.4 2.4 2.3 2.4 2.4 3
Unsustainable exploitation of fish and other living resources
0 0 0 0 0 0 0 0 0 5
Global change 1.0 1.0 1.0 1.0 1.0 1.0 1.0 1.0 1.0 4

ANNEXES 71
Annex III List of important water-related projects
Projects action in the region
Aral Sea Basin Capacity Development Project (1996 - ongoing)
http://www.resource.nl/uk/projecten
Aral Sea Basin Project (fi nancing by The World Bank and The
Ministry for Foreign Aff airs of Finland.) Duration 1995-1997
Aral Sea Geographic Information System http://www.dfd.dlr.de/
Environment in Central Asia 2000. Region environmental report on
the Aral Sea Basin http://www.grida.no/aral/aralsea/index.htm
The Aral Sea Area Programme (ASAP) http://www.msf.org/aralsea/
Aral Sea sustainable water management 1993
Water and Environmental Management Project of the Aral Sea
Basin Programme (World Bank September 1998 - June 2003)
http://www4.worldbank.org/sprojects/


GLOBAL INTERNATIONAL WATERS ASSESSMENT i
The Global International Waters Assessment
This report presents the results of the Global International Waters
Assessment (GIWA) of the transboundary waters of the Aral Sea
region. This and the subsequent chapter off er a background that
describes the impetus behind the establishment of GIWA, its
objectives and how the GIWA was implemented.
The need for a global international waters assessment
Globally, people are becoming increasingly aware of the degradation of
the world’s water bodies. Disasters from fl oods and droughts, frequently
reported in the media, are considered to be linked with ongoing global
climate change (IPCC 2001), accidents involving large ships pollute public
beaches and threaten marine life and almost every commercial fi sh stock
is exploited beyond sustainable limits - it is estimated that the global
stocks of large predatory fi sh have declined to less that 10% of pre-
industrial fi shing levels (Myers & Worm 2003). Further, more than 1 billion
people worldwide lack access to safe drinking water and 2 billion people
lack proper sanitation which causes approximately 4 billion cases of
diarrhoea each year and results in the death of 2.2 million people, mostly
children younger than fi ve (WHO-UNICEF 2002). Moreover, freshwater
and marine habitats are destroyed by infrastructure developments,
dams, roads, ports and human settlements (Brinson & Malvárez 2002,
Kennish 2002). As a consequence, there is growing public concern
regarding the declining quality and quantity of the world’s aquatic
resources because of human activities, which has resulted in mounting
pressure on governments and decision makers to institute new and
innovative policies to manage those resources in a sustainable way
ensuring their availability for future generations.
Adequately managing the world’s aquatic resources for the benefi t of
all is, for a variety of reasons, a very complex task. The liquid state of
the most of the world’s water means that, without the construction
of reservoirs, dams and canals it is free to fl ow wherever the laws of
nature dictate. Water is, therefore, a vector transporting not only a
wide variety of valuable resources but also problems from one area
to another. The effl uents emanating from environmentally destructive
activities in upstream drainage areas are propagated downstream
and can aff ect other areas considerable distances away. In the case of
transboundary river basins, such as the Nile, Amazon and Niger, the
impacts are transported across national borders and can be observed
in the numerous countries situated within their catchments. In the case
of large oceanic currents, the impacts can even be propagated between
continents (AMAP 1998). Therefore, the inextricable linkages within
and between both freshwater and marine environments dictates that
management of aquatic resources ought to be implemented through
a drainage basin approach.
In addition, there is growing appreciation of the incongruence
between the transboundary nature of many aquatic resources and the
traditional introspective nationally focused approaches to managing
those resources. Water, unlike laws and management plans, does not
respect national borders and, as a consequence, if future management
of water and aquatic resources is to be successful, then a shift in focus
towards international cooperation and intergovernmental agreements
is required (UN 1972). Furthermore, the complexity of managing the
world’s water resources is exacerbated by the dependence of a great
variety of domestic and industrial activities on those resources. As a
consequence, cross-sectoral multidisciplinary approaches that integrate
environmental, socio-economic and development aspects into
management must be adopted. Unfortunately however, the scientifi c
information or capacity within each discipline is often not available or
is inadequately translated for use by managers, decision makers and
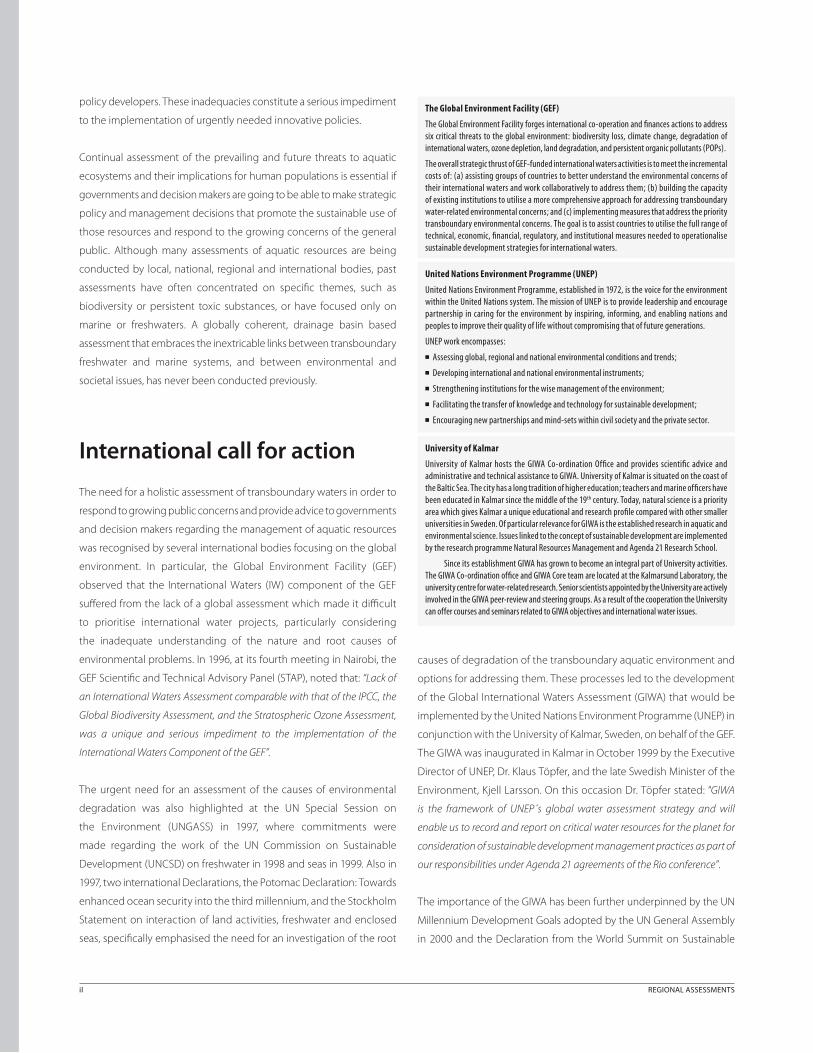
iI REGIONAL ASSESSMENTS
policy developers. These inadequacies constitute a serious impediment
to the implementation of urgently needed innovative policies.
Continual assessment of the prevailing and future threats to aquatic
ecosystems and their implications for human populations is essential if
governments and decision makers are going to be able to make strategic
policy and management decisions that promote the sustainable use of
those resources and respond to the growing concerns of the general
public. Although many assessments of aquatic resources are being
conducted by local, national, regional and international bodies, past
assessments have often concentrated on specifi c themes, such as
biodiversity or persistent toxic substances, or have focused only on
marine or freshwaters. A globally coherent, drainage basin based
assessment that embraces the inextricable links between transboundary
freshwater and marine systems, and between environmental and
societal issues, has never been conducted previously.
International call for action
The need for a holistic assessment of transboundary waters in order to
respond to growing public concerns and provide advice to governments
and decision makers regarding the management of aquatic resources
was recognised by several international bodies focusing on the global
environment. In particular, the Global Environment Facility (GEF)
observed that the International Waters (IW) component of the GEF
suff ered from the lack of a global assessment which made it diffi cult
to prioritise international water projects, particularly considering
the inadequate understanding of the nature and root causes of
environmental problems. In 1996, at its fourth meeting in Nairobi, the
GEF Scientifi c and Technical Advisory Panel (STAP), noted that: “Lack of
an International Waters Assessment comparable with that of the IPCC, the
Global Biodiversity Assessment, and the Stratospheric Ozone Assessment,
was a unique and serious impediment to the implementation of the
International Waters Component of the GEF”.
The urgent need for an assessment of the causes of environmental
degradation was also highlighted at the UN Special Session on
the Environment (UNGASS) in 1997, where commitments were
made regarding the work of the UN Commission on Sustainable
Development (UNCSD) on freshwater in 1998 and seas in 1999. Also in
1997, two international Declarations, the Potomac Declaration: Towards
enhanced ocean security into the third millennium, and the Stockholm
Statement on inter action of land activities, freshwater and enclosed
seas, specifi cally emphasised the need for an investigation of the root
causes of degradation of the transboundary aquatic environment and
options for addressing them. These pro cesses led to the development
of the Global International Waters Assessment (GIWA) that would be
implemented by the United Nations Environment Programme (UNEP) in
conjunction with the University of Kalmar, Sweden, on behalf of the GEF.
The GIWA was inaugurated in Kalmar in October 1999 by the Executive
Director of UNEP, Dr. Klaus Töpfer, and the late Swedish Minister of the
Environment, Kjell Larsson. On this occasion Dr. Töpfer stated: “GIWA
is the framework of UNEP´s global water assessment strategy and will
enable us to record and report on critical water resources for the planet for
consideration of sustainable development management practices as part of
our responsibilities under Agenda 21 agreements of the Rio conference”.
The importance of the GIWA has been further underpinned by the UN
Millennium Development Goals adopted by the UN General Assembly
in 2000 and the Declaration from the World Summit on Sustainable
The Global Environment Facility (GEF)
The Global Environment Facility forges international co-operation and fi nances actions to address six critical threats to the global environment: biodiversity loss, climate change, degradation of international waters, ozone depletion, land degradation, and persistent organic pollutants (POPs).
The overall strategic thrust of GEF-funded international waters activities is to meet the incremental costs of: (a) assisting groups of countries to better understand the environmental concerns of their international waters and work collaboratively to address them; (b) building the capacity of existing institutions to utilise a more comprehensive approach for addressing transboundary water-related environmental concerns; and (c) implementing measures that address the priority transboundary environmental concerns. The goal is to assist countries to utilise the full range of technical, economic, fi nancial, regulatory, and institutional measures needed to operationalise sustainable development strategies for international waters.
United Nations Environment Programme (UNEP)
United Nations Environment Programme, established in 1972, is the voice for the environment within the United Nations system. The mission of UNEP is to provide leadership and encourage partnership in caring for the environment by inspiring, informing, and enabling nations and peoples to improve their quality of life without compromising that of future generations.
UNEP work encompasses:
■ Assessing global, regional and national environmental conditions and trends;
■ Developing international and national environmental instruments;
■ Strengthening institutions for the wise management of the environment;
■ Facilitating the transfer of knowledge and technology for sustainable development;
■ Encouraging new partnerships and mind-sets within civil society and the private sector.
University of Kalmar
University of Kalmar hosts the GIWA Co-ordination Offi ce and provides scientifi c advice and administrative and technical assistance to GIWA. University of Kalmar is situated on the coast of the Baltic Sea. The city has a long tradition of higher education; teachers and marine offi cers have been educated in Kalmar since the middle of the 19th century. Today, natural science is a priority area which gives Kalmar a unique educational and research profi le compared with other smaller universities in Sweden. Of particular relevance for GIWA is the established research in aquatic and environmental science. Issues linked to the concept of sustainable development are implemented by the research programme Natural Resources Management and Agenda 21 Research School.
Since its establishment GIWA has grown to become an integral part of University activities. The GIWA Co-ordination offi ce and GIWA Core team are located at the Kalmarsund Laboratory, the university centre for water-related research. Senior scientists appointed by the University are actively involved in the GIWA peer-review and steering groups. As a result of the cooperation the University can offer courses and seminars related to GIWA objectives and international water issues.

GLOBAL INTERNATIONAL WATERS ASSESSMENT iII
Development in 2002. The development goals aimed to halve the
proportion of people without access to safe drinking water and basic
sanitation by the year 2015 (United Nations Millennium Declaration
2000). The WSSD also calls for integrated management of land, water and
living resources (WSSD 2002) and, by 2010, the Reykjavik Declaration on
Responsible Fisheries in the Marine Ecosystem should be implemented
by all countries that are party to the declaration (FAO 2001).
The conceptual framework and objectivesConsidering the general decline in the condition of the world’s aquatic
resources and the internationally recognised need for a globally
coherent assessment of transboundary waters, the primary objectives
of the GIWA are:
■ To provide a prioritising mechanism that allows the GEF to focus
their resources so that they are used in the most cost eff ective
manner to achieve signifi cant environmental benefi ts, at national,
regional and global levels; and
■ To highlight areas in which governments can develop and
implement strategic policies to reduce environmental degradation
and improve the management of aquatic resources.
In order to meet these objectives and address some of the current
inadequacies in international aquatic resources management, the GIWA
has incorporated four essential elements into its design:
■ A broad transboundary approach that generates a truly regional
perspective through the incorporation of expertise and existing
information from all nations in the region and the assessment of
all factors that infl uence the aquatic resources of the region;
■ A drainage basin approach integrating freshwater and marine
systems;
■ A multidisciplinary approach integrating environmental and socio-
economic information and expertise; and
■ A coherent assessment that enables global comparison of the
results.
The GIWA builds on previous assessments implemented within the GEF
International Waters portfolio but has developed and adopted a broader
defi nition of transboundary waters to include factors that infl uence the
quality and quantity of global aquatic resources. For example, due to
globalisation and international trade, the market for penaeid shrimps
has widened and the prices soared. This, in turn, has encouraged
entrepreneurs in South East Asia to expand aquaculture resulting in
the large-scale deforestation of mangroves for ponds (Primavera 1997).
Within the GIWA, these “non-hydrological” factors constitute as large
a transboundary infl uence as more traditionally recognised problems,
such as the construction of dams that regulate the fl ow of water into
a neighbouring country, and are considered equally important. In
addition, the GIWA recognises the importance of hydrological units that
would not normally be considered transboundary but exert a signifi cant
infl uence on transboundary waters, such as the Yangtze River in China
which discharges into the East China Sea (Daoji & Daler 2004) and the
Volga River in Russia which is largely responsible for the condition of
the Caspian Sea (Barannik et al. 2004). Furthermore, the GIWA is a truly
regional assessment that has incorporated data from a wide range of
sources and included expert knowledge and information from a wide
range of sectors and from each country in the region. Therefore, the
transboundary concept adopted by the GIWA extends to include
impacts caused by globalisation, international trade, demographic
changes and technological advances and recognises the need for
international cooperation to address them.
The organisational structure and implementation of the GIWAThe scale of the assessmentInitially, the scope of the GIWA was confi ned to transboundary waters
in areas that included countries eligible to receive funds from the GEF.
However, it was recognised that a truly global perspective would only
be achieved if industrialised, GEF-ineligible regions of the world were
also assessed. Financial resources to assess the GEF-eligible countries
were obtained primarily from the GEF (68%), the Swedish International
Development Cooperation Agency (Sida) (18%), and the Finnish
Department for International Development Cooperation (FINNIDA)
International waters and transboundary issues
The term ”international waters”, as used for the purposes of the GEF Operational Strategy, includes the oceans, large marine ecosystems, enclosed or semi-enclosed seas and estuaries, as well as rivers, lakes, groundwater systems, and wetlands with transboundary drainage basins or common borders. The water-related ecosystems associated with these waters are considered integral parts of the systems.
The term ”transboundary issues” is used to describe the threats to the aquatic environment linked to globalisation, international trade, demographic changes and technological advancement, threats that are additional to those created through transboundary movement of water. Single country policies and actions are inadequate in order to cope with these challenges and this makes them transboundary in nature.
The international waters area includes numerous international conventions, treaties, and agreements. The architecture of marine agreements is especially complex, and a large number of bilateral and multilateral agreements exist for transboundary freshwater basins. Related conventions and agreements in other areas increase the complexity. These initiatives provide a new opportunity for cooperating nations to link many different programmes and instruments into regional comprehensive approaches to address international waters.

iV REGIONAL ASSESSMENTS
(10%). Other contributions were made by Kalmar Municipality, the
University of Kalmar and the Norwegian Government. The assessment of
regions ineligible for GEF funds was conducted by various international
and national organisations as in-kind contributions to the GIWA.
In order to be consistent with the transboundary nature of many of the
world’s aquatic resources and the focus of the GIWA, the geographical
units being assessed have been designed according to the watersheds
of discrete hydrographic systems rather than political borders (Figure 1).
The geographic units of the assessment were determined during the
preparatory phase of the project and resulted in the division of the
world into 66 regions defi ned by the entire area of one or more
catchments areas that drains into a single designated marine system.
These marine systems often correspond to Large Marine Ecosystems
(LMEs) (Sherman 1994, IOC 2002).
Considering the objectives of the GIWA and the elements incorporated
into its design, a new methodology for the implementation of the
assessment was developed during the initial phase of the project. The
methodology focuses on fi ve major environmental concerns which
constitute the foundation of the GIWA assessment; Freshwater shortage,
Pollution, Habitat and community modifi cation, Overexploitation of fi sh
and other living resources, and Global change. The GIWA methodology
is outlined in the following chapter.
The global networkIn each of the 66 regions, the assessment is conducted by a team of
local experts that is headed by a Focal Point (Figure 2). The Focal Point
can be an individual, institution or organisation that has been selected
on the basis of their scientifi c reputation and experience implementing
international assessment projects. The Focal Point is responsible
for assembling members of the team and ensuring that it has the
necessary expertise and experience in a variety of environmental
and socio-economic disciplines to successfully conduct the regional
assessment. The selection of team members is one of the most critical
elements for the success of GIWA and, in order to ensure that the
most relevant information is incorporated into the assessment, team
members were selected from a wide variety of institutions such as
Large Marine Ecocsystems (LMEs)
Large Marine Ecosystems (LMEs) are regions of ocean space encompassing coastal areas from river basins and estuaries to the seaward boundaries of continental shelves and the outer margin of the major current systems. They are relatively large regions on the order of 200 000 km2 or greater, characterised by distinct: (1) bathymetry, (2) hydrography, (3) productivity, and (4) trophically dependent populations.
The Large Marine Ecosystems strategy is a global effort for the assessment and management of international coastal waters. It developed in direct response to a declaration at the 1992 Rio Summit. As part of the strategy, the World Conservation Union (IUCN) and National Oceanic and Atmospheric Administration (NOAA) have joined in an action program to assist developing countries in planning and implementing an ecosystem-based strategy that is focused on LMEs as the principal assessment and management units for coastal ocean resources. The LME concept is also adopted by GEF that recommends the use of LMEs and their contributing freshwater basins as the geographic area for integrating changes in sectoral economic activities.
Figure 1 The 66 transboundary regions assessed within the GIWA project.
1a
62
21
45b
2
53
40b
38
52
57
30
54
11
41
42
4242
45a
23
3
22
44
17
46
2434
39
43
49
64
36
65
5027
4
33
56
31
47
4747
55
51
40a40a
61
58
63
16
28
15
32
18
59
19
60
20
121413
66
1d
10
26
25
8
1c
9
37
6
5
7
1b
© GIWA 2005
a Russian Arctic ( LMEs)b Arctic Greenland (LME)c Arctic European/Atlanticd Arctic North American Gulf of Mexico (LME) Caribbean Sea (LME) Caribbean Islands (LME) Southeast Shelf (LME) Northeast Shelf (LME) Scotian Shelf (LME)
Gulf of St Lawrence Newfoundland Shelf (LME) Baffi n Bay, Labrador Sea,
Canadian Archipelago Barents Sea (LME) Norwegian Sea (LME) Faroe plateau Iceland Shelf (LME) East Greenland Shelf (LME) West Greenland Shelf (LME)
Baltic Sea (LME) North Sea (LME) Celtic-Biscay Shelf (LME) Iberian Coastal Sea (LME) North Africa and
Nile River Basin (LME) Black Sea (LME) Caspian Sea Aral Sea Gulf of Alaska (LME)
California Current (LME) Gulf of California (LME) Bering Sea (LME) Sea of Okhotsk (LME) Oyashio Current (LME) Kuroshio Current (LME) Sea of Japan (LME) Yellow Sea (LME) East China Sea (LME) Hawaiian Archipelago (LME)
Patagonian Shelf (LME) Brazil Current (LME)a Northeast Brazil
Shelf ( LMEs)b Amazon Canary Current (LME) Guinea Current (LME) Lake Chad Benguela Current (LME)a Agulhas Current (LME)
b Indian Ocean Islands Somali Coastal
Current (LME) East African Rift
Valley Lakes Red Sea and
Gulf of Aden (LME) Euphrates and
Tigris River Basin Jordan
Arabian Sea (LME) Bay of Bengal South China Sea ( LMEs) Mekong River Sulu-Celebes Sea (LME) Indonesian Seas (LME) North Australian
Shelf (LME) Coral Sea Basin Great Barrier Reef (LME)
Great Australian Bight Pacifi c Islands Tasman Sea Humboldt Current (LME) Eastern Equatorial
Pacifi c (LME) Antarctic (LME)

GLOBAL INTERNATIONAL WATERS ASSESSMENT v
universities, research institutes, government agencies, and the private
sector. In addition, in order to ensure that the assessment produces a
truly regional perspective, the teams should include representatives
from each country that shares the region.
In total, more than 1 000 experts have contributed to the implementation
of the GIWA illustrating that the GIWA is a participatory exercise that
relies on regional expertise. This participatory approach is essential
because it instils a sense of local ownership of the project, which
ensures the credibility of the fi ndings and moreover, it has created a
global network of experts and institutions that can collaborate and
exchange experiences and expertise to help mitigate the continued
degradation of the world’s aquatic resources.
GIWA Regional reports
The GIWA was established in response to growing concern among the
general public regarding the quality of the world’s aquatic resources
and the recognition of governments and the international community
concerning the absence of a globally coherent international waters
assessment. However, because a holistic, region-by-region, assessment
of the condition of the world’s transboundary water resources had never
been undertaken, a methodology guiding the implementation of such
an assessment did not exist. Therefore, in order to implement the GIWA,
a new methodology that adopted a multidisciplinary, multi-sectoral,
multi-national approach was developed and is now available for the
implementation of future international assessments of aquatic resources.
The GIWA is comprised of a logical sequence of four integrated
components. The fi rst stage of the GIWA is called Scaling and is a
process by which the geographic area examined in the assessment is
defi ned and all the transboundary waters within that area are identifi ed.
Once the geographic scale of the assessment has been defi ned, the
assessment teams conduct a process known as Scoping in which the
magnitude of environmental and associated socio-economic impacts
of Freshwater shortage, Pollution, Habitat and community modifi cation,
Unsustainable exploitation of fi sh and other living resources, and Global
change is assessed in order to identify and prioritise the concerns
that require the most urgent intervention. The assessment of these
predefi ned concerns incorporates the best available information and
the knowledge and experience of the multidisciplinary, multi-national
assessment teams formed in each region. Once the priority concerns
have been identifi ed, the root causes of these concerns are identifi ed
during the third component of the GIWA, Causal chain analysis. The root
causes are determined through a sequential process that identifi es, in
turn, the most signifi cant immediate causes followed by the economic
sectors that are primarily responsible for the immediate causes and
fi nally, the societal root causes. At each stage in the Causal chain
analysis, the most signifi cant contributors are identifi ed through an
analysis of the best available information which is augmented by the
expertise of the assessment team. The fi nal component of the GIWA is
the development of Policy options that focus on mitigating the impacts
of the root causes identifi ed by the Causal chain analysis.
The results of the GIWA assessment in each region are reported in
regional reports that are published by UNEP. These reports are designed
to provide a brief physical and socio-economic description of the
most important features of the region against which the results of the
assessment can be cast. The remaining sections of the report present
the results of each stage of the assessment in an easily digestible form.
Each regional report is reviewed by at least two independent external
reviewers in order to ensure the scientifi c validity and applicability of
each report. The 66 regional assessments of the GIWA will serve UNEP
as an essential complement to the UNEP Water Policy and Strategy and
UNEP’s activities in the hydrosphere.
Global International Waters Assessment
Steering Group
GIWA PartnersIGOs, NGOs,
Scientific institutions,private sector, etc
ThematicTask Teams
66 RegionalFocal Pointsand Teams
CoreTeam
Figure 2 The organisation of the GIWA project.
UNEP Water Policy and Strategy
The primary goals of the UNEP water policy and strategy are:
(a) Achieving greater global understanding of freshwater, coastal and marine environments by conducting environmental assessments in priority areas;
(b) Raising awareness of the importance and consequences of unsustainable water use;
(c) Supporting the efforts of Governments in the preparation and implementation of integrated management of freshwater systems and their related coastal and marine environments;
(d) Providing support for the preparation of integrated management plans and programmes for aquatic environmental hot spots, based on the assessment results;
(e) Promoting the application by stakeholders of precautionary, preventive and anticipatory approaches.

vI REGIONAL ASSESSMENTS
References:
AMAP (1998). Assessment Report: Arctic Pollution Issues. Arctic
Monitoring and Assessment Programme (AMAP), Oslo, Norway.
Barannik, V., Borysova, O. and Stolberg, F. (2004). The Caspian Sea Region:
Environmental Change. Ambio, 33:45-51.
Brinson, M.M. and Malvárez, A.I. (2002). Temperate freshwater wetlands:
types, status, and threats. Environmental Conservation, 29:115-133.
Daoji, L. and Daler, D. (2004). Ocean Pollution from Land-based Sources:
East China Sea, China. Ambio, 33:98-106.
FAO (2001). Reykjavik conference on responsible fi sheries in the marine
ecosystem. Iceland, 1-4 October 2001.
IOC (2002). IOC-IUCN-NOAA Consultative Meeting on Large Marine
Ecosystems (LMEs). Fourth Session, 8-9 January 2002, Paris,
France.
IPCC (2001). Climate Change 2001: The Scientifi c Basis. Contribution
of Working Group I to the Third Assessment Report of the
Intergovernmental Panel on Climate Change. In: Houghton,
J.T., Ding, Y., Griggs, D.J., Noguer, M., van der Linden, P.J., Dai, X.,
Maskell, K. and Johnson, C.A. (eds). Cambridge University Press,
Cambridge, United Kingdom and New York, NY, USA.
Kennish, M.J. (2002). Environmental threats and environmental future of
estuaries. Environmental Conservation, 29:78-107.
Myers, R.A. and Worm, B. (2003). Rapid worldwide depletion of predatory
fi sh communities. Nature, 423:280-283.
Primavera, J.H. (1997) Socio-economic impacts of shrimp culture.
Aquaculture Research, 28:815-827.
Sherman, K. (1994). Sustainability, biomass yields, and health of coastal
ecosystems: an ecological perspective. Marine Ecology Progress
Series, 112:277-301.
United Nations conference on the human environment (1972). Report
available on-line at http://www.unep.org
United Nations Millennium Declaration (2000). The Millennium
Assembly of the United Nations, New York.
WHO-UNICEF (2002). Global Water Supply and Sanitation Assessment:
2000 Report.
WSSD (2002). World Summit on Sustainable Development.
Johannesburg Summit 2002. Key Outcomes of the Summit,
UN Department of Public Information, New York.

THE GIWA METHODOLOGY vii
The specifi c objectives of the GIWA were to conduct a holistic and globally
comparable assessment of the world’s transboundary aquatic resources
that incorporated both environmental and socio-economic factors
and recognised the inextricable links between freshwater and marine
environments, in order to enable the GEF to focus their resources and to
provide guidance and advice to governments and decision makers. The
coalition of all these elements into a single coherent methodology that
produces an assessment that achieves each of these objectives had not
previously been done and posed a signifi cant challenge.
The integration of each of these elements into the GIWA methodology
was achieved through an iterative process guided by a specially
convened Methods task team that was comprised of a number of
international assessment and water experts. Before the fi nal version
of the methodology was adopted, preliminary versions underwent
an extensive external peer review and were subjected to preliminary
testing in selected regions. Advice obtained from the Methods task
team and other international experts and the lessons learnt from
preliminary testing were incorporated into the fi nal version that was
used to conduct each of the GIWA regional assessments.
Considering the enormous diff erences between regions in terms of the
quality, quantity and availability of data, socio-economic setting and
environmental conditions, the achievement of global comparability
required an innovative approach. This was facilitated by focusing
the assessment on the impacts of fi ve pre-defi ned concerns namely;
Freshwater shortage, Pollution, Habitat and community modifi cation,
Unsustainable exploitation of fi sh and other living resources and Global
change, in transboundary waters. Considering the diverse range of
elements encompassed by each concern, assessing the magnitude of
the impacts caused by these concerns was facilitated by evaluating the
impacts of 22 specifi c issues that were grouped within these concerns
(see Table 1).
The assessment integrates environmental and socio-economic data
from each country in the region to determine the severity of the
impacts of each of the fi ve concerns and their constituent issues on
the entire region. The integration of this information was facilitated by
implementing the assessment during two participatory workshops
that typically involved 10 to 15 environmental and socio-economic
experts from each country in the region. During these workshops, the
regional teams performed preliminary analyses based on the collective
knowledge and experience of these local experts. The results of these
analyses were substantiated with the best available information to be
presented in a regional report.
The GIWA methodology
Table 1 Pre-defi ned GIWA concerns and their constituent issues addressed within the assessment.
Environmental issues Major concerns
1. Modification of stream flow2. Pollution of existing supplies3. Changes in the water table
I Freshwater shortage
4. Microbiological5. Eutrophication6. Chemical7. Suspended solids8. Solid wastes9. Thermal10. Radionuclide11. Spills
II Pollution
12. Loss of ecosystems13. Modification of ecosystems or ecotones, including community
structure and/or species composition
III Habitat and community modification
14. Overexploitation15. Excessive by-catch and discards16. Destructive fishing practices17. Decreased viability of stock through pollution and disease18. Impact on biological and genetic diversity
IV Unsustainable exploitation of fish and other living resources
19. Changes in hydrological cycle20. Sea level change21. Increased uv-b radiation as a result of ozone depletion22. Changes in ocean CO
2 source/sink function
V Global change

viii REGIONAL ASSESSMENTS
The GIWA is a logical contiguous process that defi nes the geographic
region to be assessed, identifi es and prioritises particularly problems
based on the magnitude of their impacts on the environment and
human societies in the region, determines the root causes of those
problems and, fi nally, assesses various policy options that addresses
those root causes in order to reverse negative trends in the condition
of the aquatic environment. These four steps, referred to as Scaling,
Scoping, Causal chain analysis and Policy options analysis, are
summarised below and are described in their entirety in two volumes:
GIWA Methodology Stage 1: Scaling and Scoping; and GIWA Methodology:
Detailed Assessment, Causal Chain Analysis and Policy Options Analysis.
Generally, the components of the GIWA methodology are aligned
with the framework adopted by the GEF for Transboundary Diagnostic
Analyses (TDAs) and Strategic Action Programmes (SAPs) (Figure 1) and
assume a broad spectrum of transboundary infl uences in addition to
those associated with the physical movement of water across national
borders.
Scaling – Defining the geographic extent of the regionScaling is the fi rst stage of the assessment and is the process by which
the geographic scale of the assessment is defi ned. In order to facilitate
the implementation of the GIWA, the globe was divided during the
design phase of the project into 66 contiguous regions. Considering the
transboundary nature of many aquatic resources and the transboundary
focus of the GIWA, the boundaries of the regions did not comply with
political boundaries but were instead, generally defi ned by a large but
discrete drainage basin that also included the coastal marine waters into
which the basin discharges. In many cases, the marine areas examined
during the assessment coincided with the Large Marine Ecosystems
(LMEs) defi ned by the US National Atmospheric and Oceanographic
Administration (NOAA). As a consequence, scaling should be a
relatively straight-forward task that involves the inspection of the
boundaries that were proposed for the region during the preparatory
phase of GIWA to ensure that they are appropriate and that there are
no important overlaps or gaps with neighbouring regions. When the
proposed boundaries were found to be inadequate, the boundaries of
the region were revised according to the recommendations of experts
from both within the region and from adjacent regions so as to ensure
that any changes did not result in the exclusion of areas from the GIWA.
Once the regional boundary was defi ned, regional teams identifi ed all
the transboundary elements of the aquatic environment within the
region and determined if these elements could be assessed as a single
coherent aquatic system or if there were two or more independent
systems that should be assessed separately.
Scoping – Assessing the GIWA concernsScoping is an assessment of the severity of environmental and socio-
economic impacts caused by each of the fi ve pre-defi ned GIWA concerns
and their constituent issues (Table 1). It is not designed to provide an
exhaustive review of water-related problems that exist within each region,
but rather it is a mechanism to identify the most urgent problems in the
region and prioritise those for remedial actions. The priorities determined
by Scoping are therefore one of the main outputs of the GIWA project.
Focusing the assessment on pre-defi ned concerns and issues ensured
the comparability of the results between diff erent regions. In addition, to
ensure the long-term applicability of the options that are developed to
mitigate these problems, Scoping not only assesses the current impacts
of these concerns and issues but also the probable future impacts
according to the “most likely scenario” which considered demographic,
economic, technological and other relevant changes that will potentially
infl uence the aquatic environment within the region by 2020.
The magnitude of the impacts caused by each issue on the
environment and socio-economic indicators was assessed over the
entire region using the best available information from a wide range of
sources and the knowledge and experience of the each of the experts
comprising the regional team. In order to enhance the comparability
of the assessment between diff erent regions and remove biases
in the assessment caused by diff erent perceptions of and ways to
communicate the severity of impacts caused by particular issues, the
SAP
Scaling1stW
orkshop2
ndWorkshop
DetailedAssessm
ent
Scoping
Causal ChainAnalysis
Policy OptionAnalysis
TransboundaryDiagnosticAnalysis
SAP
The GIWA approach
Figure 1 Illustration of the relationship between the GIWA approach and other projects implemented within the GEF International Waters (IW) portfolio.
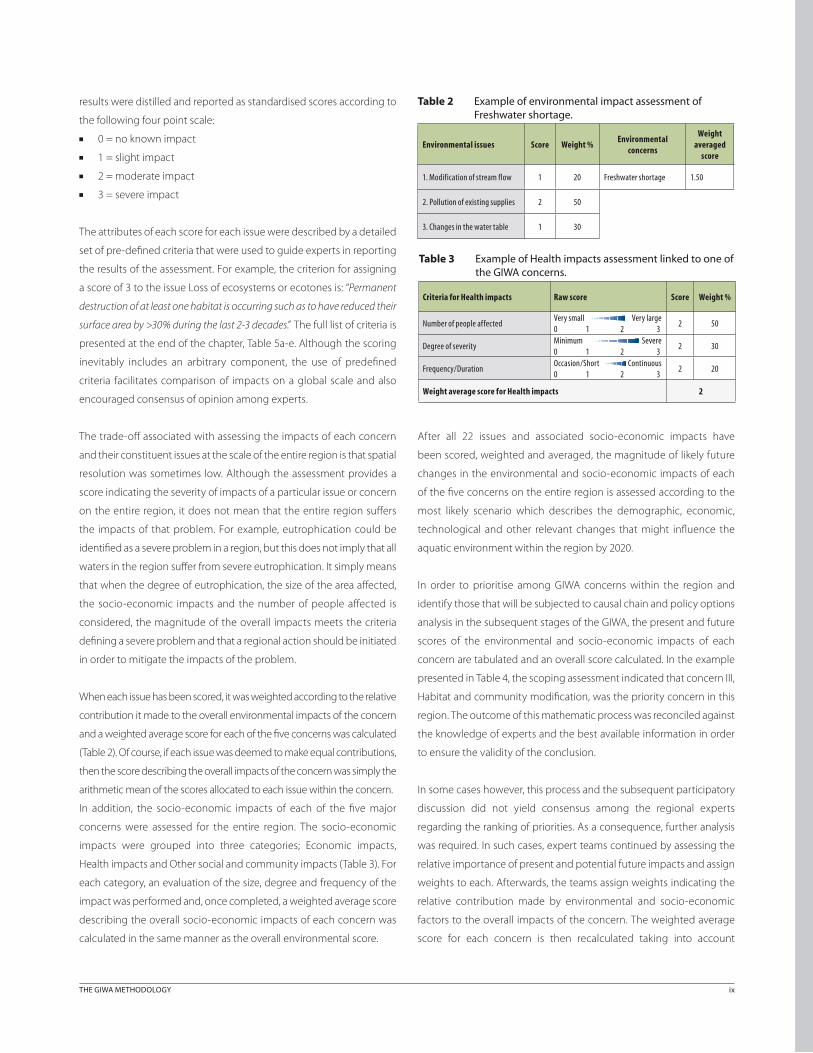
THE GIWA METHODOLOGY ix
results were distilled and reported as standardised scores according to
the following four point scale:
■ 0 = no known impact
■ 1 = slight impact
■ 2 = moderate impact
■ 3 = severe impact
The attributes of each score for each issue were described by a detailed
set of pre-defi ned criteria that were used to guide experts in reporting
the results of the assessment. For example, the criterion for assigning
a score of 3 to the issue Loss of ecosystems or ecotones is: “Permanent
destruction of at least one habitat is occurring such as to have reduced their
surface area by >30% during the last 2-3 decades”. The full list of criteria is
presented at the end of the chapter, Table 5a-e. Although the scoring
inevitably includes an arbitrary component, the use of predefi ned
criteria facilitates comparison of impacts on a global scale and also
encouraged consensus of opinion among experts.
The trade-off associated with assessing the impacts of each concern
and their constituent issues at the scale of the entire region is that spatial
resolution was sometimes low. Although the assessment provides a
score indicating the severity of impacts of a particular issue or concern
on the entire region, it does not mean that the entire region suff ers
the impacts of that problem. For example, eutrophication could be
identifi ed as a severe problem in a region, but this does not imply that all
waters in the region suff er from severe eutrophication. It simply means
that when the degree of eutrophication, the size of the area aff ected,
the socio-economic impacts and the number of people aff ected is
considered, the magnitude of the overall impacts meets the criteria
defi ning a severe problem and that a regional action should be initiated
in order to mitigate the impacts of the problem.
When each issue has been scored, it was weighted according to the relative
contribution it made to the overall environmental impacts of the concern
and a weighted average score for each of the fi ve concerns was calculated
(Table 2). Of course, if each issue was deemed to make equal contributions,
then the score describing the overall impacts of the concern was simply the
arithmetic mean of the scores allocated to each issue within the concern.
In addition, the socio-economic impacts of each of the fi ve major
concerns were assessed for the entire region. The socio-economic
impacts were grouped into three categories; Economic impacts,
Health impacts and Other social and community impacts (Table 3). For
each category, an evaluation of the size, degree and frequency of the
impact was performed and, once completed, a weighted average score
describing the overall socio-economic impacts of each concern was
calculated in the same manner as the overall environmental score.
After all 22 issues and associated socio-economic impacts have
been scored, weighted and averaged, the magnitude of likely future
changes in the environmental and socio-economic impacts of each
of the fi ve concerns on the entire region is assessed according to the
most likely scenario which describes the demographic, economic,
technological and other relevant changes that might infl uence the
aquatic environment within the region by 2020.
In order to prioritise among GIWA concerns within the region and
identify those that will be subjected to causal chain and policy options
analysis in the subsequent stages of the GIWA, the present and future
scores of the environmental and socio-economic impacts of each
concern are tabulated and an overall score calculated. In the example
presented in Table 4, the scoping assessment indicated that concern III,
Habitat and community modifi cation, was the priority concern in this
region. The outcome of this mathematic process was reconciled against
the knowledge of experts and the best available information in order
to ensure the validity of the conclusion.
In some cases however, this process and the subsequent participatory
discussion did not yield consensus among the regional experts
regarding the ranking of priorities. As a consequence, further analysis
was required. In such cases, expert teams continued by assessing the
relative importance of present and potential future impacts and assign
weights to each. Afterwards, the teams assign weights indicating the
relative contribution made by environmental and socio-economic
factors to the overall impacts of the concern. The weighted average
score for each concern is then recalculated taking into account
Table 3 Example of Health impacts assessment linked to one of the GIWA concerns.
Criteria for Health impacts Raw score Score Weight %
Number of people affectedVery small Very large0 1 2 3
2 50
Degree of severityMinimum Severe0 1 2 3
2 30
Frequency/DurationOccasion/Short Continuous0 1 2 3
2 20
Weight average score for Health impacts 2
Table 2 Example of environmental impact assessment of Freshwater shortage.
Environmental issues Score Weight %Environmental
concerns
Weight averaged
score
1. Modification of stream flow 1 20 Freshwater shortage 1.50
2. Pollution of existing supplies 2 50
3. Changes in the water table 1 30

x REGIONAL ASSESSMENTS
the relative contributions of both present and future impacts and
environmental and socio-economic factors. The outcome of these
additional analyses was subjected to further discussion to identify
overall priorities for the region.
Finally, the assessment recognises that each of the fi ve GIWA concerns
are not discrete but often interact. For example, pollution can destroy
aquatic habitats that are essential for fi sh reproduction which, in turn,
can cause declines in fi sh stocks and subsequent overexploitation. Once
teams have ranked each of the concerns and determined the priorities
for the region, the links between the concerns are highlighted in order
to identify places where strategic interventions could be applied to
yield the greatest benefi ts for the environment and human societies
in the region.
Causal chain analysisCausal Chain Analysis (CCA) traces the cause-eff ect pathways from the
socio-economic and environmental impacts back to their root causes.
The GIWA CCA aims to identify the most important causes of each
concern prioritised during the scoping assessment in order to direct
policy measures at the most appropriate target in order to prevent
further degradation of the regional aquatic environment.
Root causes are not always easy to identify because they are often
spatially or temporally separated from the actual problems they
cause. The GIWA CCA was developed to help identify and understand
the root causes of environmental and socio-economic problems
in international waters and is conducted by identifying the human
activities that cause the problem and then the factors that determine
the ways in which these activities are undertaken. However, because
there is no universal theory describing how root causes interact to
create natural resource management problems and due to the great
variation of local circumstances under which the methodology will
be applied, the GIWA CCA is not a rigidly structured assessment but
should be regarded as a framework to guide the analysis, rather than
as a set of detailed instructions. Secondly, in an ideal setting, a causal
chain would be produced by a multidisciplinary group of specialists
that would statistically examine each successive cause and study its
links to the problem and to other causes. However, this approach (even
if feasible) would use far more resources and time than those available
to GIWA1. For this reason, it has been necessary to develop a relatively
simple and practical analytical model for gathering information to
assemble meaningful causal chains.
Conceptual model
A causal chain is a series of statements that link the causes of a problem
with its eff ects. Recognising the great diversity of local settings and the
resulting diffi culty in developing broadly applicable policy strategies,
the GIWA CCA focuses on a particular system and then only on those
issues that were prioritised during the scoping assessment. The
starting point of a particular causal chain is one of the issues selected
during the Scaling and Scoping stages and its related environmental
and socio-economic impacts. The next element in the GIWA chain is
the immediate cause; defi ned as the physical, biological or chemical
variable that produces the GIWA issue. For example, for the issue of
eutrophication the immediate causes may be, inter alia:
■ Enhanced nutrient inputs;
■ Increased recycling/mobilisation;
■ Trapping of nutrients (e.g. in river impoundments);
■ Run-off and stormwaters
Once the relevant immediate cause(s) for the particular system has
(have) been identifi ed, the sectors of human activity that contribute
most signifi cantly to the immediate cause have to be determined.
Assuming that the most important immediate cause in our example
had been increased nutrient concentrations, then it is logical that the
most likely sources of those nutrients would be the agricultural, urban
or industrial sectors. After identifying the sectors that are primarily
Table 4 Example of comparative environmental and socio-economic impacts of each major concern, presently and likely in year 2020.
Types of impacts
ConcernEnvironmental score Economic score Human health score Social and community score
Overall scorePresent (a) Future (b) Present (c) Future (d) Present (e) Future (f) Present (g) Future (h)
Freshwater shortage 1.3 2.3 2.7 2.8 2.6 3.0 1.8 2.2 2.3
Pollution 1.5 2.0 2.0 2.3 1.8 2.3 2.0 2.3 2.0
Habitat and community modification
2.0 3.0 2.4 3.0 2.4 2.8 2.3 2.7 2.6
Unsustainable exploitation of fish and other living resources
1.8 2.2 2.0 2.1 2.0 2.1 2.4 2.5 2.1
Global change 0.8 1.0 1.5 1.7 1.5 1.5 1.0 1.0 1.2
1 This does not mean that the methodology ignores statistical or quantitative studies; as has already been pointed out, the available evidence that justifies the assumption of causal links should be provided in the assessment.

THE GIWA METHODOLOGY xi
responsible for the immediate causes, the root causes acting on those
sectors must be determined. For example, if agriculture was found to
be primarily responsible for the increased nutrient concentrations, the
root causes could potentially be:
■ Economic (e.g. subsidies to fertilisers and agricultural products);
■ Legal (e.g. inadequate regulation);
■ Failures in governance (e.g. poor enforcement); or
■ Technology or knowledge related (e.g. lack of aff ordable substitutes
for fertilisers or lack of knowledge as to their application).
Once the most relevant root causes have been identifi ed, an
explanation, which includes available data and information, of how
they are responsible for the primary environmental and socio-economic
problems in the region should be provided.
Policy option analysisDespite considerable eff ort of many Governments and other
organisations to address transboundary water problems, the evidence
indicates that there is still much to be done in this endeavour. An
important characteristic of GIWA’s Policy Option Analysis (POA) is that
its recommendations are fi rmly based on a better understanding of
the root causes of the problems. Freshwater scarcity, water pollution,
overexploitation of living resources and habitat destruction are very
complex phenomena. Policy options that are grounded on a better
understanding of these phenomena will contribute to create more
eff ective societal responses to the extremely complex water related
transboundary problems. The core of POA in the assessment consists
of two tasks:
Construct policy options
Policy options are simply diff erent courses of action, which are not
always mutually exclusive, to solve or mitigate environmental and
socio-economic problems in the region. Although a multitude of
diff erent policy options could be constructed to address each root
cause identifi ed in the CCA, only those few policy options that have
the greatest likelihood of success were analysed in the GIWA.
Select and apply the criteria on which the policy options will be
evaluated
Although there are many criteria that could be used to evaluate any
policy option, GIWA focuses on:
■ Eff ectiveness (certainty of result)
■ Effi ciency (maximisation of net benefi ts)
■ Equity (fairness of distributional impacts)
■ Practical criteria (political acceptability, implementation feasibility).
The policy options recommended by the GIWA are only contributions
to the larger policy process and, as such, the GIWA methodology
developed to test the performance of various options under the
diff erent circumstances has been kept simple and broadly applicable.
Global International Waters Assessment

xii REGIONAL ASSESSMENTS
Table 5a: Scoring criteria for environmental impacts of Freshwater shortageIssue Score 0 = no known impact Score 1 = slight impact Score 2 = moderate impact Score 3 = severe impact
Issue 1: Modification of stream flow“An increase or decrease in the discharge of streams and rivers as a result of human interventions on a local/regional scale (see Issue 19 for flow alterations resulting from global change) over the last 3-4 decades.”
■ No evidence of modification of stream flow.
■ There is a measurably changing trend in annual river discharge at gauging stations in a major river or tributary (basin > 40 000 km2); or
■ There is a measurable decrease in the area of wetlands (other than as a consequence of conversion or embankment construction); or
■ There is a measurable change in the interannual mean salinity of estuaries or coastal lagoons and/or change in the mean position of estuarine salt wedge or mixing zone; or
■ Change in the occurrence of exceptional discharges (e.g. due to upstream damming.
■ Significant downward or upward trend (more than 20% of the long term mean) in annual discharges in a major river or tributary draining a basin of >250 000 km2; or
■ Loss of >20% of flood plain or deltaic wetlands through causes other than conversion or artificial embankments; or
■ Significant loss of riparian vegetation (e.g. trees, flood plain vegetation); or
■ Significant saline intrusion into previously freshwater rivers or lagoons.
■ Annual discharge of a river altered by more than 50% of long term mean; or
■ Loss of >50% of riparian or deltaic wetlands over a period of not less than 40 years (through causes other than conversion or artificial embankment); or
■ Significant increased siltation or erosion due to changing in flow regime (other than normal fluctuations in flood plain rivers); or
■ Loss of one or more anadromous or catadromous fish species for reasons other than physical barriers to migration, pollution or overfishing.
Issue 2: Pollution of existing supplies“Pollution of surface and ground fresh waters supplies as a result of point or diffuse sources”
■ No evidence of pollution of surface and ground waters.
■ Any monitored water in the region does not meet WHO or national drinking water criteria, other than for natural reasons; or
■ There have been reports of one or more fish kills in the system due to pollution within the past five years.
■ Water supplies does not meet WHO or national drinking water standards in more than 30% of the region; or
■ There are one or more reports of fish kills due to pollution in any river draining a basin of >250 000 km2 .
■ River draining more than 10% of the basin have suffered polysaprobic conditions, no longer support fish, or have suffered severe oxygen depletion
■ Severe pollution of other sources of freshwater (e.g. groundwater)
Issue 3: Changes in the water table“Changes in aquifers as a direct or indirect consequence of human activity”
■ No evidence that abstraction of water from aquifers exceeds natural replenishment.
■ Several wells have been deepened because of excessive aquifer draw-down; or
■ Several springs have dried up; or■ Several wells show some salinisation.
■ Clear evidence of declining base flow in rivers in semi-arid areas; or
■ Loss of plant species in the past decade, that depend on the presence of ground water; or
■ Wells have been deepened over areas of hundreds of km2;or
■ Salinisation over significant areas of the region.
■ Aquifers are suffering salinisation over regional scale; or
■ Perennial springs have dried up over regionally significant areas; or
■ Some aquifers have become exhausted
Table 5b: Scoring criteria for environmental impacts of PollutionIssue Score 0 = no known impact Score 1 = slight impact Score 2 = moderate impact Score 3 = severe impact
Issue 4: Microbiological pollution“The adverse effects of microbial constituents of human sewage released to water bodies.”
■ Normal incidence of bacterial related gastroenteric disorders in fisheries product consumers and no fisheries closures or advisories.
■ There is minor increase in incidence of bacterial related gastroenteric disorders in fisheries product consumers but no fisheries closures or advisories.
■ Public health authorities aware of marked increase in the incidence of bacterial related gastroenteric disorders in fisheries product consumers; or
■ There are limited area closures or advisories reducing the exploitation or marketability of fisheries products.
■ There are large closure areas or very restrictive advisories affecting the marketability of fisheries products; or
■ There exists widespread public or tourist awareness of hazards resulting in major reductions in the exploitation or marketability of fisheries products.
Issue 5: Eutrophication“Artificially enhanced primary productivity in receiving water basins related to the increased availability or supply of nutrients, including cultural eutrophication in lakes.”
■ No visible effects on the abundance and distributions of natural living resource distributions in the area; and
■ No increased frequency of hypoxia1 or fish mortality events or harmful algal blooms associated with enhanced primary production; and
■ No evidence of periodically reduced dissolved oxygen or fish and zoobenthos mortality; and
■ No evident abnormality in the frequency of algal blooms.
■ Increased abundance of epiphytic algae; or■ A statistically significant trend in
decreased water transparency associated with algal production as compared with long-term (>20 year) data sets; or
■ Measurable shallowing of the depth range of macrophytes.
■ Increased filamentous algal production resulting in algal mats; or
■ Medium frequency (up to once per year) of large-scale hypoxia and/or fish and zoobenthos mortality events and/or harmful algal blooms.
■ High frequency (>1 event per year), or intensity, or large areas of periodic hypoxic conditions, or high frequencies of fish and zoobenthos mortality events or harmful algal blooms; or
■ Significant changes in the littoral community; or
■ Presence of hydrogen sulphide in historically well oxygenated areas.

THE GIWA METHODOLOGY xiii
Issue 6: Chemical pollution“The adverse effects of chemical contaminants released to standing or marine water bodies as a result of human activities. Chemical contaminants are here defined as compounds that are toxic or persistent or bioaccumulating.”
■ No known or historical levels of chemical contaminants except background levels of naturally occurring substances; and
■ No fisheries closures or advisories due to chemical pollution; and
■ No incidence of fisheries product tainting; and
■ No unusual fish mortality events.
If there is no available data use the following criteria:■ No use of pesticides; and■ No sources of dioxins and furans; and■ No regional use of PCBs; and■ No bleached kraft pulp mills using chlorine
bleaching; and■ No use or sources of other contaminants.
■ Some chemical contaminants are detectable but below threshold limits defined for the country or region; or
■ Restricted area advisories regarding chemical contamination of fisheries products.
If there is no available data use the following criteria:■ Some use of pesticides in small areas; or ■ Presence of small sources of dioxins or
furans (e.g., small incineration plants or bleached kraft/pulp mills using chlorine); or
■ Some previous and existing use of PCBs and limited amounts of PCB-containing wastes but not in amounts invoking local concerns; or
■ Presence of other contaminants.
■ Some chemical contaminants are above threshold limits defined for the country or region; or
■ Large area advisories by public health authorities concerning fisheries product contamination but without associated catch restrictions or closures; or
■ High mortalities of aquatic species near outfalls.
If there is no available data use the following criteria:■ Large-scale use of pesticides in agriculture
and forestry; or ■ Presence of major sources of dioxins or
furans such as large municipal or industrial incinerators or large bleached kraft pulp mills; or
■ Considerable quantities of waste PCBs in the area with inadequate regulation or has invoked some public concerns; or
■ Presence of considerable quantities of other contaminants.
■ Chemical contaminants are above threshold limits defined for the country or region; and
■ Public health and public awareness of fisheries contamination problems with associated reductions in the marketability of such products either through the imposition of limited advisories or by area closures of fisheries; or
■ Large-scale mortalities of aquatic species.
If there is no available data use the following criteria:
■ Indications of health effects resulting from use of pesticides; or
■ Known emissions of dioxins or furans from incinerators or chlorine bleaching of pulp; or
■ Known contamination of the environment or foodstuffs by PCBs; or
■ Known contamination of the environment or foodstuffs by other contaminants.
Issue 7: Suspended solids“The adverse effects of modified rates of release of suspended particulate matter to water bodies resulting from human activities”
■ No visible reduction in water transparency; and
■ No evidence of turbidity plumes or increased siltation; and
■ No evidence of progressive riverbank, beach, other coastal or deltaic erosion.
■ Evidently increased or reduced turbidity in streams and/or receiving riverine and marine environments but without major changes in associated sedimentation or erosion rates, mortality or diversity of flora and fauna; or
■ Some evidence of changes in benthic or pelagic biodiversity in some areas due to sediment blanketing or increased turbidity.
■ Markedly increased or reduced turbidity in small areas of streams and/or receiving riverine and marine environments; or
■ Extensive evidence of changes in sedimentation or erosion rates; or
■ Changes in benthic or pelagic biodiversity in areas due to sediment blanketing or increased turbidity.
■ Major changes in turbidity over wide or ecologically significant areas resulting in markedly changed biodiversity or mortality in benthic species due to excessive sedimentation with or without concomitant changes in the nature of deposited sediments (i.e., grain-size composition/redox); or
■ Major change in pelagic biodiversity or mortality due to excessive turbidity.
Issue 8: Solid wastes“Adverse effects associated with the introduction of solid waste materials into water bodies or their environs.”
■ No noticeable interference with trawling activities; and
■ No noticeable interference with the recreational use of beaches due to litter; and
■ No reported entanglement of aquatic organisms with debris.
■ Some evidence of marine-derived litter on beaches; or
■ Occasional recovery of solid wastes through trawling activities; but
■ Without noticeable interference with trawling and recreational activities in coastal areas.
■ Widespread litter on beaches giving rise to public concerns regarding the recreational use of beaches; or
■ High frequencies of benthic litter recovery and interference with trawling activities; or
■ Frequent reports of entanglement/suffocation of species by litter.
■ Incidence of litter on beaches sufficient to deter the public from recreational activities; or
■ Trawling activities untenable because of benthic litter and gear entanglement; or
■ Widespread entanglement and/or suffocation of aquatic species by litter.
Issue 9: Thermal“The adverse effects of the release of aqueous effluents at temperatures exceeding ambient temperature in the receiving water body.”
■ No thermal discharges or evidence of thermal effluent effects.
■ Presence of thermal discharges but without noticeable effects beyond the mixing zone and no significant interference with migration of species.
■ Presence of thermal discharges with large mixing zones having reduced productivity or altered biodiversity; or
■ Evidence of reduced migration of species due to thermal plume.
■ Presence of thermal discharges with large mixing zones with associated mortalities, substantially reduced productivity or noticeable changes in biodiversity; or
■ Marked reduction in the migration of species due to thermal plumes.
Issue 10: Radionuclide“The adverse effects of the release of radioactive contaminants and wastes into the aquatic environment from human activities.”
■ No radionuclide discharges or nuclear activities in the region.
■ Minor releases or fallout of radionuclides but with well regulated or well-managed conditions complying with the Basic Safety Standards.
■ Minor releases or fallout of radionuclides under poorly regulated conditions that do not provide an adequate basis for public health assurance or the protection of aquatic organisms but without situations or levels likely to warrant large scale intervention by a national or international authority.
■ Substantial releases or fallout of radionuclides resulting in excessive exposures to humans or animals in relation to those recommended under the Basic Safety Standards; or
■ Some indication of situations or exposures warranting intervention by a national or international authority.
Issue 11: Spills“The adverse effects of accidental episodic releases of contaminants and materials to the aquatic environment as a result of human activities.”
■ No evidence of present or previous spills of hazardous material; or
■ No evidence of increased aquatic or avian species mortality due to spills.
■ Some evidence of minor spills of hazardous materials in small areas with insignificant small-scale adverse effects one aquatic or avian species.
■ Evidence of widespread contamination by hazardous or aesthetically displeasing materials assumed to be from spillage (e.g. oil slicks) but with limited evidence of widespread adverse effects on resources or amenities; or
■ Some evidence of aquatic or avian species mortality through increased presence of contaminated or poisoned carcasses on beaches.
■ Widespread contamination by hazardous or aesthetically displeasing materials from frequent spills resulting in major interference with aquatic resource exploitation or coastal recreational amenities; or
■ Significant mortality of aquatic or avian species as evidenced by large numbers of contaminated carcasses on beaches.
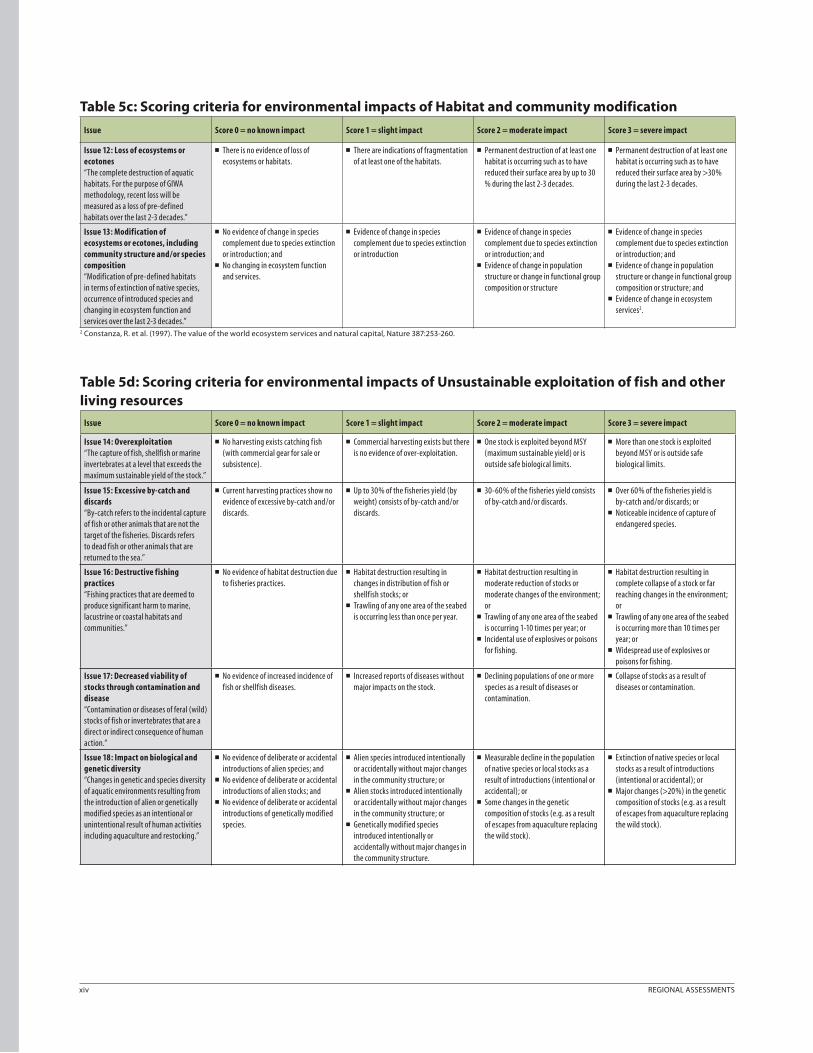
xiv REGIONAL ASSESSMENTS
Table 5c: Scoring criteria for environmental impacts of Habitat and community modification
Issue Score 0 = no known impact Score 1 = slight impact Score 2 = moderate impact Score 3 = severe impact
Issue 12: Loss of ecosystems or ecotones“The complete destruction of aquatic habitats. For the purpose of GIWA methodology, recent loss will be measured as a loss of pre-defined habitats over the last 2-3 decades.”
■ There is no evidence of loss of ecosystems or habitats.
■ There are indications of fragmentation of at least one of the habitats.
■ Permanent destruction of at least one habitat is occurring such as to have reduced their surface area by up to 30 % during the last 2-3 decades.
■ Permanent destruction of at least one habitat is occurring such as to have reduced their surface area by >30% during the last 2-3 decades.
Issue 13: Modification of ecosystems or ecotones, including community structure and/or species composition“Modification of pre-defined habitats in terms of extinction of native species, occurrence of introduced species and changing in ecosystem function and services over the last 2-3 decades.”
■ No evidence of change in species complement due to species extinction or introduction; and
■ No changing in ecosystem function and services.
■ Evidence of change in species complement due to species extinction or introduction
■ Evidence of change in species complement due to species extinction or introduction; and
■ Evidence of change in population structure or change in functional group composition or structure
■ Evidence of change in species complement due to species extinction or introduction; and
■ Evidence of change in population structure or change in functional group composition or structure; and
■ Evidence of change in ecosystem services2.
2 Constanza, R. et al. (1997). The value of the world ecosystem services and natural capital, Nature 387:253-260.
Table 5d: Scoring criteria for environmental impacts of Unsustainable exploitation of fish and other living resources
Issue Score 0 = no known impact Score 1 = slight impact Score 2 = moderate impact Score 3 = severe impact
Issue 14: Overexploitation“The capture of fish, shellfish or marine invertebrates at a level that exceeds the maximum sustainable yield of the stock.”
■ No harvesting exists catching fish (with commercial gear for sale or subsistence).
■ Commercial harvesting exists but there is no evidence of over-exploitation.
■ One stock is exploited beyond MSY (maximum sustainable yield) or is outside safe biological limits.
■ More than one stock is exploited beyond MSY or is outside safe biological limits.
Issue 15: Excessive by-catch and discards“By-catch refers to the incidental capture of fish or other animals that are not the target of the fisheries. Discards refers to dead fish or other animals that are returned to the sea.”
■ Current harvesting practices show no evidence of excessive by-catch and/or discards.
■ Up to 30% of the fisheries yield (by weight) consists of by-catch and/or discards.
■ 30-60% of the fisheries yield consists of by-catch and/or discards.
■ Over 60% of the fisheries yield is by-catch and/or discards; or
■ Noticeable incidence of capture of endangered species.
Issue 16: Destructive fishing practices“Fishing practices that are deemed to produce significant harm to marine, lacustrine or coastal habitats and communities.”
■ No evidence of habitat destruction due to fisheries practices.
■ Habitat destruction resulting in changes in distribution of fish or shellfish stocks; or
■ Trawling of any one area of the seabed is occurring less than once per year.
■ Habitat destruction resulting in moderate reduction of stocks or moderate changes of the environment; or
■ Trawling of any one area of the seabed is occurring 1-10 times per year; or
■ Incidental use of explosives or poisons for fishing.
■ Habitat destruction resulting in complete collapse of a stock or far reaching changes in the environment; or
■ Trawling of any one area of the seabed is occurring more than 10 times per year; or
■ Widespread use of explosives or poisons for fishing.
Issue 17: Decreased viability of stocks through contamination and disease“Contamination or diseases of feral (wild) stocks of fish or invertebrates that are a direct or indirect consequence of human action.”
■ No evidence of increased incidence of fish or shellfish diseases.
■ Increased reports of diseases without major impacts on the stock.
■ Declining populations of one or more species as a result of diseases or contamination.
■ Collapse of stocks as a result of diseases or contamination.
Issue 18: Impact on biological and genetic diversity“Changes in genetic and species diversity of aquatic environments resulting from the introduction of alien or genetically modified species as an intentional or unintentional result of human activities including aquaculture and restocking.”
■ No evidence of deliberate or accidental introductions of alien species; and
■ No evidence of deliberate or accidental introductions of alien stocks; and
■ No evidence of deliberate or accidental introductions of genetically modified species.
■ Alien species introduced intentionally or accidentally without major changes in the community structure; or
■ Alien stocks introduced intentionally or accidentally without major changes in the community structure; or
■ Genetically modified species introduced intentionally or accidentally without major changes in the community structure.
■ Measurable decline in the population of native species or local stocks as a result of introductions (intentional or accidental); or
■ Some changes in the genetic composition of stocks (e.g. as a result of escapes from aquaculture replacing the wild stock).
■ Extinction of native species or local stocks as a result of introductions (intentional or accidental); or
■ Major changes (>20%) in the genetic composition of stocks (e.g. as a result of escapes from aquaculture replacing the wild stock).

THE GIWA METHODOLOGY xv
Table 5e: Scoring criteria for environmental impacts of Global changeIssue Score 0 = no known impact Score 1 = slight impact Score 2 = moderate impact Score 3 = severe impact
Issue 19: Changes in hydrological cycle and ocean circulation“Changes in the local/regional water balance and changes in ocean and coastal circulation or current regime over the last 2-3 decades arising from the wider problem of global change including ENSO.”
■ No evidence of changes in hydrological cycle and ocean/coastal current due to global change.
■ Change in hydrological cycles due to global change causing changes in the distribution and density of riparian terrestrial or aquatic plants without influencing overall levels of productivity; or
■ Some evidence of changes in ocean or coastal currents due to global change but without a strong effect on ecosystem diversity or productivity.
■ Significant trend in changing terrestrial or sea ice cover (by comparison with a long-term time series) without major downstream effects on river/ocean circulation or biological diversity; or
■ Extreme events such as flood and drought are increasing; or
■ Aquatic productivity has been altered as a result of global phenomena such as ENSO events.
■ Loss of an entire habitat through desiccation or submergence as a result of global change; or
■ Change in the tree or lichen lines; or■ Major impacts on habitats or
biodiversity as the result of increasing frequency of extreme events; or
■ Changing in ocean or coastal currents or upwelling regimes such that plant or animal populations are unable to recover to their historical or stable levels; or
■ Significant changes in thermohaline circulation.
Issue 20: Sea level change“Changes in the last 2-3 decades in the annual/seasonal mean sea level as a result of global change.”
■ No evidence of sea level change. ■ Some evidences of sea level change without major loss of populations of organisms.
■ Changed pattern of coastal erosion due to sea level rise has became evident; or
■ Increase in coastal flooding events partly attributed to sea-level rise or changing prevailing atmospheric forcing such as atmospheric pressure or wind field (other than storm surges).
■ Major loss of coastal land areas due to sea-level change or sea-level induced erosion; or
■ Major loss of coastal or intertidal populations due to sea-level change or sea level induced erosion.
Issue 21: Increased UV-B radiation as a result of ozone depletion“Increased UV-B flux as a result polar ozone depletion over the last 2-3 decades.”
■ No evidence of increasing effects of UV/B radiation on marine or freshwater organisms.
■ Some measurable effects of UV/B radiation on behavior or appearance of some aquatic species without affecting the viability of the population.
■ Aquatic community structure is measurably altered as a consequence of UV/B radiation; or
■ One or more aquatic populations are declining.
■ Measured/assessed effects of UV/B irradiation are leading to massive loss of aquatic communities or a significant change in biological diversity.
Issue 22: Changes in ocean CO2
source/sink function“Changes in the capacity of aquatic systems, ocean as well as freshwater, to generate or absorb atmospheric CO
2 as a
direct or indirect consequence of global change over the last 2-3 decades.”
■ No measurable or assessed changes in CO
2 source/sink function of aquatic
system.
■ Some reasonable suspicions that current global change is impacting the aquatic system sufficiently to alter its source/sink function for CO
2.
■ Some evidences that the impacts of global change have altered the source/sink function for CO
2 of aquatic
systems in the region by at least 10%.
■ Evidences that the changes in source/sink function of the aquatic systems in the region are sufficient to cause measurable change in global CO
2
balance.


