gist 4302/5302: spatial analysis and modelingbu er, spatial query, overlay analysis (lab 2-3)...
TRANSCRIPT

GIST 4302/5302: Spatial Analysis and
ModelingLecture 2: Review of Map Projections and Intro to Spatial Analysis
Guofeng Caohttp://www.spatial.ttu.edu
Department of Geosciences
Texas Tech University
Spring 2020

Course Outline
2/27

Review of Map Projections
Map projections
• Elements in map projections• Datum (e.g., WGS84∼NAD 83, NAD 27)• Developable surfaces• Projection
• Distortions• shape (comformal), distance, area (equivalent), direction• distortions magnitude varies across a map• be careful of what you want to preserve
• A handy guide to a varieties of projections and their use: http:
//www.radicalcartography.net/index.html?projectionref,made by Bill Rankin
3/27
Mercator Projection
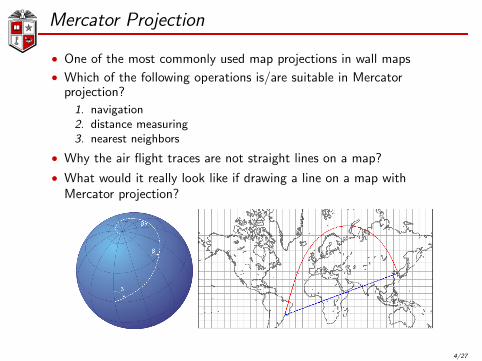
• One of the most commonly used map projections in wall maps
• Which of the following operations is/are suitable in Mercatorprojection?
1. navigation2. distance measuring3. nearest neighbors
• Why the air flight traces are not straight lines on a map?
• What would it really look like if drawing a line on a map withMercator projection?
4/27

Distortions of Mercator Projection
• It usually leads to distortions in terms of shape and area
• Online map websites (e.g., Google Maps, ArcGIS online) use WebMercator, a variant of Mercator projection
• Mercator puzzle:http://hive.sewanee.edu/pridepj0/286/mercatorMap.html
5/27

Mercator Projection
• Africa in Mercator projection
6/27

Mercator Projection
• In fact, area of Africa is about 14 times of Greenland
7/27

Mercator Projection
• In fact, Africa is as big as the United States, China, India, Japanand all of Europe combined
Figure: Image courtesy: Kai Krause
• Scene in TV show West Wing :https://www.youtube.com/watch?v=n8zBC2dvERM
8/27

Gall-Peters Projection
• Peters projection mentioned in the video
• Equal-area
9/27
Other Commonly Used Projections
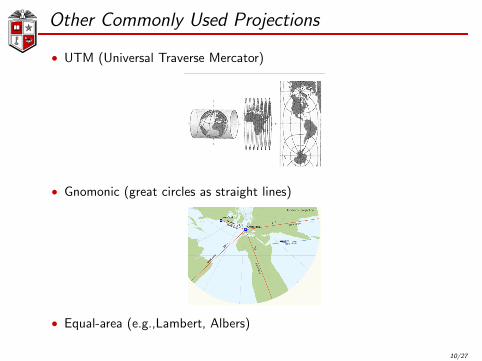
• UTM (Universal Traverse Mercator)
• Gnomonic (great circles as straight lines)
• Equal-area (e.g.,Lambert, Albers)
10/27

Cartogram
• County map of 2004 US presidential election result
11/27

Cartogram
• Equal-density cartogram of 2004 US presidential election result
Figure: Image courtesy: Gastner, Shalizi,and Newman
12/27
Cartogram
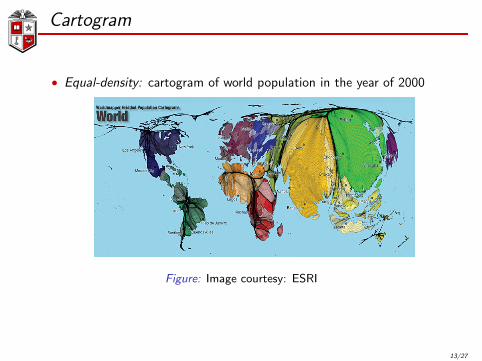
• Equal-density: cartogram of world population in the year of 2000
Figure: Image courtesy: ESRI
13/27
Measures and Map Projections
• Comparing results of volume measures (e.g., length and area) indifferent map projections http:
//servicesbeta.esri.com/demos/compareMeasurements.html
14/27

Maps Lie
Maps could lie, be citical when reading them!!
15/27

Introduction to Spatial Analysis and Modeling
16/27
Components of Spatial Analysis and Modeling
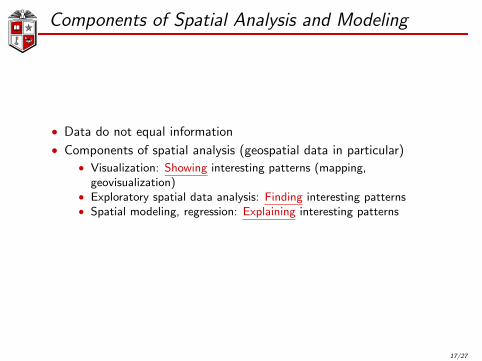
• Data do not equal information
• Components of spatial analysis (geospatial data in particular)• Visualization: Showing interesting patterns (mapping,
geovisualization)• Exploratory spatial data analysis: Finding interesting patterns• Spatial modeling, regression: Explaining interesting patterns
17/27
Scope of Spatial Analysis and Modeling
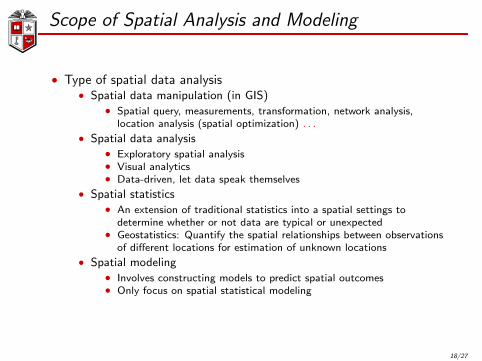
• Type of spatial data analysis• Spatial data manipulation (in GIS)
• Spatial query, measurements, transformation, network analysis,location analysis (spatial optimization) . . .
• Spatial data analysis• Exploratory spatial analysis• Visual analytics• Data-driven, let data speak themselves
• Spatial statistics• An extension of traditional statistics into a spatial settings to
determine whether or not data are typical or unexpected• Geostatistics: Quantify the spatial relationships between observations
of different locations for estimation of unknown locations
• Spatial modeling• Involves constructing models to predict spatial outcomes• Only focus on spatial statistical modeling
18/27

Topics
• Spatial data representation and manipulation• Buffer, spatial query, overlay analysis (lab 2-3)• Surface analysis and map algebra (lab 4)• Model builder (lab 5)• Geocoding (lab 6)
• Point pattern analysis (lab 7)
• Spatial statistics• Spatial autocorrelation (lab 8)• Spatial regression (lab 9)
• Spatial interpolation• Deterministic interpolation (lab 10)• Kriging (lab 10)
• Spatial uncertainty
19/27
Characteristics of (Geographic) Spatial Data
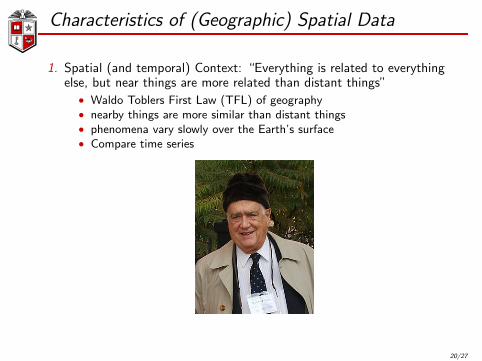
1. Spatial (and temporal) Context: “Everything is related to everythingelse, but near things are more related than distant things”
• Waldo Toblers First Law (TFL) of geography• nearby things are more similar than distant things• phenomena vary slowly over the Earth’s surface• Compare time series
20/27

Characteristics of (Geographic) Spatial Data
• Implication of Tobler’s First Law (TFL)• We can do samplings and fill the gap using estimation procedures
(e.g. weather stations)• Spatial patterns• Image a world without TFL:
• White noise• No lines, polygons or geometry (how to draw a polygon on a white
noise map?)
21/27

Characteristics of (Geographic) Spatial Data2. Spatial heterogeneity
• “Second law of geography” (Goodchild, UCGIS 2003)• Earths surface is non-stationary• Laws of physical sciences remain constant, virtually everything else
changes• Elevation,• Climate, temperatures• Social conditions
• Implications• Global model might be inconsistent with regional models• Spatial Simpsons Paradox (a special case of modifiable areal unit
problem, which we will discuss more in the later of this class)
22/27

Characteristics of (Geographic) Spatial Data
Side note: example of Simpson’s paradox
• Simpson’s paradox usually fools us on tests of performance in real life
• The following is a real life example. Comparison of recovery ratesbetween a new treatment and a traditional treatment for kidneystones.
New Treatment Traditional TreatmentSmall Stones 93%(81/87) 87%(234/270)Large Stones 73%(192/263) 69%(55/80)
All 78%(273/350) 83%(289/350)
• Comparison of batting average of two baseball players:
1996 1997 CombinedDerek Jeter 25.0%(12/48) 31.4%(183/582) 31.0%(195/630)
David Justice 25.3%(104/411) 32.1%(45/140) 27.0%(149/551)
23/27

Characteristics of (Geographic) Spatial Data
• In a spatial settings, it is related to modifiable areal unit problem(MAUP) or omitted variable problem, which will discuss more in thelater of this class
Figure: Image Courtesy of OpenShaw
24/27

Characteristics of (Geographic) Spatial Data3. Fractal behavior
• What happens as scale of map changes?• Coast of Maine
• Implications• Scale is critical for the problem of study• Volume of geographic features tends to be underestimated
• length of lines• area of polygons
• Think of the difference of distances that an ant and elephant neededto travel from where I stand to the center of memorial circle
25/27
Microscale or Macroscale
Please try to tell whether the following maps are micro- ormacro-scale:
• https://weather.com/science/news/
macro-or-micro-can-you-tell-these-images-apart-20131107
26/27

Characteristics of (Geographic) Spatial Data
Summary: three interrelated characteristics of spatial data
• Spatial context/spatial pattern/spatial structure/spatialdependence/spatial texture..
• Spatial heterogeneity/locality
• Fractal behaviors/scaling effects
27/27