gi systems and science january 23, 2012. points to cover what is spatial data modeling? entity...
TRANSCRIPT

DATA MODELING IN GIS
GI Systems and ScienceJanuary 23, 2012

Points to Cover What is spatial data modeling? Entity definition Topology Spatial data models
Raster data modelVector data model
Representing surfaces usingRaster approachVector approach

Spatial Data Modeling GIS are computer representations of the
real world These representations are necessarily
simplifiedOnly those aspects that are deemed important
are included The simplified representation of the real
world adopted by GIS is a modelSet of rules about how the spatial objects and
relationships between them should be represented

Spatial Data Modeling A GIS model can be conceptualized in
terms of two aspects:A model of spatial form: how
geographical features are represented A model of spatial processes: how
relationships between these features are represented
Building a model of the world for your GIS is a key stage in any GIS project
Formulating
research question
Collecting data
Creating data
model
Entering data into
a GIS

Spatial Data Modeling Creating a data model involves going
through a series of stages of data abstraction:Indentifying the spatial features form the real
world that are of interest in the context of the research question
Choosing how to represent the features (i.e., as points, lines or areas)
Choosing an appropriate spatial data model (i.e., raster or vector)
Selecting an appropriate spatial data structure to store the model within the computer
Formulating
research question
Collecting data
Creating data
model
Entering data into
a GIS

Entity Definition
Figure 3.2Source: Heywood et al., 2011

Entity Definition Surfaces
used to represent continuous features or phenomena
Figure 3.3Source: Heywood et al., 2011

Entity Definition Networks
used to represent a series of interconnected lines along which there a flow of data, objects or materials
Figure 3.5Source: Heywood et al., 2011

Entity Definition Issues associated with simplifying the
complexities of the real worldIdentification of the proper scale for
representation How much detail is required?
Dynamic nature of the real world How to select the most appropriate
representation of the feature? How to model change over time?
Identification of discrete and continuous features Fuzzy boundaries

Entity Definition Features with
fuzzy boundariesContinuous
canopy and open woodland
Figure 3.7Source: Heywood et al., 2011

Topology A geometric relationship between
objects located in spaceAdjacency
Features share a common boundaryContainment
A feature is completely located within another feature
Connectivity A features is linked to another feature
Independent of a coordinate system Independent of scale

Spatial Data Modeling Creating a data model involves going
through a series of stages of data abstraction:Indentifying the spatial features form the real
world that are of interest in the context of the research question
Choosing how to represent the features (i.e., as points, lines or areas)
Choosing an appropriate spatial data model (i.e., raster or vector)
Selecting an appropriate spatial data structure to store the model within the computer
Formulating
research question
Collecting data
Creating data
model
Entering data into
a GIS

Spatial Data Models Data models and corresponding data
structures provide the information the computer requires to construct the spatial data model in digital form
Two main ways in which computers can handle and display spatial entities:Raster approachVector approach

Spatial Data Models
Figure 3.8Source: Heywood et al., 2011
The raster data modelBased on principles of
tessellationCells are used as
building blocks to create images of features
The size of the cell defines the resolution (degree of precision) with which entities are represented
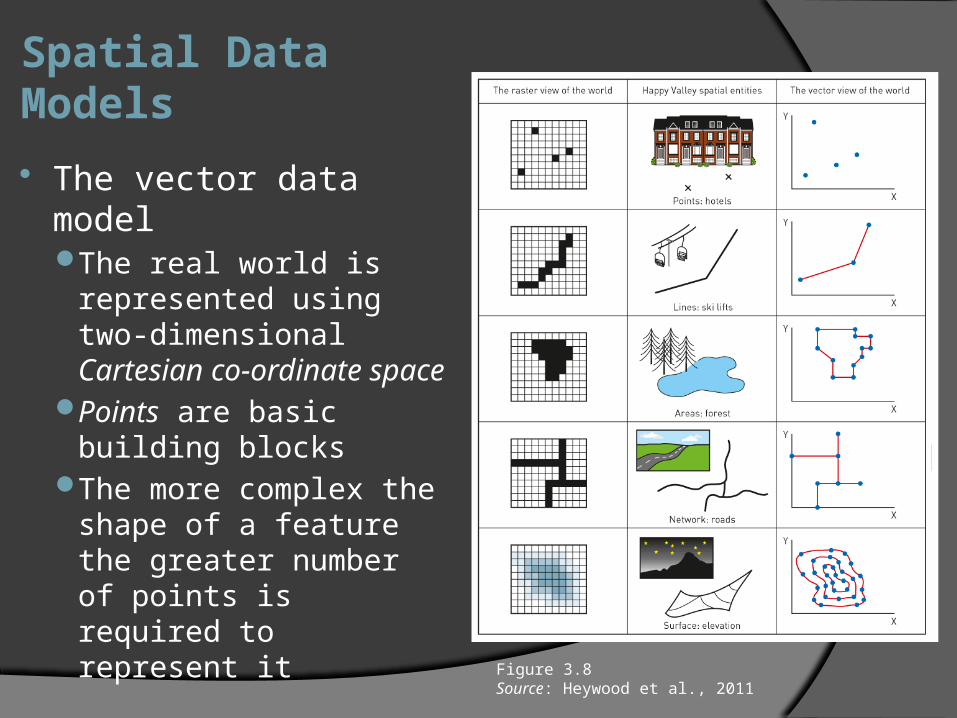
Spatial Data Models
Figure 3.8Source: Heywood et al., 2011
The vector data modelThe real world is
represented using two-dimensional Cartesian co-ordinate space
Points are basic building blocks
The more complex the shape of a feature the greater number of points is required to represent it
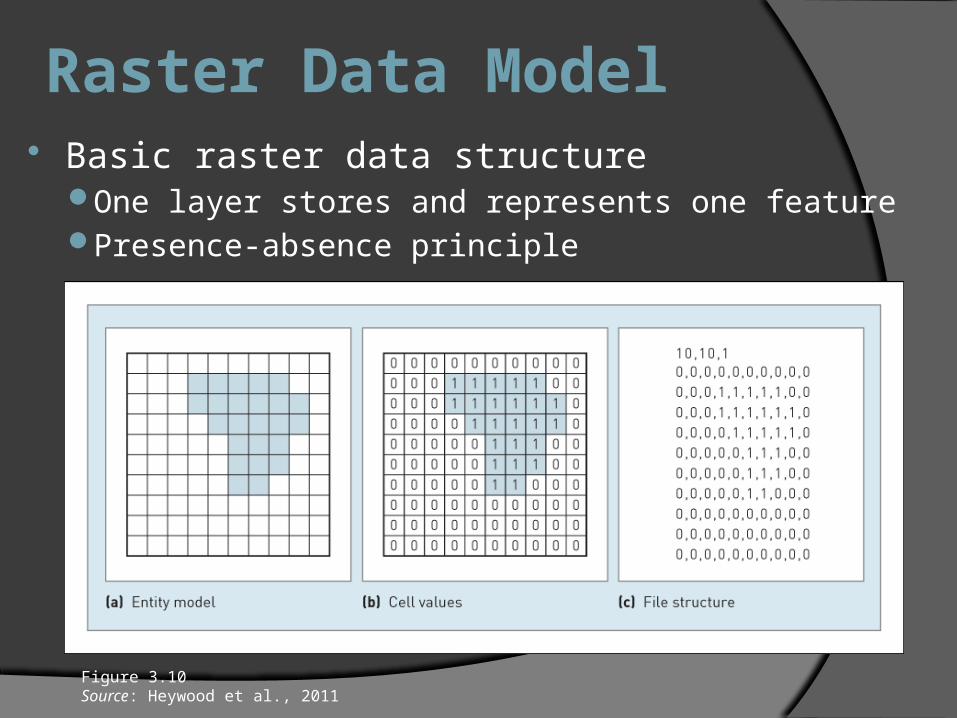
Raster Data Model Basic raster data structure
One layer stores and represents one featurePresence-absence principle
Figure 3.10 Source: Heywood et al., 2011

Raster Data Model Raster file structure for storing data on
several entities of the same type
Figure 3.11 Source: Heywood et al., 2011

Raster Data Model One of the major problems with raster
datasets is their sizeA value must be recorded and stored for each cell
in an image regardless of the complexity of the image
To address this problem a range of data compaction methods have been developedRun length encodingBlock codingChain codingQuadtree data structures

Raster Data Model Raster structure for storing data on several entities
of the same typeReduces data volume on a row by row basis
Figure 3.12(a) Source: Heywood et al., 2011

Vector Data Model Basic vector data structure
A file containing (x,y) co-ordinate pairs that represent the location of individual points
Figure 3.14(a) Source: Heywood et al., 2011

Vector Data Model Point dictionary
vector data structureAllows to avoid redundancy when
areal features share a boundary (are adjacent)
But does not really store information on topology Figure 3.14(b)
Source: Heywood et al., 2011
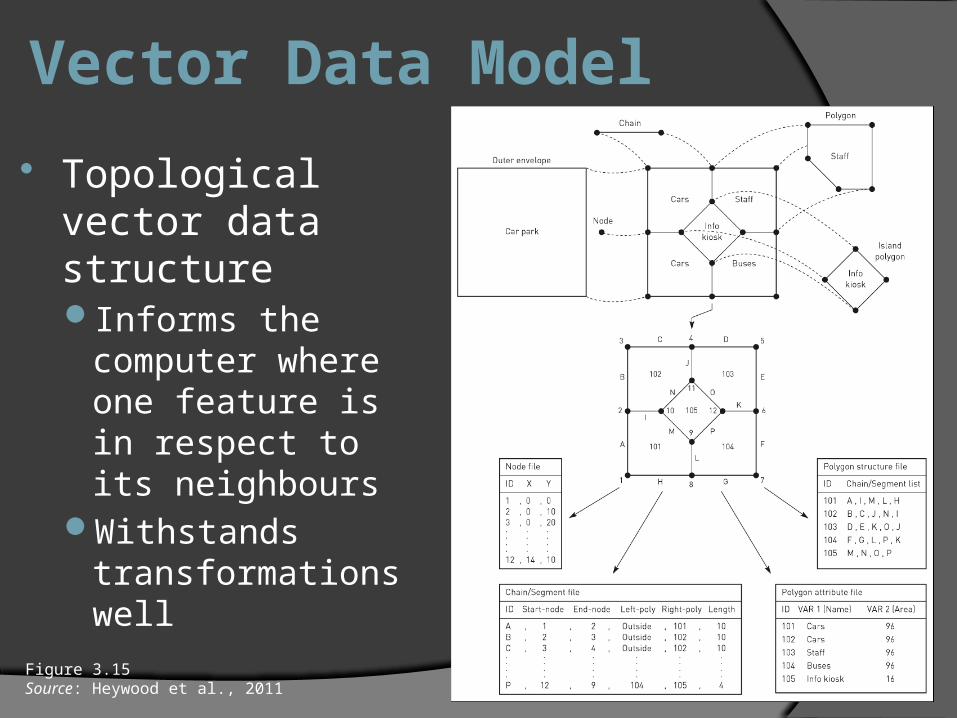
Vector Data Model
Topological vector data structureInforms the
computer where one feature is in respect to its neighbours
Withstands transformations well
Figure 3.15Source: Heywood et al., 2011

Vector Data Model All topological vector data structures
are designed to ensure that:Nodes and lines segments (arcs) are not
duplicatedArcs and nodes can be referenced to
more than one polygonAll polygons have unique identifiersIsland and hole polygons can be
adequately represented

Modeling Surfaces Surfaces represent continuous
features of phenomenaTheoretically have an infinite number of
data points A model of a surface approximates
continuous surface using a finite number of observationsThe issue of selecting a sufficient number
observations

Modeling Surfaces Digital Terrain Models (DTMs) are digital
datasets recreating topographic surfacesCreated from a series of (x,y,z) data pointsResolution is determined by the frequency of
observations usedAre derived from a number of data sources
Maps (low to moderate accuracy, all scales, selected coverage)
GPS (high accuracy, small areas) Aerial photographs (high accuracy, large areas)

Modeling Surfaces
Raster approachDTM is a grid of
height values Also known as Digital Elevation
Model (DEM) Each cell contains a value
representing the height of the terrain covered by the cell
Accuracy depends on the size of the cell and complexity of the surface
Figure 3.21Source: Heywood et al., 2011

Modeling Surfaces Vector approach
GridTriangulated
Irregular Network (TIN)○ Triangles provide
area, gradient and aspect of terrain
○ TINs use only surface significant points to reproduce a terrain surface
Figure 3.22Source: Heywood et al., 2011