gestation period of investment in croatia tourist and ... · gestation period of investment in...
TRANSCRIPT

452
Gestation Period Of Investment In Croatia Tourist And Catering Sector 1960-2000
Z. Šergo, Z. Tomčić, A. Poropat Abstract: The gestation period of investment in tourism may be defined as the period of capitalization of investment. In the paper, it is empirically examined the length of gestation period in the tourism industry in Croatia. The analysis cover 1960-2000 periods.
The production function with fixed coefficients, as defined in this paper, is: Y= K/v = p K where v is parameter of capital coefficient and p is reciprocal value of capital coefficient (or reciprocal output-capital ratio). Labour does not explicitly appear in the function, but it is assumed that this factor is disposable in quantities large enough to make tourist output possible. The above production function, with given technology, represents the case of strict complementarily of production function. If we specify the functional form in the finite lag model to be linear in the parameters, we estimated ∆ Yt = δ+β0It+ β1It-1,…, βmI t-m
Among the above relation, we choose the one capital coefficient with the best statistics. In that way, the length of gestation period of investment is discovered by econometric investigation (OLS method is used).
In this paper is used nonsample information about the distributed lag weights to improve the precision of estimation. It is assume that a polynomial of degree q = 2 is sufficiently flexible to represent the smooth pattern of lag weights. The average length of gestation period which by definition has a lagged impact on tourism output growth, for time lags of 1 to 8 years, is find in the first year. According to analysis the gestation period of gross investments in tourism is exceptionally short – investment in current year significantly affected the growth of domestic product of the same year throughout 1960-2000 periods.
The value of Durbin-Watson’ statistics is very close to the limiting value which indicates absence of significant autocorrelation in the model but R2 (0,20) shows weak representatively of the model. Even the fluctuations in gross tourist and catering investments about trend are positively correlated with the fluctuations in social product about trend (coefficient of correlation = 0,58), indicted procyclycal tendencies of gross investment. The assessed parameter for the t-period i.e. current period is also highly significant and represents the interval production coefficient. Its value of 0.164 represents the effect of one investment growth unit on an increase in the output of the Croatian tourism and catering industries. In other words, investments that affected an increase of production funds by one unit will have the increase in production by 0.164 units. The reciprocal value of the interval production coefficient in this case amounts to 6.09.

453
Key words: gestation period, gross investments, output, tourism and catering, distributive lag model, Croatia
Introduction
Dale Jorgenson was first who introduced new econometric methods for modelling gestation lags in the investment process. He discussed statistical methods for modelling gestations lags in 1966 paper, "Rational Distributed Lag Functions”. An important feature of the econometric model of investment expenditures presented in his work was gestation lags between the lags among intermediate stages of the investment process corresponding to anticipations of investment expenditures by business firms; he estimated the gestation lags at each stage of the process by representing them as distributed lag functions, based on the new econometric methodology he had designed for this purpose.
In similar way, Vukina analysed gestation lags in the investment process for each of the nineteen manufacturing industries of former Yugoslavia in the period 1952-1979 (but not specifying tourism and catering industries). As far as we know no one has yet established an estimate of gestation period of investments in the case of the Croatian tourism. One of the motives for publishing this work is the fulfilment of the vacuum in research of the gestation phenomena in the tourism and catering industries of Croatia. The prime objective is the calculation of gestation period of investments in tourism with the secondary being the calculation of the interval capital and marginal coefficient in tourism.
For more details on methodological problems and empirical results of the calculation of the capital and marginal coefficient in tourism see (Šergo, Tomčić, 1997; Šergo, Tomčić, 1998), and broader context (Šergo, Tomčić 2001).
The issue of efficiency of investments in tourism by calculating the marginal capital investments without a shift and with the four-year shift in 1977-1987 was also addressed by Spremić (1990). He noticed off-hand, probably not been familiar enough with the work by neither Jorgenson nor Vukina, that the gestation period of 4 years is the representative period for analysing the efficiency of investments. However, this arbitral estimate is non-consistent to theory of econometrics, which can be seen from this work.
The theoretical framework The term gestation period for investment has frequently been related in economic literature to the problem of calculating the capital or production coefficients. The capital coefficient is defined as ratio of capital goods used in production (hotels, auto-camps, apartments) and production size (a tourist product) that has resulted amongst others from their effects whereas production coefficient represents its reciprocal value. If it’s the matter of capital models where the presumed link between capital and products is in their entirety, the estimate of gestation period’s duration does not present a limiting factor. However, in those models for investment where the presumed link between investments and the annual production growth (differentiation in the size of tourism achievements) the choice of adequate macroeconomic aggregates impose the need for an increase in investment during or for duration of gestation period.
In brief, gestation period for investments in tourism can be defined as the time for capitalization of investments – from the beginning of an investment, its duration to the first

454
effects. The production and assembly of fixed assets (the construction of hotels, apartments, restaurants, swimming pools and other accommodation and catering units) requires a determined period of time that form the economic point of view cannot be disregarded and during which it is necessary to relieve a certain portion of investment funds for fixed assets (primarily investment loans) without their being in the function of production as yet.
The gestation period as the interval from the redemption of investments in tourism until the utilization of new capacities depends on the efficiency of the investment process and is the reflection of the producers’ behaviour (construction contractors and the so called investment “linked production”) on one side while on the other side is limited by production technology of the fixed assets themselves. Since the largest portion of investments involves buildings and equipment, the level of technical furnishing of hotels, the degree of productivity and the efficiency of labour organization in the construction and the corresponding industries for production of the equipment (furniture, thermal and other catering equipment) will effect the duration of gestation period.
If we treat tourism investments in fixed assets as expenditures for the current period in view of increasing the future production capacity (mainly accommodation units), then their purpose is fulfilled only should the increase in the number units and subsequent number of stays really occur consequently bringing about the increase in turnover of the annual macroeconomic indicators. In reality, a full accomplishment of targets was rarely achieved and if they were then this would happen rather slowly to say at least. Losses due to failed investments (never completed hotel constructions gaping for years), slow completion of construction and other inefficiencies in the construction investment are immanent in any sector of economy not sparing the Croatian tourism sector in its development. The beginning of the nineties saw disinvestments (1991 and 1992.) for the lack of new investments and even depreciation funding for replacement needing due to the war; it was not possible to depicted velocity (or growth rate indicated as log variable) of gross investment in first two year of war in Croatia (see Fig. 1). Fig. 1 Growth Of Tourist And Catering’s Output And Gross Investment In Croatia 1960-2000

455
0 5 10 15 20 25 30 35 40
1.25
1.5
1.75
2
2.25
2.5
0 5 10 15 20 25 30 35 40
log(GDP) LOG(INV)
Source: Author’s calculation
These reasons brought about needs for analytical approach to investment categorization in order to determine value that would have on one side an immediate effect on production growth and value of inactivated investments on the other. Not taking into account the above would lead to overestimating the size of investments by the margin of the current investment value while bringing forward their relationship with the growth of tourism product would be non-corresponding.
In economic literature we meet methods for calculating capital coefficient that do not set space between the period of investment and the period of production growth by the length of duration of gestation period, in other words where the category of the current investment is disregarded. Such method has certain logic because certain principles can be noticed in the relationship and movement of gross investment and the current investment, hence on the basis of these principles some tendencies can be predetermined. For instance, if investments grow than the current investments will grow too under presumption that the length of duration of t gestation period has not changed. This method is usually called in literature the method of concurrent marginal capital coefficients and its justification is found in the analysis of the efficiency of long-run investments since the inactivated investment category characterizes all periods of continuous economic development. Difficulties arise because neither the size nor the structure of inactivated investments is the same throughout the period
The fact that the current investment category is statistically difficult to capture the easiest approach to solving the above difficulties is by estimating the length of duration of gestation period. Since the production and investment processes are continuous in the economy, funds selected for tourism investments this year will capitalize and produce effects for tourism output

456
growth in years to come whereas the funds selected earlier for an increase in accommodation and alimentary capacities are affecting the tourism output of today.
Leontief (Fixed-Proportions) Technology in Tourism Industry Suppose that our particular production function in tourism Y = f(K, L) exhibits this fixed proportions property. In other words, let us suppose that to produce a single unit of tourism output, we need v units of capital and u units of labour. There is no flexibility in technique here. The coefficients v and u are the fixed input requirements in order to produce a single unit of output in tourism industry. Consequently, if we want to produce Y units of tourism’s output, we need vY units of capital and uY units of labor. In other words, K = vY are the capital requirements and L = uY are the labor requirements. As a result, the only technique is L/K = u/v. In other words, there is a particular fixed proportion of capital (hotels, auto-camps etc.) and labour (skilled and unskilled workers) required to produce output. An increase in either one of the factors by themselves without increasing the other proportionally will lead to absolutely no increase in tourism output.
The implied L-shaped isoquants of such a production function is well know (for more, see Barro & Salla-i-Martin, p. 43, 1998). Such a technology is referred to alternatively as "Fixed Proportions" or "No Replacement", or "Marx-Leontief" or "Walras-Cassel" or "Input-Output" technology (or some iteration there of). At any particular output level Y*, there is a necessary level of K* and L* which cannot be substituted. Note that these levels are determined purely technologically. Increasing only labour inputs (from L* to L’ for instance) will not result in any higher output.
Rather, the extra labour, without the extra capital to work with, will be entirely wasted (this assumption is very realistic in relatively undevelopment countries like Croatia was in pre-transition and (still is) transition period of economic development). The implication is that fixed-proportions technology is "no less than a formal rejection of the marginal productivity theory. The marginal productivity of any [factor] ... is zero." (Leontief, 1941, p.38). The production function for a no-substitute case can be written as: Y = min(K/v, L/u) (1)
Which is also referred to as a Leontief production function - as this form was introduced by Wassily Leontief (1941). Notice that if in two dimensional space K is at K* and L is at L’ , then K*/v < L’ /u. Thus, Y = K*/v. If so, then the technically efficient level of labour would, by definition, be where K*/v = L/u or L = (u/v)K* which is at L*. As a result, then we can easily note that the following holds all along the emarginated ray from the origin: Y/L = (1/v)K/L. (2)
This implies that the intensive production function, y = f (k) where y = Y/L and k = K/L is effectively a straight line with slope 1/v up to the capital-labour ratio k* = K*/L* and is horizontal thereafter.
The reasoning for the shape is clear enough. In intensive production function representations, it is as if we are holding labour constant and just increasing capital. Now, if the capital-labour ratio is precisely k* = K*/L*, thus the best one can do is produce y*. If we attempt to increase capital above K* (and thus increase the capital labour ratio above k*), output does not increase at all. Thus, the output-labour ratio remains unchanged at y*. However, if the capital

457
labour ratio falls below k*, it is as if we reduced capital while leaving labour the same. As we know from Leontief production functions, we must reduce output. Alternatively, we could a decline in k below k* as leaving capital unchanged and just increasing the amount of labour. In either case, the output-labour ratio declines below y*. Thus, starting from k = 0, then up to k*, the output-labour ratio increases at rate 1/v, while after k* it remains unchanged.
If we reduce second input (labour) as require factor because of labour increase in capital
constant condition has no impact on output growth than production function become a shape:
Y= K/v = p K (3) where v is parameter of capital coefficient and p is defined by reciprocal value of v and we called it productive coefficient. There don’t exist labour input L in explicit any form in previously productive function but we suppose that labour in tourism industry is endowment in available quantity, and there is not shortages which make possible smoothly growth of Y.
The above production function along with the presumed technology represents the case of strict complementariness between factors. It is the case of random function where the elasticity replacement between factors is equal to zero.
If we assume that the output and capital are continuous and time-differentiable function, by solving the total differential (2) in time, respectively we obtain: dY/dt = pdK/dt (4)
The term of the left side dY/dt represents growth of production as continues function in given time-interval, we can substitute dK/dt by investment term. Hence capital in each interval would increase if investment occurs in that time interval. The output increase between two discrete time units as difference Yt – Yt-1 that is indicated by ∆ Y (∆ is the difference operator: ∆ Y ≡ Yt – Yt-1. ∆ Y = p I (5)
The expression (5) does not depict reality as long as the time component is not introduced in the analysis. Namely, the established relationship between the production growth and investments in the same period represent only a specific case of no importance for majority of cases. That this is intuitively clear is when we take into account a fact that by rule there should be some time span between the moments of evidencing investments as financial assets until their transformation into accommodation capacities. Recently activated fixed assets will have effect on production growth. In this respect the relation between the production growth of tourism output and the investments in the expression (5) should be time fixed, in other words establish determined functional link between the growths of the output for the period of investment in time span from t to t-m.
Annually output differences by tourist and catering firms arise from investment expenditures decisions in prior periods. The actual output differences arising from any investment decision are observed over subsequent years as investment plans are finalized, materials and labour engaged in the investment project, and investment construction carried out. Thus, if I, is the

458
amount of gross investment observed at a particular time, we can be sure that the effects of that investment decision, in the form of output differences (∆ Y) will be distributed over periods t, t + 1, t
+ 2, and so on until the capital mean (hotel, auto-camp etc.) are liquidated. Furhermore, since a certain amount of "start-up" or gestation time is required for any investment project, we would not be surprised to see the first visible effects of the investment decision on output growth delayed or several years (marked by few first-on the raw insignificant coefficients by lagged investment parameters. Hence, the first most significant coefficient will indicate the most suitable interval productive coefficient.
Model Specification And Data Since gross investment expenditures at time t, designated by It affect output differences in the current and future periods (Yt, Yt+1,), until the appropriated projects are liquidated, we may say equivalently that current output differences delta yt, are a function of current and past investments It, It-1,…...... Furthermore, let us assert that after n years, where n is an unknown integer called the lag length, the effect of any investment expenditure decision on output differences is exhausted, so ∆ Yt = f(I t, It-1,…,It-m) (6)
Equation is an economic framework for a distributed lag model. It is finite as the duration of the lag effects is a finite period of time, namely, m periods. If we specify the functional form in the finite lag model to be linear in the parameters, we have ∆ Yt = δ+β0It+ β1It-1,…, βmI t-m (7) where δ is the intercept parameter, and βi; is the parameter, called a distributed lag weight, reflecting the effect of the level of investment in period t - i, i = 0, 1, n, on current output differences ∆ Yt.
To convert equation into a statistical model, we add a random disturbance et, and specify
its properties; we assume that e, has zero mean, has constant variance, and is not autocorrelated. In
this context the finite distributed lag statistical model is
∆ tntnttt IIIY εβββδ +++++= −− ...110 , t = n+1,….,T
The following production function is estimated using annual data (given in Tab. I); the data
considered covers the years 1960 to 2000 for the sect oral tourism output in Croatia. The data on output comes from national accounts system, as achieved tourism’s social product since 1960 to 1990, and tourism’s GDP from 1991 to 2000, data on investment flow used in tourism and catering sector were gross investment (which included both a new and replacement investments. Both time series are fixed at constant 1972 prices.
Tab. I Tourist Social Product And Gross Investment
(Value are given in fixed prices – 1972, thousands HRD)

459
TOURIST SOCIAL PRODUCT
OUTPUT DIFFERENCES ∆ Yt
GROSS INVESTMENT IN CROATIA’S TOURISM AND CATERING SECTOR IT
1960 144 45.1 1961 133 -11 15 1962 125 -8 40 1963 142 17 35 1964 152 10 69.5 1965 168 16 37 1966 180 12 35 1967 179 -1 100.2 1968 212 33 131.9 1969 243 31 170 1970 263 20 236.7 1971 285 22 254.5 1972 300 15 108.9 1973 308 8 57.2 1974 312 4 73.4 1975 317 5 76.7 1976 316 -1 111.1 1977 338 22 112.6 1978 361 23 97.3 1979 386 25 98.8 1980 398 12 93.7 1981 407 9 96.9 1982 418 11 113.8 1983 430 12 76.7 1984 458 28 109 1985 495 37 118.3 1986 468 -27 178.2 1987 453 -15 134.9 1988 488 35 66 1989 360 -128 60 1990 323 -37 57.4 1991 127 -196 -68 1992 125 -3 -60 1993 138 14 17

460
1994 183 44 19 1995 164 -19 25 1996 216 52 29 1997 255 39 34 1998 264 9 40 1999 258 -6 29 2000 316 58 20
Sources: SZS, Zagreb 2002
Results
A model on the basis of which the assessment of the length of duration of gestation period was conducted is based on the assumption that an increase in production in current year is affected by the action of investments in the same year, a year, two or more prior to that. The assumption that a certain time span should exist from the moment of planning and redemption of financial assets for investments to the beginning of action of these investments as active production funds is all the more realistic as this time span represents exactly the length of duration of gestation period.
We assumed that n = 8 periods are required to exhaust the tourist output differences (increase or decrease between two periods) effects of investment expenditures in tourism. Since the lag length n is actually an unknown constant we choose arbitrary n =8. The least squares parameter estimates, using the statistical model and data in Tab. III are given in Tab. I. Tab. II Estimated Interval Productive Coefficients By Distributed Lag Model
VARIABLE COEFFICIENTS STANDARD ERRORS
T-VALUE
P-VALUES
MARGINAL CAPITAL COEFFICIENT = 1/ INTERVAL PRODUCT COEFFICIENT
Const. 9,307 19,75 0,471 0,64 It 0,401 0,204 1,96 0,00 6,25 It-1 -0,315 0,302 -1,043 0,31 It-2 0,257 0,319 0,806 0,44 It-3 -0,397 0,324 -1,226 0,23 It-4 0,447 0,342 1,379 0,1 It-5 -0,753 0,316 -2,386 0,02 -1,328 It-6 0,445 0,306 1,457 0,16 It-7 -0,217 0,285 -0,762 0,45 It-8 0,086 0,195 0,438 0,66
R2 0,389 F-VALUE 1,417

461
DURBIN-WATSON
1,87
Source: Author’s calculation
The R2 for the estimated relation is 0,389 and the overall test value is 1,417. The statistical model "fits" the data on the low level and the F-test of the joint hypothesis-that all distributed lag weights (Ii = 0, i = 0,..., n-is accepted at the α =0,01 and α =0,05 level of significance. Because positive auto-correlation between residues, as indicate the Durbin-Watson test for first-order serial correlation in the residuals, furthermore we tried one more regression whit restricted least squares estimated of distributed lag weights. 1 Examining the parameter estimates themselves, we note several disquieting facts in first regression. First, only the lag weight before It-5 appear to be significantly different from zero based on individual t-tests. Second, the estimated lag weights in every two parametars are larger than the estimated lag weights before those periods. This does not agree with general agreement that the lag effects of investments should decrease with time and in the most distant periods should be small and approaching zero.
Multicollinearity of the lag-variables is not possible because of low R2. The first most significant coefficient indicates the most suitable interval productive coefficient (with respect to the result the interval productive coefficient, which is almost the most suitable one, is paradox ally discovered in the current period, hence investments in tourism have short gestation period or rather the lack of it since the financial effects are achieved in same year. Statistically speaking, even though the result is almost acceptable (the value t-statistics very close to 2) and since the obtained value of the coefficient is positive – the interval productive coefficient is 0.16 and MKK 6.25, the results is unacceptable from the aspect of catering industry. It is known that catering establishments can be built and furnished within one year, i.e. the construction can begin in autumn with gestation period the following summer. However, this result is less likely in hotel industry (hotels are planned longer and built until the gestation period). The first significant result that indicates the interval productive coefficient is more logical however more surprising from the time aspect of an investment’s gestation period – it has negative value of minus 0.753, the marginal capital coefficient calculated as reciprocal value of minus 1.328 whereas the average gestation period if investments in tourism industry according to the coefficient of criteria of significance is 5 years. It is interesting to know that during the period 1960-2000 on an tourist economy by calculating we have come across a first-class indication that the negative marginal coefficient (-1,328) according to which the additional investment unit in tourism resulted with 1,328 times loss unit of social product. The reasons are multiple: firstly, during the mid-eighties there was a fall of the domestic product due to the fall in tourism demand, followed by the “war shock” in the beginning of the nineties that caused a drastic fall in number of stays and the two year period of disinvestments (manifesting in negative values of gross investments). These atypical phenomena in the expected long-term growing trend of the domestic product based on tourism and investments effect negative linear functional link between the output differentiation and gross investments with a five-year shift.
1 The Durbin Watson (DW) indicates if there is any serial correlation in the residuals (i.e. in the difference between the actual value of the dependent variable and the value estimated with the model). Serial correlation means that a disturbance in one point in time influences the dependent variable also in the future. The DW should be around 2. If it is significantly below 2, this is a hint for a positive serial correlation, whereas negative serial correlation is present if the DW exceeds 2.
462
Following Almon (1965) we use nonsample information about the distributed lag weights to improve the precision of estimation. We imposed constraints on the parameters that conform to the notion that investment expenditures have their peak effect on output differences (or growth) after several years and then have slowly diminishing effects, finally disappearing at a lag of n+1 periods (βn+1. We assume that a polynomial of degree q = 2 is sufficiently flexible to represent the smooth pattern of lag weights. The estimate coefficients are restricted least squares estimates of distributed lag weights, and are constrained to fall on a polynomial of degree q=2. The restricted estimates of the distributed lag investments and their (restricted) standard errors are given in Tab. III. Somewhat poor result is obtained from the aspect of the model’s general reliability (lower R2), however the F value indicates that the hypothesis on null-value of all the coefficients can in this case be rejected hence our opinion that this model is better than in the case of the unrestricted distributed lag weights. Notice also that the standard errors of the estimates for these restricted estimates sβ are smaller than the standard errors of the unrestricted estimates, given in Tab. II,
reflecting the increased precision of estimation obtained by imposing polynomial constraints on the lag parameters.
We sought to identify the average length of gestation period, which by definition has a lagged impact on tourism output growth. In Tab. III, we show with bold letters for each time-lagged tourism investment as a coefficient of the regression that yields the most significant coefficient, for time lags of 1 to 8 years. The first time a significant product coefficient appears (similar to the earlier example which was on verge of significance) is in the current year. By being almost equal in value we can undoubtedly conclude that the gestation period of investments in tourism is exceptionally short – investment in current year significantly affected the growth of domestic product of the same year throughout 1960-2000 periods. This result is not surprising if we take into account that in gross investments the approximation of growth of fixed funds in tourism and catering industry is mot reliable for they grew in the amount which is less then the amount of depreciation.
The replacement is alimented by depreciation funds which in turn, in ascending sector such as tourism, must be higher than the fixed fund expenditures; in declining years (as the 1991 and 1992) depreciation was less than fixed assets’ expenditures, thus the difference represented dissipation of fixed funds i.e. disinvestments; for more details on this phenomenon see Horvat, B., (pp. 228-229). Since the gross investments in our empirical analysis contain effects of the replacement and of the investment maintenance it is obvious that new investments, having just the time lagged productive effect while being held as securities in terms of gross investments during the initial hotel expansion in the sixties and early seventies, probably declined. The short gestation period is not surprising given the ever increasing role of depreciation, which exhausted itself in the effects of exchange and investment maintenance, which by nature of things are higher than the current requirements and whose effects promptly reacted in the currant year with regard to an increase in the domestic product.
Besides, new investment, which was defined by net-concept during the nineties, has been virtually non-existent in Croatia’s tourism. If investments do not expand to linear path (as seen on picture) gross and net capital coefficients are distorted although regularly more on the gross than on the net basis. To conclude, the annotation is that net investments would produce longer gestation period.
Assuming the uniform growth of economy (in our case tourism-catering sector), constant technological-productive coefficients and the utilization of capacity, the determined gestation period and the length of duration of capital funds it has been proved that the marginal capital

463
coefficient on the basis of new investments with a gestation period shift make up a good approximation of the technological capital coefficient (Ibidem, 225). Since we were unable to find the replacement of capital data we have decided on the concept of gross investments.
Tab. III Estimated Interval Productive Coefficients By Restricted Least Squares Estimates Of Distributed Lag Weights
VARIABLE COEFFICIENTS STANDARD
ERRORS T-VALUE
P-VALUES
MARGINAL CAPITAL COEFFICIENT = 1/ INTERVAL PRODUCT COEFFICIENT
Const. 9,205 19,82 0,46 0,64 It 0,164 0,076 2,15 0,04 6,09 It-1 0,059 0,041 1,42 0,16 It-2 -0,019 0,039 -0,62 0,53 It-3 -0,071 0,036 -1,93 0,06 It-4 -0,095 0,041 -2,36 0,02 It-5 -0,093 0,036 -2,50 0,01 It-6 0,064 0,032 -1,98 0,05 It-7 -0,088 0,043 -0,20 0,84 It-8 0,074 0,077 0,95 0,34
R2 0,20 F-VALUE 2,335 DURBIN WATSON
1,94
Source: Author’s calculation
The value of Durbin-Watson’ statistics is very close to the limiting value which indicates absence of significant autocorrelation in the model. The assessed parameter for the t-period i.e. current period is also highly significant and represents the interval production coefficient. Its value of 0.164 represents the effect of one investment growth unit on an increase
in the output of the Croatian tourism and catering industries. In other words, investments that affected an increase of production funds by one unit will have the
increase in production by 0.164 units. The reciprocal value of the interval production coefficient in this case amounts to 6.09.
Discussion
The chosen optimal interval (in current period hence concurrent by definition) marginal capital coefficient 6.09 in the Croatian tourism in 1960-2000 does not
deviate much from the value of concurrent MKK 7.465. The MKK value is
464
calculated by the author in his earlier work (cf. Šergo, Tomčić, pp 1998) on the basis of unlagged distributions of capital funds in tourism as the exogenous variable
and social product as the endogenous variable for the period 1960-2000 for the Croatian tourism. This coincidence that arose despite different entrance variables in the model and the targeted values (in this work the primary plan for the analysis was
the calculation of gestation period of investments), which in the end derive a concurrent macroeconomic indicator, attests that the derived MKK indicator is
authentic. If the derived marginal capital coefficient in tourism is compared to the MKK
determined for the entire Croatian economy it will result in the tourism MKK being twice worse than at the economic level (3.432 according to Šergo's calculation and 3,674 according to Vukina's calculation – last author obtains results, besides the overall industry, of the MKK for 18 industry sectors but without (services sector)
tourism and catering. It is interesting to compare as to the efficiency of investing that four industrial sectors lag behind tourism and catering in Croatia, these are: electric-energetic, (MKK =8,39), coal and coke (MKK=10,42), black metallurgy (MKK=7,97),
colored metallurgy (MKK=12,23); relating to 1966 to 1979 period. However, it is only the electric, textile and leather industries that have the same 1-year gestation
period as that of the tourism. Since the period of return of an investment (and as the preferred criteria for
assessing cost-effectiveness of investments besides the calculation of internal rate of cost-effectiveness and the current nett value) is often related to shortness of
gestation period, results are not poor even though failing short of expectations from the domestic tourism.
In assessing the model, the limiting factor was the selection of gross investments as entrance values. Intuitively, it is clear that preparations for building, the implementation until the gestation of hotels, tourist villages is longer than one year.
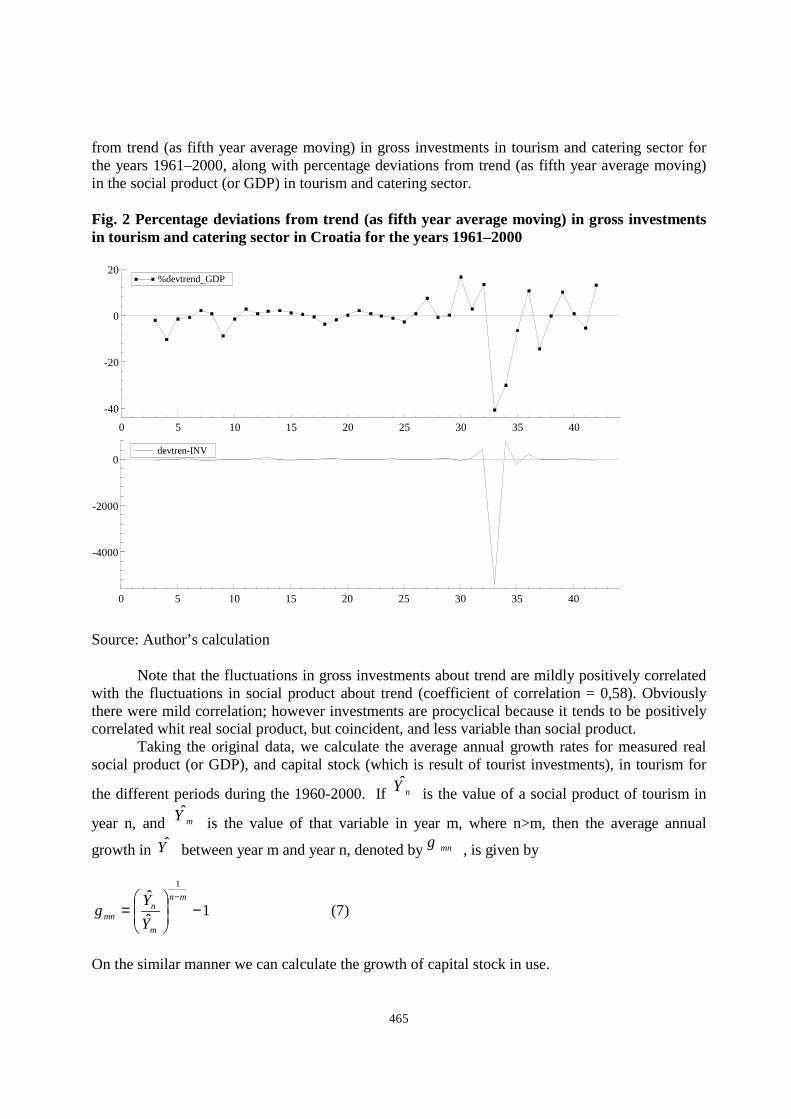
In our analysis the gross investments have give larger weight factor to, what we in Croatia called - ongoing investment maintenance and replacements of the production capacity than to residual category which used to be value of the new investment that are unique variable in generating enlarging effects on the accommodation capacities. In ultima linea only the new investments could increase the tourist and catering output (besides the increase of average day of stays or increase of consumption of tourists). The Cyclical Properties of gross investments and social products in tourism and catering sector Following the Real Business Cycle (RBC) literature we follow the standard practice of taking cross-correlation between social product (and GDP after 1990), and gross investment in tourism and catering sector. By doing so, we follow the majority of the RBC, and quote deviations and cross-correlations of the cyclical components. From Fig. 2 it is clear that there are cyclical fluctuations in both macro-variables about trend growth. In Fig. 2 we plot percentage deviations
465
from trend (as fifth year average moving) in gross investments in tourism and catering sector for the years 1961–2000, along with percentage deviations from trend (as fifth year average moving) in the social product (or GDP) in tourism and catering sector. Fig. 2 Percentage deviations from trend (as fifth year average moving) in gross investments in tourism and catering sector in Croatia for the years 1961–2000
0 5 10 15 20 25 30 35 40
-40
-20
0
20%devtrend_GDP
0 5 10 15 20 25 30 35 40
-4000
-2000
0devtren-INV
Source: Author’s calculation
Note that the fluctuations in gross investments about trend are mildly positively correlated with the fluctuations in social product about trend (coefficient of correlation = 0,58). Obviously there were mild correlation; however investments are procyclical because it tends to be positively correlated whit real social product, but coincident, and less variable than social product.
Taking the original data, we calculate the average annual growth rates for measured real social product (or GDP), and capital stock (which is result of tourist investments), in tourism for
the different periods during the 1960-2000. If nY is the value of a social product of tourism in
year n, and mY is the value of that variable in year m, where n>m, then the average annual
growth in Y between year m and year n, denoted bymng , is given by
1ˆ
ˆ1
−
=
−mn
m
nmn
Y
Yg (7)
On the similar manner we can calculate the growth of capital stock in use.
466
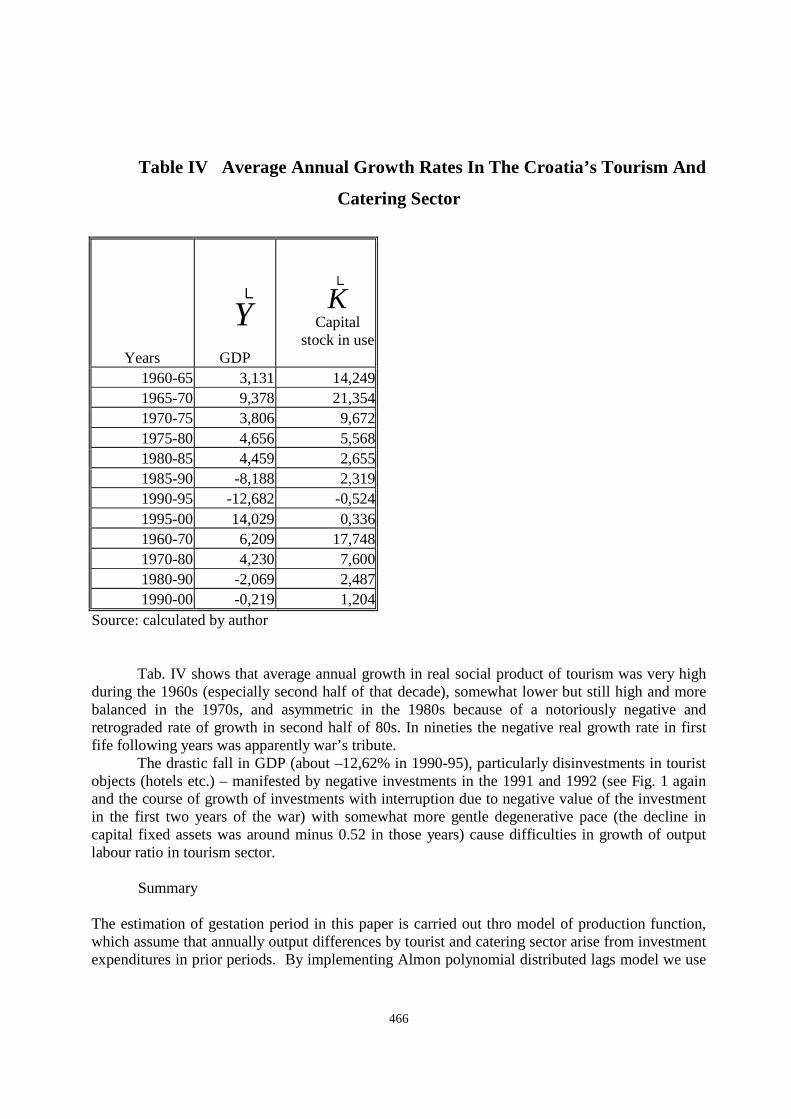
Table IV Average Annual Growth Rates In The Croatia’s Tourism And
Catering Sector
Years
Y)
GDP
K)
Capital
stock in use
1960-65 3,131 14,2491965-70 9,378 21,3541970-75 3,806 9,6721975-80 4,656 5,5681980-85 4,459 2,6551985-90 -8,188 2,3191990-95 -12,682 -0,5241995-00 14,029 0,3361960-70 6,209 17,7481970-80 4,230 7,6001980-90 -2,069 2,4871990-00 -0,219 1,204
Source: calculated by author
Tab. IV shows that average annual growth in real social product of tourism was very high during the 1960s (especially second half of that decade), somewhat lower but still high and more balanced in the 1970s, and asymmetric in the 1980s because of a notoriously negative and retrograded rate of growth in second half of 80s. In nineties the negative real growth rate in first fife following years was apparently war’s tribute.
The drastic fall in GDP (about –12,62% in 1990-95), particularly disinvestments in tourist objects (hotels etc.) – manifested by negative investments in the 1991 and 1992 (see Fig. 1 again and the course of growth of investments with interruption due to negative value of the investment in the first two years of the war) with somewhat more gentle degenerative pace (the decline in capital fixed assets was around minus 0.52 in those years) cause difficulties in growth of output labour ratio in tourism sector.
Summary The estimation of gestation period in this paper is carried out thro model of production function, which assume that annually output differences by tourist and catering sector arise from investment expenditures in prior periods. By implementing Almon polynomial distributed lags model we use
467
nonsample information about the distributed lag weights to improve the precision of estimation and obtained that the first most significant coefficient as the indicator of the most suitable interval productive coefficient is find in the first year. Hence, the average length of gestation period, which by definition has a lagged impact on tourism output growth, for time lags of 1 to 8 years, is only one year. The gestation period of gross investments in tourism is exceptionally short – because we used gross investment as explanatory variable (gross investment contain both depreciation and new investments); gross investment in current year significantly affected the growth of domestic product of the same year throughout 1960-2000 period. We can only intuitively conclude that the new investments in Croatia’s tourism and catering sector was very rare (a specially in 90's and because of that – simple replacement of capital goods as a phenomenon increase in structure of gross investment and hence took their weight in shortening of gestation period.
The Durbin-Watson’ statistics in Almon regression indicates absence of autocorrelation in the model but R2 shows weak representatively of the model. The fluctuations in gross tourist and catering investments about trend are positively correlated with the fluctuations in social product about trend (coefficient of correlation = 0,58), indicted procyclycal tendencies of gross investment. The assessed parameter for the t-period i.e. current period is also highly significant and represents the interval production coefficient. Its value of 0.164 represents the effect of one investment growth unit on an increase in the output of the Croatian tourism and catering industries. In other words, investments that effected an increase of production funds by one unit will have the increase in production by 0.164 units. The reciprocal value of the interval production coefficient in this case amounts to 6.09. Literature: BARRO, R., SALA-I-MARTIN, X. Economic growth, McGraw Hill, New York, 1998, ISBN 0-262-02459-4 BLAŽEVIĆ, B. Ekonomski računi plasmana kapitala u hrvatskom hotelijerstvu 1960-1990, Sveučilište u Rijeci, Hotelijerski fakultet Opatija, 1995, ISBN 953-6198-05-3 GRIFFITHS, W.E. & HILL, R.C. - JUDGE, G.G. Learning and Practicing Econometrics, New
York: John Wiley & Sons, Inc, 1993, ISBN 0471-51364-4
JORGENSON, D. Rational Distributed Lag Functions, Econometrica, 1966
HORVAT, B. Radna teorija cijena, Rad, Beograd, 1987, ISBN 86-09-00050-8
SPREMIĆ, I. Meñuzavisnost investicija i ekonomskog razvoja turizma i ugostiteljstva, Zbornik radova, Hotelska kuća 1990, Opatija 1990. PAKES, A., M. SCHANKERMAN “The Rate of Obsolescence of Patents, Research Gestation Lags, and the Private Rate of Return to Research Resources” , in Z. Griliches (ed), “R&D, Patents and Productivity”, Chicago: University of Chicago, 1984 ŠERGO, Z. & TOMČIĆ, Z. Analysis Of Croatian Tourism Capital Coefficient 1960-1990 , in Quo vadis management, Vukovič, Goran (ed) Fakultet za organizacijske vede, Kranj, 1997, pp.467-473, ISBN 03504077 ŠERGO, Z. & TOMČIĆ, Z. Konkurentna sposobnost turizma Republike Hrvatske u strategiji izvoza, in Tourism and hospitality management. 3 (1997), 2; pp.47-61, ISBN 02102989

468
ŠERGO, Z. & TOMČIĆ, Z. The Competitiveness And Concentration Of Export, And Production Efficiency (The Case Of Croatia), in Enterprise in Transition, Goić, Srećko (ed). Split : Faculty of Economics, University of Split, 2001, pp. 1747-1776, ISSN 445467 VUKINA, T. Aktivizacijski period investicija u industriji Jugoslavije, in Economic analysis and workers’ managament, volume XVI, 1982, Beograd, pp.273-286, YU ISSN 0013-3213 Software: SHAZAM Statistički godišnjak, Zavod za statistiku Republike Hrvatske, Zagreb, 2002. Dr. sc. Zdravko Šergo, INSTITUTE OF AGRICULTURE AND TOURISM, C. Huguesa 8, 51 440 Poreč, Croatia, E-mail: [email protected] Dr.sc. Zdenko TOMČIĆ, INSTITUTE OF AGRICULTURE AND TOURISM, C. Huguesa 8, 51 440 Poreč, Croatia, E-mail: [email protected] Dr.sc. Amorino Poropat, INSTITUTE OF AGRICULTURE AND TOURISM, C. Huguesa 8, 51 440 Poreč, Croatia, E-mail: [email protected]