geotechnical aspects of container port ... - surbana jurong...surbana jurong consultants pte ltd c....
TRANSCRIPT

Geotechnical Aspects of Container
Port Development
Y. D. Zhang, B. K. Liao & P. W. Lam, Surbana Jurong Consultants Pte Ltd C. F. Leung National University of Singapore
Paper was first published in GeoSS10 Conference (30 Nov – 1 Dec 2017)
ABSTRACT: This article presents the key geotechnical challenges related to gravity caisson
quay walls and soil improvement works on reclaimed land for container port development in
Singapore. The caisson foundation issues encountered in Jurong Formation are limestone
cavities, presence of sandwich soft soils and potential soil softening beneath sandkey trench.
Ground improvement using surcharge preloading and PVD is often implemented to accelerate
the primary settlement, reduce the residual settlement and enhance the ground stability for the
reclaimed land using various sources of filling materials.
1. HISTORICAL DEVELOPMENT OF CONTAINER PORT WHARF
FRONT STRUCTURES
When Sir Stamford Raffles first established a trading post in Singapore to further British
influence in the region in 1819, the port activities then started along the Singapore River. After
its independence, Singapore opened its first container port in Tanjong Pagar in 1972. The
terminal has three container berths and received the first container vessel from Rotterdam in
June 1972 with a cargo of 300 containers (Wong & Chng, 2016). To meet the increasing
trading volume over the years, the city terminals including the Tanjong Pagar Terminal, Keppel
Terminal and Brani Terminal were progressively developed from 1960s to 1990s.
With rapid growth in the number and size of container vessels, a big leap in the
provision of container port facilities was necessary to complement the existing
terminals. Pasir Panjang Terminal was then strategically developed as the new
container port since 1990s. The development of Pasir Panjang Terminal took place in
four stages. Phase 1 of the terminal kick-started in 1993, with both Phases 1 and 2
completed by 2010 while Phases 3 and 4 were completed by 2015.
Singapore's long term plan is to move all its container ports to Tuas South, see Figure 1. The
Tuas Terminal is being developed in four phases over 30 years. Phase 1 of the terminal is
scheduled to be completed by the early 2020s, able to handle about 20 million twenty-foot
equivalent units (TEUs) of cargoes annually. The entire Tuas Terminal could eventually handle

65 million TEUs of cargoes annually, nearly double what Singapore handled in 2016 (Kaur, 2017).
The design and capacity of the ports change significantly over the years due to rapid
increase in the cargo carrying capacity and dimensions of container vessels (Wong &
Chng, 2016). The development of the ports would have to take into account deeper draft of
container vessels and adequate wharf front capacity for loading, unloading and storage of
increasing cargo volumes brought by larger vessels. In addition, to accommodate these
larger container ships, quay cranes of a greater height and outreach span are needed to
move containers from the ship to the shore, see Figure 2.
Pile decks were commonly deployed as the wharf front structures in Singapore till early 1990s.
Since Pasir Panjang Terminal Phase 1, gravity caissons have been adopted as the wharf front
structures instead (Leung & Shen, 2008; Leung, 2014). Gravity caisson wharf front structures
provides more flexibility to the layout of the port, requires much lesser maintenance and is
comparable in cost when the water depth of port is deep and there is economies of scale for
caisson production. Geotechnically, it presents an advantage over pile deck in area such as
Pasir Panjang, where infilled limestone cavities of a few meters are present, as the large
caisson base spreads the heavy load allowing it to span over the cavities.
2. GRAVITY CAISSON WHARF FRONT STRUCTURES
Gravity caisson is a gravity-type retaining structure prefabricated on land or on a large
floating barge. The height and width of the caissons would be designed accordingly to
suit the actual site conditions and requirements (Loh et al., 2010). The caisson wharf
front structure system (Figure 3) comprises foundation, caisson structure, caisson infill,
reclamation fill and subsequent wharf decking and accessories.
The caisson structure and foundation shall be designed to withstand various loading cases
comprising loads during construction when the caisson is transported from land to the sea and
when it is being infilled and pre-loaded, as well as the loads under operation stage due to port
equipment and vessel berthing and mooring. The loadings arising from construction to port
operations will be transmitted to the foundation through the caisson via the underlying
compacted rock mound. The various geotechnical ultimate limit states related to the caisson
shown in Figure 4 shall be checked and designed for (Esteban & Rey, 2009). Besides the

ultimate limit states, the serviceability limit state of caisson system during port operation
has to be ensured to meet the settlement requirement, in particular, the differential
settlement between the two quay crane legs as the front leg of the quay crane rests on
the caisson while the rear leg is supported on piles.
As such, it is of great importance to ensure the caisson rests on competent ground. Any
soft material immediately below the caisson founding level shall be either treated by soil
improvement works such as installation of sand compaction piles (Leung & Shen, 2008)
or dredged away and replaced by sand to form a sandkey foundation. The sandkey will
be subsequently compacted to increase the stiffness to reduce the caisson movements.
Furthermore, all caissons after installation are preloaded to an appropriate surcharge
load not less than the dead loads above the top of the caissons and operational live
loads acting directly on and behind the caissons to minimize non-recoverable
settlement from the caisson foundation and the founding strata. The backfill behind the
caissons is also subject to surcharge preloading to accelerate the soil consolidation.
These measures enhance the overall stability of the caisson structures and reduce the
residual settlement of the ground during port operation.
When the gravity caisson wharf structures were used for the first time in Singapore,
centrifuge model study was also carried out to examine caisson movements and
effectiveness of caisson preloading for Pasir Panjang Terminal Phase 1 (Leung et al.,
1997). In addition, the monitoring results of caisson preloading/unloading/reloading in
Pasir Panjang were reported (Tan et al., 1999; Khoo et al., 2013).
Some geotechnical issues associated with caisson foundations during design and
construction of gravity caissons are discussed below. They are cavities in Jurong
Formation, presence of soft soils sandwiched between hard soils and potential
softening of residual soil beneath sandkey trench.
2.1 Limestone with cavities
The Jurong Formation covers the south, west and southwest parts of Singapore (DSTA, 2009).
It is composed of a variety of sharply folded sedimentary rocks including conglomerate,
sandstone, shale, mudstone, limestone and dolomite. It was deposited during late Triassic to

early or mid-Jurassic periods. The Formation has been folded and faulted due to past
tectonic movements.
Depending on the degree of weathering, the Jurong formation comprises residual soil,
completely weathered, highly weathered and fresh rock. It is generally encountered at
the surface or beneath the Kallang formation in some areas. Typically its upper portion
has been weathered down heavily to residual soils or completely weathered rocks.
Being part of the Jurong Formation, the location and top level of limestone are highly
variable with pinnacles, cavities, and deep solution channels. Cavities are generally
identified during borehole drilling with sudden water loss or sinking of drill rods, or
during bored pile installation with loss of concrete and escape of grouting fluids when
back filling boreholes (Pakianathan & Jeyatharan, 2005).
Jeyatharan & Pakianathan (2003) reported the difficulties experienced in Pasir Panjang
during bored piling works in 1996. Many cavities were encountered at the site till 60 m
deep and extensive jet grouting being carried out prior to piling. At each pier location,
minimum one borehole was made to a depth of at least five times the pile diameter
beneath the pile toe, or the last cavity, whichever was deeper. Despite this, concrete
losses during pile concreting still took place.
Limestone with cavities was also detected through boreholes at caisson location in Pasir
Panjang. Additional boreholes with cross borehole seismic tomography were carried out to
determine the size and extent of the cavities. Figure 5 shows a schematic diagram for the
marine tomography. The extent of the cavities can be identified from the boreholes and the
various velocity distributions of the seismic tomography in between the boreholes. Using
three dimensional modelling images, the geologists assessed that the biggest cavity is a
funnel-shaped cavity infilled with soil and rock fragments. Engineering assessment was
then carried out to evaluate the impact of the infilled cavity on the stability and movement of
the caisson foundation. Various cases of cavity properties had been modelled in the
assessment and the results indicated that the presence of this cavity beneath the caisson
had negligible effect on the stability and movements of the caisson.
The necessity to treat a cavity largely depends on its depth, thickness of limestone above the

cavity and extent of the cavity and the properties of infilled materials inside the cavity. For the
case described above, the cavity is located at a relatively large depth and its size is limited in
plan. The additional stresses from the quay wall structures are able to be transferred through
the arching effect of the surrounding limestone without affecting the stability of the cavity and
the caisson foundation. On the other hand, when the cavity exists at a relatively shallow depth
beneath the caisson, with thin arching limestone above the cavity and the size of the cavity is
extensive, the cavity needs to be treated. Hence, the impact of the cavity to the integrity of
caisson structure should be carefully investigated with adequate soil investigation and robust
engineering assessment. The tomography test is a useful tool which can be used to determine
the extent of cavities between bored holes. Proper ground treatment method should be
adopted if the impact of the cavities is deemed significantly affecting the safety and
serviceability of the quay walls and container stacking yard.
2.2 Presence of weaker soils between hard soils
Owing to high variability of the Jurong Formation as a result of the inter-bedding and folding of
parent rocks, sandwich soft soil layers (Figure 6) could exist in between two hard layers, which
raises potential concerns on the stability and settlement of caissons sitting above it.
In one such case, soil investigation revealed the presence of weaker soil layer beneath
the targeted sandkey founding layer at one location of Pasir Panjang. Extensive
engineering assessment predicted possible excessive settlement if the weak soil layer
was left untreated. It was decided that jet grouting should be carried out to increase
the strength and stiffness of the sandwiched weaker soils.
Trial grouting was performed on site to establish the grouting parameters used to treat the
weaker soils. Unconfined compression tests were conducted from core samples collected
at the top, middle and bottom along the circumference of the grouted piles to verify the
quality of the jet grouts. The minimum total core recovery of each recovered core shall be
85% and cored samples shall meet the target unconfined compressive strength of 600
kPa. Besides laboratory tests, in-situ pressuremeter tests at 2 m interval were performed
to establish the stiffness of the treated column after 28 days of jet grouting. Figure 7 shows
the schematic of the test. The target desired stiffness for the treated column was 60 MPa.
The actual effective treatment zone of each grouted column will vary depending on the

component of the soils (e.g. granular soil or clayey/silty soil). Analysis based on as-
built grouted columns was also carried out to evaluate the movements of caisson
under service loading.
2.3 Softening of soils beneath sandkey
The foundation for caisson structures typically comprises compacted sandkey underlying the
compacted rock mound. As mentioned earlier, dredging of incompetent seabed materials is
necessary. During sandkey dredging, as a result of soil swelling and temporary release of
overburden pressure, the soils beneath the sandkey could soften before sand is filled in the
trench. It was noted that the reduction in strength and the depth of the softening varied.. Such
difference in the degree and depth of the softening may be caused by two different soil
softening mechanisms: swelling and soil bond destruction (i.e. slaking).
In the case of consolidation related softening, the reduction in strength might simply be
due to dissipation of negative excess pore pressure and change in vertical stress and
water content due to sandkey trenching (Picarelli et al., 2006). In this respect, the
frictional component of the soil strength is proportional to the effective stress acting on
the soil. For over-consolidated soils, this relationship remains approximately correct
when considering the undrained strength. It is expected that the soil would regain its
strength under the vertical loading pressure of the caisson structure of over 300 kPa. It
may not be possible to prevent such soil strength reduction as a consequence of
sandkey trenching. Since this is a time and stress dependent phenomenon, one
should place the sand fill in the sandkey trench as soon as possible and practicable.
On the other hand, slaking may be due to the combined effect of pressure relief after
sandkey trenching and water intrusion causing soil bond destructuring. Slaking occurs
when bonding between soil particles are not strong enough to withstand internal
stresses caused by volumetric and shearing strains due to unloading together with
rapid water intake (Leroueil & Vaughan, 1990).
The slaking tests were carried out for samples taken from Jurong Formation. Figure 8 presents
the results of typical slaking tests. It was established that the slaking class of Jurong Formation
covered the full range between least slaking Class 0 to highest slaking Class 4. The
observations are consistent with that reported earlier (Leung & Radhakrishnan, 1990).

The reduction in strength and stiffness of the caisson foundation due to slaking and
softening can be significant, which may affect serviceability and stability of the caisson
structure if left untreated. The design of the sand key foundation may need to take into
account possible location and extent of the slaking soil. The softening soil layer may be
tackled by simply dredging it away if the thickness is not excessive or soil improvement.
One of the ways to soil improve this weaken layer is by dynamic replacement with rock tamping
(Hamidi et al, 2010). The process was carried out by installing compacted rock columns into the
softened clay to form a composite soil-column mass as shown in Figure 9. A 1.8m thick granite
rock fill was placed over the soft clay layer to be tamped into the softened soil to form the
desired columns. The rock columns were designed to be 2 m in diameter, in a 4.5 m grid with a
replacement ratio of 15%. Post tamping pressuremeter tests were then carried out to verify the
improved strength and stiffness as specified in the design.
3 LAND RECLAMATION AND SOIL IMPROVEMENT
3.1 Land Reclamation The rapid economic development over the last few decades in Singapore has led to a
continuous demand for land to be used for housing, transportation, commercial and
industrial needs. As land is scarce, a solution is to create land by land reclamation.
Since the first reclamation works began in 1822, Singapore’s land area has expanded
by almost 25 percent from 578 to 719 square km (Lim, 2017). Most of the airport and
container terminals in Singapore are situated on reclaimed land.
As reclamation sites entered considerably deeper waters, large amount of fill materials were
required. On the other hand, Singapore’s economy is rapidly growing with many deep
excavations and tunneling activities, generating large quantity of excavated soils. In addition,
Singapore needs to dredge its seabed regularly to maintain the depth of its navigation
channels, which generates dredged soils. It is certainly attractive then, to use the abundance of
construction waste soils and dredged materials for land reclamation as dumping grounds in
Singapore is very limited. The Building Construction Authority (BCA, 2008) of Singapore
published a guideline to promote sustainable construction and encouraged the use of
excavated soils for land reclamation. In fact, all the present ongoing land reclamation projects

specify that they must receive these otherwise “unwanted” soils which are classified as
‘soft clay' and ‘good earth’ (BCA, 2008). The use of these soils as reclamation fill
provides a sustainable and cost effective solution not only to protect the environment
but also to meet the large demand of the fill material for land reclamation projects.
3.2 Ground improvement However, the use of the excavated and dredged soils for land reclamation poses both short-
term construction and long-term operation challenges such as stability issues during
construction and residual settlement during port operation. Ground improvement is often
necessary to accelerate the settlement of the fill and the in-situ soils ensuring ground stability.
For a container port, a stringent long-term residual settlement requirement during port
operation is typically kept to 40mm to ensure minimal disruption of port operation and
the various container handling equipment on the road and thoroughfares. Such
stringent settlement requirement is particularly crucial for an automated port where
Automatic Guided Vehicles (AGV) and other unmanned port equipment will be used.
The massive reuse of excavated and dredged soils, which comprises mainly of clay and silt with
high water content, as reclamation fill will be expected to have very significant settlement.
Ground improvement is necessary not only to eliminate all primary consolidation settlement due
to reclamation filling but also to minimize the long-term total residual settlement.
In order to minimize the residual settlement during the service life of the ports, the soft and
compressible soils will be treated with a surcharge higher than the service loads to ensure that
the compressible soils are over-consolidated after preloading and would not go beyond the re-
compression line during port operation stage. The consolidation of these soft materials under
surcharge is normally accelerated by the insertion of Prefabricated Vertical Drains (PVD) to
reduce drainage paths. Depending on the functional requirement, the specified degree of
consolidation, based on the surcharge loading, needs to be achieved within the thickness of the
compressible soil to ultimately meet the residual settlement required.
The consolidation period under surcharge typically varies from 3 to 12 months depending on the
construction schedule. The PVD design is to adopt an appropriate PVD spacing and termination
depth taking into consideration of soil conditions and time constraint. The PVD shall

be anchored into the stiff layer of Jurong Formation, of a minimum desired pre-
consolidation pressure, so as to minimize the consolidation settlement of the
compressible soil layers above it.
3.3 Characteristics of dredged materials As mentioned in Section 3.1, the reclamation fill material may come from various sources
including land excavation and marine dredging. For the construction of container port,
dredging works using grab dredgers with various grab sizes are usually deployed to deepen
the basins and fairway and to form the sandkey trenches. The materials dredged from
seabed are termed as dredged material in general and comprise soil lumps of various sizes
and soil types from Kallang Formation and Jurong Formation. The dredged materials will be
loaded onto split hopper barges, box barges or flat top barges for subsequent filling.
Reclaimer barges and hydraulic filing method may also be used to reclaim the land to a
higher level above water where normal barges are not accessible.
The dredged materials are expected to be highly variable and non-homogeneous as a result of
variability in the material sources, disturbance during dredging, filling and preloading process.
Karthikeyan et al (2004) reported the results of site investigation after about 12 years of deposit
of large dredged clay lumps in Punggol Timor Island. It was found that the strength and
deformation characteristics of the lumpy fill layer to be highly scattered and variable with
normally consolidated and over consolidated zones. The over consolidated zone is a part of the
original clay lump which has been over consolidated in the past. On the other hand, normally
consolidated zones were found from areas around the initial inter-lump voids filled by
disintegrated small clay lumps and the softened surface areas of large clay lumps. It was
concluded that the ultimate state of the land reclaimed using clay lumps is highly variable and
distinctively different from that using clay slurry, where homogenous properties are expected.
3.4 Pilot Tests for soil improvement works For projects with large scale soil improvement works for reclaimed land such as container port, it
usually requires pilot tests to determine the type of PVDs, the suitable spacing, the appropriate
installation depth and the surcharge duration. The pilot tests can also serve as a guide to
ascertain the suitability of the proposed installation rig and mandrel types. In a pilot test carried
out in Pasir Panjang for soil improvement works by PVD, the test site was sub-divided into two
clusters of CT-1 and CT-2, each with a plan area of 50m by 30m. A PVD spacing of

1.5m square grid was adopted for cluster CT-1 with 1.0m square grid spacing adopted
for CT-2.
The soil profile within the pilot test areas can be broadly classified into three distinct layers
consisting 4m to 8m thick of sand fill, 10m to 15m thick of dredged material and the in-situ soils
beneath the original seabed. Surface settlement markers and deep settlement plates were
installed to monitor the surface settlement and subsurface settlement of individual soil layers.
After placement of full surcharge for about 4 months, the surface settlement for CT-1 ranged
from 1.22m to 1.37m. As for CT-2, the surface settlement ranged from 1.13m to 1.43m.
The final ground settlements were estimated using the Hyperbolic method (Tan et al 1991,
Tan, 1994) or Asaoka method (Asaoka, 1978) based on instrumentation monitoring results.
From measured field settlement and predicted ultimate settlement, the average degree of
consolidation can be estimated. It was established that the hyperbolic and Asaoka methods
could estimate the final ground settlement with high accuracy if the recorded settlement
data has already reached at least 60% degrees of soil consolidation. The settlement within
this range will be used to predict the settlement by initialization of both time and settlement.
The predicted final settlement can be obtained by
S f S0 S fp (1)
where Sf is the total predicted settlement under current surcharge; S0 is the measured
settlement at the initialisation time; Sfp is the predicted final settlement relative to the
time of initialization using the data with degree of consolidation more than 60% data.
The degree of soil consolidation, Ut, can be determined as
Ut St
(2)
S0 S fp
where St is the measured settlement at the time t.
Figure 10 shows a predicted final settlement of 1.539m for the surface settlement plate SP-1 for
CT-1 using the hyperbolic method. The same procedure was also performed for the surface
settlement plates to estimate the achieved degree of consolidation. Considering that a higher

surcharge has been applied as compared to the design load of 180kPa, the required
minimum degree of consolidation has been achieved within the pilot test area. Removal
of the surcharge can then be carried out.
The effectiveness of the soil improvement works after removal of surcharge may be examined
by comparing undrained soil strength, moisture content and soil pre-consolidation pressure
before and after ground improvement. Figure 11 shows the comparison between the pre-SIW
and post-SIW undrained shear strength profile from a typical bored hole within the reclaimed
land. It is evident the post-SIW undrained shear strength is higher than the pre-SIW undrained
shear strength. This finding was further verified by comparing the Pre-SIW and Post-SIW CPT
results. Figure 12 shows a comparison of pre-SIW and post-SIW pre-consolidation pressure
from a typical bore hole. No noticeable change between the pre-SIW and post-SIW data was
observed. The reason could be that fill materials used for reclamation came from various
sources and highly variable as mentioned in Section 3.3. Furthermore, due to large settlement of
the soft ground during preloading stage, it would be difficult to obtain representative samples
from of the same soil layer from pre-SIW and post-SIW bored holes for a proper comparison.
The above findings are similar to the results observed from the Changi reclamation
projects. In the earlier land reclamation project involving Changi Airport in 1970s and
Changi East in 1990s, it was reported that (Vijiaratnam et al., 1982, Chu et al., 2009)
only the undrained shear strength of soft clay showed a significant increase while the
comparisons of pre and post soil pre-consolidation pressure and moisture content were
inconclusive. Hence the appreciation in undrained shear strength provides the most
direct indication on the effectiveness of a soil improvement scheme.
3.5 Residual settlement The settlement analysis usually involves two stages. The first stage is to carry out
consolidation analysis to determine the degree of soil consolidation and settlement at
the end of the desired preloading duration taking into consideration the spacing and
depth of PVD. The consolidation settlement and degree of consolidation can be
measured and verified by extensive site instrumentation monitoring. The second stage
is to predict the long term residual settlement over the service life of the port.
The residual settlement, Sresidual, after surcharge comprises the consolidation and secondary

compression including the settlement of the deep stiff soil layers where PVDs cannot be
installed. It can be calculated as follows:
C r
σ vp' σ ' C
Sresidual
S
rec
S
sc v
H α
(1 ep )
log '
1 ep
σ
vp
t
H (3) log
t
p
where Srec consolidation settlement under recompression region
Ssc secondary compression settlement
H thickness of compression layer
Ca coefficient of secondary compression
ep void ratio at end of primary consolidation
t design period for calculation of secondary settlement
tp time at the end of primary consolidation
cr recompression index
σ’vp effective stress after removal of surcharge
σ’v service load
Mesri & Castro (1987) proposed that the coefficient of secondary compression, Cα, is
proportional to the compression index Cc. They concluded that the volume changes during
primary consolidation and secondary compression essentially follow similar mechanism. It
was also found that Cα /Cc lies within a narrow range of 0.02 to 0.1 for the soils shown in
Table 1. For most inorganic clays, Cα/Cc = 0.04 ± 0.01 while for granular soils, Cα/Cc =
0.02 ± 0.01. As such, the secondary compression can be predicted.
Table 1. Typical values of Ca/Cc for soils (after Terzaghi et al., 1996)
Material Ca/Cc
Granular soil including rock fill 0.002±0.01
Shale and mudstone 0.003±0.01
Inorganic clays and silts 0.004±0.01
Organic clays and silts 0.005±0.01
Peat and muskeg 0.006±0.01

3.6 Secondary compression of clay After the soft ground has been treated with PVD, the secondary compression may still
exceed the desired magnitude in certain locations. Surcharge preloading can be used to
reduce the post-construction secondary settlement of the ground to a lower and acceptable
magnitude (Mesri & Feng, 1991). The effective surcharge ratio, R’s, is defined as
R' = σ vs
' − 1 = OCR − 1 (4)
S σ vf
'
where σ’vs is the maximum effective vertical stress achieved before the removal of
surcharge, σ'vf is the final permanent effective stress after the removal of surcharge,
and OCR is the over consolidation ratio.
Mesri & Feng (1991) and Tergazhi et al. (1996) observed that post-surcharge
secondary compression appears after primary and secondary rebound tl, see Figure
13. An approach based on laboratory test results was proposed to estimate the reduced
secondary compression after surcharge. The equation for secondary compression can
hence be updated as
Ssc C '' t α log H
(5)
1 ep
t
l The reduced post surcharge secant coefficient of secondary compression Ca'' (refer to Figure 13
for definition) depends on both effective surcharge ratio, Rs’ (=OCR-1) and the design time
relative to the time for reappearance of secondary compression t/tl as shown in Figure 14. This
clearly shows the effectiveness of surcharge in reducing secondary compression. It is noted that
Ca’’ is reduced significantly when Rs’ is larger than 0.4 and Ca’’ also becomes negligible when
Rs’ is bigger than 1. The magnitude of surcharge can be determined based on the amount of
secondary compression to be reduced to meet the serviceability requirements.
The value of tl shown in Figure 13 is determined from the empirical correlation between tl/tpr,
and R' for soft clay and silt shown in Figure 15. This figure shows that the time to the
appearance of post surcharge secondary compression increases with surcharging effort. The

duration of primary rebound tpr depends on the rebound characteristics of the soil as
well as on the permeability and drainage boundary conditions.
3.7 Secondary compression of sand In certain areas of the port, the top several meters of the reclaimed sand serves as the capping
layer providing a stable platform to install PVD and competent subgrade for the port pavement.
These granular coarse grain soils are also placed immediately behind the caissons as the
backfill to reduce the lateral pressure acting the caissons hence increasing the overall stability of
the caissons. The approach using reduced secant Ca’’ after preloading as mentioned earlier was
developed for soft clays and silts. Its applicability to granular soils, such as the capping sand is
subjected to verification and requires more test results to support the usage. Therefore, the
constant Ca/Cc concept could be adopted to estimate the secondary compression of sand even
though the reclamation sand may also be subject to surcharge.
Figure 16 shows the oedometer test results of Ca and Cc at loose and dense states for 11 sand
samples from a reclamation site. The Ca/Cc ratio is generally in line with the reported values of
0.01 to 0.003 for granular materials shown in Table 1. Interestingly, the Ca/Cc ratio of dense
sand is slightly larger than that of loose sand. Mesri & Vardhanabhuti (2009) reported that the
test results of Cc for three groups of sands and established that the compression index Cc
varies and typically increases with vertical effective stress less than about 10 MPa, see Figure
17. This trend was also observed from the results of the 11 sand samples.
It is noted that the reported Ca from laboratory tests was obtained at the final stage of
loading of 1600 kPa while Cc was obtained from the stress range of 800 kPa to 1600
kPa with an average pressure of 1200 kPa. Adopting the concept of constant Ca/Cc,
the Ca over the practical stress range at various depths can be derived. For example,
for the purpose of analysis, Cc under stress range 100-200 kPa (average 150 kPa) can
be conservatively used for the capping sand at shallow depths while the Cc under
stress range 200-400 kPa (average 300 kPa) can be used for the sand below.
4 CONCLUDING REMARKS This paper presents the key geotechnical challenges related to gravity caisson quay walls and
soil improvement works on reclaimed land for container port development in Singapore. Gravity
caissons should rest on competent in-situ soil foundation or compacted sandkey foundation to

meet the desired design requirements under ultimate and serviceability limit states. The
caisson foundation issues encountered in Jurong Formation are limestone cavities,
presence of sandwich soft soils due to folding, and potential soil softening beneath
sandkey trench. The necessity for treatment depends on their impacts on the caisson
stability and settlement. Additional soil investigations are necessary to ascertain the
location and extent of the problematic foundation to facilitate detailed assessments.
Extensive instrumentation monitoring and interpretations are required to ensure the
caissons and their foundations behave as predicted.
The container terminals in Singapore were mostly built on reclaimed lands using various sources
of fill materials. The presence of soft soils within the reclaimed land posed both short and long
term geotechnical challenges. Ground improvement using surcharge preloading and PVD is
often implemented to accelerate the primary settlement, reduce the residual settlement and
enhance the ground stability. The secondary compression of the soft soils may contribute the
most to the residual settlement during port operation stage. Effective surcharge above the final
permanent and service loading is required to reduce the secondary compression. The
magnitude of surcharge can be determined based on the amount of secondary compression is
to be reduced. Using the concept of constant Ca/Cc and the fact that Cc increasing with
effective stress, the Ca over the practical stress range at various depths can be obtained.
ACKNOWLEGEMENTS The authors would like to thank the Maritime and Port Authority of Singapore (MPA),
who is the Government agency developing the container ports in Singapore, for their
adoption of innovation, unwavering support for engineering excellence and sustainable
reclamation techniques. Appreciation also goes out to all Contractors and Advisors who
had been involved in the port development in Singapore through the years. The views
expressed in this article are entirely those of the authors and do not represent the views
of the Authority and other organisations that were involved in the port development.
REFERENCES Asaoka, A. 1978. Observational Procedure of settlement prediction, Soils and Foundations, Vol. 18, No. 4: 87-101. Building Construction Authority (BCA) 2008. Sustainable Construction: A Guide on the Use of Recycled Materials. Chu, J., Bo, M.W., and Arulrajah, A. 2009. Soil improvement works for an offshore land reclamation. Geotech. Engr. 162(1): 21-32.
DSTA, 2009. Geology of Singapore, 2nd Edition. Esteban, L.F. & Rey, R.V.D. 2009. Reinforced concrete caissons for port structures in Spain. Marine Engineering 162: 73 – 81. Dol:
10.1680/maen.2009.162.2.73.

Hamidi, B., Yee, K., Varaksin, S., Nikraz, H. & Wong, L.T. 2010. Ground Improvement in Deep Waters Using Dynamic Replacement. Proc. 20th International Offshore and Polar Engineering Conference. Beijing. 20-26 June 2010, 848-853. Jeyatharan, K., Lee K.W., Pakianathan L.J. & Seh C.P. 2003. Limestones of the Jurong Formation. Proc. Underground
Singapore 2003 and Workshop Updating the Engineering Geology of Singapore, 27-29 November 2003, 372-387. Karthikeyan, M., Dasari, G.R. & Tan T.S. 2004. In situ characterization of land reclaimed using big clay lumps. Canadian
Geotechnical Journal, 2004, 41(2): 242-256 Kaur, K. 2017. Full steam ahead for new Tuas mega port. The Straits Times, 24 April 2017, Retrieved on 10 September 2017 from:
http://www.straitstimes.com/singapore/full-steam-ahead-for-new-tuas-mega-port/. Khoo, E., Leong, T.P., Low, C.K. Lam, P.W., Liao, B.K. & Leung, C.F. 2013. Settlement of gravity caisson wharf structure.
Proc. 13th Southeast Asian Geotechnical Conf., Singapore. Leroueil, S. & Vaughan, P. R. 1990. The general and congruent effects of structure in natural soils and weak rocks. Géotechnique 40(3):
467-488. Leung, C.F. & Radhakrishnan, R. 1990. Geotechnical properties of weathered sedimentary rocks. Geotech. Engr. 21(1): 29-48. Leung, C.F., Lee, F.H. & Khoo, E. 1997. Behavior of gravity caisson on sand. J. Geotech Engr., J. Geo. & Geoenv. Egr. 123(3):
187-196. Leung, C.F. & Shen R.F. 2008. Performance of gravity caisson on sand compaction piles. Canadian Geotechnical Journal
45: 393 – 407. Leung, C.F. 2014. Historical development of container port wharf front structures in Singapore. Proc. Int. Conf. Ports for
Container Ships of Future Generations, Hamburg: 199-210. Lim, T.S. 2017. Land from sand: Singapore’s reclamation story. Retrieved on 16 September 2017 from: http://www.nlb.gov.sg/biblioasia/2017/04/04/land-from-sand-singapores-reclamation-story/ Loh, Y.H., Seah K.H., Loh C.K., Liao B.K., Lim S.K. & Loh C.K. 2010. Massive caisson quay wall of Pasir Panjang Terminal
Phases 3 & 4, Conference on Structural Marvels, 13-14 December 2010, Singapore Mesri, G. & Castro, A. 1987. Cα/Cc Concept and K0 during Secondary Compression, J. Geotech. Eng. 113(3), 230-
247. Mesri, G. & Feng, T.W. 1991. Surcharging to reduce secondary settlements. Proc. International Conference on
Geotechnical Engineering for Coastal Development, 1, Yokohama: 359-364. Mesri, G. & Vardhanabhuti, B. 2009. “Compression of Granular Materials”, Can. Geotech. J., 46, pp. 369-392. Pakianathan, L.J. & Jeyatharan, K. 2005. Limestone Rocks of the Jurong Formation Engineering Experiences, Proc.
Underground Singapore. Picarelli, L., Urciuoli, G., Mandolini, A. & Ramondini M. 2006. Softening and instability of natural slopes in highly fissured
plastic clay shales. Natural Hazards and Earth System Science 6(4): 529-539. Tan, A., Wong, K.Y., Lay, K.H. & Leung, C.F. 1999. Performance of Gravity Caissons. Proc. 5th Int. Symp. On Field
Measurements in Geomechanics, Singapore, 297-302. Tan, S. A., 1994, Hyperbolic method for settlements in clays with vertical drains, Canadian Geotechnical Journal, 1994, 31(1): 125-131
Tan, T.S. Inoue, T. & Lee, S.L. 1991, Hyperbolic method for consolidation analysis, Journal of Geotechnical Engineering, Vol. 117,
Issue 11 Vijiaratnam, A., Tan, S.B., Ng, P.F.H. and Choa, V. 1982. Reclamation and soil improvement works for Changi Airport. Proc. Intl. Symp. on Airport Planning and Development, Singapore: 88-105. Wong, K.Y. & Chng, W.P.M. 2016. Singapore: A Port City – the Case of Port Development and its Impact on the City. Proc.
15th World Conference Cities and Ports “Crossovers”, Rotterdam 5-7 October 2016 Terzaghi, K., Peck, R.B. & Mesri, G. 1996. Soil Mechanics in Engineering Practice, Third Edition

Figure 1. Container port terminals of Singapore (Source: http://www.straitstimes.com/singapore/full-steam-ahead-for-new-tuas-mega-port)
Figure 2. Development of port facilities in Singapore (after Wong & Chng, 2016)

Figure 3. Typical section of gravity caisson wharf founding on sand compaction piles (after Leung & Shen, 2008)
Figure 4. Geotechnical ultimate limit states for gravity caissons (after Esteban & Rey, 2009)
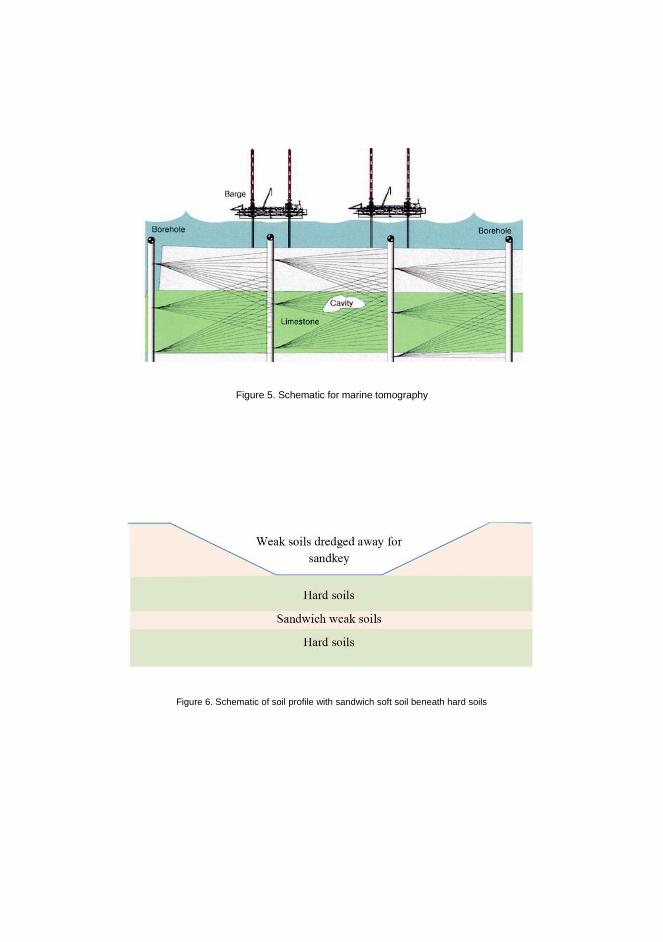
Figure 5. Schematic for marine tomography
Figure 6. Schematic of soil profile with sandwich soft soil beneath hard soils

Figure 7. Schematic of In-situ Tests for treated soil layer
Figure 8. Slaking tests for Jurong Formation

(a) (b)
Figure 9. Dynamic Replacement (a) Specially designed and fabricated offshore DR pounder and
(b) Dynamic replacement column and pressuremeter test locations (after Hamidi et al., 2010)
Figure 10. Estimation of ultimate ground settlement by hyperbolic method for SP-1

Figure 11. Comparison of undrained shear strength from Pre-SIW and Post-SIW lab tests
Figure 12. Comparison of pre-consolidation pressure from Pre-SIW and Post-SIW lab tests

Figure 13. Definition of secant Ca’’ and tl (after Terzaghi et al., 1996)
Figure 14. Post surcharge secondary compression index ca’’/ca in relation to t/tl and Rs’ (after Terzaghi et al., 1996)

Figure 15. Empirical relationship between tl/tpr and effective surcharge ratio, Rs’ (after Terzaghi et al., 1996)
Figure 16. Ca/Cc for tested sand samples

Figure 17. Compression index in relation to effective vertical stress for sand (adapted from Mesri and Vardhanabhuti, 2009)