geosrs: a hybrid social recommender system for …
TRANSCRIPT
GeoSRS: A Hybrid Social Recommender System
for Geolocated Data
Joan Capdevilaa,c,1, Marta Ariasb,c,2, Argimiro Arratiab,c,2,3
aBarcelona Supercomputing CenterbComputer Science Department
cBarcelona Tech / Universitat Politecnica de Catalunya, Spain
Abstract
We present GeoSRS, a hybrid recommender system for a popular location-based social network (LBSN), in which users are able to write short reviewson the places of interest they visit. Using state-of-the-art text mining tech-niques, our system recommends locations to users using as source the wholeset of text reviews in addition to their geographical location. To evaluate oursystem, we have collected our own datasets by crawling the social networkFoursquare. To do this efficiently, we propose the use of a parallel versionof the Quadtree technique, which may be applicable to crawling/exploringother spatially distributed sources. Finally, we study the performance ofGeoSRS on our collected dataset and conclude that by combining sentimentanalysis and text modelling, GeoSRS generates more accurate recommenda-tions. The performance of the system improves as more reviews are available,which further motivates the use of large-scale crawling techniques such as theQuadtree.
Key words: recommender systems, text mining, quadtree, crawling, socialnetworks, location-based social network
Email addresses: [email protected] (Joan Capdevila), [email protected] (MartaArias), [email protected] (Argimiro Arratia)
1Supported by Obra Social “la Caixa”2Supported by MICINN project TIN2011-27479-C04-03 (BASMATI), MINECO project
TIN2014-57226-P (APCOM) and Gen. Cat. project SGR2014-890 (MACDA)3Additional support by MEC project MTM2012-36917-C03-03 (SINGACOM)
Preprint submitted to Mining Urban Data October 30, 2015

1. Introduction
The proliferation of mobile communication and GPS technologies has al-lowed users to add geographical identification metadata to various socialmedia, such as photographs, text reviews or video, among many others.Location-based social networks (LBSNs) (Zheng, 2012), integrate into a sin-gle network user relations (the “social” part) and geo-spatial information (the“location-based” part). By taking into account the physical location of users,LBSNs are bridging the gap between physical world and virtual communitiessuch as Foursquare4, Facebook 5 or Twitter 6.
The extensive use of these social networking sites has made them in-valuable sources of information. However, the sheer volume of data flowingthrough these sites, even for a single user, has made it increasingly difficultfor humans to track all this information. Therefore, most social networkingsites implement some sort of Social Recommendation System (SRS) (Guy andCarmel, 2011): for example, Twitter suggests who to follow, Facebook filtersand prioritizes posts in users’ walls and Foursquare recommends locationswhere to go. When the social content is geotagged, it becomes strictly neces-sary to consider user and item localization in the recommendation paradigm.
Location-based recommendation constitutes a unique application in LB-SNs and it substantially differs from traditional recommender systems in thefact that the latter does not take into account the spatial properties of usersand items (Mokbel et al., 2011). Moreover, location-based recommendationon top of LBSNs might also benefit from the interaction between the threelayers composing a LBSN, namely the user, the location and the contentlayer (Symeonidis et al., 2014a).
In this paper, we propose a fully integrated system for information re-trieval of geolocated data and end-to-end location-based recommender, suit-able for the popular social network Foursquare. The reader should note,however, that our methods are applicable to any other social network thatcontains geolocated time-referenced reviews and hence, in our presentationwe abstract from the fact that we are using this particular site.
We believe that fully operative recommender systems on top of LBSNsrequire end-to-end designs, capable of performing data retrieval from social
4https://foursquare.com/5https://facebook.com/6https://twitter.com/
2
networks, cleaning the noisy and duplicated data, extracting relevant featuresand, not least, performing recommendation.
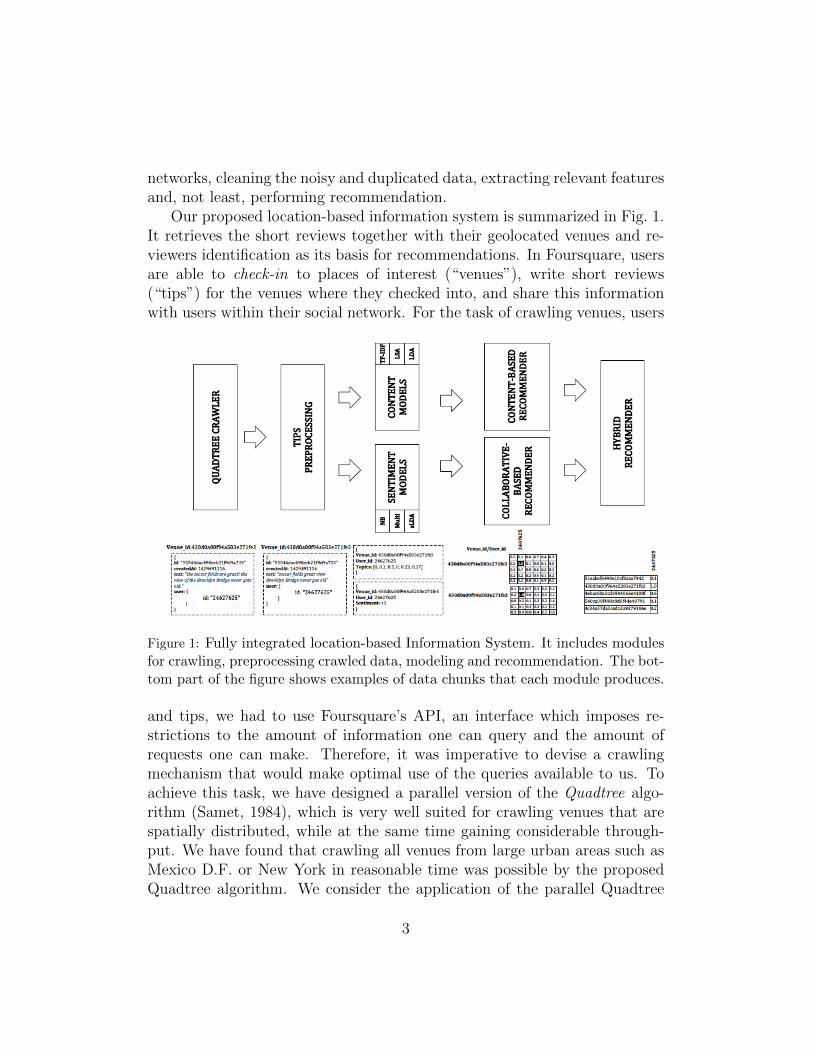
Our proposed location-based information system is summarized in Fig. 1.It retrieves the short reviews together with their geolocated venues and re-viewers identification as its basis for recommendations. In Foursquare, usersare able to check-in to places of interest (“venues”), write short reviews(“tips”) for the venues where they checked into, and share this informationwith users within their social network. For the task of crawling venues, users
Figure 1: Fully integrated location-based Information System. It includes modulesfor crawling, preprocessing crawled data, modeling and recommendation. The bot-tom part of the figure shows examples of data chunks that each module produces.
and tips, we had to use Foursquare’s API, an interface which imposes re-strictions to the amount of information one can query and the amount ofrequests one can make. Therefore, it was imperative to devise a crawlingmechanism that would make optimal use of the queries available to us. Toachieve this task, we have designed a parallel version of the Quadtree algo-rithm (Samet, 1984), which is very well suited for crawling venues that arespatially distributed, while at the same time gaining considerable through-put. We have found that crawling all venues from large urban areas such asMexico D.F. or New York in reasonable time was possible by the proposedQuadtree algorithm. We consider the application of the parallel Quadtree
3
algorithm to this problem an important contribution of our paper and webelieve that problems that require sweeping spatial devices (sensors, etc.)could also benefit from it.
To make recommendations our system makes extensive use of user’s re-views (“tips”). In order to extract meaningful information from these free-form reviews, GeoSRS relies upon many state-of-the-art techniques for textmining and sentiment analysis, which are evaluated in terms of recommen-dation accuracy and the ones that outperform are selected to be used inGeoSRS. Another relevant contribution from our paper is the increase of ac-curacy when mixing the review’s sentiment and content into a simple butrather effective weighted hybrid recommender setup (Burke, 2007). Senti-ment refers to the global opinion that is reflected in the review (positive,negative or neutral) while content indicates the topics that the review ad-dresses. This enforces the idea that pure review-based choices are not merelybased on the opinion reflected on a short review (“The service was too slow”),but also on the content relevant to the user (“This is a kinda working placerather than a coffee shop”).
To evaluate our system, we have collected our own dataset of restaurantsand tips from the area of Manhattan in New York City. We have chosenManhattan due to the high density of venues and the number of active users,to validate both the scalability of the Quadtree crawler and the effectivenessand coverage of the recommender system. Recommender system is evaluatedin terms of retrieval accuracy (performance) measures rather than statisticalaccuracy measures since we do not intend to predict individual venue ratingsbut relative order among them. Moreover, we propose an evaluation methodin which we divide historically the tips dataset in training and testing. Testtips are taken as ground truth to comparatively assess the recommendation.Last but not least, the simple weighted hybrid recommender setup employedin GeoSRS is compared against other state-of-the-art configurations such asmeta-level and cascade models.
To summarize, this paper proposes for a hybrid recommender system fora location-based social network which is uniquely built upon text reviews.Our main contributions are:
1. Using a parallel version of the Quadtree technique as the basic strategyfor crawling spatially distributed data.
2. Using sentiment analysis on text reviews to generate the source forcollaborative-filtering.
4

3. Using the aggregated reviews by user and venue respectively to generatethe profiling information for content-based recommendation.
4. Using a simple but powerful hybridization technique to improve rec-ommendation performance.
5. Putting it all together into a working information system.
6. Evaluating and comparing GeoSRS against other state-of-the-art hy-brid systems in terms of IR figures.
The rest of this paper is organized as follows. Section 2 presents anoverview of related work in social recommendation on top of LBSNs, senti-ment and content analysis systems and general hybrid recommendation tech-niques. Section 3 proposes a parallel efficient technique to retrieve spatiallydistributed data sources. Our system GeoSRS is described in Section 4. Sec-tion 5 brings together the geolocated reviews data set from Foursquare withthe working GeoSRS system, to assess different possible set-ups using anoffline evaluation methodology. Last but not least, Section 6 derives severalconclusions from our work and includes directions for future work.
2. Related work
The recommender system proposed in this paper falls within the classof location-based social recommender systems, using sentiment and contentanalysis of text combined with collaborative filtering techniques leading toa hybrid recommender system. In order to place our system in context of theknown literature we briefly review each of these research areas relevant toour work.
Social Recommender Systems (SRS). SRS have arisen as an applica-tion of recommender systems to social networks, although they have beenaccepted lately as a separate discipline in itself (Guy and Carmel, 2011).Nonetheless, researchers have been proposing novel recommender set-upsbased on social content for the last five to ten years (Falahi et al., 2012;Guy and Carmel, 2011; Jameson, 2004; Liu and Aberer, 2013).
Classical recommendation paradigms such as content-based recommendershave been enhanced by adding friendship information into the matrix factor-ization objective function (Liu and Aberer, 2013), configuring the so-calledSocial Content-based Recommender (SoCo). Collaborative-based filteringhas also been redefined by including social information to improve the user
5
neighborhood identification and deal with data sparsity (Groh and Ehmig,2007; Ma et al., 2008). According to Groh and Ehmig (2007), social filteringoutperforms collaborative-based filtering. Trust-based recommenders refinethe notion of social filtering even further by defining several notions of prop-agation of trust or reputation through the network of users. Examples of thisare FeedbackTrust (Moghaddam et al., 2009) and TrustWalker (Jamali andEster, 2009) although many others exist (Massa and Avesani, 2007; Andersenet al., 2008; O’Doherty et al., 2012). FeedbackTrust improves user-based rec-ommendations by enhancing user’s similarities with trust-based similarities;TrustWalker makes item-based recommendations by combining the result ofrepeated random-walks over the network of connected users.
Others have proposed mechanisms to include interpersonal influences intraditional recommender systems arguing that the interpersonal influenceplays a critical role in this scenario (Huang et al., 2010). The term socialregularization has been coined to refer to the use of a regularization basedon social content. In the context of group recommendation, which consists inmaking recommendations to a group of individuals based on their interests,the work of Gartrell et al. (2010) highlights the benefits of incorporatingsocial structure into the recommender.
Several practical SRS can be found in the literature applied to distinctrecommendation situations. For example, Diaby et al. (2013) describe anonline social network-based job recommender system for recruiters. Tu et al.(2014) present an online dating recommending system that learns the userpreferences from a Latent Dirichlet Allocation (LDA) model. Xia et al. (2014)propose a system that takes into account social ties in the area of scientificarticles to recommend scholarly papers to users.
Location-based Social Recommender Systems. Recommender systemscan be further improved by exploiting geolocated data to take into accountthe spatial dimension (Sarwt et al., 2013); such systems are generally re-ferred to as location-based social recommender systems. Examples in thisline of research are (Berjani and Strufe, 2011; Yang et al., 2013; Ye et al.,2010; Zheng et al., 2011); for an introduction to LBSN recommender sys-tems and updates on the state-of-the-art see the tutorial (Zheng, 2012) orthe recently published textbook by Symeonidis et al. (2014b). Compared toYang et al. (2013), we are using the same data source, and due to similar-ity of contributions we hereby present our contributions with theirs. Yanget al. (2013) proposed a location-based recommendation system that uses ge-
6
olocated tips from Foursquare jointly with check-in information to improvethe recommendation performance. Our hybrid recommender system GeoSRSdiffers from this work in various aspects. While Yang et al. (2013) use onlysentiment information from tips, we also extract the topics structure fromthem to model user and venue profiles. Additionally, authors based the rec-ommendation scheme on a probabilistic factorization of the user-item matrixthat considers social influence, whereas we found out that by using socialinfluence on the collaborative-based branch of our hybrid system performedpoorly. Moreover, we evaluate the system by assessing the relative order ofnear venues compared with the actual attendance rather than calculatingthe statistical accuracy of the estimated ratings as they do. In our opinion,our evaluation methodology is closer to the real recommendation behavior ofa location-based system. Therefore we believe that our work complementstheir work on other important aspects of location-based social recommendersystems that have not been considered before.
Sentiment and text analysis. In this work, we propose the use of someof the already mentioned and more of the state-of-the-art text mining tech-niques to build a purely review-based recommender system. Several textmodelling techniques are assessed under our recommendation scheme, suchas Latent Dirichlet Allocation (LDA) (Blei et al., 2003), Latent SemanticAnalysis (LSA) (Deerwester et al., 1990), or TF-IDF (Sparck Jones, 1972;Salton and Buckley, 1988). Sentiment analysis is also included in these mod-els by using trained traditional classifiers such as Naive Bayes (McCallumet al., 1998), Multinomial Logistic Regression (Bohning, 1992) or supervisedLDA classifiers (Blei and McAuliffe, 2008).
There are many other recommender systems that leverage the informationfound in free-form text. In fact, previous work show that considering textsources improve standard collaborative filtering techniques. As an example,(Aciar et al., 2007) build a recommender system for consumer products basedon product reviews, or (Jakob et al., 2009) improve movie recommendationsbased on movie reviews. (Reschke et al., 2013) propose a recommendationdialog system built upon narrow questions from reviews, which slightly dif-fers from the recommendation problem definition. In contrast to all thesesystems, our recommender system bases the whole recommendation on thereviews text data which is modeled in a flexible and general procedure ratherthan building a text ontology or extracting multiple aspects (Snyder andBarzilay, 2007; Musat et al., 2013).
7
Social context has been used to improve results in problems other thanrecommendation. An example that is directly relevant to our work here isthe problem of text analysis and in particular of review quality detection(Lu et al., 2010). Most previous work in this field treat each review as astand-alone text document, extracting features from the text and learning afunction based on the features (Zhang and Varadarajan, 2006; Kim et al.,2006; Liu et al., 2008). Naturally, taking into account additional informationin the form of social relations between authors of reviews should help improvethe predictions.
Hybrid social recommenders. A good deal of researchers have been com-bining multiple recommendation techniques to boost the performance of theso-called hybrid systems (Burke, 2002). Standalone collaborative or content-based recommendation systems suffer from several shortcomings which canbe overcome by coupling their individual ratings. In this work, we show thatthese deficiencies of individual recommenders happen as well in our problemscenario and highlight the benefits of hybridization. Among a broad range ofhybridization techniques (Burke, 2007), linear weighted combination seemsto be one of the most simple but rather effective mechanisms, and it is theone we implement here. For example, (Mobasher et al., 2004) mix two com-ponents, a collaborative and a content-based branch, with a linear weightingscheme to perform movie recommendation. For the sake of comparison, wefurther develop two other hybrid mechanisms named the cascade and themeta-level hybrid, which (Burke, 2007) found out to work well when combin-ing two components of differing strength. A cascade hybrid called Entree wasdeveloped by (Burke, 2002), who combined a knowledge-based and collabo-rative recommender in a hierarchical manner based on the strength of theirrecommendation. Finally, a meta-level hybrid that uses content-based recom-mendation to identify the collaborative neighbors can be found in (Pazzani,1999).
3. Data retrieval process
3.1. Social networks as sources of open data
Social networks (Facebook, Twitter, Foursquare, LinkedIn, Instagram,etc.) act as consolidated data warehouses unifying distinct users’ social activ-ities into common data schemes, which are often mined by in-house analyticsystems or accessible to application developer communities. These platforms
8
implement data security and privacy policies, accepted beforehand by theuser, which rule the accessibility to the users’ social data.
We refer to social open data as the content (posts, tweets, tips, publica-tions, photos, etc.) which is visible or public to anyone. In the last decade,open social data became essential in many research fields ranging from recom-mender systems to urban design and planning (Resch et al., 2012). Among alltypes of social open data, geolocated data cover a broad range of media typesthat include geographical coordinates. This is the case of location-based so-cial networks which link some media (tweets, tips, etc.) to the user locationgathered through the smart-phone GPS system. It also considers modernurban cities containing thousands of physical sensors spread over large ge-ographical areas, from which their sensed information (e.g. air-pollution,traffic, light-level, etc.) is linked to a geographical coordinate.
Geolocated data, generated either by users acting as social sensors or realphysical sensors, can be consulted from third-party data providers (socialnetworks, open data portals, etc.) by means of geospatial queries. Typically,these entities implement control mechanisms to avoid server traffic overload,which hamper the retrieval of the totality of the data at once. Hence, anyretrieval process for geolocated data has to carefully take into account thesetraffic limitations.
3.2. Data retrieval from social networks
Most of social networks give access to their data via RepresentationalState Transfer (REST) Application Programming Interfaces (API). This pro-tocol enables an easy but effective interaction with the social network datacontents. However, these web services typically limit the rate of requestsper registered application and the response data volumes in order to avoidincoming traffic overload.
For example, the geospatial query to obtain all the venues or places ofa given geographical area from the Foursquare social network is constrainedto return 50 venues at most. This necessarily implies that this area has tobe divided into smaller sub-areas with less than 50 venues each to effectivelyretrieve all venues. Moreover, the Foursquare platform also limits up to 5000requests per hour and per registered application, forcing the retrieval processto prioritize optimal requests. Here, we propose and motivate the use ofQuadtree structures and the Quadtree construction algorithm, to effectivelyand efficiently retrieve all geolocated content from a given region generated inlocation-based social networks exhibiting the above-mentioned constraints.
9
3.3. The Quadtree algorithm
A Quadtree is a data structure based on the principle of recursive decom-position of space. Quadtrees are used as hierarchical data representations inthe domains of computer vision, image processing, pattern recognition andgeographic information systems. The interest in this data structure stemsfrom the fact that it is designed to focus resources on the areas where theinformation is of greatest density. For a comprehensive survey on quadtreesand related hierarchical data structures see (Samet, 1984).
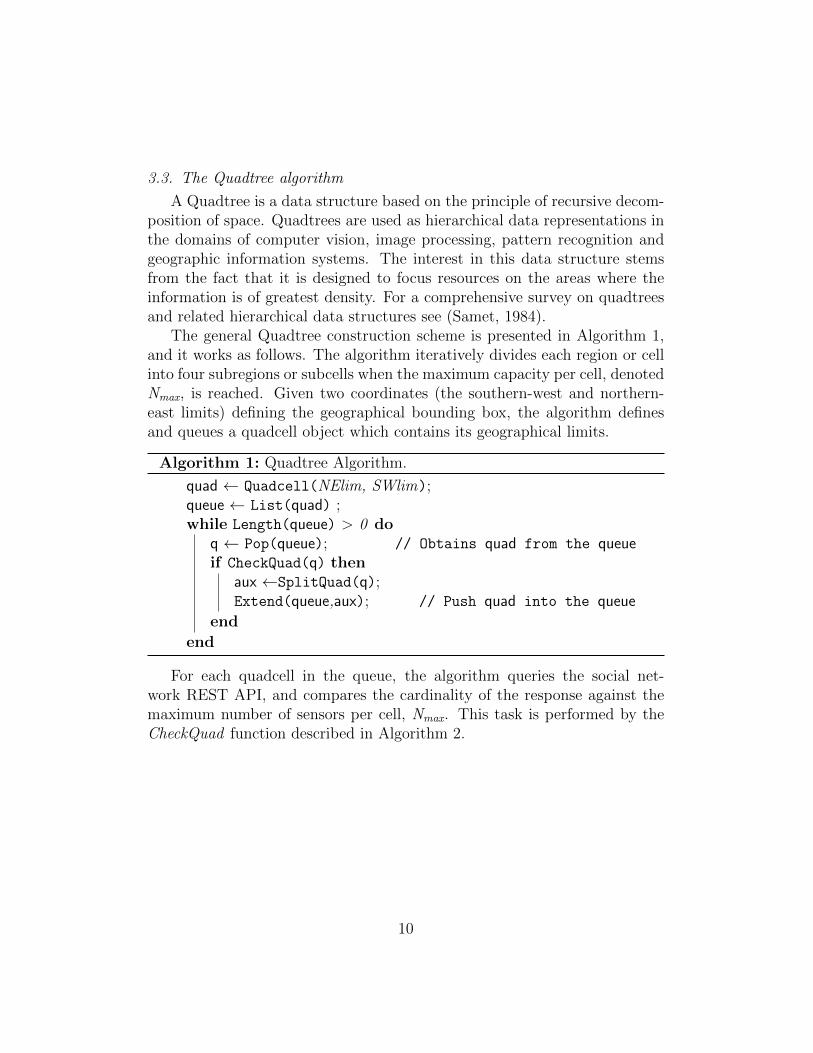
The general Quadtree construction scheme is presented in Algorithm 1,and it works as follows. The algorithm iteratively divides each region or cellinto four subregions or subcells when the maximum capacity per cell, denotedNmax, is reached. Given two coordinates (the southern-west and northern-east limits) defining the geographical bounding box, the algorithm definesand queues a quadcell object which contains its geographical limits.
Algorithm 1: Quadtree Algorithm.
quad ← Quadcell(NElim, SWlim);queue ← List(quad) ;while Length(queue) > 0 do
q ← Pop(queue); // Obtains quad from the queueif CheckQuad(q) then
aux ←SplitQuad(q);Extend(queue,aux); // Push quad into the queue
end
end
For each quadcell in the queue, the algorithm queries the social net-work REST API, and compares the cardinality of the response against themaximum number of sensors per cell, Nmax. This task is performed by theCheckQuad function described in Algorithm 2.
10
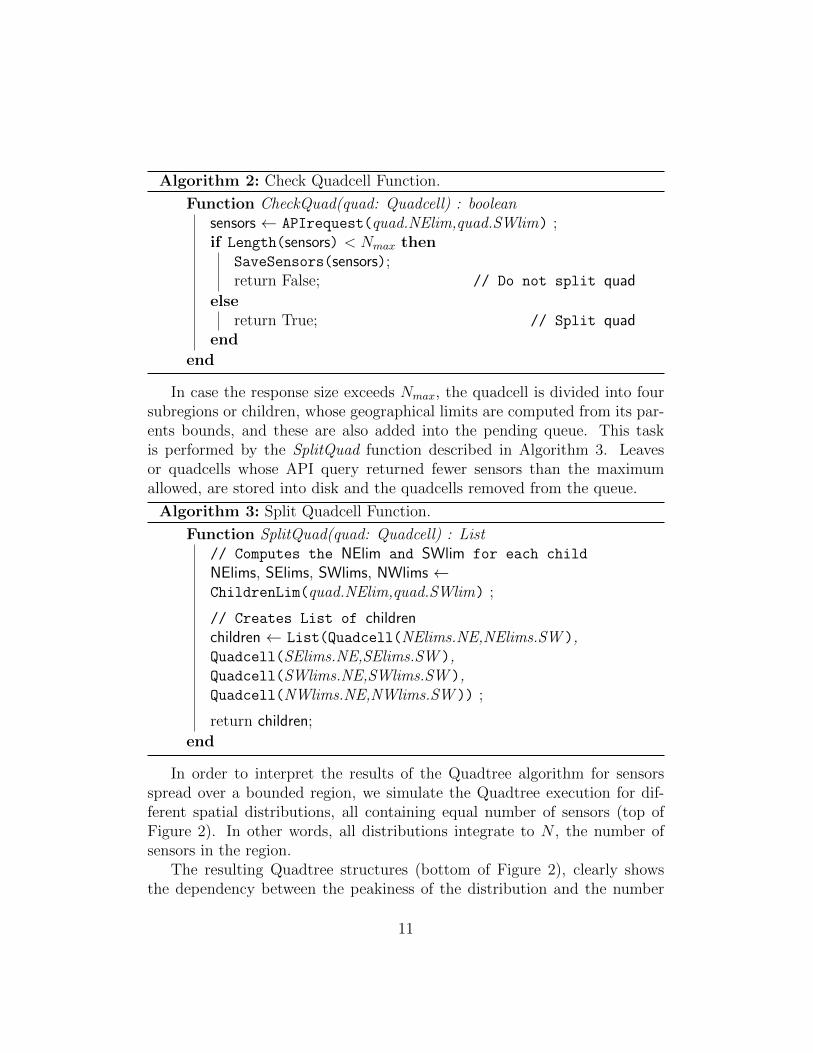
Algorithm 2: Check Quadcell Function.
Function CheckQuad(quad: Quadcell) : booleansensors ← APIrequest(quad.NElim,quad.SWlim) ;if Length(sensors) < Nmax then
SaveSensors(sensors);return False; // Do not split quad
elsereturn True; // Split quad
end
end
In case the response size exceeds Nmax, the quadcell is divided into foursubregions or children, whose geographical limits are computed from its par-ents bounds, and these are also added into the pending queue. This taskis performed by the SplitQuad function described in Algorithm 3. Leavesor quadcells whose API query returned fewer sensors than the maximumallowed, are stored into disk and the quadcells removed from the queue.
Algorithm 3: Split Quadcell Function.
Function SplitQuad(quad: Quadcell) : List// Computes the NElim and SWlim for each child
NElims, SElims, SWlims, NWlims ←ChildrenLim(quad.NElim,quad.SWlim) ;
// Creates List of childrenchildren ← List(Quadcell(NElims.NE,NElims.SW ),Quadcell(SElims.NE,SElims.SW ),Quadcell(SWlims.NE,SWlims.SW ),Quadcell(NWlims.NE,NWlims.SW )) ;
return children;
end
In order to interpret the results of the Quadtree algorithm for sensorsspread over a bounded region, we simulate the Quadtree execution for dif-ferent spatial distributions, all containing equal number of sensors (top ofFigure 2). In other words, all distributions integrate to N , the number ofsensors in the region.
The resulting Quadtree structures (bottom of Figure 2), clearly showsthe dependency between the peakiness of the distribution and the number
11
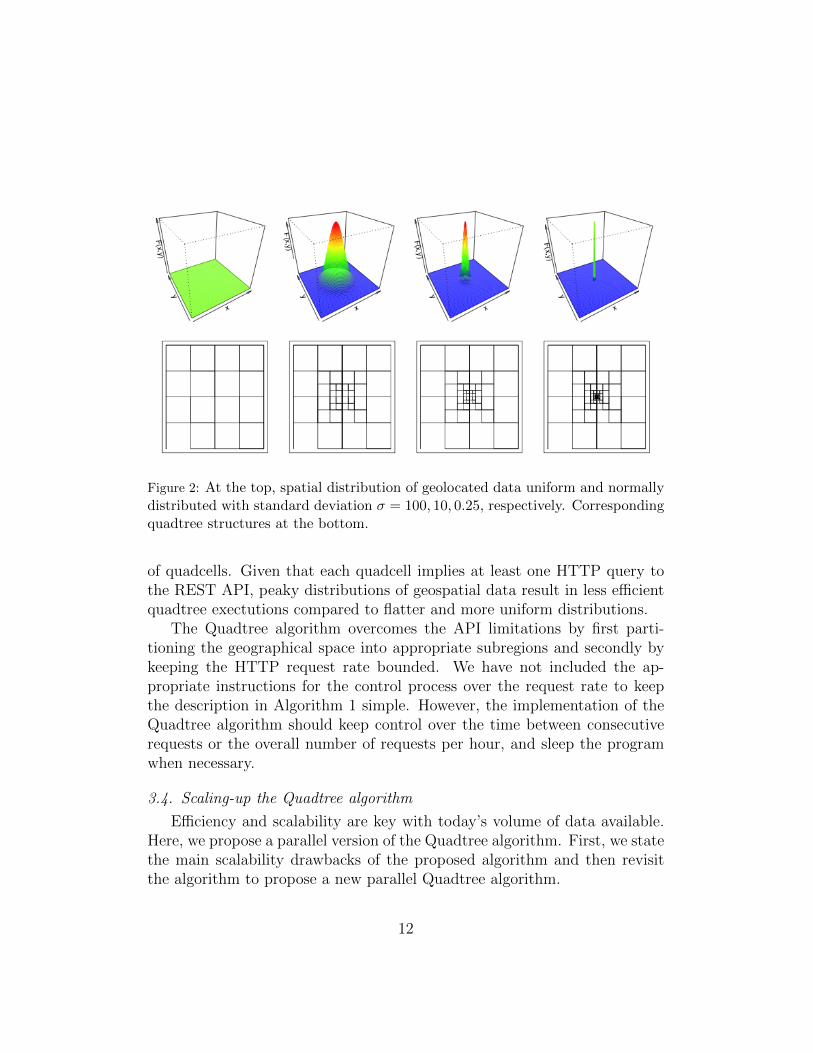
Figure 2: At the top, spatial distribution of geolocated data uniform and normallydistributed with standard deviation σ = 100, 10, 0.25, respectively. Correspondingquadtree structures at the bottom.
of quadcells. Given that each quadcell implies at least one HTTP query tothe REST API, peaky distributions of geospatial data result in less efficientquadtree exectutions compared to flatter and more uniform distributions.
The Quadtree algorithm overcomes the API limitations by first parti-tioning the geographical space into appropriate subregions and secondly bykeeping the HTTP request rate bounded. We have not included the ap-propriate instructions for the control process over the request rate to keepthe description in Algorithm 1 simple. However, the implementation of theQuadtree algorithm should keep control over the time between consecutiverequests or the overall number of requests per hour, and sleep the programwhen necessary.
3.4. Scaling-up the Quadtree algorithm
Efficiency and scalability are key with today’s volume of data available.Here, we propose a parallel version of the Quadtree algorithm. First, we statethe main scalability drawbacks of the proposed algorithm and then revisitthe algorithm to propose a new parallel Quadtree algorithm.
12
We assume that the maximum number of request per hour and per reg-istered application is Rmax. This limit is imposed by the social networkadministrator. When the number of sensors, N , is large Rmax becomes thelimiting factor of the algorithm performance.
Our approach uses parallelization of the algorithm into K sub-processes,each using a different registered application key and hence, enabling greaterrequest rates (with K sub-processes the limit becomes KRmax). These sub-processes could either run at the same machine or into different machineswith distinct public IP addresses, depending on social network directives.
One classical way to tackle this multiprocess problem is by means of theproducer-consumer paradigm. The producer is in charge of querying thesocial network API, generating and queuing the quadcells into a processingqueue. Then, the consumer takes each queued quadcell and stores it intothe disk. By splitting the two most time consuming sub-processes (query-ing the API and storing to disk), we experience considerable gains into theparallelization of the Quadtree algorithm.
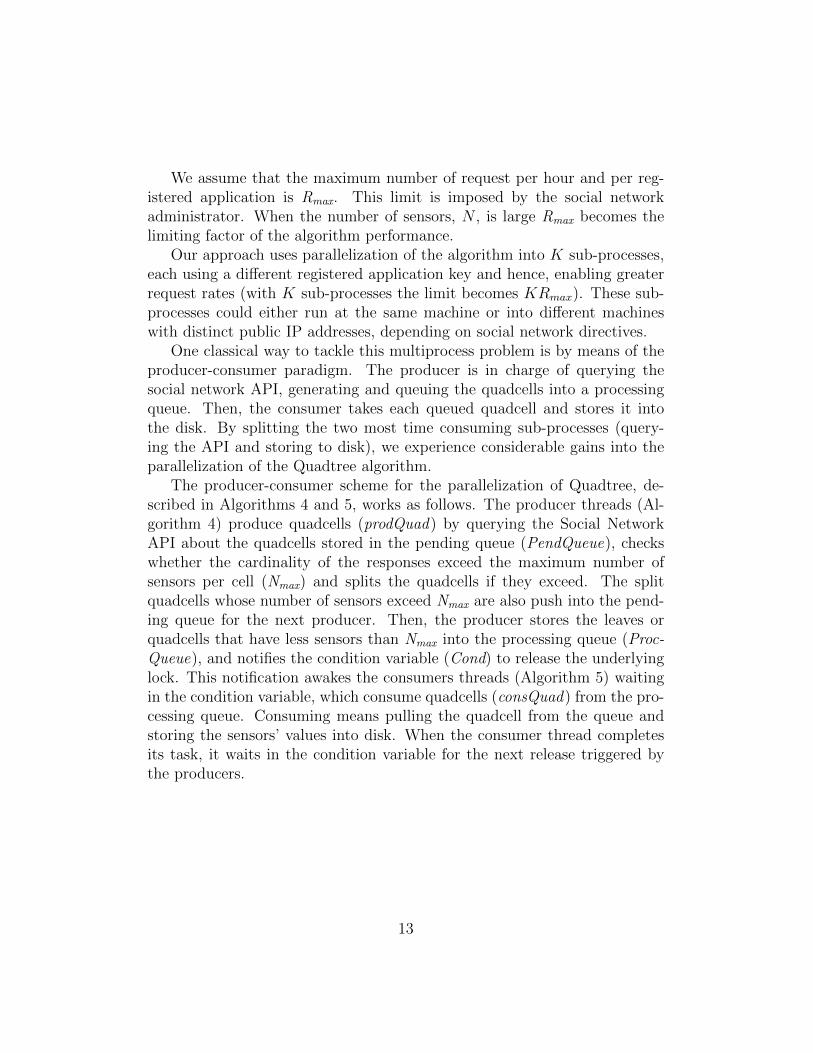
The producer-consumer scheme for the parallelization of Quadtree, de-scribed in Algorithms 4 and 5, works as follows. The producer threads (Al-gorithm 4) produce quadcells (prodQuad) by querying the Social NetworkAPI about the quadcells stored in the pending queue (PendQueue), checkswhether the cardinality of the responses exceed the maximum number ofsensors per cell (Nmax) and splits the quadcells if they exceed. The splitquadcells whose number of sensors exceed Nmax are also push into the pend-ing queue for the next producer. Then, the producer stores the leaves orquadcells that have less sensors than Nmax into the processing queue (Proc-Queue), and notifies the condition variable (Cond) to release the underlyinglock. This notification awakes the consumers threads (Algorithm 5) waitingin the condition variable, which consume quadcells (consQuad) from the pro-cessing queue. Consuming means pulling the quadcell from the queue andstoring the sensors’ values into disk. When the consumer thread completesits task, it waits in the condition variable for the next release triggered bythe producers.
13
Algorithm 4: Producer Quadtree Algorithm.
Function Producer (PendQueue: Queue, ProcQueue: Queue,Cond:Condition,API: APIhand ) : void
while countQuads(PendQueue) > 0 dowith(Cond);
q = prodQuad(PendQueue, API);putQuad(ProcQueue,q);notify(Cond);
endwith Cond: ;
notifyAll(Cond)end
Algorithm 5: Consumer Quadtree Algorithm.
Function Consumer (PendQueue: Queue, ProcQueue: Queue,Cond: Condition ) : void
while countQuads(PendQueue) > 0 dowith(Cond) ;Wait(Cond) ;if countQuads(ProcQueue) > 0 then
consQuad(ProcQueue)end
end
end
3.5. Case study: the Foursquare platform
The Foursquare platform provides a REST API to interact with its com-ponents as well as to access its open social data from registered applications.Querying the platform on the geolocated venues data requires satisfying theresponse size constraints (50 venues per request) and rate limitations (5000request per hour and application). The parallel Quadtree algorithm enablesan effective and efficient data retrieval process by parallelizing API requestsinto Kp subprocesses and storing to disk into Kc subprocesses. We foundout that using Kp = 3 producers and Kc = 10 consumers exhibits a properperformance, although the optimization of these parameters is beyond thescope of this paper.
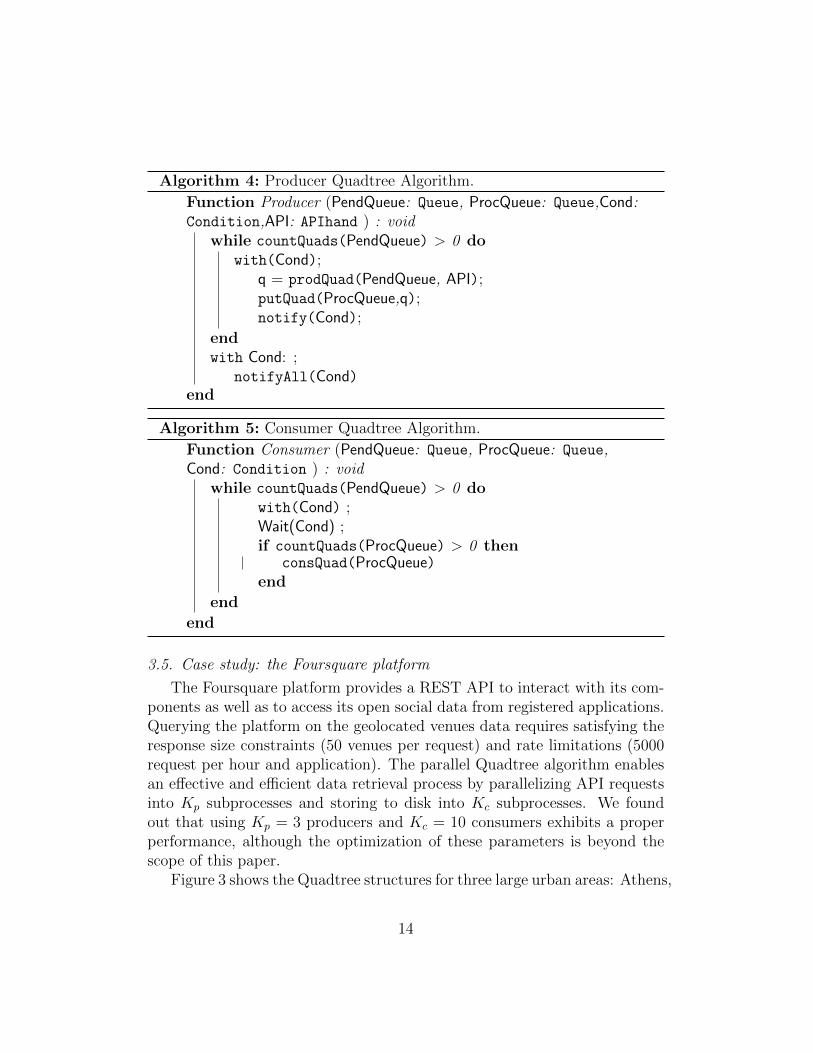
Figure 3 shows the Quadtree structures for three large urban areas: Athens,
14
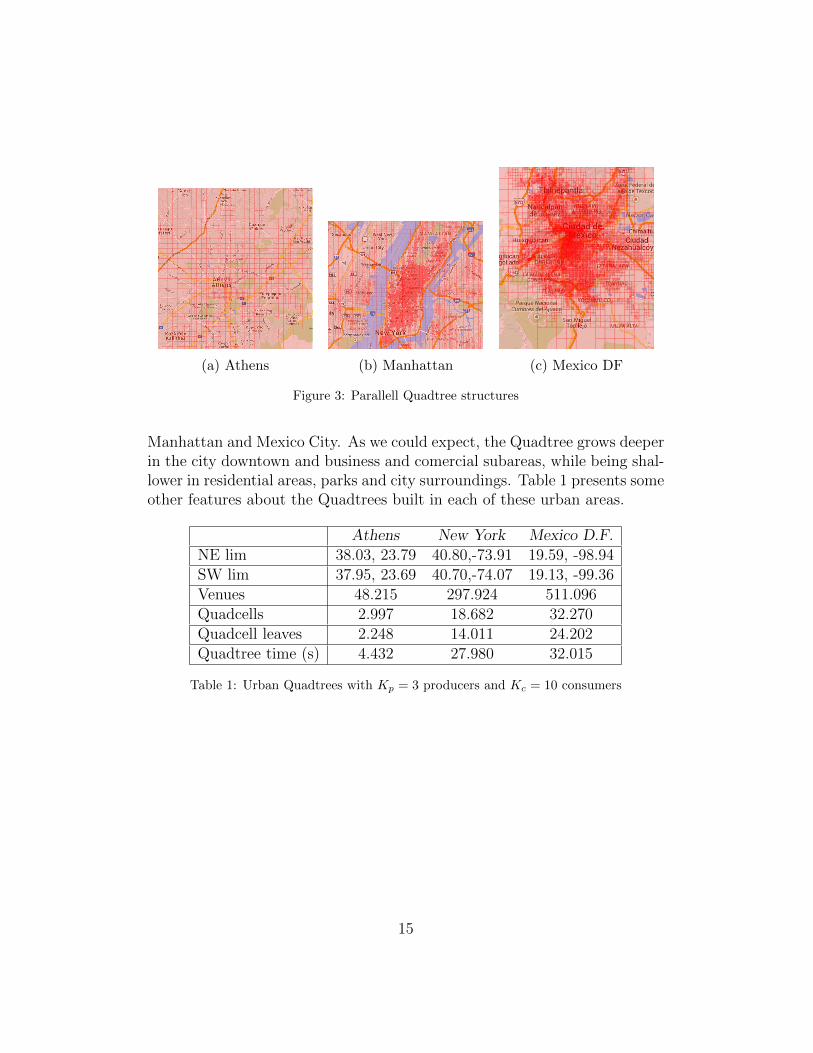
(a) Athens (b) Manhattan (c) Mexico DF
Figure 3: Parallell Quadtree structures
Manhattan and Mexico City. As we could expect, the Quadtree grows deeperin the city downtown and business and comercial subareas, while being shal-lower in residential areas, parks and city surroundings. Table 1 presents someother features about the Quadtrees built in each of these urban areas.
Athens New York Mexico D.F.NE lim 38.03, 23.79 40.80,-73.91 19.59, -98.94SW lim 37.95, 23.69 40.70,-74.07 19.13, -99.36Venues 48.215 297.924 511.096Quadcells 2.997 18.682 32.270Quadcell leaves 2.248 14.011 24.202Quadtree time (s) 4.432 27.980 32.015
Table 1: Urban Quadtrees with Kp = 3 producers and Kc = 10 consumers
15
4. GeoSRS system description
4.1. Overview
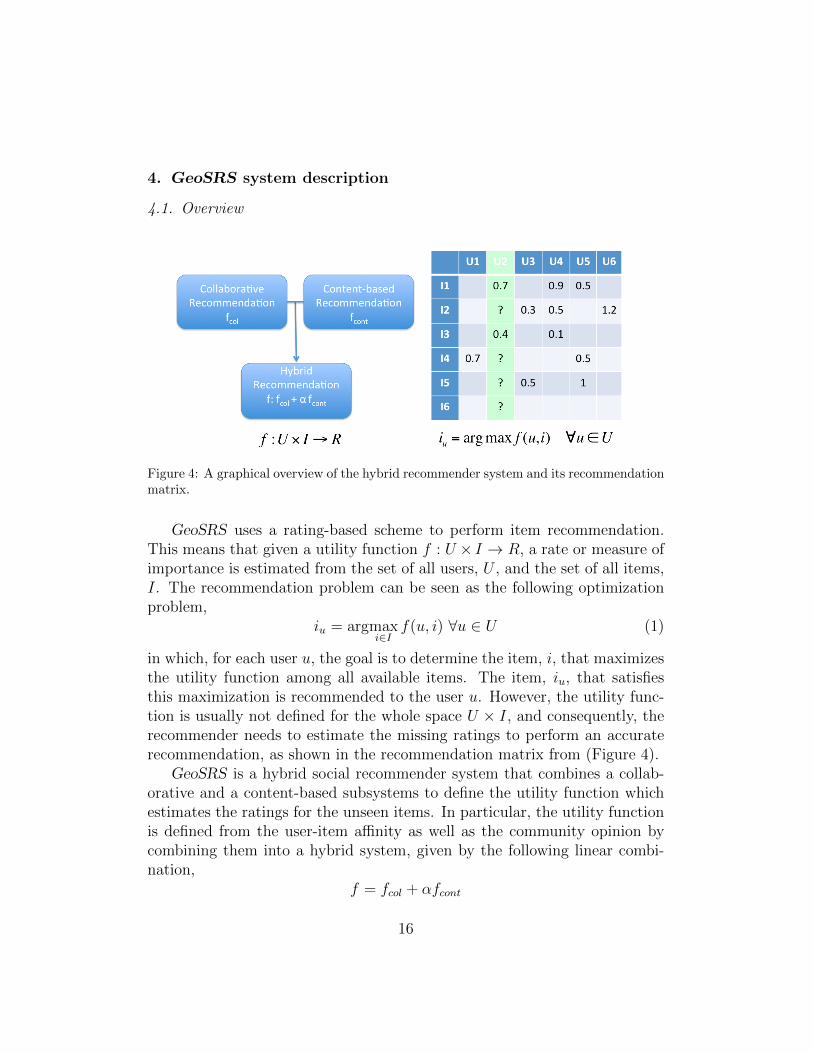
Figure 4: A graphical overview of the hybrid recommender system and its recommendationmatrix.
GeoSRS uses a rating-based scheme to perform item recommendation.This means that given a utility function f : U × I → R, a rate or measure ofimportance is estimated from the set of all users, U , and the set of all items,I. The recommendation problem can be seen as the following optimizationproblem,
iu = argmaxi∈I
f(u, i) ∀u ∈ U (1)
in which, for each user u, the goal is to determine the item, i, that maximizesthe utility function among all available items. The item, iu, that satisfiesthis maximization is recommended to the user u. However, the utility func-tion is usually not defined for the whole space U × I, and consequently, therecommender needs to estimate the missing ratings to perform an accuraterecommendation, as shown in the recommendation matrix from (Figure 4).
GeoSRS is a hybrid social recommender system that combines a collab-orative and a content-based subsystems to define the utility function whichestimates the ratings for the unseen items. In particular, the utility functionis defined from the user-item affinity as well as the community opinion bycombining them into a hybrid system, given by the following linear combi-nation,
f = fcol + αfcont
16
where α is a a positive real, and while the content-based branch, fcont, mainlyuses the inferred features of the item and the profile of the user, the collab-orative branch, fcol, takes advantage of the “wisdom of the crowd”.
4.2. Content-based branch
The content-based recommendation branch brings into the system theuser preferences and item features with the purpose of making recommenda-tions according to the user profile. Following the introduced nomenclature,the utility function for the content-based branch predicts the rate for bothseen and unseen items. The rate, R, is predicted from the dot product ofthe users profile vectors, wu, and items features vectors, wi. Thus, the utilityfunction can be redefined as,
fcont : wu × wi → R (2)
Due to the fact that items and users spaces are large, mechanism to reducedimensionality or filtering items/users are often used.
4.2.1. Similarity Measurement
Similarity measurement among pairs of users and items can be eithercalculated using heuristic models or statistical models learned from the un-derlying data (Adomavicius and Tuzhilin, 2005). Our proposed approachfor the content-based branch uses a cosine-based heuristic model in order tocompute the similarity rate between user profiles and items features. Hence,the utility function formulation can be expressed as:
fcont = cos(wu, wi) =−→wu−→wi
||−→wu||||−→wi||(3)
where wu and wi are the profile vectors for the users and items defined fromthe reviews content models described below.
4.2.2. Review content models
Text reviews have been preprocessed using standard techniques, in par-ticular we have removed stop-words and punctuation marks, stripped whitespace, and converted all text to lower case.
In this work we consider several state-of-the-art techniques for reviewmodeling. The aim of modeling reviews is to build descriptive profiles forboth users and items. To this end, we aggregate all reviews by a user, and
17

consider the aggregated reviews as a single text document to be modeled,wu. Analogously, we aggregate all reviews of a given item in order to builda document that once modeled will represent the item, wi. In what follows,we list and briefly explain the modeling techniques we have used to modelaggregated text reviews into K components for both profile vectors.
Term Frequency - Inverse Document Frequency. TF-IDF maps the contentsof a review into a set of K keywords depending on the measurement ofimportance through the calculation of a numeric statistic (Sparck Jones,1972; Salton and Buckley, 1988). The numeric statistic is calculated for eachword from the review and then, the K more relevant words are kept.
Latent Semantic Analysis. LSA can be used to map the contents of a re-view into K latent concepts which turn out to be words that are close inmeaning (Deerwester et al., 1990). LSA is performed applying single valuedecomposition of a term-document matrix. This matrix contains the termsor words in the rows and the documents or reviews in the columns. The realnumber in the intersection of rows and columns indicates the occurrence ofterms in the document. The K largest eigenvalues and their correspondingeigenvectors lead to a rank K approximation of the term-document matrix.
Latent Dirichlet Allocation. LDA is a generative probabilistic model in whichdocuments or reviews are represented as random mixtures over latent topics,and each topic is characterized by a distribution over words (Blei et al., 2003).LDA is used to model reviews contents into topics that occurs in a review.Intuitively, a review can talk about the service of a Japanese restaurant, andanother review refers to the food of a local restaurant. Both reviews lead todifferent topics if the space of topics is large enough to differentiate amongthem.
4.3. Collaborative branch
The collaborative branch of the review-based recommender system aimsto gather the opinion of the crowd from the posted reviews. Recommendationis done based on the opinion that the close neighborhood has about a specificitem. Thus, we define the utility function f for the seen items ru′,i to be thesentiment indicator that comes from the sentiment analysis of a text reviewthat a user wrote about an item. For the unseen items, the heuristic proposedis an averaging over the rates of those similar users (“neighbors”) who haveseen the item. Formally,
18

fcol = ru,i =1
N
∑u′∈Nu
ru′,i (4)
where Nu represent the N users in the neighborhood of u. Determining Nand the neighborhood is key to achieve a good rate estimate for unseen items.
4.3.1. Neighborhood Identification
The neighborhood identification plays a key role to achieve an accurateprediction of the recommender rate. Recommender systems have tradition-ally used the similarity among users from the matrix of user-item ratings (Di-aby et al., 2013). Similarity usually takes into account pairs of ratings thatboth users have rated. Similarity measurement has been usually calculatedby means of a heuristic mechanism such as the Pearson correlation coefficientor cosine-based similarity (Adomavicius and Tuzhilin, 2005).
We propose to use the cosine-based similarity for the review-based rec-ommender collaborative branch, as the heuristic measurement of similarityof two pairs of user vectors −→ux, −→uy. This is
sim(ux, uy) = cos(ux, uy) =−→ux−→uy
||−→ux||||−→uy||(5)
The user vectors are defined from sentiment ratings over all items. Withthis approach, pairs of users who have both rated positively or negativelypairs of items, share similar opinions for the unseen items. The cosine-basedsimilarity becomes a useful metric to identify them.
Lately, social recommender systems have introduced novel mechanismto identify the neighbor for collaborative filtering. Groh and Ehmig (2007)propose to use social friendships or relationship to generate the neighborhoodfor a collaborative recommender. According to them, this approach couldoutperform the traditional collaborative filtering.
4.3.2. Review sentiment models
Text reviews have also been preprocessed using the aforementioned tech-niques before applying the following supervised sentiment models. Thesemodels have been trained with tagged reviews data and then used to pre-dict the sentiment for the out-of-sample reviews. In fact, we have used threedifferent data sets to build, test and validate the sentiment classifiers:
19
• A training data set. It is composed of 1500 text reviews. These reviewsare tagged using AFINN (Nielsen, 2011), a list of english words ratedfor valence with an integer between minus five (negative) and plus five(positive). The rating is discretized in three values -1, 0 and 1 via amodified version of sign function, indicating the negative, neutral andpositive reviews respectively.
• A testing data set. It is composed of 500 text reviews which also taggedusing the AFINN approach.
• A validation data set. It is composed of 200 text reviews that we havemanually tagged as positive, neutral or negative reviews.
Bernoulli Naive Bayes sentiment classifier. A Naive Bayes classifier consid-ers a probabilistic model with naive independence assumptions between thefeatures to predict the probability distribution of a sample over the set ofclasses. We aim to simply model the review sentiment by using a NaiveBayes classifier which considers a bag-of-words model for the review text.This means that we consider words as the model features without takingtheir position in the review into account and assuming independence amongwords of a given class (positive, negative or neutral). This can be achievedby using the Bernoulli Naive Bayes model, which defines features as inde-pendent binary inputs describing whether or not a word occurs in a givenreview (see McCallum et al. (1998) for a clarification on the different typesof Naive Bayes classifiers).
Multinomial Logistic Regression sentiment classifier. Since we aim to esti-mate three possible outcomes for each review, positive, negative and neutralreviews, a multi-class classifier is needed. The Multinomial Logistic regres-sion generalizes the logistic regression to a multi-class setting (Kim et al.,2002). This classifier estimates the probabilities of the possible outcomesbased on a set of features. It differs from the Naive Bayes classifier in thatthere is no need for statistical independence on the set of features or wordsused in the multinomial logit regression. A drawback, compared with NaiveBayes, is the fact that estimating the regression coefficients from a Multino-mial classifier is much complex and generally requires an iterative process.
Supervised Latent Dirichlet Allocation. The SLDA classifier for sentimentanalysis extends the LDA topic model with response variables for each doc-ument (Blei and McAuliffe, 2008). The response variable for a sentiment
20
analysis classifier corresponds to the sentiment class: positive, negative orneutral. Documents and their responses are jointly modeled to find the la-tent topics that best predict the responses for future unlabeled documents.
4.4. Hybrid set-up
Using a hybrid linear combination of the collaborative and content-basedbranches, we pretend to minimize the drawbacks of each individual approach.The hybrid model can be represented as follows, with α > 0,
f : U × I → R =⇒ f : fcol + αfcont (6)
On the one hand, collaborative approaches highly depend on the avail-ability of a critical mass of users who have rated enough items to effectivelypredict unseen items. One way to overcome the sparsity of the user-itemrating matrix is to jointly use profiling data to identify the close neighbor-hood. Our approach minimize the sparsity problem by combining the ratesfrom the content-based branch when the collaborative rates are not accurateenough.
On the other hand, content-based approaches basically fail to recommenditems whose features have not been rated yet by the user. In other words,the content-based recommender is overspecialized to the features from theseen items since user profiling arises from the items already seen by the user.Item diversity is added into our system to overcome this overspecialization.By combining the collaborative sentiment into the proposed system, unseenitem features are also recommended enhancing the overall accuracy.
There also exist drawbacks which are common to both approaches, suchas the cold start problem (Lika et al., 2014). For example, the new userproblem happens when a user has not reviewed any items or very few. In thissituation, the recommender is not capable of performing a recommendationand this lowers the system coverage. The new item problem is also a drawbackdifficult to minimize in both set-ups. It occurs when an item is new into thesystem and it has not yet been reviewed by any user. Since no user feedbackexist for these items, the system is not capable of performing an accuraterecommendation, also impacting the system coverage.
These two drawbacks are mainly due to the lack of data and hence theirsolution necessarily undergoes through the process of effectively crawlingmore data from users and items.
21
5. System evaluation
The evaluation methodology will measure how effectively GeoSRS rec-ommends an unseen item to a given user. It will then make use of the socialnetwork to assess the performance accuracy of the system by comparing theactual user feedback about an item against the potential recommendationrate for that item. Hence, we assume that there exists some degree of causal-ity between the fact of purchasing/experiencing an item and the subsequentaction of reviewing the product/experience.
This approach also provides a simple but powerful mechanism to measurethe recommendation coverage, or simply, the proportion of recommendationsthat the system is able to output. The inability to make a recommendationcan happen due to the facts that either the user provides feedback for thefirst time –new user problem– or the item has not yet been reviewed –newitem problem. For example, a user who checks into a Foursquare venue likea restaurant to have some food, would probably provide its own feedback inform of a review at the social network. The interpretation of this feedback(positive, negative or neutral) is used in our evaluation approach to be com-pared against the recommendation rate from GeoSRS at the reviewing timeand within the neighborhood of that restaurant.
Next, we describe the Foursquare data set that is later used to assessGeoSRS in terms of recommendation coverage and performance accuracy.
5.1. The Foursquare Restaurant Tips Data set
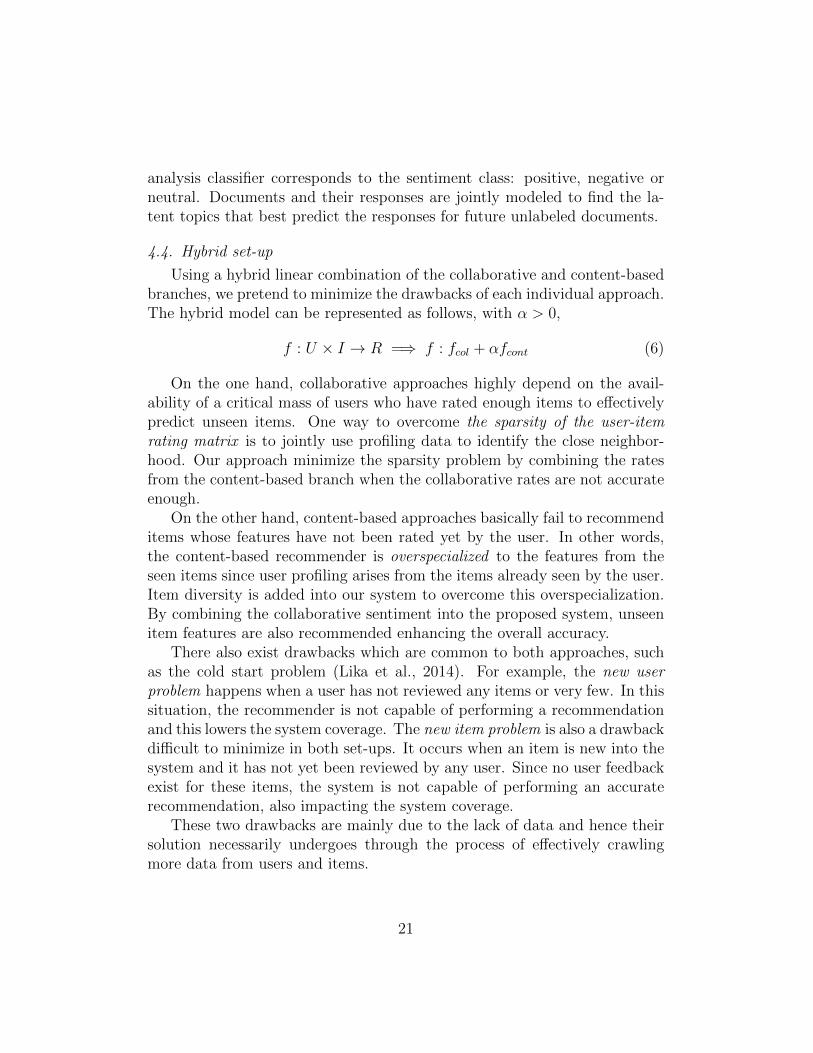
The Foursquare restaurant tips data set consists of 309.640 short reviewsor tips from the Manhattan region. The whole data set is split into training(70% oldest tips) and test set (30% newest tips).
22
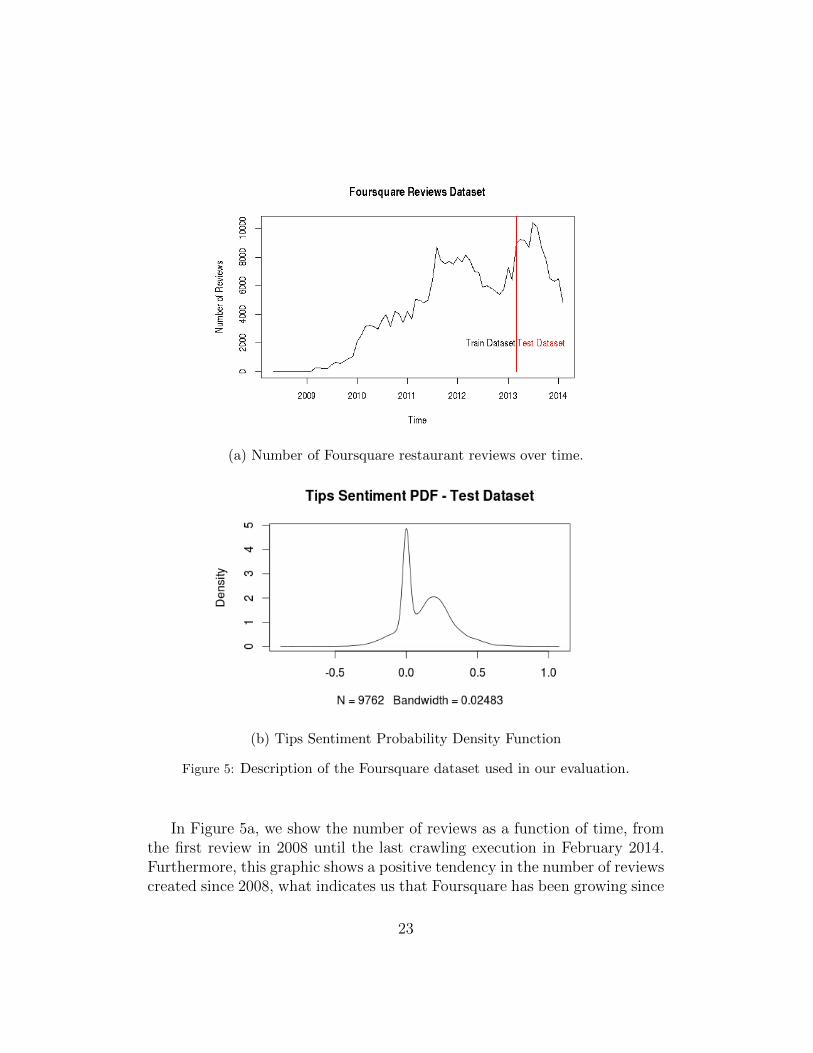
(a) Number of Foursquare restaurant reviews over time.
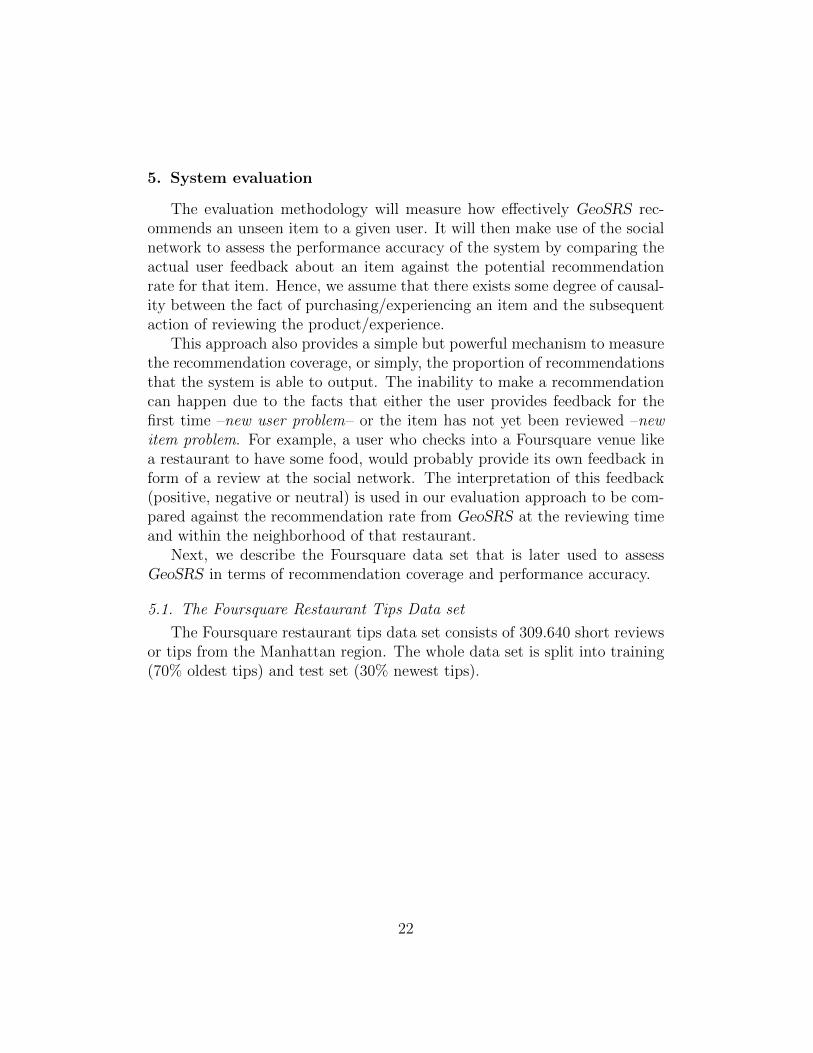
(b) Tips Sentiment Probability Density Function
Figure 5: Description of the Foursquare dataset used in our evaluation.
In Figure 5a, we show the number of reviews as a function of time, fromthe first review in 2008 until the last crawling execution in February 2014.Furthermore, this graphic shows a positive tendency in the number of reviewscreated since 2008, what indicates us that Foursquare has been growing since
23
then, despite some seasonal patterns. As it has been said, the whole data setis split into two subsets, which are also indicated in the plot.
Figure 5b shows the distribution of sentiment polarity of tips in the testdataset. While negative values in the pdf express negative sentiment, positivesentiment is contained in the interval (0, 1]. On the other hand, neutral userfeedback is represented by a sentiment value of zero. For evaluation purposes,we consider neutral feedback as a positive experience since most of them arestatements such as “Try the hot chocolate!”; we make the assumption thatthe user implicitly rates the experience as positive.
We also note that the test data set is unbalanced in terms of positiveand negative ratings, reflecting the reality of Foursquare tips data from early2013 till 2014. This might not be extremely relevant when assessing theperformance accuracy of this data set, but it is relevant when comparingdifferent recommender set-ups and the generalization capabilities.
5.2. Recommendation Coverage
Recommendation coverage measures the domain of items over which thesystem can perform recommendations (Ge et al., 2010). Typically, the termcoverage has been associated with (1) the percentage of the items for whichthe system is able to generate a recommendation and (2) the percentage ofthe available items which are effectively recommended. Here, we adopt theformer definition since we gather the latter in the concept of performanceaccuracy defined later. Thus, formally, Coverage is defined as the percent-age of available items (I) for which the recommender system can output aprediction (IP ) i.e. Cov = (| IP | / | I |) · 100.
In GeoSRS and within the proposed evaluation scheme, IP only dependson the presence or absence of historical data (tips) in the training data set foran item and user from the test data set. Given that the content-based branchoutputs a rate always that a given item and user have more than one tip,the overall recommendation coverage does not depend on the collaborativebranch.
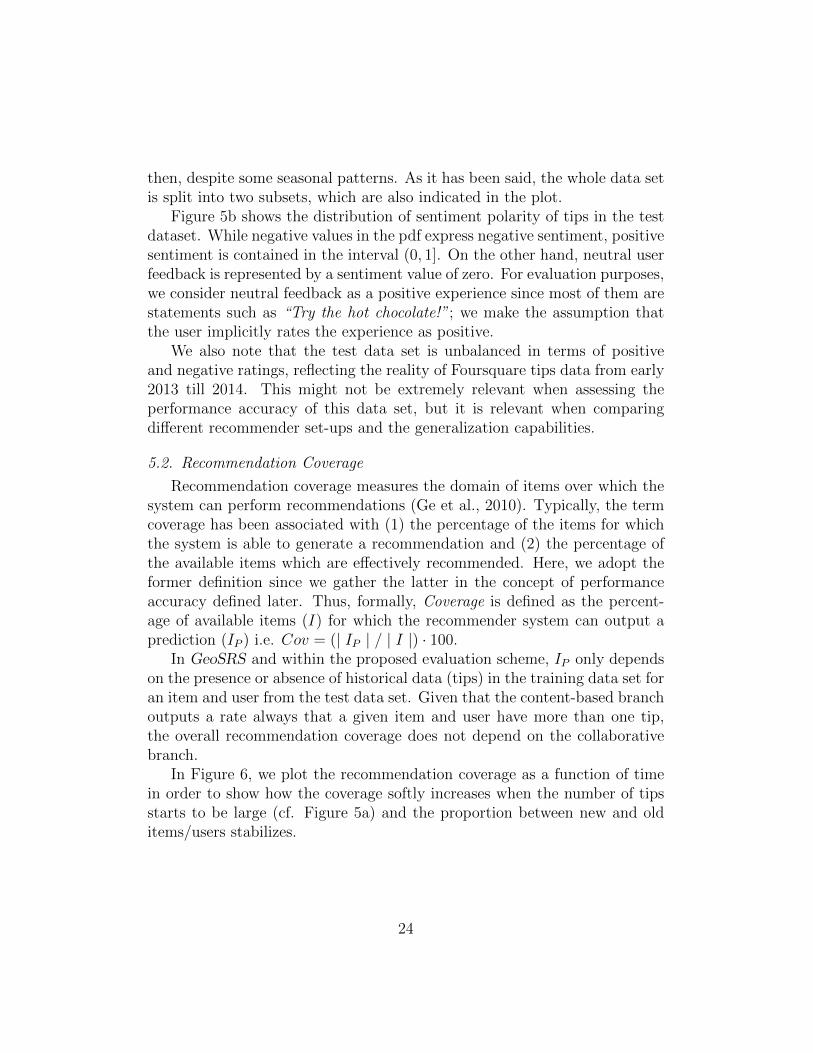
In Figure 6, we plot the recommendation coverage as a function of timein order to show how the coverage softly increases when the number of tipsstarts to be large (cf. Figure 5a) and the proportion between new and olditems/users stabilizes.
24
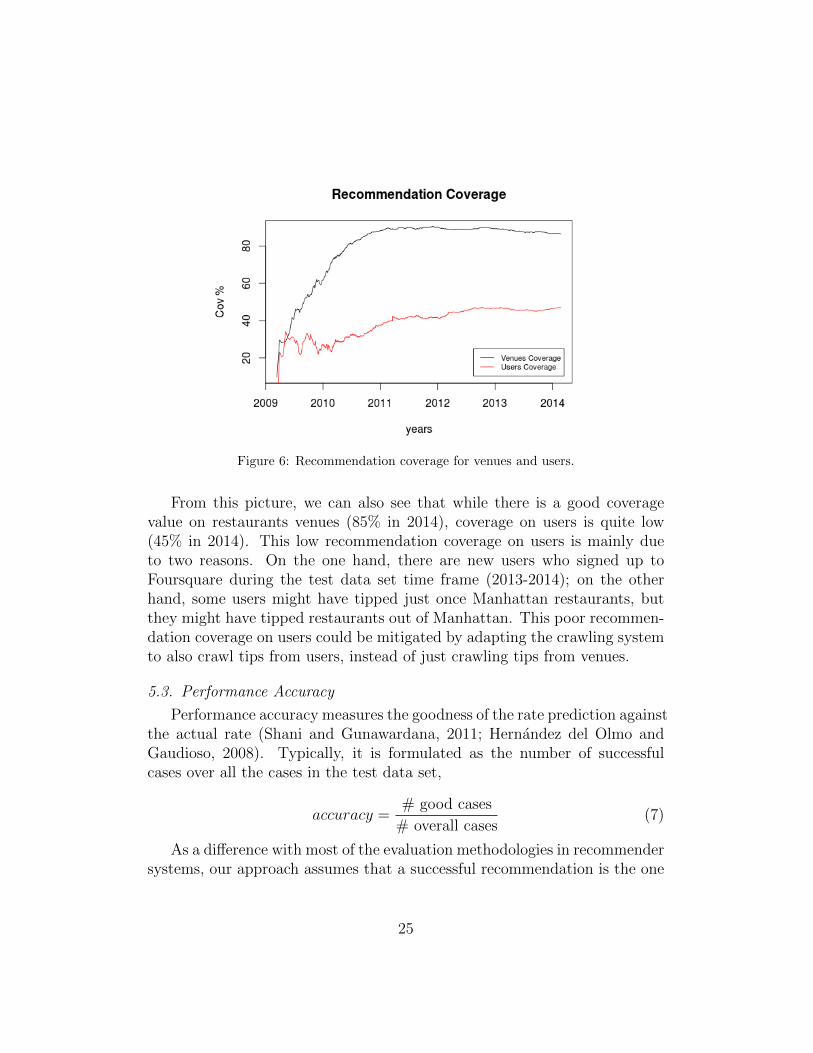
Figure 6: Recommendation coverage for venues and users.
From this picture, we can also see that while there is a good coveragevalue on restaurants venues (85% in 2014), coverage on users is quite low(45% in 2014). This low recommendation coverage on users is mainly dueto two reasons. On the one hand, there are new users who signed up toFoursquare during the test data set time frame (2013-2014); on the otherhand, some users might have tipped just once Manhattan restaurants, butthey might have tipped restaurants out of Manhattan. This poor recommen-dation coverage on users could be mitigated by adapting the crawling systemto also crawl tips from users, instead of just crawling tips from venues.
5.3. Performance Accuracy
Performance accuracy measures the goodness of the rate prediction againstthe actual rate (Shani and Gunawardana, 2011; Hernandez del Olmo andGaudioso, 2008). Typically, it is formulated as the number of successfulcases over all the cases in the test data set,
accuracy =# good cases
# overall cases(7)
As a difference with most of the evaluation methodologies in recommendersystems, our approach assumes that a successful recommendation is the one
25
that leads the user to a positive experience. The positiveness of the ex-perience is measured through the user feedback in the review, while therecommendation is generated by the engine.
Since the overall number of cases can be decomposed into positive andnegative cases, the accuracy can be also expressed in terms of the averageerror rate, ε, as,
accuracy = 1− # negative cases
# overall cases= 1− ε (8)
where εk is the recommendation error rate for the kth experiment, definedas follows:
εk =
{Nposk
NkSentiment is positive
1− Nposk
NkSentiment is negative
(9)
where Nk is the number of items recommended in the k experiment andNposk, the position in a ordered list that occupies the item that the user hasexperienced.
Notice that if a review is positive, then εk is low if the item is ranked atthe top of the recommendation list, while if a review is negative, εk is low ifthe item is ranked at the bottom of the list.
5.3.1. Collaborative-based model results
The proposed collaborative models gather the opinion of the crowd byaveraging the feedback from users whose taste is similar to the recommendeduser, a.k.a. neighborhood. As introduced earlier, the N neighbors are identi-fied through the k-nearest neighbor algorithm that uses the cosine similarityof the historical user experiences.
First, we plot the Area Under the Curves (AUC) of the recommendationerror cumulative density functions (cdf) which let us interpret the goodnessof the models with the available Foursquare data sets.
26
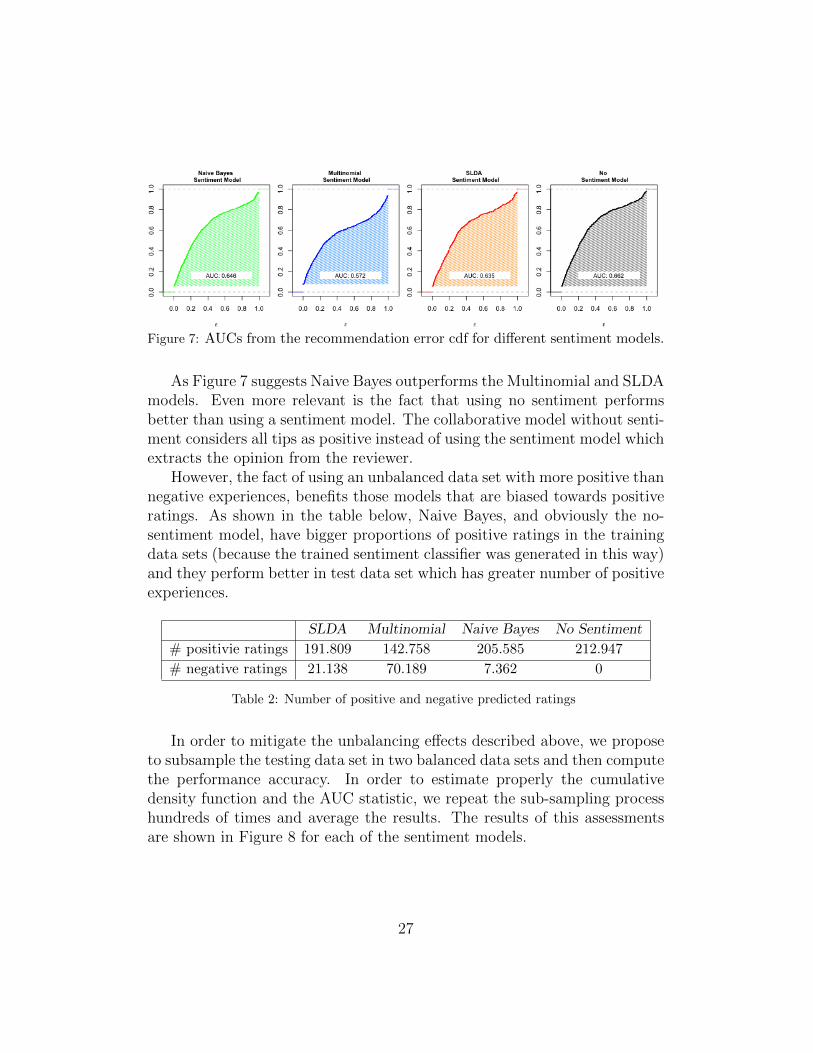
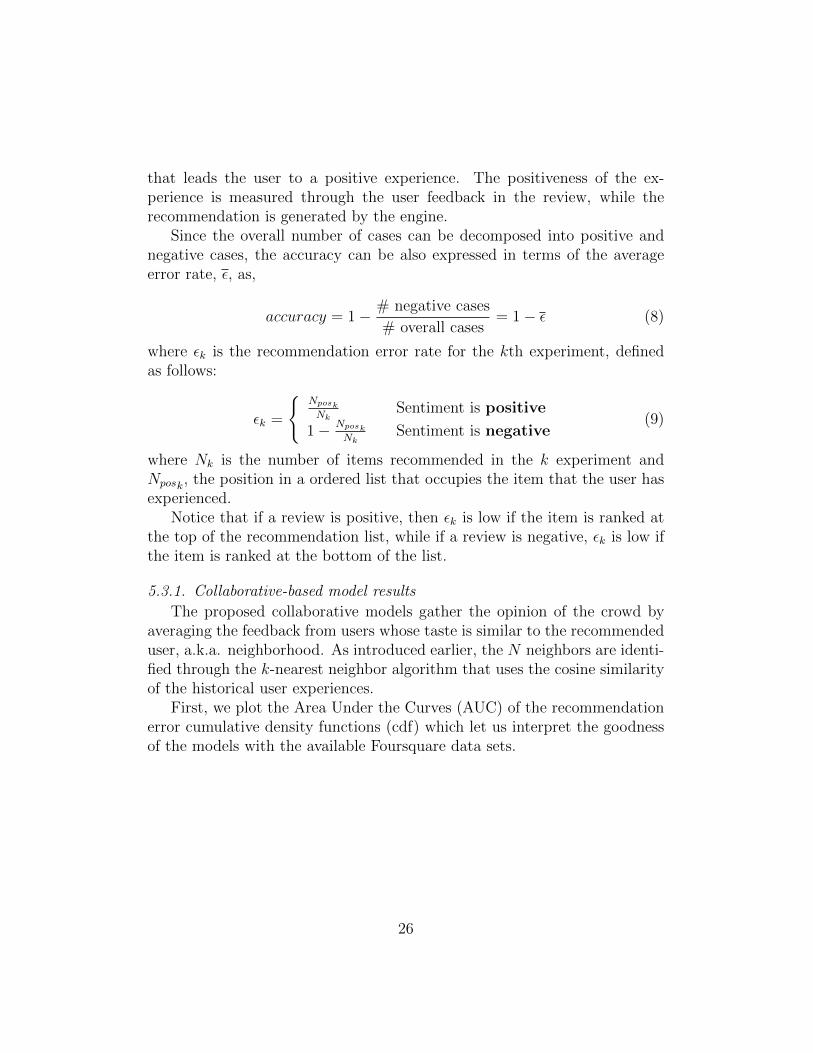
Figure 7: AUCs from the recommendation error cdf for different sentiment models.
As Figure 7 suggests Naive Bayes outperforms the Multinomial and SLDAmodels. Even more relevant is the fact that using no sentiment performsbetter than using a sentiment model. The collaborative model without senti-ment considers all tips as positive instead of using the sentiment model whichextracts the opinion from the reviewer.
However, the fact of using an unbalanced data set with more positive thannegative experiences, benefits those models that are biased towards positiveratings. As shown in the table below, Naive Bayes, and obviously the no-sentiment model, have bigger proportions of positive ratings in the trainingdata sets (because the trained sentiment classifier was generated in this way)and they perform better in test data set which has greater number of positiveexperiences.
SLDA Multinomial Naive Bayes No Sentiment
# positivie ratings 191.809 142.758 205.585 212.947
# negative ratings 21.138 70.189 7.362 0
Table 2: Number of positive and negative predicted ratings
In order to mitigate the unbalancing effects described above, we proposeto subsample the testing data set in two balanced data sets and then computethe performance accuracy. In order to estimate properly the cumulativedensity function and the AUC statistic, we repeat the sub-sampling processhundreds of times and average the results. The results of this assessmentsare shown in Figure 8 for each of the sentiment models.
27
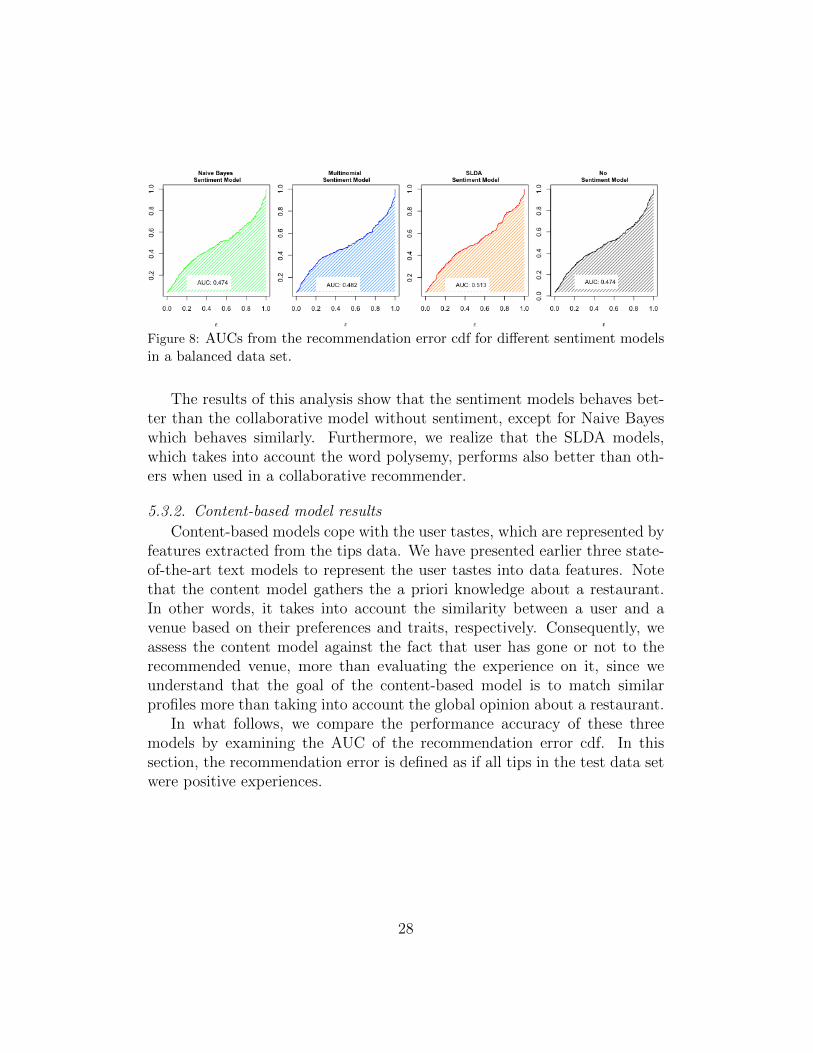
Figure 8: AUCs from the recommendation error cdf for different sentiment modelsin a balanced data set.
The results of this analysis show that the sentiment models behaves bet-ter than the collaborative model without sentiment, except for Naive Bayeswhich behaves similarly. Furthermore, we realize that the SLDA models,which takes into account the word polysemy, performs also better than oth-ers when used in a collaborative recommender.
5.3.2. Content-based model results
Content-based models cope with the user tastes, which are represented byfeatures extracted from the tips data. We have presented earlier three state-of-the-art text models to represent the user tastes into data features. Notethat the content model gathers the a priori knowledge about a restaurant.In other words, it takes into account the similarity between a user and avenue based on their preferences and traits, respectively. Consequently, weassess the content model against the fact that user has gone or not to therecommended venue, more than evaluating the experience on it, since weunderstand that the goal of the content-based model is to match similarprofiles more than taking into account the global opinion about a restaurant.
In what follows, we compare the performance accuracy of these threemodels by examining the AUC of the recommendation error cdf. In thissection, the recommendation error is defined as if all tips in the test data setwere positive experiences.
28
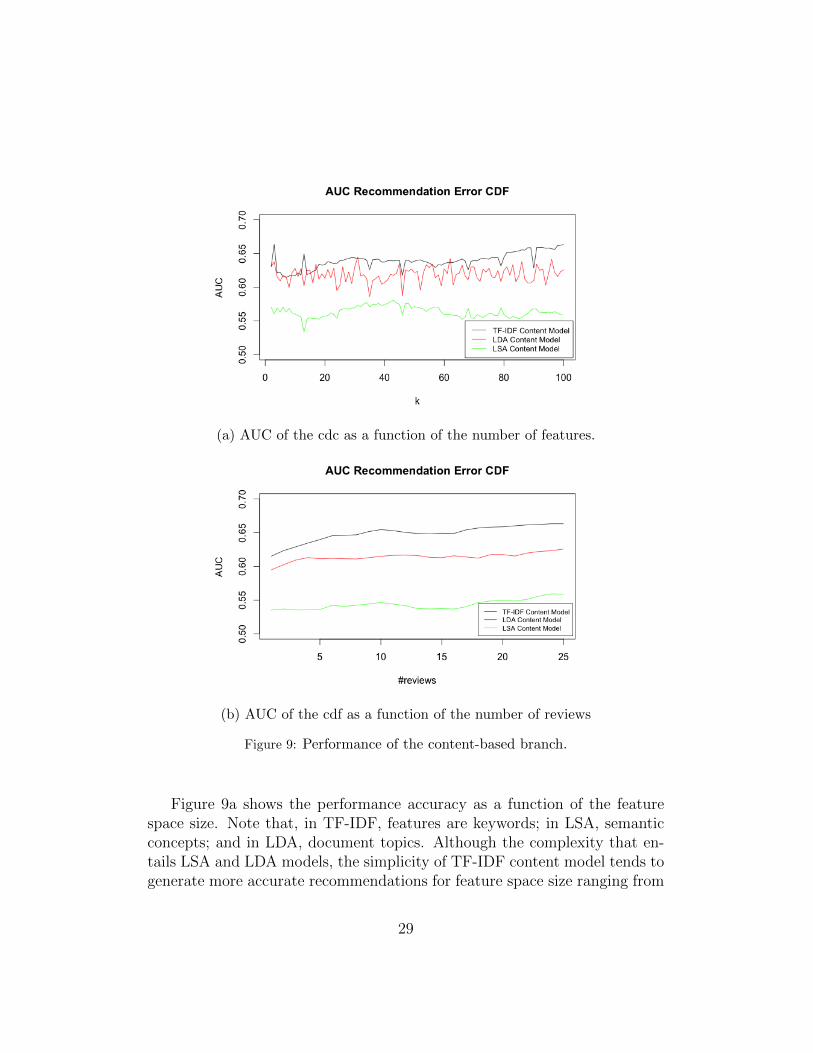
(a) AUC of the cdc as a function of the number of features.
(b) AUC of the cdf as a function of the number of reviews
Figure 9: Performance of the content-based branch.
Figure 9a shows the performance accuracy as a function of the featurespace size. Note that, in TF-IDF, features are keywords; in LSA, semanticconcepts; and in LDA, document topics. Although the complexity that en-tails LSA and LDA models, the simplicity of TF-IDF content model tends togenerate more accurate recommendations for feature space size ranging from
29
2 to 100 features, since it outputs a greater AUC and hence less recommen-dation error.
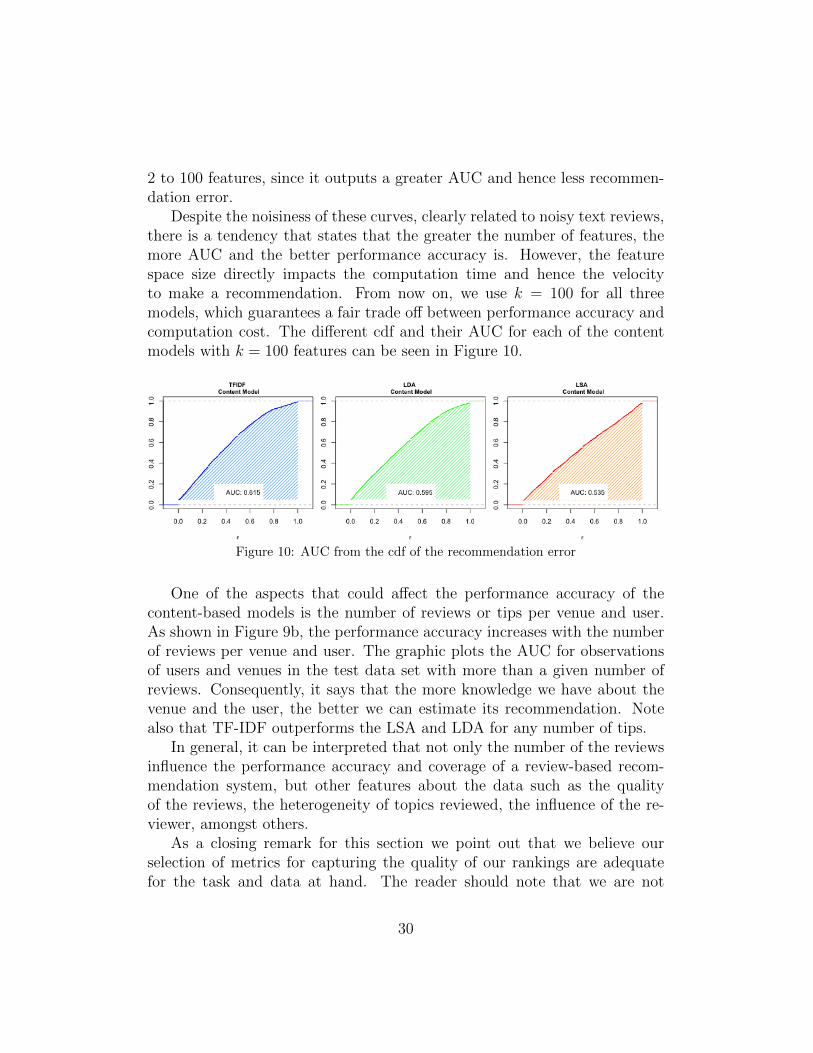
Despite the noisiness of these curves, clearly related to noisy text reviews,there is a tendency that states that the greater the number of features, themore AUC and the better performance accuracy is. However, the featurespace size directly impacts the computation time and hence the velocityto make a recommendation. From now on, we use k = 100 for all threemodels, which guarantees a fair trade off between performance accuracy andcomputation cost. The different cdf and their AUC for each of the contentmodels with k = 100 features can be seen in Figure 10.
Figure 10: AUC from the cdf of the recommendation error
One of the aspects that could affect the performance accuracy of thecontent-based models is the number of reviews or tips per venue and user.As shown in Figure 9b, the performance accuracy increases with the numberof reviews per venue and user. The graphic plots the AUC for observationsof users and venues in the test data set with more than a given number ofreviews. Consequently, it says that the more knowledge we have about thevenue and the user, the better we can estimate its recommendation. Notealso that TF-IDF outperforms the LSA and LDA for any number of tips.
In general, it can be interpreted that not only the number of the reviewsinfluence the performance accuracy and coverage of a review-based recom-mendation system, but other features about the data such as the qualityof the reviews, the heterogeneity of topics reviewed, the influence of the re-viewer, amongst others.
As a closing remark for this section we point out that we believe ourselection of metrics for capturing the quality of our rankings are adequatefor the task and data at hand. The reader should note that we are not
30
predicting ratings, and so more common measures such as MAE or RMSE arenot appropriate in our context. Please refer to (Adomavicius and Tuzhilin,2005; Lu et al., 2012) for more in depth discussion on the topic of classificationaccuracy metrics for ranking systems.
5.3.3. GeoSRS: our hybrid recommender system
Finally, we show results of GeoSRS, obtained by linearly combining bothcontent-based and collaborative approaches, as discussed in Section 4.1. Ouraim in this section is twofold. Firstly, we want to optimize the coefficient αfrom Eq. (6) that minimizes the recommendation error. In other words, weseek to find α values that maximizes the AUC of the recommendation errorcumulative density function. Hence, we simulate several recommendationsfor different α value and computed its associated AUC to find the one thatmaximizes it. Secondly, we aim to show that the hybrid approach consistentlyoutperforms each individual component.
To globally assess the recommender, we consider again the evaluationmodel with the testing experiences classified as positive or negative. TheSLDA sentiment model is chosen since it scored higher in the balanced eval-uation test. Furthermore, TF-IDF is chosen as the content-based model tobe included in this hybrid approach.
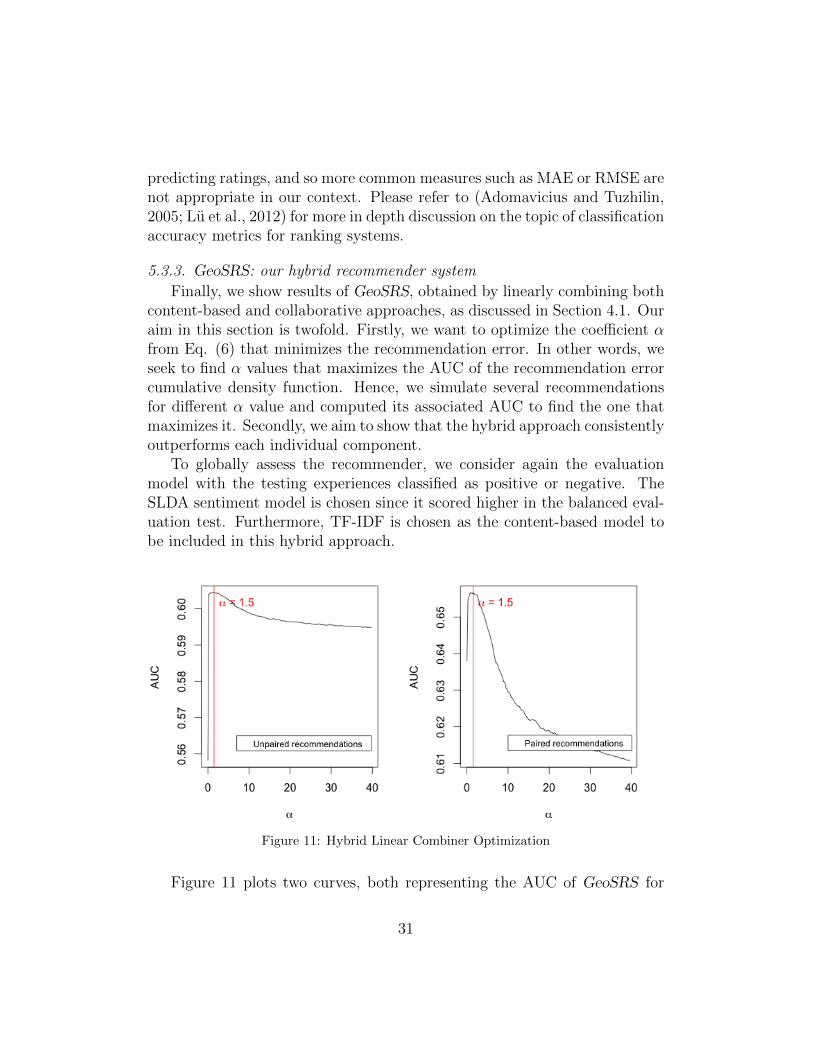
Figure 11: Hybrid Linear Combiner Optimization
Figure 11 plots two curves, both representing the AUC of GeoSRS for
31
different values of α ranging from 0 to 20, see Eq.(6). Notice that the col-laborative branch does not always output predictions due to lack of closeneighbors to the given user. The left-most plot shows the performance ofGeoSRS for all reviews in the test data set, whereas the right-most plotshows the performance of GeoSRS reviews that can be covered (make a rec-ommendation) by both system branches (“paired” recommendations). Asthe graphic shows, an α equal to 1.5 maximizes AUCs from both scenarios.Note also that α = 0 corresponds to the collaborative recommender, whileα→∞ corresponds to the content-based recommender.
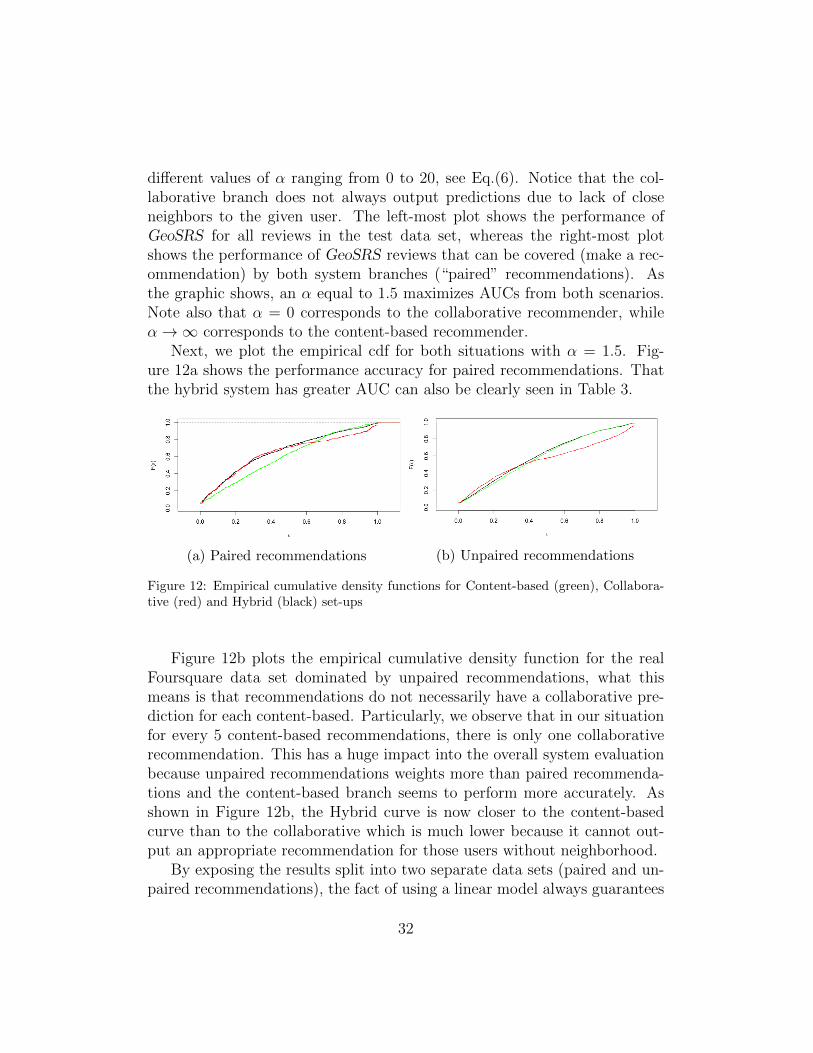
Next, we plot the empirical cdf for both situations with α = 1.5. Fig-ure 12a shows the performance accuracy for paired recommendations. Thatthe hybrid system has greater AUC can also be clearly seen in Table 3.
(a) Paired recommendations (b) Unpaired recommendations
Figure 12: Empirical cumulative density functions for Content-based (green), Collabora-tive (red) and Hybrid (black) set-ups
Figure 12b plots the empirical cumulative density function for the realFoursquare data set dominated by unpaired recommendations, what thismeans is that recommendations do not necessarily have a collaborative pre-diction for each content-based. Particularly, we observe that in our situationfor every 5 content-based recommendations, there is only one collaborativerecommendation. This has a huge impact into the overall system evaluationbecause unpaired recommendations weights more than paired recommenda-tions and the content-based branch seems to perform more accurately. Asshown in Figure 12b, the Hybrid curve is now closer to the content-basedcurve than to the collaborative which is much lower because it cannot out-put an appropriate recommendation for those users without neighborhood.
By exposing the results split into two separate data sets (paired and un-paired recommendations), the fact of using a linear model always guarantees
32
greater performance. The hybrid recommender performance benefits fromeither when the collaborative branch can work out a rating or when it can-not. Nonetheless, the biggest contributions happens when the collaborativebranch can recommend.
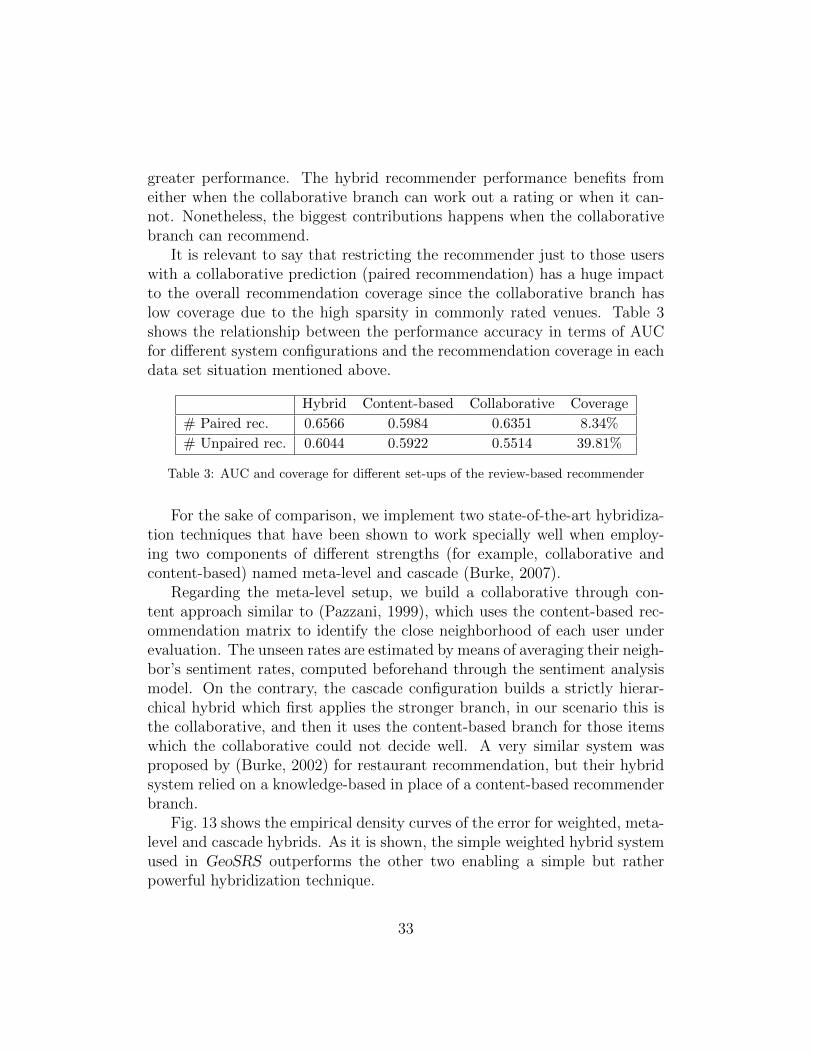
It is relevant to say that restricting the recommender just to those userswith a collaborative prediction (paired recommendation) has a huge impactto the overall recommendation coverage since the collaborative branch haslow coverage due to the high sparsity in commonly rated venues. Table 3shows the relationship between the performance accuracy in terms of AUCfor different system configurations and the recommendation coverage in eachdata set situation mentioned above.
Hybrid Content-based Collaborative Coverage
# Paired rec. 0.6566 0.5984 0.6351 8.34%
# Unpaired rec. 0.6044 0.5922 0.5514 39.81%
Table 3: AUC and coverage for different set-ups of the review-based recommender
For the sake of comparison, we implement two state-of-the-art hybridiza-tion techniques that have been shown to work specially well when employ-ing two components of different strengths (for example, collaborative andcontent-based) named meta-level and cascade (Burke, 2007).
Regarding the meta-level setup, we build a collaborative through con-tent approach similar to (Pazzani, 1999), which uses the content-based rec-ommendation matrix to identify the close neighborhood of each user underevaluation. The unseen rates are estimated by means of averaging their neigh-bor’s sentiment rates, computed beforehand through the sentiment analysismodel. On the contrary, the cascade configuration builds a strictly hierar-chical hybrid which first applies the stronger branch, in our scenario this isthe collaborative, and then it uses the content-based branch for those itemswhich the collaborative could not decide well. A very similar system wasproposed by (Burke, 2002) for restaurant recommendation, but their hybridsystem relied on a knowledge-based in place of a content-based recommenderbranch.
Fig. 13 shows the empirical density curves of the error for weighted, meta-level and cascade hybrids. As it is shown, the simple weighted hybrid systemused in GeoSRS outperforms the other two enabling a simple but ratherpowerful hybridization technique.
33
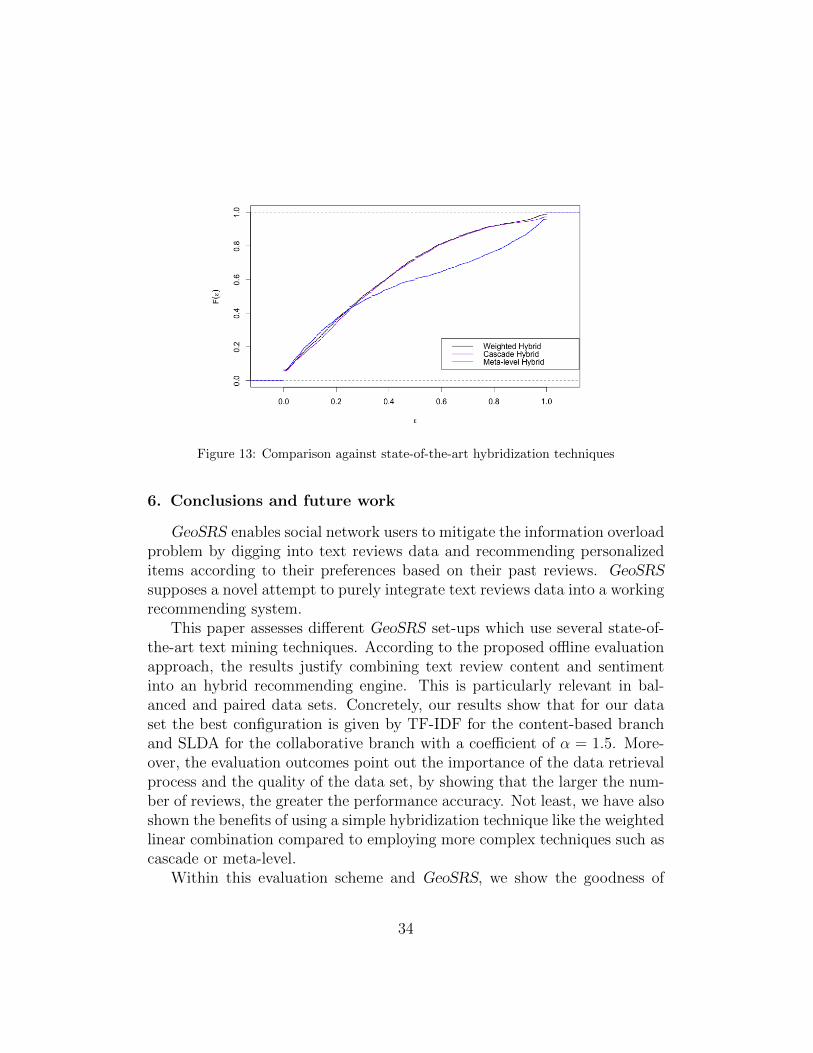
Figure 13: Comparison against state-of-the-art hybridization techniques
6. Conclusions and future work
GeoSRS enables social network users to mitigate the information overloadproblem by digging into text reviews data and recommending personalizeditems according to their preferences based on their past reviews. GeoSRSsupposes a novel attempt to purely integrate text reviews data into a workingrecommending system.
This paper assesses different GeoSRS set-ups which use several state-of-the-art text mining techniques. According to the proposed offline evaluationapproach, the results justify combining text review content and sentimentinto an hybrid recommending engine. This is particularly relevant in bal-anced and paired data sets. Concretely, our results show that for our dataset the best configuration is given by TF-IDF for the content-based branchand SLDA for the collaborative branch with a coefficient of α = 1.5. More-over, the evaluation outcomes point out the importance of the data retrievalprocess and the quality of the data set, by showing that the larger the num-ber of reviews, the greater the performance accuracy. Not least, we have alsoshown the benefits of using a simple hybridization technique like the weightedlinear combination compared to employing more complex techniques such ascascade or meta-level.
Within this evaluation scheme and GeoSRS, we show the goodness of
34
recommendation coverage is tied to the fact of having historical reviews forall users and all items. We observe that the growth of the social networkactivity over the years directly improves this evaluation figure, but we alsostate that the more retrieved data, the better the coverage. We speculatethat the quality of our recommendations should improve as the number ofreviews increases over time.
In order to directly impact the performance accuracy and recommenda-tion coverage of the GeoSRS, this article also motivates the use of Quadtreealgorithm to efficiently retrieve geolocated data, such as reviews from Four-square. A parallel version of Quadtree is detailed in this article with theaim to effectively crawl data from large urban areas. As a result, GeoSRStogether with the Quadtree crawling process become key components of arecommending system capable of working in large data sets of reviews forlarge urban areas.
Finally, we can conclude that GeoSRS results, as in many other recom-mender systems, highly depend on the availability and quality of the data.We have shown that by balancing data sets or making paired recommenda-tions in the hybrid set-up, the outcome of the system could differ. Becauseof this, we deeply encourage GeoSRS to undergo through online evaluationtests, such as randomized experiments or A/B testing, in order to mitigatethe skewness on the Foursquare test data sets and get more reliable results.
Acknowledgements. The authors gratefully acknowledge the extensive com-
ments of the anonymous reviewers that lead to an improvement of the original
manuscript.
References
Aciar, S., Zhang, D., Simoff, S., Debenham, J., 2007. Informed recommender:Basing recommendations on consumer product reviews. IEEE IntelligentSystems 22 (3), 39–47.
Adomavicius, G., Tuzhilin, A., Jun. 2005. Toward the next generation ofrecommender systems: A survey of the state-of-the-art and possible ex-tensions. IEEE Trans. on Knowl. and Data Eng. 17 (6), 734–749.
Andersen, R., Borgs, C., Chayes, J., Feige, U., Flaxman, A., Kalai, A., Mir-rokni, V., Tennenholtz, M., 2008. Trust-based recommendation systems:
35
an axiomatic approach. In: Proc. of the 17th Int. Conf. on World WideWeb (Beijing). ACM, pp. 199–208.
Berjani, B., Strufe, T., 2011. A recommendation system for spots in location-based online social networks. In: Proc. of the 4th Workshop on SocialNetwork Systems (Salzburg). ACM, p. 4.
Blei, D., McAuliffe, J., 2008. Supervised topic models. In: Platt, J., Koller,D., Singer, Y., Roweis, S. (Eds.), Advances in Neural Information Process-ing Systems (Vancouver). Vol. 20. MIT Press, pp. 121–128.
Blei, D. M., Ng, A. Y., Jordan, M. I., Mar. 2003. Latent dirichlet allocation.J. Mach. Learn. Res. 3, 993–1022.
Bohning, D., 1992. Multinomial logistic regression algorithm. Annals of theInstitute of Statistical Mathematics 44 (1), 197–200.
Burke, R., 2002. Hybrid recommender systems: Survey and experiments.User modeling and user-adapted interaction 12 (4), 331–370.
Burke, R., 2007. Hybrid web recommender systems. In: The adaptive web.Springer, pp. 377–408.
Deerwester, S., Dumais, S. T., Furnas, G. W., Landauer, T. K., Harshman,R., 1990. Indexing by latent semantic analysis. J. of the American Soc. forInformation Sci. 41 (6), 391–407.
Diaby, M., Viennet, E., Launay, T., 2013. Toward the next generation of re-cruitment tools: An online social network-based job recommender system.In: Proc. of the 2013 IEEE/ACM Int. Conf. on Advances in Social Net-works Analysis and Mining (Niagara Falls). ASONAM ’13. pp. 821–828.
Falahi, K., Mavridis, N., Atif, Y., 2012. Social networks and recommendersystems: A world of current and future synergies. In: Abraham, A., Has-sanien, A.-E. (Eds.), Computational Social Networks. pp. 445–465.
Gartrell, M., Xing, X., Lv, Q., Beach, A., Han, R., Mishra, S., Seada, K.,2010. Enhancing group recommendation by incorporating social relation-ship interactions. In: Proc. of the 16th ACM Int. Conf. on SupportingGroup Work (Sanibel Island). GROUP ’10. pp. 97–106.
36
Ge, M., Delgado-Battenfeld, C., Jannach, D., 2010. Beyond accuracy: Eval-uating recommender systems by coverage and serendipity. In: Proc. of theFourth ACM Conf. on Recommender Systems (Foster City). RecSys ’10.pp. 257–260.
Groh, G., Ehmig, C., 2007. Recommendations in taste related domains: Col-laborative filtering vs. social filtering. In: Proc. of the 2007 Int. ACM Conf.on Supporting Group Work (Sanibel Island). GROUP ’07. pp. 127–136.
Guy, I., Carmel, D., 2011. Social recommender systems. In: Proc. of the 20thInt. Conf. Companion on World Wide Web (Hyderabad). WWW ’11. pp.283–284.
Hernandez del Olmo, F., Gaudioso, E., 2008. Evaluation of recommendersystems: A new approach. Expert Syst. Appl. 35 (3), 790–804.
Huang, J., Cheng, X.-Q., Guo, J., Shen, H.-W., Yang, K., 2010. Social rec-ommendation with interpersonal influence. In: Proc. of the 2010 Conf. onECAI 2010: 19th European Conf. on Artificial Intelligence. pp. 601–606.
Jakob, N., Weber, S. H., Muller, M. C., Gurevych, I., 2009. Beyond thestars: Exploiting free-text user reviews to improve the accuracy of movierecommendations. In: Proc. of the 1st Int.l CIKM Workshop on Topic-sentiment Analysis for Mass Opinion (Hong Kong). TSA ’09. pp. 57–64.
Jamali, M., Ester, M., 2009. Trustwalker: a random walk model for combin-ing trust-based and item-based recommendation. In: Proc. of the 15thACM SIGKDD Int. Conf. on Knowledge Discovery and Data Mining(Paris). ACM, pp. 397–406.
Jameson, A., 2004. More than the sum of its members: Challenges for grouprecommender systems. In: Proc. of the Working Conference on AdvancedVisual Interfaces (Gallipoli). AVI ’04. pp. 48–54.
Kim, S.-B., Rim, H.-C., Yook, D., Lim, H.-S., 2002. Effective methods for im-proving Naive Bayes text classifiers. In: PRICAI 2002: Trends in ArtificialIntelligence. Springer, pp. 414–423.
Kim, S.-M., Pantel, P., Chklovski, T., Pennacchiotti, M., 2006. Automati-cally assessing review helpfulness. In: Proc. of the 2006 Conf. on EmpiricalMethods in Natural Language Processing. EMNLP ’06. pp. 423–430.
37
Lika, B., Kolomvatsos, K., Hadjiefthymiades, S., 2014. Facing the cold startproblem in recommender systems. Expert Systems with Applications 41 (4,Part 2), 2065 – 2073.
Liu, X., Aberer, K., 2013. SoCo: A social network aided context-aware rec-ommender system. In: Proc. of the 22nd Int. Conf. on World Wide Web.WWW ’13. pp. 781–802.
Liu, Y., Huang, X., An, A., Yu, X., 2008. Modeling and predicting thehelpfulness of online reviews. In: Eighth IEEE Int. Conf. on Data Mining,ICDM ’08. pp. 443–452.
Lu, L., Medo, M., Yeung, C. H., Zhang, Y.-C., Zhang, Z.-K., Zhou, T., 2012.Recommender systems. Physics Reports 519 (1), 1–49.
Lu, Y., Tsaparas, P., Ntoulas, A., Polanyi, L., 2010. Exploiting social contextfor review quality prediction. In: Proc. of the 19th Int. Conf. on WorldWide Web. WWW ’10. pp. 691–700.
Ma, H., Yang, H., Lyu, M. R., King, I., 2008. SoRec: Social recommendationusing probabilistic matrix factorization. In: Proc. of the 17th ACM Conf.on Information and Knowledge Management. CIKM ’08. pp. 931–940.
Massa, P., Avesani, P., 2007. Trust-aware recommender systems. In: Proc.of the 2007 ACM Conf. on Recommender systems. ACM, pp. 17–24.
McCallum, A., Nigam, K., et al., 1998. A comparison of event models forNaive Bayes text classification. In: AAAI-98 Workshop on Learning forText Categorization. Vol. 752. pp. 41–48.
Mobasher, B., Jin, X., Zhou, Y., 2004. Semantically enhanced collabora-tive filtering on the web. In: Web Mining: From Web to Semantic Web.Springer, pp. 57–76.
Moghaddam, S., Jamali, M., Ester, M., Habibi, J., 2009. Feedbacktrust:Using feedback effects in trust-based recommendation systems. In: Proc.of the 3rd ACM Conf. on Recommender Systems. RecSys ’09. pp. 269–272.
Mokbel, M. F., Bao, J., Eldawy, A., Levandoski, J. J., Sarwat, M., 2011.Personalization, socialization, and recommendations in location-based ser-vices 2.0. In: PersDB 2011 Workshop, Seattle, Washington, USA.
38
Musat, C.-C., Liang, Y., Faltings, B., 2013. Recommendation using textualopinions. In: Proc. of the 23rd Int. Joint Conf. on Artificial Intelligence.AAAI Press, pp. 2684–2690.
Nielsen, F. A., 2011. A new ANEW: Evaluation of a word list for sentimentanalysis in microblogs. In: Proc. of the ESWC2011 Workshop on ’MakingSense of Microposts’: Big things come in small packages. pp. 93–98.
O’Doherty, D., Jouili, S., Van Roy, P., et al., 2012. Trust-based recommenda-tion: An empirical analysis. In: Sixth ACM Workshop on Social NetworkMining and Analysis (SNA-KDD 2012),, Aug. 12, 2012.
Pazzani, M. J., 1999. A framework for collaborative, content-based and de-mographic filtering. Artificial Intelligence Review 13 (5-6), 393–408.
Resch, B., Zipf, A., Beinat, E., Breuss-Schneeweis, P., Boher, M., 2012.Towards the live city: paving the way to real-time urbanism. InternationalJournal on Advances in Intelligent Systems 5 (3-4), 470–482.
Reschke, K., Vogel, A., Jurafsky, D., 2013. Generating recommendation di-alogs by extracting information from user reviews. In: ACL (2). pp. 499–504.
Salton, G., Buckley, C., 1988. Term-weighting approaches in automatic textretrieval. Information Processing & Management 24 (5), 513–523.
Samet, H., Jun. 1984. The quadtree and related hierarchical data structures.ACM Comput. Survey 16 (2), 187–260.
Sarwt, M., Levandoski, J. J., Eldawy, A., Mokbel, M. F., 2013. Lars*: Anefficient and scalable location-aware recommender system. IEEE Transac-tions on Knowledge and Data Engineering 99.
Shani, G., Gunawardana, A., 2011. Evaluating recommendation systems.Recommender Systems Handbook, 257–297.
Snyder, B., Barzilay, R., 2007. Multiple aspect ranking using the good griefalgorithm. In: Proc. of the Human Language Tech. Conf. of the NorthAmerican Chap. of the Assoc. of Comput. Linguistics (HLT-NAACL). pp.300–307.
39
Sparck Jones, K., 1972. A statistical interpretation of term specificity andits application in retrieval. J. of Documentation 28, 11–21.
Symeonidis, P., Ntempos, D., Manolopoulos, Y., 2014a. Location-based so-cial networks. In: Recommender Systems for Location-based Social Net-works. Springer, pp. 35–48.
Symeonidis, P., Ntempos, D., Manolopoulos, Y., 2014b. Recommender Sys-tems for Location-based Social Networks. Springer.
Tu, K., Ribeiro, B., Jensen, D., Towsley, D., Liu, B., Jiang, H., Wang,X., 2014. Online dating recommendations: matching markets and learningpreferences. In: Proc. of the Companion Pub. of the 23rd Int. Conf. onWorld Wide Web Companion. pp. 787–792.
Xia, F., Asabere, N. Y., Liu, H., Deonauth, N., Li, F., 2014. Folksonomybased socially-aware recommendation of scholarly papers for conferenceparticipants. In: Proc. of the 23rd Int. Conf. on World Wide Web Com-panion. pp. 781–786.
Yang, D., Zhang, D., Yu, Z., Wang, Z., 2013. A sentiment-enhanced per-sonalized location recommendation system. In: Proc. of the 24th ACMConference on Hypertext and Social Media. ACM, pp. 119–128.
Ye, M., Yin, P., Lee, W.-C., 2010. Location recommendation for location-based social networks. In: Proc. of the 18th SIGSPATIAL Int. Conf. onAdvances in Geographic Information Systems. ACM, pp. 458–461.
Zhang, Z., Varadarajan, B., 2006. Utility scoring of product reviews. In:Proc. of the 15th ACM Int. Conf. on Information and Knowledge Manage-ment. CIKM ’06. pp. 51–57.
Zheng, Y., 2012. Tutorial on location-based social networks. In: Proc. of the21st Int. Conf. on World Wide Web (WWW). ACM.
Zheng, Y., Zhang, L., Ma, Z., Xie, X., Ma, W.-Y., 2011. Recommendingfriends and locations based on individual location history. ACM Trans.Web 5 (1), 5:1–5:44.
40