geospatial analysis of renewable energy technical potential on
TRANSCRIPT

Geospatial Analysis of Renewable Energy Technical Potential on Tribal Lands E. Doris, A. Lopez, and D. Beckley National Renewable Energy Laboratory U.S. Department of Energy | Office of Indian Energy 1000 Independence Ave. SW, Washington DC 20585 | 202-586-1272 energy.gov/indianenergy | [email protected]
Geospatial Analysis of Renewable Energy Technical Potential on Tribal Lands
NOTICE
This report was prepared as an account of work sponsored by an agency of the United States government. Neither the United States government nor any agency thereof, nor any of their employees, makes any warranty, express or implied, or assumes any legal liability or responsibility for the accuracy, completeness, or usefulness of any information, apparatus, product, or process disclosed, or represents that its use would not infringe privately owned rights. Reference herein to any specific commercial product, process, or service by trade name, trademark, manufacturer, or otherwise does not necessarily constitute or imply its endorsement, recommendation, or favoring by the United States government or any agency thereof. The views and opinions of authors expressed herein do not necessarily state or reflect those of the United States government or any agency thereof.
Available electronically at www.osti.gov/bridge
Available for a processing fee to U.S. Department of Energy and its contractors, in paper, from:
U.S. Department of Energy Office of Scientific and Technical Information P.O. Box 62 Oak Ridge, TN 37831-0062 phone: 865.576.8401 fax: 865.576.5728 email: [email protected]
Available for sale to the public, in paper, from:
U.S. Department of Commerce National Technical Information Service 5285 Port Royal Road Springfield, VA 22161 phone: 800.553.6847 fax: 703.605.6900 email: [email protected] online ordering: www.ntis.gov/ordering.htm
energy.gov/indianenergy | [email protected] DOE/IE-0013 • February 2013 Printed with a renewable-source ink on paper containing at least 50% wastepaper, including 10% post consumer waste.

Geospatial Analysis of Renewable Energy Technical Potential on Tribal Lands
iii
Acknowledgments This report is made possible by and at the direction of the DOE Office of Indian Energy Policy and Programs. The National Renewable Energy Laboratory (NREL) would like to thank our colleagues at NREL who reviewed this report for accuracy: Nate Blair, Billy Roberts, Gian Porro, Marguerite Kelly, and Ann Brennan. We would also like to thank our external partners who also reviewed provided insights throughout paper development: Paul Dearhouse, Royce Stewart, Tracey LeBeau, and Pilar Thomas. Finally, we’d like to thank Daniel Hillman for developing the summary tables of data and Rachel Sullivan for providing editorial support.
About the DOE Office of Indian Energy The U.S. Department of Energy Office of Indian Energy Policy and Programs was established by Congress to provide Tribes, Alaska Native villages, and eligible tribal entities with technical and financial assistance that promotes energy development and energy infrastructure on tribal lands.
In direct response to the requests of Tribes and Alaska Native villages, the DOE Office of Indian Energy has designed key programs to provide Indian Country with the knowledge needed to make informed energy decisions―decisions with the power to help stabilize energy costs, enhance energy security, strengthen economic development and tribal energy infrastructure, and promote tribal self-determination.
By providing reliable, accurate information and expert technical assistance, the Office of Indian Energy empowers Indian Country to make decisions needed to bring about the next generation of energy development on their lands.
The office supports those decisions by offering technical support related to technology and project development, financial assistance, and real-time training. It also works to advance tribal visions for a sustainable energy future by promoting four key goal areas: project development, job creation, grid infrastructure, and energy security.

Geospatial Analysis of Renewable Energy Technical Potential on Tribal Lands
iv
List of Abbreviations and Acronyms BDT bone dry tonne
BLM Bureau of Land Management
CBI Conservation Biology Institute
CSP concentrating solar power
DNI direct normal irradiance
DOE U.S. Department of Energy
EGS enhanced geothermal system
EPA Environmental Protection Agency
ESRI Environmental Systems Research Institute
FWS Fish and Wildlife Service
GAP Gap Analysis Project
kWh kilowatt-hour
LULC land use land cover
m meter
MRLC multi-resolution land cover
MW megawatt
MWa average megawatt [average number of megawatts over a specified amount of time (typically a year)]
MWe megawatts electric
MWh megawatt-hour
NOAA National Oceanographic and Atmospheric Administration
NREL National Renewable Energy Laboratory
PV photovoltaic
ReEDS Regional Energy Deployment System

Geospatial Analysis of Renewable Energy Technical Potential on Tribal Lands
v
RPS renewable portfolio standard
SAM System Advisor Model
SMU Southern Methodist University
USFS United States Forest Service
USGS United States Geological Survey
Geospatial Analysis of Renewable Energy Technical Potential on Tribal Lands
vi
Table of Contents Acronyms ............................................................................................................................................... iv
Acknowledgments ............................................................................................................................................. iii
About the DOE Office of Indian Energy ......................................................................................................... iii
1 Purpose and Summary ................................................................................................................................. 1
2 Introduction/Background ............................................................................................................................. 3
3 Analysis Methodology ................................................................................................................................. 6
Biopower ................................................................................................................................................6 Geothermal .............................................................................................................................................8 Hydropower ......................................................................................................................................... 10 Concentrating Solar Power .................................................................................................................. 12 Solar PV ............................................................................................................................................... 13 Wind .................................................................................................................................................... 15
4 Results......................................................................................................................................................... 17
Biomass ............................................................................................................................................... 19 Geothermal .......................................................................................................................................... 22 Hydropower ......................................................................................................................................... 24 Concentrated Solar Power ................................................................................................................... 26 Solar PV: Urban Utility Scale .............................................................................................................. 28 Solar PV: Rural Utility Scale ............................................................................................................... 30 Wind .................................................................................................................................................... 32
5 Conclusion .................................................................................................................................................. 34
6 References .................................................................................................................................................. 35
Appendix 1. Exclusions and Constraints, Capacity Factors, and Power Densities ...................................... 36
Appendix 2. Technical Potential by Tribal Lands for Renewable Resources .............................................. 43

Geospatial Analysis of Renewable Energy Technical Potential on Tribal Lands
vii
List of Figures Figure 1. Levels of renewable energy potential defined ............................................................................... 3
Figure 2. Tribal lands biomass generation potential ................................................................................... 19
Figure 3. Tribal lands geothermal (EGS and hydrothermal) generation potential ...................................... 22
Figure 4. Tribal lands hydropower generation potential ............................................................................. 24
Figure 5. Tribal lands CSP generation potential ......................................................................................... 26
Figure 6. Tribal lands PV utility-scale urban generation potential ............................................................. 28
Figure 7. Tribal lands PV utility-scale rural generation potential ............................................................... 30
Figure 8. Tribal lands wind generation potential ........................................................................................ 32

Geospatial Analysis of Renewable Energy Technical Potential on Tribal Lands
viii
List of Tables Table S-1. Summary of Tribal Technical Potential by Capacity and Generation ......................................... 2
Table 4-1. Summary of Tribal Technical Potential by Capacity and Generation ....................................... 18
Table 4-2. Top 25 Tribal Lands by Technical Potential for Biopower Generation from Solid Residues ... 20
Table 4-3. Top 25 Tribal Lands by Technical Potential for Biopower Generation from Gaseous Residues21
Table 4-4. Top 25 Tribal Lands by Technical Potential for Hydrothermal Geothermal Generation .......... 23
Table 4-5. Top 25 Tribal Lands by Technical Potential for Hydropower Generation ................................ 25
Table 4-6. Top 25 Tribal Lands by Technical Potential for CSP Generation ............................................. 27
Table 4-7. Top 25 Tribal Lands by Technical Potential for Urban Utility-Scale PV Generation ............... 29
Table 4-8. Top 25 Tribal Lands by Technical Potential for Rural Utility-Scale PV Generation ................ 31
Table 4-9. Top 25 Tribal Lands by Technical Potential for Wind Electricity Generation .......................... 33
Table A-1. Exclusions and Constraints for Urban Utility-Scale Photovoltaics .......................................... 36
Table A-2. Capacity Factors for Utility-Scale Photovoltaicsa ..................................................................... 36
Table A-3. Exclusions and Constraints for Rural Utility-Scale Photovoltaics and Concentrating Solar Power .................................................................................................................................................... 37
Table A-4. Capacity Factors for Concentrating Solar Powera ..................................................................... 37
Table A-5. Exclusions and Constraints for Onshore Wind Power .............................................................. 38
Table A-6. Capacity Factor for Offshore Wind Powera .............................................................................. 39
Table A-7. Conversion of Offshore Wind Speeds at 90 Meters to Power Classesa .................................... 39
Table A-8. Exclusions and Constraints for Offshore Wind Powera ............................................................ 40
Table A-9. Exclusions and Constraints for Enhanced Geothermal Systemsa.............................................. 41
Table A-10. Power Densities for Enhanced Geothermal Systemsa ............................................................. 42
Table A-11. Exclusions and Constraints for Enhanced Geothermal Systemsa ............................................ 42
Table A2-1. Tribal Renewable Energy Potential—Hydrothermal, Hydropower, and Biopower ............... 43
Geospatial Analysis of Renewable Energy Technical Potential on Tribal Lands
1
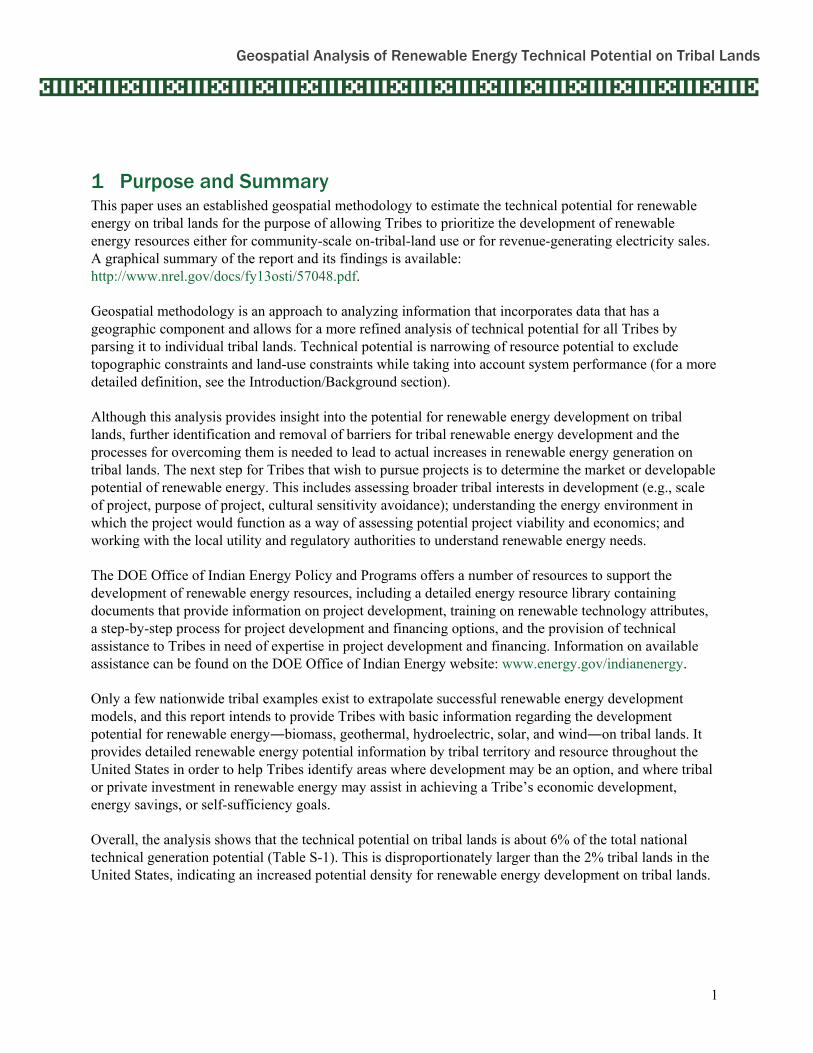
1 Purpose and Summary This paper uses an established geospatial methodology to estimate the technical potential for renewable energy on tribal lands for the purpose of allowing Tribes to prioritize the development of renewable energy resources either for community-scale on-tribal-land use or for revenue-generating electricity sales. A graphical summary of the report and its findings is available: http://www.nrel.gov/docs/fy13osti/57048.pdf.
Geospatial methodology is an approach to analyzing information that incorporates data that has a geographic component and allows for a more refined analysis of technical potential for all Tribes by parsing it to individual tribal lands. Technical potential is narrowing of resource potential to exclude topographic constraints and land-use constraints while taking into account system performance (for a more detailed definition, see the Introduction/Background section).
Although this analysis provides insight into the potential for renewable energy development on tribal lands, further identification and removal of barriers for tribal renewable energy development and the processes for overcoming them is needed to lead to actual increases in renewable energy generation on tribal lands. The next step for Tribes that wish to pursue projects is to determine the market or developable potential of renewable energy. This includes assessing broader tribal interests in development (e.g., scale of project, purpose of project, cultural sensitivity avoidance); understanding the energy environment in which the project would function as a way of assessing potential project viability and economics; and working with the local utility and regulatory authorities to understand renewable energy needs.
The DOE Office of Indian Energy Policy and Programs offers a number of resources to support the development of renewable energy resources, including a detailed energy resource library containing documents that provide information on project development, training on renewable technology attributes, a step-by-step process for project development and financing options, and the provision of technical assistance to Tribes in need of expertise in project development and financing. Information on available assistance can be found on the DOE Office of Indian Energy website: www.energy.gov/indianenergy.
Only a few nationwide tribal examples exist to extrapolate successful renewable energy development models, and this report intends to provide Tribes with basic information regarding the development potential for renewable energy―biomass, geothermal, hydroelectric, solar, and wind―on tribal lands. It provides detailed renewable energy potential information by tribal territory and resource throughout the United States in order to help Tribes identify areas where development may be an option, and where tribal or private investment in renewable energy may assist in achieving a Tribe’s economic development, energy savings, or self-sufficiency goals.
Overall, the analysis shows that the technical potential on tribal lands is about 6% of the total national technical generation potential (Table S-1). This is disproportionately larger than the 2% tribal lands in the United States, indicating an increased potential density for renewable energy development on tribal lands.

Geospatial Analysis of Renewable Energy Technical Potential on Tribal Lands
2
Table S-1. Summary of Tribal Technical Potential by Capacity and Generation
Technology
Tribal Capacitya Potentialb (MW)
National Capacity Potentialc
(MW)
Tribal Generation Potential (MWh)
National Generationa Potential (MWh)
% of National Capacity
% of National Generation
Solar PV (Utility-Scale, Rural) 6,888,339 152,973,829 14,322,522,713 280,613,216,903 4.5% 5.1%
Solar PV (Utility-Scale, Urban) 8,199 1,217,699 17,578,618 2,231,693,746 0.7% 0.8%
Solar CSP 1,818,185 38,066,401 6,139,851,743 116,146,244,587 4.8% 5.3%
Wind (80 m height, >=30% GCF) 374,505 10,954,759 1,146,044,229 32,784,004,656 3.4% 3.5%
Geothermal (EGS) 763,252 3,975,735 6,017,487,000 31,344,696,024 19.2% 19.2%
Geothermal (Hydrothermal) 641 30,033 5,050,724 236,780,000 2.1% 2.1%
Biomass (Solid) 551 50,707 4,340,642 399,774,091 1.1% 1.1%
Biomass (Gaseous) 85 11,232 673,465 88,551,445 0.8% 0.8%
Hydropower 1,687 60,000 7,390,196 258,953,000 2.8% 2.9%
Totalb 9,855,444 207,340,394 27,660,939,330 464,103,914,451 4.8% 6.0% a Capacity is the nameplate capacity of a power plant. Generation is the amount of MWh produced given average run times. b Technical potential calculated for each technology individually and does not account for overlap (i.e., the same land area may be identified with potential for wind and solar, and would be counted twice in the total). Some technologies may be compatible with mutual development. c Lopez, A. et al. (2012). U.S. Renewable Energy Technical Potentials: A GIS-Based Analysis. NREL/TP-6A20-51946. Golden, CO: National Renewable Energy Laboratory.

Geospatial Analysis of Renewable Energy Technical Potential on Tribal Lands
3
2 Introduction/Background While other estimates of renewable energy potential on tribal lands exist, the strength of this style of estimation of resources is the use of up-to-date geospatial data for a more accurate representation of available resources. This is the first paper of its kind to use geospatial analysis to estimate the technical potential of renewable energy development on tribal lands. Technical potential is one of four levels of potential for renewable energy, as defined in Figure 1.
Figure 1. Levels of renewable energy potential defined Source: Lopez et al. 2012, adapted from the DOE Office of Energy Efficiency and Renewable Energy
(EERE) 2006
The renewable resources included in this report are described as follows in the remainder of this section. With the exception of enhanced geothermal systems, the scope of this work includes currently commercially available technologies within the definition of technical potential.
• Biopower. Biomass has been used for electric power generation for many years. It can be a cost-effective, carbon-neutral dispatchable source of electrical power. Most biopower plants use direct-fired systems to generate electricity from biomass. They burn bioenergy feedstocks directly to produce steam. This steam drives a turbine, which turns a generator that converts the power into electricity. In some biomass industries, the spent steam from the power plant is also used for

Geospatial Analysis of Renewable Energy Technical Potential on Tribal Lands
4
manufacturing processes or to heat buildings. Such combined heat and power systems greatly increase overall energy efficiency. Types of biomass include wood from various sources (beetle kill, slash, lumber waste), agricultural residues, animal and human waste (methane), and municipal solid waste and landfill gas.
• Geothermal. Geothermal technologies use heat from the Earth. Geothermal is a highly efficient method of providing electricity generation. High-temperature geothermal is ideal for power plant production levels, but low-temperature heat pumps can provide heating and cooling energy in any part of the United States. Lower-temperature resources are best suited for heat applications. Geothermal technologies exist commercially for either small-scale (distributed) or large-scale (central) electricity generation. As of 2012, 248 U.S. geothermal systems produce 9,057 mean megawatts of electricity (MWe). There are an estimated 30,033 MWe of undiscovered geothermal resources in the United States.
• Hydropower. Hydroelectricity refers to electricity generated through the use of the gravitational force of falling or flowing water, called hydropower. Both large and small-scale power producers can use hydropower technologies to produce clean electricity.
• Concentrating Solar Power. Concentrating solar power (CSP) technologies use mirrors to reflect and concentrate sunlight onto receivers that collect solar energy and convert it to heat. This thermal energy can then be used to produce electricity via a steam turbine or heat engine that drives a generator. While CSP offers a utility-scale, firm, dispatchable renewable energy option that can help meet demand for electricity, it is most economical in the southwestern United States. Factors that influence project economics are the cost of the technology, the quality of the solar resource, and the cost of the energy being displaced. CSP systems can be successfully installed on landfills, brownfields, and greenfields, with minimal disturbance to native vegetation and wildlife. Types of CSP systems include linear concentrator, dish/engine, power tower, and thermal storage.
• Solar PV. Photovoltaic (PV) technologies produce electricity directly from the energy of the sun. Small PV can provide electricity for homes, businesses, and remote power needs. Larger PV systems provide more electricity for contribution to the electric power system. PV technologies work in all parts of the United States, but economics are dependent on technology cost, quality of solar resource, and cost of energy being displaced. Flat plate is the most common PV array design, which uses flat-plate PV modules or panels that can be fixed in place or designed to track the movement of the sun. An off-grid, flat-plate solar PV system would be useful for remote locations or for self-sufficiency in the event of a power interruption. Concentrator PV systems use less solar cell material than other PV systems because they make use of relatively inexpensive materials such as plastic lenses and metal housings to capture the solar energy shining on a fairly large area and focus that energy onto a smaller area—the solar cell.
• Wind. Wind energy technologies use the kinetic energy in wind for practical purposes such as generating electricity, charging batteries, pumping water, and grinding grain. Most wind energy technologies can be used as stand-alone applications, connected to a utility power grid, or even combined with a PV system. Wind energy today is cost competitive in many locations throughout the United States. Utility-scale wind consists of a large number of turbines that are usually installed close together to form a wind farm that provides grid power. Several electricity providers use wind farms to supply power to their customers. Stand-alone turbines are typically used for water pumping or communications. However, homeowners and farmers in windy areas can also use small wind systems to generate electricity.

Geospatial Analysis of Renewable Energy Technical Potential on Tribal Lands
5
For more information on renewable energy basics for Tribes, please search for “DOE Office of Indian Energy” at http://www.nterlearning.org.
Technical potential may not reflect the developable potential because it does not incorporate technology costs, competing land uses, transmission and infrastructure availability, or the policy, investor, or energy competitive environments. For Tribes, specific barriers can include a lack of:
• Replicable, successful examples of renewable energy development on tribal lands
• Clear ownership and tax equity structure options
• Access to transmission lines for movement of generated electricity
• Active markets for the buying and selling of renewable energy (often state policy driven through the use of renewable portfolio standards, or RPS)
While this report focuses on the identification of technical potential, there are resources for further understanding the market and economic potential for, and developing renewable energy resources on tribal lands at www.energy.gov/indianenergy, including a development document library, technical assistance, and education.

Geospatial Analysis of Renewable Energy Technical Potential on Tribal Lands
6
3 Analysis Methodology The basic methodology for determining the technical potential on tribal lands is to:
1) Determine the land area of the tribal lands
2) Estimate how much renewable resource exists within those areas
3) Estimate the amount of electricity that could possibly be produced from that land area, based on currently available technology for converting that resource into electricity.
Data on the area of tribal lands was downloaded from the Department of the Interior, Bureau of Indian Affairs and is dated 1999. This is the most recent and comprehensive database of federally recognized tribal lands. Due to lack of data resolution, only the exclusions listed in Appendix 1 are removed from the land within tribal areas. This analysis does not include removal of culturally sensitive areas or areas already in use that would not be appropriate for development.
The detailed methodology for determining the available resource, as well as the technical capabilities of the resource to electricity conversion technologies, is described in detail for each resource below.
Biopower Biopower is the only technology analyzed using an alternative dataset than what was used in Lopez et al. 2012. The dataset used in Lopez et al. 2012 was county-based; it was determined that the resolution was too coarse for the relatively small tribal lands. Instead, land cover-based disaggregated estimates from the Biopower Atlas (http://maps.nrel.gov/biopower) are used. An area-weighted analysis was performed between the disaggregated datasets and the tribal lands to produce the total amount of gaseous and solid biomass on each tribal land.
Total estimated technical potential for gaseous biomass generation was estimated using 4.7 megawatt-hours (MWh)/tonne of CH4 (Lopez et al. 2012). This can be expressed as:
𝐵𝑖𝑜𝑔𝑎𝑠𝑔𝑒𝑛𝑡 = �𝐴𝐼𝑘,𝑡
𝐴𝑡𝑘 𝜖 𝐾
∙ 𝑃𝑘 ∙ 𝐶
where
t = Tribal land
Biogasgent = Biogas generation on tribal land t (MWh)
AIk,t = Area of intersect between land cover polygon k and tribal land t
At = Area of tribal land t
k = Land-cover polygon
Geospatial Analysis of Renewable Energy Technical Potential on Tribal Lands
7
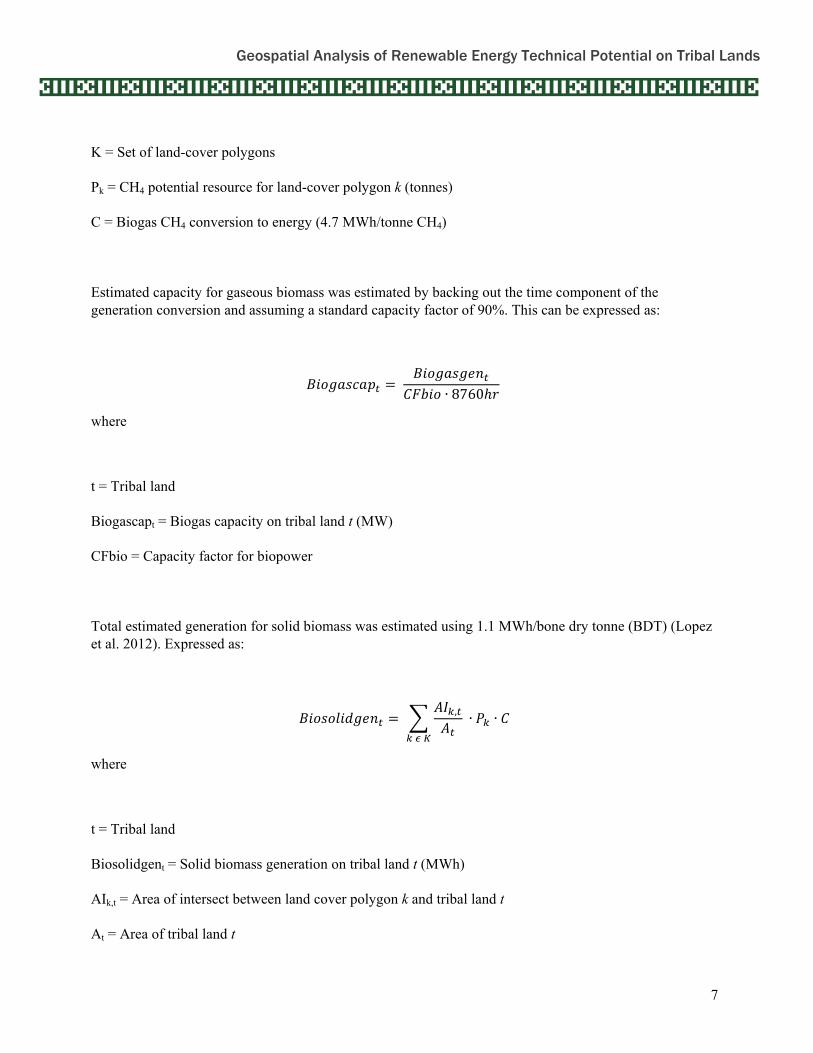
K = Set of land-cover polygons
Pk = CH4 potential resource for land-cover polygon k (tonnes)
C = Biogas CH4 conversion to energy (4.7 MWh/tonne CH4)
Estimated capacity for gaseous biomass was estimated by backing out the time component of the generation conversion and assuming a standard capacity factor of 90%. This can be expressed as:
𝐵𝑖𝑜𝑔𝑎𝑠𝑐𝑎𝑝𝑡 = 𝐵𝑖𝑜𝑔𝑎𝑠𝑔𝑒𝑛𝑡
𝐶𝐹𝑏𝑖𝑜 ∙ 8760ℎ𝑟
where
t = Tribal land
Biogascapt = Biogas capacity on tribal land t (MW)
CFbio = Capacity factor for biopower
Total estimated generation for solid biomass was estimated using 1.1 MWh/bone dry tonne (BDT) (Lopez et al. 2012). Expressed as:
𝐵𝑖𝑜𝑠𝑜𝑙𝑖𝑑𝑔𝑒𝑛𝑡 = �𝐴𝐼𝑘,𝑡
𝐴𝑡𝑘 𝜖 𝐾
∙ 𝑃𝑘 ∙ 𝐶
where
t = Tribal land
Biosolidgent = Solid biomass generation on tribal land t (MWh)
AIk,t = Area of intersect between land cover polygon k and tribal land t
At = Area of tribal land t

Geospatial Analysis of Renewable Energy Technical Potential on Tribal Lands
8
k = Land-cover polygon
K = Set of land-cover polygons
P = Bone dry tonne potential resource
C = Solid biomass conversion to energy (1.1 MWh/bone dry tonne)
Estimated capacity for solid biomass was estimated by backing out the time component of the generation conversion and assuming a standard capacity factor of 90%. This can be expressed as:
𝐵𝑖𝑜𝑠𝑜𝑙𝑖𝑑𝑐𝑎𝑝𝑡 = 𝐵𝑖𝑜𝑠𝑜𝑙𝑖𝑑𝑔𝑒𝑛𝑡𝐶𝐹𝑏𝑖𝑜 ∙ 8760ℎ𝑟
where
t = Tribal land
Biosolidcapt = Solid biomass capacity in tribal land t (MW)
AI = Area of intersect (in this case, between resource and tribal land)
P = Bone dry tonne potential resource
C = Solid biomass conversion to energy (1.1 MWh/bone dry tonne)
CFbio = Capacity factor for biopower
Geothermal Two types of geothermal systems were included in this analysis: undiscovered hydrothermal and enhanced geothermal system (EGS). Undiscovered hydrothermal system estimates were derived from Williams et al. 2009. The estimates were generated using a logistical regression model of the western United States. The model determined favorability and estimated a power density, which was used to determine the potential capacity, expressed as:
𝐻𝑦𝑑𝑟𝑜𝑡ℎ𝑒𝑟𝑚𝑐𝑎𝑝𝑡 = � 𝐴𝑖 ∙ 𝑃𝐷𝑖𝑖 ∈ 𝐼𝑡

Geospatial Analysis of Renewable Energy Technical Potential on Tribal Lands
9
where
t = Tribal land
Hydrothermcapt = hydrothermal capacity in tribal land t (MW)
i = Distinct grid-cell
It = Set of grid-cells that exist in tribal land t
Ai = Square kilometers of available land in grid-cell i
PDi = Power density for grid-cell i
Undiscovered hydrothermal generation was estimated using:
𝐻𝑦𝑑𝑟𝑜𝑡ℎ𝑒𝑟𝑚𝑔𝑒𝑛𝑡 = 𝐻𝑦𝑑𝑟𝑜𝑡ℎ𝑒𝑟𝑚𝑐𝑎𝑝𝑡 ∙ 𝐶𝐹ℎ𝑡 ∙ 8760ℎ𝑟
where
t = tribal land
hydrothermgent = Hydrothermal generation in tribal land t (MWh)
hydrothermcapt = Hydrothermal capacity in tribal land t (MW)
CFht = Capacity factor for hydrothermal
EGS technical potential estimates were calculated using temperature at depth data from the Southern Methodist University (SMU) Geothermal Laboratory. The data was first filtered to remove areas deemed unlikely for development (see Appendix 1). Next, the data was limited to areas intersecting tribal lands. Then, using the methodology described in Lopez et al. 2012 to determine optimal depth, capacity was estimated and can be expressed as:
𝐸𝐺𝑆𝑐𝑎𝑝𝑡 = � 𝐴𝑖 ∙ 𝑃𝐷𝑖𝑖 ∈ 𝐼𝑡
Geospatial Analysis of Renewable Energy Technical Potential on Tribal Lands
10
where
t = Tribal land
EGScapt = EGS capacity in tribal land t (MW)
i = Distinct grid-cell
It = Set of grid-cells that exist in tribal land t
Ai = Square kilometers of available land in grid-cell i
PDi = Power density for grid-cell i
Using the same optimal depth, technical potential generation was estimated and can be expressed as:
𝐸𝐺𝑆𝑔𝑒𝑛𝑡 = 𝐸𝐺𝑆𝑐𝑎𝑝𝑡 ∙ 𝐶𝐹𝑒𝑔𝑠 ∙ 8760ℎ𝑟
where
t = tribal land
EGSgent = EGS generation in tribal land t (MWh)
EGScapt = EGS capacity in tribal land t (MW)
CFegs = Capacity factor for EGS
Hydropower Hydropower in this study is defined as low power (<1 MWa1) or small hydro (>= 1 MWa and <= 20 MWa). Hydropower source point locations with potential average capacity were taken from Hall et al. 2006. The source points were a result of a feasibility study and development model; thus, no action was required on NREL’s part to determine technical feasibility.
1 Average megawatt capacity; assumes 50% capacity factor.

Geospatial Analysis of Renewable Energy Technical Potential on Tribal Lands
11
To estimate technical potential capacity, the hydropower source points were intersected with tribal lands, summed by Tribe and doubled. The doubling backs out the assumed capacity factor in the average capacity. Technical potential capacity can be expressed as:
𝐻𝑦𝑑𝑟𝑜𝑐𝑎𝑝𝑡 = �𝑃𝑐𝑎𝑝𝑎𝑗𝐶𝐹ℎ𝑦𝑑𝑟𝑜
𝑗 ∈ 𝐽𝑡
where
t = Tribal land
Hydrocapt = Hydropower capacity in tribal land t (MW)
Pcapaj = Hydropower average capacity for source point j (MWa)
j = Hydropower source point
Jt = Set of hydropower source points in tribal land t
CFhydro = Capacity factor for hydropower
Technical potential generation was estimated by maintaining the existing capacity factor in the average capacity and adding the time component, expressed as:
𝐻𝑦𝑑𝑟𝑜𝑔𝑒𝑛𝑡 = � 𝑃𝑐𝑎𝑝𝑎𝑗𝑗 ∈ 𝐽𝑡
∙ 8760ℎ𝑟
where
t = Tribal land
Hydrogent = Hydropower generation in tribal land t (MWh)
Pcapaj = Hydropower average capacity for source point j (MWa)
j = Hydropower source point
Jt = Set of hydropower source points in tribal land t
Geospatial Analysis of Renewable Energy Technical Potential on Tribal Lands
12
Concentrating Solar Power CSP is a utility-scale solar power plant in which the solar heat energy is collected in a central location. To get a general sense of CSP potential, CSP resource is analyzed. CSP resource is typically measured using direct normal irradiance (DNI)2 as kilowatt-hours (kWh) per square meter per day (kWh/m2/day). In this analysis, we consider viable only areas with DNI greater than or equal to 5 kWh/m2/day (Lopez et al. 2012).
Further reducing developable land was needed to ensure a more realistic potential. The first step was to remove areas with slope greater than or equal to 5%. Next, areas with land-use/land-cover deemed unlikely for development were excluded (see Appendix). Last, areas were constrained to tribal lands, and a minimum contiguous area threshold of 1 square kilometer was imposed to ensure a utility-scale system.
With developable lands defined, a specific CSP system was defined and capacity and generation estimated. The system chosen was a trough, dry-cooled one with six hours of storage and a solar multiple of 2.3 The assumed system power density was 32.8 megawatts per kilometer squared (Lopez et al. 2012). Technical potential capacity was expressed as:
𝐶𝑆𝑃𝑐𝑎𝑝𝑡 = � 𝐴𝑖 ∙ 𝑃𝐷𝑖 ∈ 𝐼𝑡
where
t = Tribal land
CSPcapt = CSP capacity in tribal land t (MW)
i = Distinct grid-cell
It = Set of grid-cells that exist in tribal land t
Ai = Square kilometers of available land in grid-cell i
PD = Power density (32 MW/km2)
To estimate generation potential, the DNI resource was divided into five classes. Capacity factors were taken from Lopez et al. 2012. Technical potential generation was then calculated and can be expressed as:
2 The amount of solar radiation received per unit area by a surface that is always held perpendicular (or normal) to the rays that come in a straight line from the direction of the sun at its current position in the sky. 3 The field aperture area expressed as a multiple of the aperture required to operate the power cycle at its design capacity.

Geospatial Analysis of Renewable Energy Technical Potential on Tribal Lands
13
𝐶𝑆𝑃𝑔𝑒𝑛𝑡 = � 𝐴𝑖 ∙ 𝑃𝐷 ∙ 𝐶𝐹𝑐𝑠𝑝𝑖𝑖 ∈ 𝐼𝑡
∙ 8760ℎ𝑟
where
t = Tribal land
CSPgent = CSP generation in tribal land t (MWh)
i = Distinct grid-cell
It = Set of grid-cells that exist in tribal land t
Ai = Square kilometers of available land in grid-cell i
CFcspi = Capacity factor for CSP for grid-cell i
PD = Power density (32 MW/km2)
Solar PV The technical potential for solar utility-scale PV was first determined by eliminating areas deemed unlikely for development. These areas include those of environmental concern and national parks (a full list is included in Appendix 1). Note that the exclusions do not include potentially culturally sensitive areas as there is not currently a comprehensive dataset of those sites available. Next, the available land within each tribal boundary was separated into urban and rural classifications. This allows for a greater understanding of the geographic quality of PV potential (i.e., proximity to areas where the electricity might be used).
Urban available lands were constrained to eliminate impervious surfaces. This has the effect of removing roads, parking lots, and buildings, leaving only urban open space. The urban open spaces were further constrained to eliminate contiguous areas less than 18,000 square meters; this ensures the total system size is large enough to be considered utility scale.4
Rural available lands were constrained to eliminate areas less than 1 square kilometer. The area constraint reduces highly fragmented parcels.
The final step in calculating technical potential required a specific PV system. The PV system chosen was a 1-axis tracking collector with the axis of rotation aligned north-south at 0° tilt from the horizontal. Assuming a power density of 48 MW per square kilometer (Lopez et al. 2012), the technical potential capacity was estimated and can be expressed as:
4 Depending on the PV system, 18,000 m2 is roughly a 1-MW system.

Geospatial Analysis of Renewable Energy Technical Potential on Tribal Lands
14
𝑃𝑉𝑐𝑎𝑝𝑡 = � 𝐴𝑖𝑖 ∈ 𝐼𝑡
∙ 𝑃𝐷
where
t = Tribal land
PVcapt = PV capacity in tribal land t (MW)
i = Distinct grid-cell
It = Set of grid-cells that exist in tribal land t
Ai = Square kilometers of available land in grid-cell i
PD = Power density (48 MW/km2)
To determine technical potential generation, capacity factors were estimated. State-level capacity factors were taken from Lopez et al. 2012. Technical potential generation can be expressed as:
𝑃𝑉𝑔𝑒𝑛𝑡 = � 𝐴𝑖 ∙ 𝑃𝐷 ∙ 𝐶𝐹𝑝𝑣𝑖 ∙ 8760ℎ𝑟𝑖 ∈ 𝐼𝑡
where
t = Tribal land
PVgent = PV generation in tribal land t (MWh)
i = Distinct grid-cell
It = Set of grid-cells that exist in tribal land t
CFpv = Capacity factor for PV for grid-cell i

Geospatial Analysis of Renewable Energy Technical Potential on Tribal Lands
15
Wind Wind was analyzed at 80 meters (m) above the earth’s surface. Only windy areas greater than or equal to an annual average gross capacity factor5 of 30% were included in the analysis. The gross capacity factors used in the analysis were developed by AWS Truepower; they represent typical utility-scale wind turbine power curves.
The resource areas were filtered to remove areas deemed unlikely for development, including: national parks, federally protected lands, and water features. For a full list of exclusions, see Appendix 1.
Technical potential capacity for wind was estimated assuming 5 MW/km2 (Lopez et al. 2012) and can be expressed as:
𝑊𝑖𝑛𝑑𝑐𝑎𝑝𝑡 = � 𝐴𝑖 ∙ 𝑃𝐷𝑖 ∈ 𝐼𝑡
where
t = Tribal land
Windcapt = Wind capacity in tribal land t (MW)
i = Distinct grid-cell
It = Set of grid-cells that exist in tribal land t
Ai = Square kilometers of available land in grid-cell i
PD = Power density (5 MW/km2)
Technical potential for wind generation was estimated assuming 15% energy losses (Lopez et al. 2012) and can be expressed as:
𝑊𝑖𝑛𝑑𝑔𝑒𝑛𝑡 = � 𝐴𝑖 ∙ 𝑃𝐷 ∙ 𝐶𝐹𝑤𝑖𝑛𝑑𝑖 ∙ 8760ℎ𝑟 ∙ 𝑙𝑜𝑠𝑠𝑖 ∈ 𝐼𝑡
5 Gross capacity factor does not include plant downtime, parasitic power, or other factors that would be included to reduce output to the “net” capacity factor. For more information on capacity factors, see http://www.eia.gov/tools/faqs/faq.cfm?id=187&t=3.

Geospatial Analysis of Renewable Energy Technical Potential on Tribal Lands
16
where
t = Tribal land
Windgent = Wind generation on tribal land t (MWh)
i = Distinct grid-cell
It = Set of grid-cells that exist in tribal land t
CFwindi = Capacity factor for wind for grid-cell i
loss = 15% reduction from gross to net generation

Geospatial Analysis of Renewable Energy Technical Potential on Tribal Lands
17
4 Results The methodology results in an understanding of the technical potential for renewable energy on tribal lands by resource. It provides a starting point for understanding where Tribes could prioritize the development of renewable energy resources, either for community-scale on-tribal-land use or for revenue-generating electricity sales.
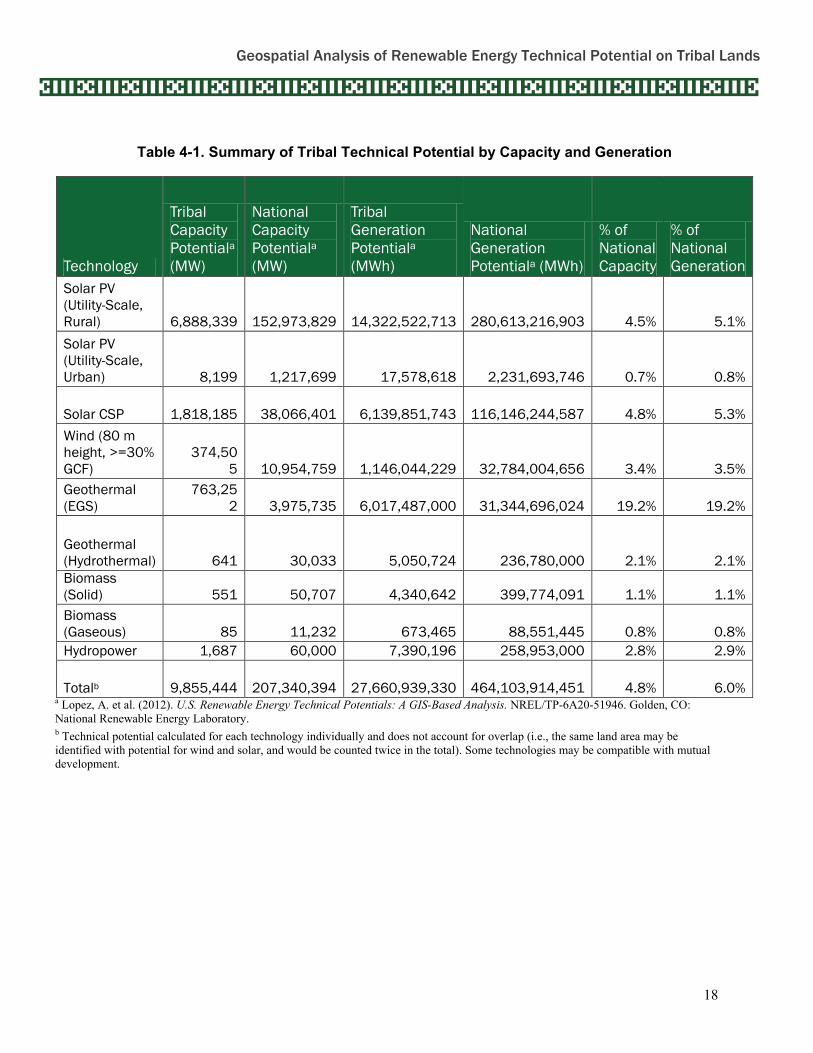
Findings indicate that while tribal lands comprise 2% of U.S. lands, technical potential on tribal lands comprises 4.8% of the total national U.S. technical capacity potential for renewable energy and 6% of the total generation, varying by resource (see Table 4-1). Solar photovoltaics (both urban and rural), concentrated solar power, and wind have the largest technical potential of the renewable resources. Geographically, tribal lands in the Southwest have the greatest percentage of the potential. The following subsections provide more detail on the technical potential by renewable energy resource and tribal land.
Geospatial Analysis of Renewable Energy Technical Potential on Tribal Lands
18
Table 4-1. Summary of Tribal Technical Potential by Capacity and Generation
Technology
Tribal Capacity Potentiala (MW)
National Capacity Potentiala (MW)
Tribal Generation Potentiala (MWh)
National Generation Potentiala (MWh)
% of National Capacity
% of National Generation
Solar PV (Utility-Scale, Rural) 6,888,339 152,973,829 14,322,522,713 280,613,216,903 4.5% 5.1% Solar PV (Utility-Scale, Urban) 8,199 1,217,699 17,578,618 2,231,693,746 0.7% 0.8%
Solar CSP 1,818,185 38,066,401 6,139,851,743 116,146,244,587 4.8% 5.3% Wind (80 m height, >=30% GCF)
374,505 10,954,759 1,146,044,229 32,784,004,656 3.4% 3.5%
Geothermal (EGS)
763,252 3,975,735 6,017,487,000 31,344,696,024 19.2% 19.2%
Geothermal (Hydrothermal) 641 30,033 5,050,724 236,780,000 2.1% 2.1% Biomass (Solid) 551 50,707 4,340,642 399,774,091 1.1% 1.1% Biomass (Gaseous) 85 11,232 673,465 88,551,445 0.8% 0.8% Hydropower 1,687 60,000 7,390,196 258,953,000 2.8% 2.9%
Totalb 9,855,444 207,340,394 27,660,939,330 464,103,914,451 4.8% 6.0% a Lopez, A. et al. (2012). U.S. Renewable Energy Technical Potentials: A GIS-Based Analysis. NREL/TP-6A20-51946. Golden, CO: National Renewable Energy Laboratory. b Technical potential calculated for each technology individually and does not account for overlap (i.e., the same land area may be identified with potential for wind and solar, and would be counted twice in the total). Some technologies may be compatible with mutual development.

Geospatial Analysis of Renewable Energy Technical Potential on Tribal Lands
19
Biomass The total technical potential for electricity generation from solid biomass on tribal lands is about 399 million MWh, or about 1.1% of the total U.S. technical potential. The top three tribal lands in terms of potential generation are Nez Perce (336,000 MWh), Lake Traverse (Sisseton) (300,000 MWh), and Yakama (274,000 MWh). The top 25 tribal lands by technical potential for biopower from solid (Table 4-2) and gaseous (Table 4-3) biomass resources are below. An alphabetical list of all technical potentials by tribal lands is in Appendix 2. Developable potential of biomass resources is often limited by the market costs of transporting the fuel.
Figure 2. Tribal lands biomass generation potential

Geospatial Analysis of Renewable Energy Technical Potential on Tribal Lands
20
Table 4-2. Top 25 Tribal Lands by Technical Potential for Biopower Generation from Solid Residues
Tribal Land State
Biopower from Solid Residuesa (MWh)
Biopower from Solid Residues (MW)
Nez Perce ID 336,781 43 Lake Traverse (Sisseton) SD, MN, ND 300,466 38 Yakama WA 274,750 35 Coeur d'Alene WA,ID 264,737 34 Menominee WI 246,145 31 Quinault WA 161,549 20 Fort Peck MT 159,234 20 Leech Lake MN 158,657 20 Omaha IA, NE 143,838 18 White Earth MN 138,785 18 Red Lake MN 124,764 16 Flathead MT 123,572 16 Yankton NE, SD 114,257 14 Fort Berthold ND 109,151 14 Navajo NM, UT, AZ, CO 103,018 13 Fort Hall ID 101,896 13 Blackfeet MT 87,202 11 Winnebago IA, NE 76,709 10 Ho-Chunk WI 68,939 9 Spokane WA 66,932 8 Colville WA 59,616 8 Hoopa Valley CA 55,748 7 Devils Lake Sioux ND 46,079 6 Crow WY, MT 43,001 5 Fond du Lac MN 41,847 5
a Solid residues are represented by forest, crop, primary mill, and urban wood residues. Generation estimated assuming 1.1 MWh/bone dry tonne of residue.

Geospatial Analysis of Renewable Energy Technical Potential on Tribal Lands
21
Table 4-3. Top 25 Tribal Lands by Technical Potential for Biopower Generation from Gaseous Residues
Tribal Land State
Biopower from Gaseous Residuesa (MWh)
Biopower from Gaseous Residues (MW)
Tuscarora NY 440,925 56 Yawapa Apache AZ 74,323 9 Port Madison WA 61,835 8 Salt River AZ 59,395 8 Cocopah AZ, CA 25,403 3 Navajo NM, UT, AZ, CO 1,755 0 Lone Pine Rancheria CA 888 0 Osage OK 659 0 Gila River AZ 459 0 Puyallup WA 427 0 Uintah and Ouray UT 335 0 Yakama WA 329 0 Isabella (Sag Chip) MI 320 0 Tohono O’odham AZ 296 0 San Xavier (TON) AZ 293 0 Agua Caliente CA 268 0 Flathead MT 262 0 Oneida (West) WI 232 0 Crow WY, MT 229 0 Fort Hall ID 210 0 Wind River WY 183 0 White Mountain AZ 182 0 Isleta Pueblo NM 169 0 Tulalip WA 164 0 Southern Ute NM, CO 144 0
a Gaseous residues are represented by landfill and domestic wastewater residues. Generation estimated assuming 4.7 MWh/tonne of CH4 produced by the residues.

Geospatial Analysis of Renewable Energy Technical Potential on Tribal Lands
22
Geothermal The total technical potential on tribal lands for hydrothermal geothermal resource capacity is about 236 million MWh, or about 2.1% of the total U.S. technical potential. The top three tribal lands in terms of potential generation are Navajo (597,000 MWh), Tohono O’odham (510,000 MWh), and Warm Springs (405,000 MWh). Table 4-4 lists the top 25 tribal lands in terms of the technical potential of hydrothermal generation with enhanced geothermal systems (EGS, a less commercially viable geothermal option) for reference. A full list of technical potential by tribal land is listed in Appendix 2. Geothermal resources are widely distributed across tribal lands, with 196 distinct lands having technical potential.
Figure 3. Tribal lands geothermal (EGS and hydrothermal) generation potential

Geospatial Analysis of Renewable Energy Technical Potential on Tribal Lands
23
Table 4-4. Top 25 Tribal Lands by Technical Potential for Hydrothermal Geothermal Generation
Name State
Unidentified Hydrothermal Potential Annual Generation (MWh)
Unidentified Hydrothermal Potential Installed Capacity (MW)
Enhanced Geothermal Systems Potential Annual Generation (MWh)
Enhanced Geothermal Systems Potential Installed Capacity (MW)
Navajo NM, UT, AZ,
CO 597,545 76 1,263,774,000 160,296 Tohono O'odham AZ 510,243 65 323,796,000 41,070 Warm Springs OR 405,953 51 102,311,000 12,977 Pyramid Lake NV 324,409 41 58,397,000 7,407 Walker River NV 246,481 31 41,959,000 5,322 Hualapai AZ 210,076 27 121,721,000 15,439 Southern Ute NM, CO 188,245 24 121,248,000 15,379 San Carlos AZ 179,374 23 195,137,000 24,751 Fort Hall ID 179,275 23 78,603,000 9,970 Duck Valley NV, ID 164,004 21 40,642,000 5,155 Yakama WA 155,549 20 127,957,000 16,230 Flathead MT 151,999 19 122,383,000 15,523 Jicarilla Apache NM, CO 143,397 18 112,481,000 14,267 Fort Peck MT 120,159 15 216,203,000 27,423 White Mountain AZ 119,240 15 150,687,000 19,113 Lake Traverse (Sisseton)
SD, MN, ND 88,772 11 35,762,000 4,536
Uintah and Ouray UT 78,807 10 347,054,000 44,020 Colville WA 70,390 9 127,342,000 16,152 Blackfeet MT 60,031 8 95,089,000 12,061 Nez Perce ID 51,827 7 72,943,000 9,252 Wind River WY 47,999 6 174,985,000 22,195 Taos Pueblo NM 46,205 6 11,124,000 1,411 Zuni Pueblo NM, AZ 44,632 6 42,857,000 5,436 Isleta Pueblo NM 44,203 6 23,479,000 2,978 Goshute NV, UT 44,152 6 12,898,000 1,636

Geospatial Analysis of Renewable Energy Technical Potential on Tribal Lands
24
Hydropower The total technical potential on tribal lands for generation from hydropower resource is about 13 million MWh, or about 5.1% of the total U.S. technical potential. The top three tribal lands in terms of potential generation are Nez Perce (2.6 million MWh), Flathead (1.5 million MWh), and Yakama (1.2 million MWh). A full list of technical potential by tribal land is listed in Appendix 2.
Figure 4. Tribal lands hydropower generation potential

Geospatial Analysis of Renewable Energy Technical Potential on Tribal Lands
25
Table 4-5. Top 25 Tribal Lands by Technical Potential for Hydropower Generation
Tribal Land State
Hydropower Generation Potential (MWh)
Hydropower Capacity Potential (MW)
Nez Perce ID 1,445,260 330 Flathead MT 816,341 186 Yakama WA 669,640 153 Blackfeet MT 445,893 102 Uintah and Ouray UT 442,276 101 Navajo NM, UT, AZ, CO 369,000 84 Wind River WY 350,640 80 Quinault WA 339,978 78 Colville WA 247,936 57 Southern Ute NM, CO 243,721 56 Penobscot ME 189,260 43 Warm Springs OR 130,737 30 White Mountain AZ 115,435 26 Colorado River AZ, CA 106,505 24 Crow WY, MT 89,049 20 Fort Hall ID 70,593 16 Omaha IA, NE 61,961 14 Fort Peck MT 57,645 13 Nisqually WA 57,594 13 Umatilla OR 57,403 13 San Carlos AZ 49,442 11 Winnebago IA, NE 48,821 11 Gila River AZ 47,987 11 Cheyenne River SD 47,065 11 Muckleshoot WA 46,137 11

Geospatial Analysis of Renewable Energy Technical Potential on Tribal Lands
26
Concentrated Solar Power The total technical potential on tribal lands for electricity generation from utility-scale rural solar resource is about 6 billion MWh, or 5.3% of total U.S. generation potential. The top tribal lands in terms of potential generation are Navajo (3 billion MWh), Tohono O’odham (950 million MWh), and Hopi (300 million MWh). Developable potential of CSP is often limited to utility scale, and by transmission availability and access. A full list of technical potential by tribal land is listed in Appendix 2.
Figure 5. Tribal lands CSP generation potential

Geospatial Analysis of Renewable Energy Technical Potential on Tribal Lands
27
Table 4-6. Top 25 Tribal Lands by Technical Potential for CSP Generation
Tribal Land State
Concentrating Solar Power Potential Annual Generation (MWh)
Concentrating Solar Power Potential Installed Capacity (MW)
Concentrating Solar Power Available Land (km2)
Navajo NM, UT, AZ, CO 2,872,729,112 830,414 25,950 Tohono O’odham AZ 950,059,233 259,526 8,110 Hopi AZ 332,743,795 95,030 2,970 Uintah and Ouray UT 196,030,481 70,663 2,208 Pine Ridge NE, SD 193,254,076 69,913 2,185 Wind River WY 172,102,126 62,252 1,945 Rosebud NE, SD 125,329,342 45,340 1,417 Gila River AZ 123,184,942 35,754 1,117 Laguna Pueblo NM 91,734,396 26,629 832 Colorado River AZ, CA 87,227,378 24,292 759 San Carlos AZ 87,046,169 24,426 763 Hualapai AZ 68,215,389 18,755 586 Zuni Pueblo NM, AZ 60,942,972 17,691 553 Jicarilla Apache NM, CO 59,723,631 17,337 542 Walker River NV 57,127,439 16,583 518 Isleta Pueblo NM 54,658,370 15,867 496 Ute Mountain NM, UT, CO 53,851,937 15,633 489 Acoma Pueblo NM 47,628,883 13,826 432 Duck Valley NV,ID 41,129,330 14,879 465 Southern Ute NM, CO 40,693,628 11,813 369 Fort Hall ID 36,419,526 13,175 412 White Mountain AZ 30,465,149 8,844 276 Pyramid Lake NV 29,464,482 9,905 310 Crow WY, MT 28,153,272 10,185 318 Moapa Band River NV 24,779,403 6,672 208

Geospatial Analysis of Renewable Energy Technical Potential on Tribal Lands
28
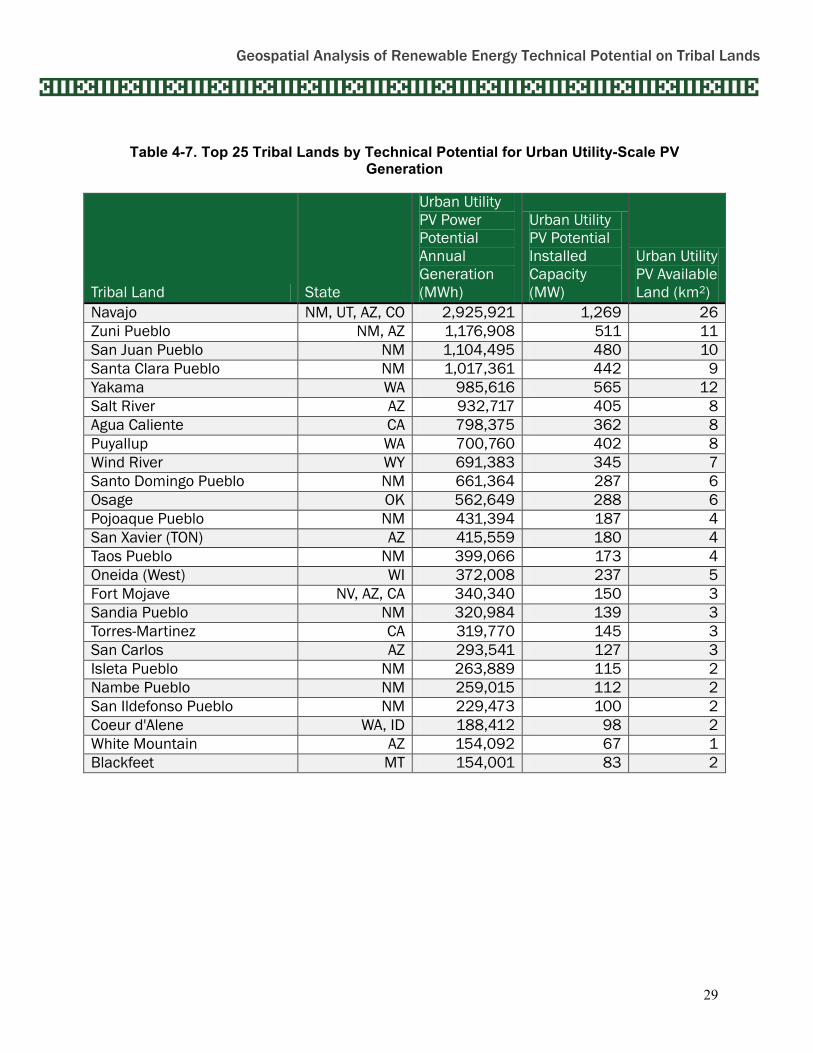
Solar PV: Urban Utility Scale The total technical potential on tribal lands for generation from utility-scale solar resources on urban land is about 15 million MWh, or about 0.7% of the total U.S. technical potential. The top four tribal lands in terms of potential generation are Navajo (2 million MWh), Zuni Pueblo (1 million MWh), and San Juan Pueblo (1 million MWh). A full list of technical potential by tribal land is listed in Appendix 2.
Figure 6. Tribal lands PV utility-scale urban generation potential
Geospatial Analysis of Renewable Energy Technical Potential on Tribal Lands
29
Table 4-7. Top 25 Tribal Lands by Technical Potential for Urban Utility-Scale PV Generation
Tribal Land State
Urban Utility PV Power Potential Annual Generation (MWh)
Urban Utility PV Potential Installed Capacity (MW)
Urban Utility PV Available Land (km2)
Navajo NM, UT, AZ, CO 2,925,921 1,269 26 Zuni Pueblo NM, AZ 1,176,908 511 11 San Juan Pueblo NM 1,104,495 480 10 Santa Clara Pueblo NM 1,017,361 442 9 Yakama WA 985,616 565 12 Salt River AZ 932,717 405 8 Agua Caliente CA 798,375 362 8 Puyallup WA 700,760 402 8 Wind River WY 691,383 345 7 Santo Domingo Pueblo NM 661,364 287 6 Osage OK 562,649 288 6 Pojoaque Pueblo NM 431,394 187 4 San Xavier (TON) AZ 415,559 180 4 Taos Pueblo NM 399,066 173 4 Oneida (West) WI 372,008 237 5 Fort Mojave NV, AZ, CA 340,340 150 3 Sandia Pueblo NM 320,984 139 3 Torres-Martinez CA 319,770 145 3 San Carlos AZ 293,541 127 3 Isleta Pueblo NM 263,889 115 2 Nambe Pueblo NM 259,015 112 2 San Ildefonso Pueblo NM 229,473 100 2 Coeur d'Alene WA, ID 188,412 98 2 White Mountain AZ 154,092 67 1 Blackfeet MT 154,001 83 2

Geospatial Analysis of Renewable Energy Technical Potential on Tribal Lands
30
Solar PV: Rural Utility Scale The total technical potential on tribal lands for electricity generation from utility-scale rural solar resource is about 9 billion MWh, or 3.3% of total U.S. generation potential. The top tribal lands in terms of potential generation are Navajo (2 billion MWh), Tohono O’odham (900 million MWh), and Fort Peck (450 million MWh). Developable potential of utility-scale solar is often limited by transmission availability and access. A full list of technical potential by tribal land is listed in Appendix 2.
Figure 7. Tribal lands PV utility-scale rural generation potential

Geospatial Analysis of Renewable Energy Technical Potential on Tribal Lands
31
Table 4-8. Top 25 Tribal Lands by Technical Potential for Rural Utility-Scale PV Generation
Tribal Land State
Rural Utility PV Power Potential Annual Generation (MWh)
Rural Utility PV Potential Installed Capacity (MW)
Rural Utility PV Available Land (km2)
Navajo NM, UT, AZ, CO 2,494,474,583 1,087,316 22,652 Hopi AZ 2,295,637,379 998,053 20,793 Tohono O’odham AZ 986,595,977 427,892 8,914 Standing Rock SD, ND 932,953,632 503,395 10,487 Fort Peck MT 609,883,158 327,966 6,833 Pine Ridge NE, SD 450,036,180 240,320 5,007 Uintah and Ouray UT 442,003,250 203,766 4,245 Osage OK 325,020,763 166,400 3,467 Cheyenne River SD 323,595,921 172,803 3,600 Wind River WY 318,333,071 158,647 3,305 Blackfeet MT 299,959,630 161,304 3,361 Rosebud NE, SD 284,184,572 151,746 3,161 Lake Traverse (Sisseton) SD, MN, ND 266,608,010 142,810 2,975 Zuni Pueblo NM, AZ 196,586,404 85,349 1,778 San Carlos AZ 187,916,024 81,500 1,698 Crow WY, MT 183,354,288 98,599 2,054 White Earth MN 180,721,292 109,009 2,271 Laguna Pueblo NM 172,651,833 74,984 1,562 Fort Berthold ND 168,674,984 95,006 1,979 Fort Belknap MT 168,388,007 90,551 1,886 Jicarilla Apache NM, CO 150,130,043 65,203 1,358 Hualapai AZ 134,901,150 58,507 1,219 Leech Lake MN 129,919,796 78,366 1,633 Gila River AZ 129,768,914 56,282 1,173 Yankton NE, SD 121,296,780 64,759 1,349

Geospatial Analysis of Renewable Energy Technical Potential on Tribal Lands
32
Wind The total technical potential on tribal lands for electricity generation from wind resources is about 1.1 billion MWh, or about 3.4% of the total U.S. technical potential. The top four tribal lands in terms of potential generation are Cheyenne River (183 million MWh), Standing Rock (145 million MWh), Fort Peck (122 million MWh), and Pine Ridge (110 million MWh). Developable potential of utility-scale wind, particularly in the Midwest where the resource is strongest but typically far from energy intense population centers, is often limited by transmission availability and access. A full list of technical potential by tribal land is listed in Appendix 2.
Figure 8. Tribal lands wind generation potential

Geospatial Analysis of Renewable Energy Technical Potential on Tribal Lands
33
Table 4-9. Top 25 Tribal Lands by Technical Potential for Wind Electricity Generation
Tribal Land State
Wind Potential Annual Generation at 80 m and GCF>= 30% (MWh)
Wind Potential Installed Capacity at 80 m and GCF>= 30% (MW)
Wind Available Land at 80 m and GCF>= 30% (km2)
Cheyenne River SD 188,088,492 57,806 11,561 Standing Rock SD, ND 149,093,091 45,972 9,194 Fort Peck MT 126,258,676 41,331 8,266 Pine Ridge NE, SD 113,398,124 38,028 7,606 Rosebud NE, SD 87,002,780 25,833 5,167 Blackfeet MT 69,911,790 24,476 4,895 Lake Traverse (Sisseton) SD, MN, ND 60,824,322 17,736 3,547 Fort Berthold ND 51,781,459 16,409 3,282 Osage OK 43,853,495 16,357 3,271 Crow WY, MT 43,407,456 16,497 3,299 Fort Belknap MT 32,739,605 11,725 2,345 Yankton NE, SD 21,573,834 6,732 1,346 White Earth MN 19,367,345 7,400 1,480 Crow Creek SD 17,699,282 5,722 1,144 Lower Brule SD 14,521,816 4,509 902 Devils Lake Sioux ND 14,300,155 4,533 907 Omaha IA, NE 12,508,456 3,919 784 Wind River WY 12,306,226 4,345 869 Northern Cheyenne MT 9,371,963 3,522 704 Winnebago IA, NE 6,601,533 2,094 419 Santee NE 6,489,284 2,118 424 Mescalero Apache NM 5,566,143 2,240 448 Fort Hall ID 5,031,295 2,026 405 Potawatomi Prairie Band KS 4,562,289 1,548 310 Yakama WA 3,720,634 1,383 277

Geospatial Analysis of Renewable Energy Technical Potential on Tribal Lands
34
5 Conclusion This report provides a summary of the technical potential for capacity and generation from a variety of renewable resources on tribal lands. It is intended to provide information to Tribes and researchers as to the opportunity for development on tribal lands. Table A2-1 summarizes the estimated technical generation and capacity potential on tribal lands for each renewable electricity technology examined in this report. As estimates of technical, rather than economic or market potential, these values do not consider:
• Allocation of available land among technologies (available land is generally assumed to be available to support development of more than one technology, and each set of exclusions was applied independently)
• Availability of existing or planned transmission infrastructure that is necessary to tie generation into the electricity grid
• The dependability of consistent electricity generation, at a time coincident to when electricity is used
• The cost associated with developing power at any location
• Presence of local, state, regional, or national policies, either existing or potential, that could encourage renewable development
• The location or magnitude of current and potential areas of electricity need.
Overall, the analysis shows that the technical potential on tribal lands is about 6% of the total national technical potential. This is disproportionately larger than the 2% tribal lands in the United States, indicating an increased potential density for renewable energy development on tribal lands. Next steps for understanding the developable potential of renewable energy on tribal lands include assessing tribal interests in development (e.g., scale of project, purpose of project, cultural sensitivity avoidance); understanding the energy environment in which the project would function as a way of assessing potential project viability and economics; and working with the local utility and regulatory authorities to understand renewable energy needs.
Updates to these technical potentials are possible on an ongoing basis as resource, system, exclusions, and domain knowledge change and data sets improve in quality and resolution.
Geospatial Analysis of Renewable Energy Technical Potential on Tribal Lands
35
6 References Doris, E.; Taylor, R. (2009). 2008 Weatherization and Intergovernmental Program Report. TP-6A2-43614; DOE/GO-102009-2859. Golden, CO: National Renewable Energy Laboratory. Accessed Aug. 15, 2012: http://www.nrel.gov/docs/fy09osti/43614.pdf.
Lopez, A.; Roberts, B.; Heimiller, D.; Blair, N.; Porro, G. (2012). 2012 U.S. Renewable Energy Technical Potentials: A GIS-Based Analysis. NREL TP-6A20-51946. Accessed August 15, 2012: http://www.nrel.gov/docs/fy12osti/51946.pdf.
Porro, G.; Heimiller, D. (2006). Report to Congress on Renewable Energy Resource Assessment Information for the United States - EPACT 201 Report. NREL TP-6A20-50168; DOE/GO-102010-3206. Golden, CO: National Renewable Energy Laboratory.

Geospatial Analysis of Renewable Energy Technical Potential on Tribal Lands
36
Appendix 1. Exclusions and Constraints, Capacity Factors, and Power Densities
Table A-1. Exclusions and Constraints for Urban Utility-Scale Photovoltaics
Slope Exclusion > 5% Contiguous Area Exclusion < 0.018 km2 Land Type(s) Exclusion Within Urban Boundaries ESRI (2004)
Landmarks ESRI (2007a) Parks ESRI (2007b) MRLC–Water MRLC (n.d.) MRLC–Wetlands MRLC (n.d.) MRLC–Forests MRLC (n.d.) MRLC–Impervious Surface >=
1% MRLC (n.d.)
Table A-2. Capacity Factors for Utility-Scale Photovoltaicsa
State Capacity Factor State Capacity Factor State Capacity Factor Alabama 0.200 Maine 0.191 Oklahoma 0.223 Alaska 0.105 Maryland 0.179 Oregon 0.227 Arizona 0.263 Massachusetts 0.182 Pennsylvania 0.177 Arkansas 0.207 Michigan 0.173 Rhode Island 0.176 California 0.252 Minnesota 0.189 South Carolina 0.202 Colorado 0.259 Mississippi 0.197 South Dakota 0.214 Connecticut 0.182 Missouri 0.193 Tennessee 0.201 Delaware 0.186 Montana 0.212 Texas 0.218 Florida 0.209 Nebraska 0.217 Utah 0.248 Georgia 0.203 Nevada 0.263 Vermont 0.176 Hawaii 0.210 New Hampshire 0.184 Virginia 0.200 Idaho 0.220 New Jersey 0.200 Washington 0.199 Illinois 0.186 New Mexico 0.263 West Virginia 0.172 Indiana 0.184 New York 0.184 Wisconsin 0.180 Iowa 0.199 North Carolina 0.206 Wyoming 0.229 Kansas 0.238 North Dakota 0.203 Kentucky 0.186 Ohio 0.173 Louisiana 0.196 a System Advisor Model (SAM)

Geospatial Analysis of Renewable Energy Technical Potential on Tribal Lands
37
Table A-3. Exclusions and Constraints for Rural Utility-Scale Photovoltaics and Concentrating Solar Power
Slope Exclusion > 5% Contiguous Area Exclusion
< 1 km2
Land Type(s) Exclusion
Urban Areas ESRI (2004)
MRLC–Water MRLC (n.d.) MRLC–Wetlands MRLC (n.d.) BLM ACEC Lands (Areas of Critical
Environmental Concern) (BLM 2009) BLM (2009)
Forest Service IRA (Inventoried Roadless Area) (USFS 2003)
USFS (2003)
National Park Service Lands USGS (2005) Fish & Wildlife Lands USGS (2005) Federal Parks USGS (2005) Federal Wilderness USGS (2005) Federal Wilderness Study Area USGS (2005) Federal National Monument USGS (2005) Federal National Battlefield USGS (2005) Federal Recreation Area USGS (2005) Federal National Conservation Area USGS (2005) Federal Wildlife Refuge USGS (2005) Federal Wildlife Area USGS (2005) Federal Wild and Scenic Area USGS (2005)
Table A-4. Capacity Factors for Concentrating Solar Powera
Class Kwh/m2/day Capacity Factor 1 5-6.25 0.315 2 6.25-7.25 0.393 3 7.25-7.5 0.428 4 7.5-7.75 0.434 5 > 7.75 0.448
a System Advisor Model (SAM)

Geospatial Analysis of Renewable Energy Technical Potential on Tribal Lands
38
Table A-5. Exclusions and Constraints for Onshore Wind Power
Slope Exclusion > 20% Distance Exclusion
< 3 km Distance to Excluded Area (does not apply to water)
Land Type(s) Exclusion
50% Forest Service Lands (includes National Grasslands, excludes ridge crests)
USGS (2005)
50% Department of Defense Lands (excludes ridge crest)
USGS (2005)
50% GAP Land Stewardship Class 2–Forest CBI (2004) 50% Exclusion of Non-Ridge Crest Forest (noncumulative
over Forest Service land) USGS (2005)
Airports ESRI (2003) Urban Areas ESRI (2004) LULC–Wetlands USGS (1993) LULC–Water USGS (1993) Forest Service IRA (Inventoried Roadless Areas) USFS (2003) National Park Service Lands USGS (2005) Fish and Wildlife Lands USGS (2005) Federal Parks USGS (2005) Federal Wilderness USGS (2005) Federal Wilderness Study Area USGS (2005) Federal National Monument USGS (2005) Federal National Battlefield USGS (2005) Federal Recreation Area USGS (2005) Federal National Conservation Area USGS (2005) Federal Wildlife Refuge USGS (2005) Federal Wildlife Area USGS (2005) Federal Wild and Scenic Area USGS (2005) GAP Land Stewardship Class 2–State and Private Lands
Equivalent to Federal Exclusions CBI (2004)
Geospatial Analysis of Renewable Energy Technical Potential on Tribal Lands
39
Table A-6. Capacity Factor for Offshore Wind Powera
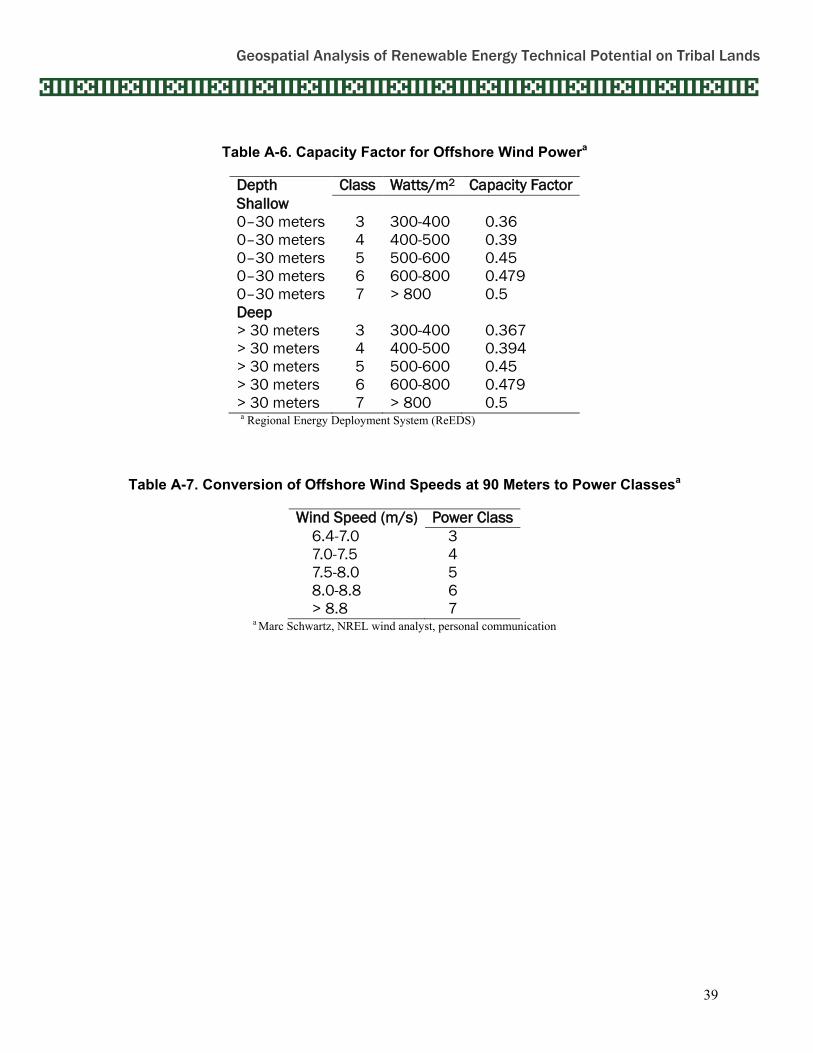
Depth Class Watts/m2 Capacity Factor Shallow 0–30 meters 3 300-400 0.36 0–30 meters 4 400-500 0.39 0–30 meters 5 500-600 0.45 0–30 meters 6 600-800 0.479 0–30 meters 7 > 800 0.5 Deep > 30 meters 3 300-400 0.367 > 30 meters 4 400-500 0.394 > 30 meters 5 500-600 0.45 > 30 meters 6 600-800 0.479 > 30 meters 7 > 800 0.5 a Regional Energy Deployment System (ReEDS)
Table A-7. Conversion of Offshore Wind Speeds at 90 Meters to Power Classesa
Wind Speed (m/s) Power Class 6.4-7.0 3 7.0-7.5 4 7.5-8.0 5 8.0-8.8 6 > 8.8 7
a Marc Schwartz, NREL wind analyst, personal communication

Geospatial Analysis of Renewable Energy Technical Potential on Tribal Lands
40
Table A-8. Exclusions and Constraints for Offshore Wind Powera
Distance Exclusion < 50 nautical miles from shoreline Land Type(s) Exclusion Federal Exclusions National Marine Sanctuaries
Marine Protected Areas Inventory–“NAL,” “NIL,” “NTL” Office of Habitat Conservation Habitat Protection Div. EFH–
Shipping Routes, Sanctuary Protected Areas NOAA Jurisdictional Boundaries and Limits–Coastal
National Wildlife Refuges–Pacific Navigational & Marine Infrastructure–Shipping Lanes,
Drilling Platforms (Gulf), Pipelines (Gulf), Fairways (Gulf) NWIOOS–Towlane Agreement WSG 2007 World Database on Protected Areas Annual Release 2009
Global Dataset–Offshore Oil and Gas Pipelines/Drilling Platforms
Texas Pipelines and Easements Audubon Sanctuaries Gulf Intercoastal Waterway/Ship Channels National Wildlife Refuges Shipping Safety Fairways State Coastal Preserves Dredged Material Placement Sites State Tracts with Resource Management Codes North Carolina Significant Natural Heritage Areas Sea Turtle Sanctuary Crane Spawning Sanctuary Great Lakes IM AOC EPA IM Ship Routes Virginia Near-shore Coastal Parks Threatened and Endangered Species Waters Crab Sanctuary Security Areas Striped Bass Sanctuary State Park and State Dedicated Natural Area Preserve
(w/in 1 mile of shoreline) Rhode Island Habitat Restoration Area Hazardous Material Sites Designated by the U.S. EPA and
RIDEM (w/in 0.5 miles of shoreline) CRMCWT08 (Type = 1 or 2) South Carolina Refuges OCRM Critical Area New Hampshire Conservation Focus Area Florida Ocean Dredged Material Disposal Sites Aquatic Preserve Boundaries California Cordell Banks Closed Areas

Geospatial Analysis of Renewable Energy Technical Potential on Tribal Lands
41
Massachusetts Ferry Routes Oregon Oregon Islands National Wildlife Refuges USFWS 2004 Oregon Marine Managed Areas Oregon Cables OFCC 2005 Dredged Material Disposal Sites ACOE 2008 New Jersey New Jersey Coastal Wind Turbine Siting Map–Exclusion
Areas a Exclusions were developed by Black and Veatch (2009).
Table A-9. Exclusions and Constraints for Enhanced Geothermal Systemsa
Land Type(s) Exclusion National Park Service Lands Fish and Wildlife Service Lands Federal Parks Federal Wilderness Federal National Monuments Federal National Battlefields Federal Restoration Areas Federal National Conservation
Areas Federal Wildlife Refuge Areas Federal Wild and Scenic Areas
a United States Geological Survey (USGS) (2005)

Geospatial Analysis of Renewable Energy Technical Potential on Tribal Lands
42
Table A-10. Power Densities for Enhanced Geothermal Systemsa
Temperature C MW/km2 150–200 0.59 200–250 0.76 250–300 0.86 300–350 0.97 > 350 1.19
a Augustine (2011)
Table A-11. Exclusions and Constraints for Enhanced Geothermal Systemsa
Depth Constraints Depth > 3 and < 10 km Land Type(s) Exclusion National Park Service Lands
Fish and Wildlife Service Lands
Federal Parks Federal Wilderness Federal National
Monuments Federal National Battlefields Federal Restoration Areas Federal Conservation Areas Federal Wildlife Refuge
Areas Federal Wild and Scenic
Areas a USGS (2005)

Geospatial Analysis of Renewable Energy Technical Potential on Tribal Lands
43
Appendix 2. Technical Potential by Tribal Lands for Renewable Resources
Table A2-1. Tribal Renewable Energy Potential—Hydrothermal, Hydropower, and Biopower
Tribal Land State
Unidentified Hydrothermal Potential Annual Generation (MWh)
Unidentified Hydrothermal Potential Installed Capacity (MW)
Hydropower Generation Potential (MWh)
Hydropower Capacity Potential (MW)
Biopower from Solid Residuesa (MWh)
Biopower from Solid Residues (MW)
Biopower from Gaseous Residuesb (MWh)
Biopower from Gaseous Residues (MW)
Acoma Pueblo NM 20,363 3 2,523 1 0 0 13 0 Agua Caliente CA 475 0 3,783 1 6,322 1 268 0 Alabama and Coushatta TX - - - - 3,493 0 3 0 Alamo (Navajo) NM 8,452 1 1,152 0 2 0 1 0 Alturas Rancheria CA 8 0 - - - - 0 0 Augustine CA 60 0 - - 127 0 0 0 Bad River WI - - 12,290 3 32,417 4 45 0 Barona Rancheria CA 96 0 - - - - 36 0 Bay Mills MI, MI - - 168 0 22 0 1 0 Benton Paiute CA 53 0 - - - - 0 0 Berry Creek Rancheria CA 0 0 - - 5 0 0 0 Big Bend Rancheria CA 11 0 - - 21 0 0 0 Big Cypress FL - - - - 15,013 2 17 0 Big Lagoon Rancheria CA - - - - 5 0 0 0 Big Pine Rancheria CA 83 0 - - - - 0 0 Big Sandy Rancheria CA 1 0 - - 5 0 0 0 Big Valley Rancheria CA 258 0 - - 64 0 0 0 Bishop Rancheria CA 521 0 - - 448 0 0 0 Blackfeet MT 60,031 8 445,893 102 87,202 11 98 0 Blue Lake Rancheria CA 1 0 - - 20 0 0 0 Bois Forte (Nett Lake) MN - - - - 28,872 4 3 0 Bridgeport Colony CA 18 0 - - - - 0 0 Brighton FL - - - - 18,809 2 24 0 Burns Paiute OR 2,436 0 - - 21 0 0 0 Cabazon CA 604 0 112 0 124 0 44 0 Cahuilla CA 511 0 241 0 67 0 7 0 Camp Verde AZ 25 0 - - 26 0 1 0 Campo CA 760 0 307 0 - - 3 0

Geospatial Analysis of Renewable Energy Technical Potential on Tribal Lands
44
Tribal Land State
Unidentified Hydrothermal Potential Annual Generation (MWh)
Unidentified Hydrothermal Potential Installed Capacity (MW)
Hydropower Generation Potential (MWh)
Hydropower Capacity Potential (MW)
Biopower from Solid Residuesa (MWh)
Biopower from Solid Residues (MW)
Biopower from Gaseous Residuesb (MWh)
Biopower from Gaseous Residues (MW)
Capitan Grande CA 165 0 1,624 0 - - 16 0 Carson Colony NV 66 0 - - 58 0 0 0 Catawba SC - - - - 645 0 4 0 Cattaraugus (Seneca) NY - - 9,678 2 971 0 26 0 Cedarville Rancheria CA 21 0 - - 0 0 0 0 Chehalis WA 10 0 1,545 0 3,205 0 2 0 Chemehuevi CA 4,412 1 - - - - 2 0 Cheyenne River SD - - 47,065 11 35,581 5 68 0 Chicken Ranch Rancheria CA 0 0 - - 0 0 0 0 Chitimacha LA - - - - 172 0 2 0 Cochiti Pueblo NM 17,958 2 25,682 6 39 0 33 0 Cocopah AZ, CA 1,368 0 - - 1,161 0 25,403 3 Coeur d'Alene WA,ID 24,563 3 18,416 4 264,737 34 84 0 Cold Springs Rancheria CA 0 0 - - 1 0 0 0 Colorado River AZ, CA 41,401 5 106,505 24 17,814 2 34 0 Colusa (Cachil Dehe) Rancheria CA 1 0 - - 13 0 0 0 Colville WA 70,390 9 247,936 57 59,616 8 89 0 Coos, Lower Umpqua, and Siuslaw OR 0 0 - - 5 0 0 0 Cortina Rancheria CA 40 0 - - - - 0 0 Coushatta LA - - - - 73 0 0 0 Cow Creek OR 0 0 - - - - 0 0 Coyote Valley CA 22 0 - - 72 0 0 0 Crow WY, MT 28,073 4 89,049 20 43,001 5 229 0 Crow Creek SD - - 3,303 1 23,293 3 18 0 Crow/Northern Cheyenne Area MT 417 0 - - 17 0 0 0 Cuyapaipe CA 227 0 - - - - 1 0 Deer Creek MN - - - - 1,800 0 1 0 Devils Lake Sioux ND - - - - 46,079 6 32 0 Dresslerville Colony NV 15 0 - - 14 0 0 0 Dry Creek Rancheria CA 192 0 - - 6 0 0 0 Duck Valley NV, ID 164,004 21 14,913 3 - - 2 0 Duckwater NV 915 0 - - - - 0 0 Eastern Cherokee NC - - 13,299 3 3,223 0 25 0 Elk Valley Rancheria CA 1 0 - - 29 0 0 0 Ely Colony NV 57 0 - - 60 0 0 0 Enterprise Rancheria CA 0 0 - - 6 0 0 0

Geospatial Analysis of Renewable Energy Technical Potential on Tribal Lands
45
Tribal Land State
Unidentified Hydrothermal Potential Annual Generation (MWh)
Unidentified Hydrothermal Potential Installed Capacity (MW)
Hydropower Generation Potential (MWh)
Hydropower Capacity Potential (MW)
Biopower from Solid Residuesa (MWh)
Biopower from Solid Residues (MW)
Biopower from Gaseous Residuesb (MWh)
Biopower from Gaseous Residues (MW)
Fallon NV 6,611 1 - - - - 1 0 Fallon Colony NV 75 0 - - 19 0 0 0 Flandreau SD - - 621 0 1,565 0 0 0
Flathead MT 151,999 19 816,341 186 123,57
2 16 262 0 Fond du Lac MN - - 8,042 2 41,847 5 86 0 Fort Belknap MT 7,786 1 5,108 1 16,216 2 14 0 Fort Berthold ND - - 3,819 1 109,151 14 43 0 Fort Bidwell CA 3,080 0 1,265 0 47 0 0 0 Fort Hall ID 179,275 23 70,593 16 101,896 13 210 0 Fort Independence CA 50 0 - - - - 0 0 Fort McDermitt NV, OR 18,956 2 2,347 1 3 0 0 0 Fort Mojave NV, AZ, CA 4,992 1 3,050 1 565 0 50 0 Fort Peck MT 120,159 15 57,645 13 159,234 20 71 0 Fort Yuma (Quechan) AZ, CA 9,903 1 12,331 3 2,518 0 7 0 Gila Bend (TON) AZ 112 0 - - 1 0 0 0 Gila River AZ 27,789 4 47,987 11 26,922 3 459 0 Goshute NV, UT 44,152 6 5,833 1 75 0 1 0 Grand Portage MN - - 10,877 2 3,174 0 3 0 Grand Ronde OR 23 0 6,123 1 20,641 3 3 0 Grand Traverse MI - - - - 2 0 0 0 Greenville Rancheria CA 13 0 - - 29 0 0 0 Grindstone Creek Rancheria CA 1 0 - - - - 0 0 Hannahville Community MI - - - - 763 0 1 0 Havasupai AZ 9,880 1 5,692 1 153 0 4 0 Ho-Chunk WI - - 1,364 0 68,939 9 7 0 Hoh WA - - - - 34 0 0 0 Hollywood (Seminole) FL - - - - 406 0 29 0 Hoopa Valley CA 623 0 38,550 9 55,748 7 10 0 Hopi AZ 42,330 5 1,860 0 745 0 62 0 Hopland Rancheria CA 31 0 - - 10 0 0 0 Hualapai AZ 210,076 27 897 0 580 0 16 0 Huron Potawatomi MI - - - - 51 0 0 0 Inaja-Cosmit CA 48 0 895 0 - - 0 0 Indian Township (Passamaquoddy) ME - - 157 0 3,797 0 4 0 Iowa KS, NE, MO - - 237 0 7,368 1 2 0

Geospatial Analysis of Renewable Energy Technical Potential on Tribal Lands
46
Tribal Land State
Unidentified Hydrothermal Potential Annual Generation (MWh)
Unidentified Hydrothermal Potential Installed Capacity (MW)
Hydropower Generation Potential (MWh)
Hydropower Capacity Potential (MW)
Biopower from Solid Residuesa (MWh)
Biopower from Solid Residues (MW)
Biopower from Gaseous Residuesb (MWh)
Biopower from Gaseous Residues (MW)
Isabella (Sag Chip) MI - - 5,177 1 41,506 5 320 0 Isleta Pueblo NM 44,203 6 8,483 2 561 0 169 0 Jackson Rancheria CA 1 0 418 0 29 0 0 0 Jamestown S'Klallam WA 0 0 - - 2 0 0 0 Jamul Village CA 0 0 - - - - 0 0 Jemez Pueblo NM 32,709 4 3,944 1 25 0 14 0 Jicarilla Apache NM, CO 143,397 18 15,647 4 10,155 1 16 0 Kaibab AZ 17,715 2 452 0 14 0 4 0 Kalispel WA 177 0 - - 923 0 1 0 Karuk CA 1 0 - - 88 0 0 0 Kickapoo KS - - 1,109 0 10,874 1 5 0 Kootenai ID 1 0 - - 0 0 0 0 La Jolla CA - - 30,993 7 - - 9 0 La Posta CA 376 0 516 0 - - 1 0 Lac Courte Oreilles WI 205 0 616 0 27,629 4 16 0 Lac du Flambeau WI - - - - 12,766 2 27 0 Lac Vieux Desert MI - - - - - - 0 0 Laguna Pueblo NM - - 8,823 2 43 0 38 0 Lake Traverse (Sisseton) SD, MN, ND 88,772 11 229 0 300,466 38 97 0 L'Anse MI - - 6,201 1 7,898 1 22 0 Las Vegas Colony NV 509 0 - - 10 0 2 0 Laytonville Rancheria CA 15 0 - - 54 0 0 0 Leech Lake MN - - 1,792 0 158,657 20 126 0 Likely Rancheria CA 2 0 - - 0 0 0 0 Lone Pine Rancheria CA 84 0 - - - - 888 0 Lookout Rancheria CA 29 0 - - - - 0 0 Los Coyotes CA 1,111 0 362 0 - - 2 0 Lower Brule SD - - 225 0 12,104 2 11 0 Lower Elwha WA - - - - 94 0 0 0 Lower Sioux Community MN - - - - 874 0 1 0 Lummi WA 12 0 1,263 0 1,210 0 50 0 Makah WA 45 0 5,908 1 11,043 1 3 0 Manchester (Point Arena) Rancheria CA 12 0 - - 104 0 0 0 Manzanita CA 204 0 164 0 - - 1 0 Maricopa (Ak-Chin) AZ 2,313 0 313 0 11,100 1 9 0 Mashantucket Pequot CT - - - - 5 0 5 0

Geospatial Analysis of Renewable Energy Technical Potential on Tribal Lands
47
Tribal Land State
Unidentified Hydrothermal Potential Annual Generation (MWh)
Unidentified Hydrothermal Potential Installed Capacity (MW)
Hydropower Generation Potential (MWh)
Hydropower Capacity Potential (MW)
Biopower from Solid Residuesa (MWh)
Biopower from Solid Residues (MW)
Biopower from Gaseous Residuesb (MWh)
Biopower from Gaseous Residues (MW)
Menominee WI - - 11,198 3 246,145 31 42 0 Mesa Grande CA 587 0 593 0 - - 1 0 Mescalero Apache NM 41,007 5 7,696 2 10,073 1 27 0 Miccosukee FL - - - - 17 0 0 0 Middletown Rancheria CA 523 0 - - - - 0 0 Mille Lacs MN - - - - 117 0 1 0 Minnesota (Chippewa) Homestead Trust Lands MN - - - - 88 0 0 0 Mississippi Choctaw MS - - - - 23,696 3 12 0 Moapa Band River NV 15,138 2 784 0 - - 4 0 Montgomery Creek Rancheria CA 14 0 - - 45 0 0 0 Morongo CA 1,515 0 4,523 1 183 0 77 0 Muckleshoot WA 9 0 46,137 11 1,911 0 56 0 Nambe Pueblo NM 7,461 1 2,720 1 327 0 13 0 Narragansett RI - - - - 12 0 6 0
Navajo NM, UT, AZ,
CO 597,545 76 369,000 84 103,018 13 1,755 0 Nez Perce ID 51,827 7 1,445,260 330 336,781 43 104 0 Nisqually WA 12 0 57,594 13 3,049 0 23 0 Nooksack WA 68 0 2,473 1 342 0 4 0 North Fork Rancheria CA 0 0 - - - - 0 0 Northern Cheyenne MT 17,254 2 10,969 3 16,660 2 35 0 Northwestern Shoshoni UT 69 0 358 0 - - 0 0 Oil Springs NY - - - - 31 0 0 0 Omaha IA, NE - - 61,961 14 143,838 18 44 0 Oneida (East) NY - - - - 2 0 0 0 Oneida (West) WI - - 723 0 33,087 4 232 0 Onondaga NY - - 2,880 1 727 0 17 0 Ontonagon MI - - - - 200 0 0 0 Osage OK - - 33,957 8 13,679 2 659 0 Ozette WA - - - - 121 0 0 0 Paiute of Utah UT 14,736 2 2,268 1 6 0 24 0 Pala CA 789 0 2,933 1 - - 12 0 Pascua Yaqui AZ 135 0 - - 415 0 10 0 Passamaquoddy Homestead Trust Lands ME - - 5,322 1 12,789 2 0 0

Geospatial Analysis of Renewable Energy Technical Potential on Tribal Lands
48
Tribal Land State
Unidentified Hydrothermal Potential Annual Generation (MWh)
Unidentified Hydrothermal Potential Installed Capacity (MW)
Hydropower Generation Potential (MWh)
Hydropower Capacity Potential (MW)
Biopower from Solid Residuesa (MWh)
Biopower from Solid Residues (MW)
Biopower from Gaseous Residuesb (MWh)
Biopower from Gaseous Residues (MW)
Pauma CA 220 0 - - - - 2 0 Payson (Yavapai-Apache) Community AZ 5 0 - - - - 0 0 Pechanga CA 357 0 - - 219 0 32 0 Penobscot ME - - 189,260 43 12,513 2 13 0 Picayune Rancheria CA 0 0 - - - - 0 0 Picuris Pueblo NM 11,905 2 8,657 2 27 0 3 0 Pine Ridge NE, SD - - 29,895 7 13,596 2 124 0 Pinoleville Rancheria CA 36 0 - - 71 0 0 0 Pit River Tribe of California CA 312 0 2,098 0 168 0 0 0 Pleasant Point (Passamaquoddy) ME - - - - 28 0 1 0 Poarch Creek AL - - - - 27 0 0 0 Pojoaque Pueblo NM 5,128 1 567 0 571 0 7 0 Poospatuck NY - - - - 27 0 2 0 Port Gamble WA 5 0 - - 111 0 4 0 Port Madison WA 20 0 - - 2,192 0 61,835 8 Potawatomi Forest County WI - - - - 2,377 0 2 0 Potawatomi Prairie Band KS - - 772 0 11,095 1 19 0 Prairie Island Community MN - - - - 65 0 0 0 Puyallup WA 46 0 9,170 2 15,640 2 427 0 Pyramid Lake NV 324,409 41 31,167 7 222 0 8 0 Quartz Valley Rancheria CA 1 0 - - 76 0 0 0 Quileute WA - - - - 408 0 0 0 Quinault WA 406 0 339,978 78 161,549 20 12 0 Ramah Navajo Community NM 1,875 0 - - 0 0 1 0 Ramona CA 26 0 - - - - 0 0 Red Cliff WI - - - - 2,145 0 3 0 Red Lake MN - - 117 0 124,764 16 54 0 Redding Rancheria CA 0 0 - - 18 0 0 0 Redwood Valley Rancheria CA 29 0 - - 69 0 0 0 Reno-Sparks Colony NV 1,991 0 - - 18 0 8 0 Resighini Rancheria CA 3 0 - - 14 0 0 0 Rincon CA 101 0 968 0 - - 7 0 Roaring Creek Rancheria CA 22 0 - - 39 0 0 0 Robinson Rancheria CA 54 0 - - - - 0 0 Rocky Boy's MT 3,044 0 2,858 1 18,430 2 9 0 Rohnerville Rancheria CA 1 0 - - 27 0 0 0

Geospatial Analysis of Renewable Energy Technical Potential on Tribal Lands
49
Tribal Land State
Unidentified Hydrothermal Potential Annual Generation (MWh)
Unidentified Hydrothermal Potential Installed Capacity (MW)
Hydropower Generation Potential (MWh)
Hydropower Capacity Potential (MW)
Biopower from Solid Residuesa (MWh)
Biopower from Solid Residues (MW)
Biopower from Gaseous Residuesb (MWh)
Biopower from Gaseous Residues (MW)
Rosebud NE, SD - - 31,800 7 20,291 3 85 0 Round Valley CA 1,672 0 20,205 5 15,239 2 2 0 Rumsey Rancheria CA 2 0 - - - - 0 0 Sac and Fox (Iowa) IA - - 3,564 1 2,952 0 2 0 Sac and Fox (KS-NE) KS, NE - - 4,678 1 8,689 1 5 0 Salt River AZ 3,589 0 17,910 4 3,495 0 59,395 8 San Carlos AZ 179,374 23 49,442 11 12,211 2 76 0 San Felipe Pueblo NM 13,693 2 9,678 2 17 0 19 0 San Felipe/Santa Ana joint area NM 191 0 - - 0 0 0 0 San Felipe/Santo Domingo joint area NM 216 0 - - 0 0 0 0 San Ildefonso Pueblo NM 11,631 1 13,036 3 349 0 15 0 San Juan Pueblo NM 10,803 1 12,465 3 1,859 0 48 0 San Manuel CA 41 0 - - 5 0 3 0 San Pasqual CA 34 0 - - - - 2 0 San Xavier (TON) AZ 13,619 2 2,638 1 575 0 293 0 Sandia Pueblo NM 4,499 1 1,770 0 596 0 53 0 Sandy Lake MN - - - - 0 0 0 0 Santa Ana Pueblo NM 17,965 2 7,128 2 133 0 37 0 Santa Clara Pueblo NM 34,534 4 11,984 3 2,109 0 104 0 Santa Rosa CA 1,390 0 108 0 - - 1 0 Santa Rosa Rancheria CA 1 0 - - 18 0 0 0 Santa Ynez CA 43 0 - - 31 0 0 0 Santa Ysabel CA 1,249 0 599 0 - - 1 0 Santee NE - - 4,184 1 27,871 4 10 0 Santo Domingo Pueblo NM 20,388 3 10,871 2 718 0 40 0 Sauk-Suiattle WA 2 0 - - 11 0 0 0 Sault Ste. Marie MI, MI - - - - 104 0 1 0 Seminole Homestead Trust Lands FL - - - - 10 0 0 0 Seneca (Allegany) PA, NY - - - - 4,979 1 17 0 Shakopee Community MN - - - - 126 0 2 0 Sheep Ranch Rancheria CA 0 0 - - 0 0 0 0 Sherwood Valley Rancheria CA 37 0 - - 81 0 0 0 Shingle Springs Rancheria CA 1 0 - - - - 0 0 Shoalwater WA - - - - 390 0 0 0 Siletz OR 9 0 - - 1,072 0 1 0 Skokomish WA 12 0 15,169 3 6,301 1 6 0

Geospatial Analysis of Renewable Energy Technical Potential on Tribal Lands
50
Tribal Land State
Unidentified Hydrothermal Potential Annual Generation (MWh)
Unidentified Hydrothermal Potential Installed Capacity (MW)
Hydropower Generation Potential (MWh)
Hydropower Capacity Potential (MW)
Biopower from Solid Residuesa (MWh)
Biopower from Solid Residues (MW)
Biopower from Gaseous Residuesb (MWh)
Biopower from Gaseous Residues (MW)
Skull Valley UT 15,562 2 - - - - 0 0 Smith River Rancheria CA 0 0 - - 8 0 0 0 Soboba CA 263 0 854 0 165 0 64 0 Southern Ute NM, CO 188,245 24 243,721 56 1,978 0 144 0 Spokane WA 12,184 2 16,571 4 66,932 8 18 0 Squaxin Island WA 4 0 - - 1,159 0 2 0 St. Croix WI - - - - 278 0 1 0 St. Regis Mohawk NY - - 3,293 1 2,257 0 21 0 Standing Rock SD, ND - - 18,638 4 24,045 3 64 0 Stewarts Point Rancheria CA 16 0 - - 5 0 0 0 Stillaguamish WA 0 0 - - 7 0 0 0 Stockbridge-Munsee WI - - - - 74 0 1 0 Sulphur Bank (El-Em) Rancheria CA 76 0 - - - - 0 0 Summit Lake NV 10,851 1 - - - - 0 0 Susanville CA 79 0 - - 176 0 0 0 Swinomish WA 39 0 3,080 1 1,769 0 22 0 Sycuan CA 5 0 - - - - 12 0 Table Bluff Rancheria CA - - - - 5 0 0 0 Table Mountain Rancheria CA 1 0 - - 6 0 0 0 Taos Pueblo NM 46,205 6 16,518 4 985 0 62 0 Te-Moak NV 14,860 2 6,340 1 169 0 1 0 Tesuque Pueblo NM 5,948 1 635 0 58 0 9 0 To’Hajiilee Chapter, Navajo Nation NM 11,434 1 398 0 8 0 10 0 Tohono O'odham AZ 510,243 65 - - 7,512 1 296 0 Tonawanda NY - - 779 0 156 0 5 0 Torres-Martinez CA 10,284 1 152 0 1,160 0 10 0 Trinidad Rancheria CA - - - - 42 0 0 0 Tulalip WA 62 0 815 0 9,470 1 164 0 Tule River CA 140 0 23,717 5 788 0 76 0 Tunica-Biloxi LA - - - - 141 0 0 0 Tuolumne Rancheria CA 1 0 926 0 83 0 1 0 Turtle Mountain ND, MT 0 0 - - 6,268 1 34 0
Tuscarora NY - - - - 708 0 440,92
5 56 Twenty-Nine Palms CA 18 0 - - - - 0 0 Uintah and Ouray UT 78,807 10 442,276 101 11,811 1 335 0

Geospatial Analysis of Renewable Energy Technical Potential on Tribal Lands
51
Tribal Land State
Unidentified Hydrothermal Potential Annual Generation (MWh)
Unidentified Hydrothermal Potential Installed Capacity (MW)
Hydropower Generation Potential (MWh)
Hydropower Capacity Potential (MW)
Biopower from Solid Residuesa (MWh)
Biopower from Solid Residues (MW)
Biopower from Gaseous Residuesb (MWh)
Biopower from Gaseous Residues (MW)
Umatilla OR 3,998 1 57,403 13 31,490 4 34 0 Upper Lake Rancheria CA 119 0 - - - - 0 0 Upper Sioux Community MN - - - - 653 0 0 0 Upper Skagit WA 1 0 - - 22 0 0 0 Ute Mountain NM, UT, CO 40,583 5 34,258 8 5,442 1 27 0 Vermillion Lake MN - - - - 137 0 0 0 Viejas Rancheria CA 15 0 - - - - 3 0 Walker River NV 246,481 31 16,585 4 - - 14 0 Warm Springs OR 405,953 51 130,737 30 35,935 5 31 0 Washoe NV 687 0 10,030 2 121 0 3 0 White Earth MN - - 3,357 1 138,785 18 115 0 White Mountain AZ 119,240 15 115,435 26 14,148 2 182 0 Wind River WY 47,999 6 350,640 80 6,349 1 183 0 Winnebago IA, NE - - 48,821 11 76,709 10 22 0 Winnemucca Colony NV 350 0 - - 13 0 0 0 Woodfords Community CA 89 0 - - - - 0 0 XL Ranch CA 8,312 1 2,726 1 117 0 1 0 Yakama WA 155,549 20 669,640 153 274,750 35 329 0 Yankton NE, SD - - 5,029 1 114,257 14 55 0 Yavapai AZ 197 0 - - 639 0 8 0 Yawapa Apache AZ 1,658 0 14,108 3 190 0 74,323 9 Yerington NV 268 0 - - 9 0 0 0 Yomba NV 1,941 0 172 0 - - 0 0 Ysleta Del Sur Pueblo TX - - - - 15 0 1 0 Yurok CA 642 0 912 0 25,962 3 6 0 Zia Pueblo NM 34,064 4 1,864 0 38 0 6 0 Zuni Pueblo NM, AZ 44,632 6 7,926 2 3,457 0 67 0
a Solid residues are represented by forest, crop, primary mill, and urban wood residues. Generation estimated assuming 1.1 MWh/bone dry tonne of residue. b Gaseous residues are represented by landfill and domestic wastewater residues. Generation estimated assuming 4.7 MWh/tonne of CH4 produced by the residues.