geospatial analysis of high-crash intersections and rural ...scholar.lib.vt.edu/vtti/reports... ·...
TRANSCRIPT

i
Geospatial Analysis of High-Crash
Intersections and Rural Roads using
Naturalistic Driving Data
Final Report
Brad R. Cannon Jeremy Sudweeks
Submitted: September 26, 2011
11-UT-013

ACKNOWLEDGMENTS
The authors of this report would like to acknowledge the support of the stakeholders of the
National Surface Transportation Safety Center for Excellence (NSTSCE): Tom Dingus from the
Virginia Tech Transportation Institute, John Capp from General Motors Corporation, Carl
Andersen from the Federal Highway Administration, Chris Hayes from Travelers Insurance,
Martin Walker from the Federal Motor Carrier Safety Administration, and Jose Gomez from the
Virginia Department of Transportation and the Virginia Center for Transportation Innovation
and Research.
The NSTSCE stakeholders have jointly funded this research for the purpose of developing and
disseminating advanced transportation safety techniques and innovations.

i
EXECUTIVE SUMMARY
Despite the fact that overall road safety continues to improve, intersections and rural roads
persist as trouble areas or hotspots. Using a previously developed method, naturalistic driving
data were identified through intersection and rural road hotspots and compared to naturalistic
driving data through similar intersections and rural road locations, but with low crash counts.
Few significant differences were found between driver behaviors in the low-crash and high-crash
areas of study. For the few significant differences, there was not an apparent consistent pattern.
A compelling possibility that warrants further investigation is that drivers may not recognize
when they have entered an area with high-crash counts and that a change in driving behavior
would be appropriate.


iii
TABLE OF CONTENTS
EXECUTIVE SUMMARY .................................................................................................................................... i
LIST OF FIGURES .............................................................................................................................................. v
LIST OF TABLES.............................................................................................................................................. vii
LIST OF ABBREVIATIONS .............................................................................................................................. ix
CHAPTER 1. INTRODUCTION ......................................................................................................................... 1
CHAPTER 2. METHODS .................................................................................................................................... 3
IDENTIFYING RURAL ROAD HOTSPOTS ............................................................................................................. 3 Selecting Hotspots with Naturalistic Driving Data for Analysis ................................................................. 4
IDENTIFYING INTERSECTION HOTSPOTS ......................................................................................................... 10 Intersection Selection ................................................................................................................................ 10
VIDEO REDUCTION ......................................................................................................................................... 17 Reductionist Training................................................................................................................................ 18 Event Validation ........................................................................................................................................ 18 Question Reduction ................................................................................................................................... 18 Spot-Checking ........................................................................................................................................... 18
ANALYSIS METHODS ....................................................................................................................................... 19
CHAPTER 3. RESULTS .................................................................................................................................... 21
DRIVER BEHAVIORS ........................................................................................................................................ 21 Secondary Tasks ........................................................................................................................................ 21
SUMMARY OF ANALYSIS.................................................................................................................................. 27
CHAPTER 4. DISCUSSION AND CONCLUSIONS ........................................................................................ 29
FUTURE WORK ............................................................................................................................................... 29 LIMITATIONS OF THE STUDY ........................................................................................................................... 30
APPENDIX A. .................................................................................................................................................... 31
REFERENCES ................................................................................................................................................... 49


v
LIST OF FIGURES
Figure 1. Diagram. Flow chart of high-crash road segment selection process. ...................... 5
Figure 2. Aerial Image. Prices Fork Road contiguous high-crash (red) and low-crash
(blue) road segments. (Source: www.bing.com, 2010) ................................................. 6
Figure 3. Aerial Images. US-460 separated high-crash (red) and low-crash (blue) road
segments. (Source: www.bing.com, 2010) .................................................................... 7
Figure 4. Aerial Images. VA-28 separated high-crash (red) and low-crash (blue) road
segments. (Source: www.bing.com, 2010) .................................................................... 8
Figure 5. Aerial Image. VA-7 Opposing Direction High-Crash (Red) and Low-Crash
(Blue) Road Segments. (Source: www.bing.com, 2010) ............................................... 9
Figure 6. Chart. Crash type counts per road segment. ..........................................................10
Figure 7. Aerial Image. Braddock Rd at Backlick Rd (node 263290). This intersection
served as a high-crash intersection in the analysis. (Source: www.bing.com, 2010) .12
Figure 8. Aerial Image. Lee Hwy at Waples Mill Rd and Shirley Gate Rd (node 277764).
This intersection served as a high-crash intersection in the analysis. (Source:
www.bing.com, 2010) ...................................................................................................13
Figure 9. Aerial Image and Map. Waxpool Rd. at Farmwell Rd (node 713920). This
intersection served as a low-crash intersection in the analysis. (Source:
www.bing.com, 2010) ...................................................................................................14
Figure 10. Aerial Image. Balls Ford Rd at Sudley Rd. This intersection served as a low-
crash intersection during analysis. (Source: www.bing.com, 2010) ...........................15
Figure 11. Chart. Crash types reported at two intersections between the years 1999 and
2005. .............................................................................................................................16
Figure 12. Chart. Crash types reported at two intersections between the years 1999 and
2005. .............................................................................................................................17
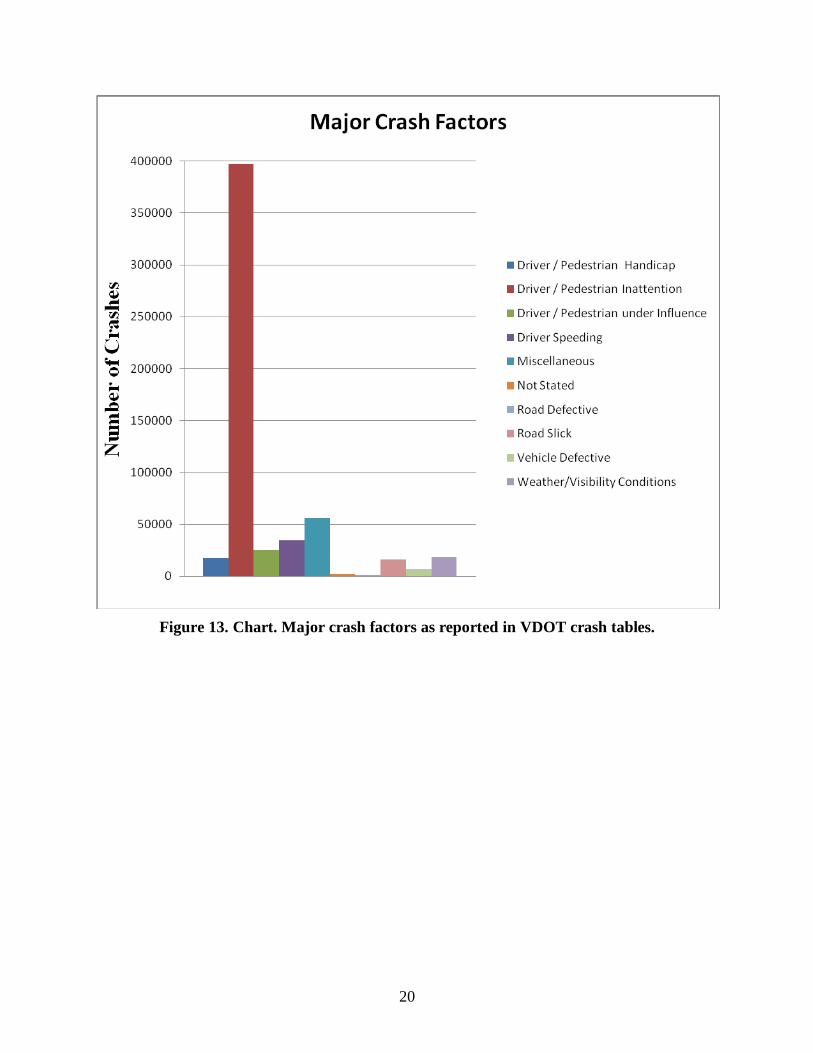
Figure 13. Chart. Major crash factors as reported in VDOT crash tables. ..........................20


vii
LIST OF TABLES
Table 1. Summary measures used in selection of high-crash intersections. Gray shading
indicates high-crash intersections used in analysis. ....................................................11
Table 2. Summary measures used in selection of low-crash intersections. ...........................14
Table 3. Number of trips analyzed per roadway and segment type. .....................................19
Table 4. 100-Car aggregate 95% confidence intervals. .........................................................21
Table 5. Older Driver aggregate 95% confidence intervals. .................................................22
Table 6. VA-7 95% confidence intervals. ...............................................................................23
Table 7. VA-28 95% confidence intervals. .............................................................................24
Table 8. US-460 95% confidence intervals. ............................................................................25
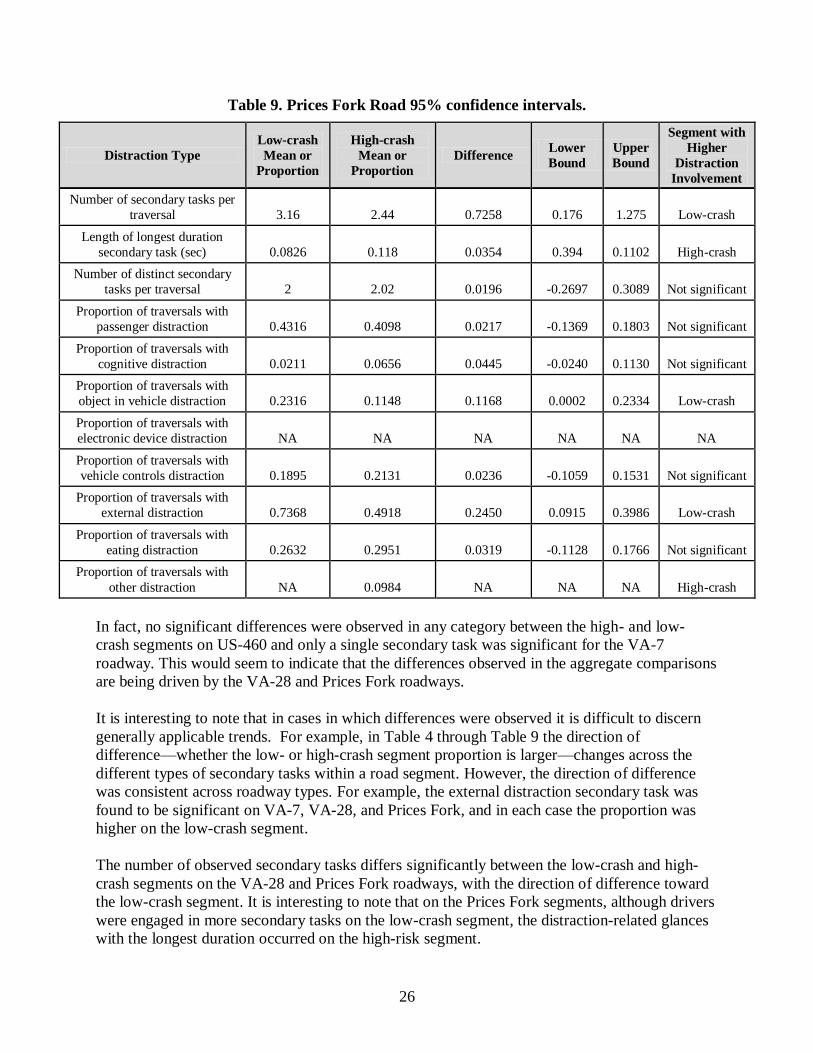
Table 9. Prices Fork Road 95% confidence intervals. ...........................................................26


ix
LIST OF ABBREVIATIONS
AADT Average Annual Daily Traffic
ESRI Environmental Systems Research Institute, Inc.
GIS Geographic Information System
GPS Global Positioning System
SQL Structured Query Language
UA Urbanized Area
UC Urban Cluster
VDOT Virginia Department of Transportation
VTTI Virginia Tech Transportation Institute


1
CHAPTER 1. INTRODUCTION
As overall road safety continues to improve, some problem areas continue to have a
disproportionate number of fatal and injurious crashes. Two types of areas that often have an
unusually high number of injuries and fatalities are intersections and rural areas. Recently,
naturalistic driving data have been able to provide a new opportunity for exploring crashes in
more detail than was previously possible with only crash report data. Naturalistic data also
provide the possibility of studying drivers‘ behavior during non-crash situations. This allows
comparisons of behavior while driving through an area in both crash and non-crash situations
and comparisons of driving behavior in different areas.
Geographic information systems (GIS) allow analysis based on geographical location variables
(i.e., latitude and longitude from Global Positioning System [GPS]) contained within the data.
Data containing geographical information are known as geospatial data. Previous work
developed a method using GIS to find rural driving within large naturalistic driving datasets.(1)
In
the latest work, naturalistic data through high-crash rural roads were identified and compared to
naturalistic data through low-crash rural roads. This method was also adapted and used to
compare naturalistic data through high-crash intersections with naturalistic data from low-crash
intersections.


3
CHAPTER 2. METHODS
In previous work, a method was developed to identify naturalistic driving data in rural areas.(1)
That method was used here to identify rural driving in the two naturalistic driving datasets used
in this work. These processes were also adapted to identify driving through intersections in the
same datasets. The naturalistic driving data used were collected in the 100-Car Study(2)
and the
Virginia Tech Transportation Institute‘s (VTTI) Older Driver Collection. The 100-Car Study
data were collected in the northern Virginia/Washington, DC metro area and provide a resource
of naturalistic driving data for a variety of drivers in different situations. Due to the collection
area‘s urban location, most of the driving data in the dataset are on urban roads, but still provide
some driving data for rural areas. The Older Driver data were collected from drivers in and
around Blacksburg in the New River Valley area of southwestern Virginia. The Older Driver
data were used to augment the 100-Car data because of a higher prevalence of rural driving in
southwestern Virginia than in northern Virginia.
The method for identifying rural driving is dependent on the use of GIS software. In the
naturalistic driving data, the latitude and longitude pair that identifies the current location of the
car is recorded at a rate of 1 Hz. Collectively, these points are referred to as breadcrumb trails.
The definition of a rural road used here is the same as the definition used in the earlier study(1)
,
which is a road outside of an urbanized area (UA) or urban cluster (UC) as defined by the U.S.
Census Bureau, excluding interstate highways. Consequently, breadcrumb trails outside the
boundaries of any UA or UC and not falling on an interstate highway were identified for study in
this work.
Geographic data describing the boundaries of UAs and UCs were obtained from the Census
Bureau in the shapefile format, which stores geographic data for use with commonly available
GIS software. Shapefiles were also acquired from the Virginia Department of Transportation
(VDOT) which describe the centerlines of the roadways in Virginia. Tables describing crashes in
Virginia from 1999 through 2005 were also obtained from VDOT. These tables included details
such as the latitude and longitude of the crash, the type of crash, and the number of vehicles
involved.
IDENTIFYING RURAL ROAD HOTSPOTS
Choosing the problematic rural locations for specific study required the development of a
method for identifying problem areas or hotspots. The first attempt at doing this made use of the
point density tool provided in the Environmental Systems Research Institute‘s (ESRI) ArcGIS
Desktop software. The latitude and longitude from the VDOT crash tables were plotted in
ArcGIS and the densities of these crash locations were calculated using the point density tool.
The initial results of using this tool made it difficult to identify rural hotspots because the
numbers of crashes in urban areas outnumbered the crashes in rural areas to such a large degree
that the differences in crash counts between individual rural areas was indistinguishable. This
process was refined by excluding the crash points within UAs and UCs or on interstate
highways. In this way, only the crashes that are on rural roads using the rural-road definition
described previously were used to calculate the crash densities of areas around the state. While
this method could show promise for identifying a jurisdiction with a crash density problem, it

4
identifies an area where crashes tend to cluster, and this could include multiple roads as well as
multiple road segments. For example, the method frequently identified areas where roads
intersected, particularly when several other roads were in the near vicinity. This result may not
clearly indicate whether or not a certain approach to the intersection, or a certain road, could be
considered the hotspot. It could also identify an area as a hotspot simply because many roads are
close together, even though the individual road segments have typical crash counts.
To more specifically identify a road segment with a crash problem, a different method was
needed. A spatial join was used to associate each crash with the nearest road segment. This was
done by joining the crashes in the 1999–2005 VDOT crash data with the nearest road segment in
VDOT‘s centerline road data. The result of the spatial join was a geospatial table in a
PostgreSQL database. By writing the result to a database table, a count of the crashes and crash
types on each road segment could be obtained through simple SQL queries.
Selecting Hotspots with Naturalistic Driving Data for Analysis
The 100 road segments with the most crashes were mapped and overlaid with 100-Car and Older
Driver breadcrumb data to find segments with large enough numbers of naturalistic driving
traversals to provide a sample size sufficient for analysis. A spatial join was used to associate the
breadcrumbs from the 100-Car and Older Driver datasets with the nearest (within 200 ft) road
segment with the top 100 crash counts. This result was also written to a geospatial table in a
PostgreSQL database. Using SQL queries, the number of traversals through each road segment
by each driver was used to identify the hotspots for further review by data reductionists. The
selection of the high-crash road segments process is shown in Figure 1. Another SQL query was
used to randomly choose trips through the chosen high-crash road segments. The identifying trip
File ID and frame numbers were given to the data reductionists in a database table for question
reduction as discussed below.

5
Spatial Join
VDOT
Crash
Locations
Census Bureau
Urbanized
Areas and
Urban Clusters
VDOT
Road
Centerline Data
Spatial Join
Crashes in
Rural Areas
Crashes
and
Associated
Road
Segments
Aggregate SQL
Query
Count of
Crashes on
Each Rural
Road
Segment
Rank Segments by
Crash Count
Top 100
Crash Rural
Road
Segments
100-Car and
Older Driver
Naturalistic
Driving Data
Breadcrumbs
Spatial Join and
Aggregate SQL
Query
Count of
Trips on Top
100 Crash
Rural Road
Segments
Choose Segments
with Multiple Trips
by Multiple Drivers
for Data Reduction
Figure 1. Diagram. Flow chart of high-crash road segment selection process.
Two high-crash rural roadway segments in northern Virginia and two additional high-crash rural
roadway segments in southwestern Virginia were chosen for analysis. All four segments had
crash counts in the top 100 of rural roadway segments in the state and had similar lengths. For
comparison, each of the four high-crash segments was matched up with a similar low-crash
segment. To control for traffic volumes, nearby segments on the same roadway were chosen.
This also helped find low-crash road segments with geometries similar to their high-crash
counterparts. In one case, the low-crash and the high-crash segments were contiguous segments.
In two cases, they were separated but near each other. In the final case, the high-crash segment
was the eastbound lanes of a divided roadway. The westbound lanes were on a low-crash
segment and were chosen for comparison to the high-crash eastbound lanes. The road segments
used in the analysis were on Prices Fork Road in Montgomery County (Figure 2), US-460 in
Giles County (Figure 3), VA-28 in Prince William County (Figure 4), and VA-7 in Loudoun
County (Figure 5).

6
Figure 2. Aerial Image. Prices Fork Road contiguous high-crash (red) and low-crash (blue)
road segments. (Source: www.bing.com, 2010)
The high-crash segment of Prices Fork Road is a two-lane road with no shoulder and several
horizontal and vertical curves. The segment has center and side lane markings. There are a
number of side roads and driveways (gravel and paved) that branch from the road segment. The
road segment is generally surrounded by trees and steep hillsides with a few homes and small
businesses. The low-crash segment is very similar to the high-crash segment, but with more
straight driving and not as many steep hillsides. The high-crash and low-crash segments are
contiguous segments and are shown in the aerial image in Figure 2.

7
Figure 3. Aerial Images. US-460 separated high-crash (red) and low-crash (blue) road
segments. (Source: www.bing.com, 2010)
The high-crash segment of US-460 is a section of the westbound lanes where US-460 is a
divided highway with two lanes traveling in each direction. There are several un-signalized
intersections throughout the road segment. There is a solid lane marking on the right side of the
right lane and the left side of the left lane with a dashed line dividing the two lanes. There is a
shoulder to the right of the right lane. Some parts of the road segment are surrounded by trees
and hills, while other parts have an open view and homes or small businesses. The low-crash
segment of US-460 is similar to the high-crash segment. The low-crash segment has more open
views and fewer intersections. The traffic on the low-crash segment is also traveling in a
primarily westbound direction away from the Blacksburg UA. The high-crash and low-crash
segments are separated segments, but are near each other. They are shown in the aerial images in
Figure 3.

8
Figure 4. Aerial Images. VA-28 separated high-crash (red) and low-crash (blue) road
segments. (Source: www.bing.com, 2010)
The high-crash segment of VA-28 is a two-lane road with a single solid line on each edge. The
road is partially divided by double yellow lines, dashed lines, mixed dash and solid, and mixed
solid and dash. The roadway is surrounded at times by trees but includes some sections with
open views. The road segment is mostly straight driving with one traffic signal toward the end
and some un-signaled intersections throughout the segment. There are some homes and
driveways off of the road. The low-crash segment is very similar to the high-crash segment with
more trees surrounding the roadway and a shoulder for most of the roadway. The high-crash and
low-crash segments are separated, but are near each other. They are shown in the aerial images in
Figure 4.

9
Figure 5. Aerial Image. VA-7 Opposing Direction High-Crash (Red) and Low-Crash (Blue)
Road Segments. (Source: www.bing.com, 2010)
The high-crash segment of VA-7, shown in red in Figure 5, is one side of a divided highway with
two lanes traveling in the eastbound direction. There is an on-ramp at the beginning and at the
end of the segment. There is a solid line on the left side of the left lane and one on the right side
of the right lane. The two lanes are separated by a dashed line. There is a shoulder to the right of
the right lane. The road segment is mostly straight driving with some wide turns and short trees
along the road, but has an open view for the most part. The low-risk road segment parallels the
high-crash segment, containing the westbound lanes. This segment is almost identical to the
high-crash segment. Note that the high-crash and low-crash segments are both on a bypass
section of VA-7. A portion of a business loop of VA-7 can also be seen in Figure 5 splitting from
the bypass road segments.
A count of the crash types was calculated for each of the high-crash and low-crash road segments
by using an aggregate SQL query on the geospatial table created from the spatial join of the
VDOT crash tables and the VDOT centerline data. The graph of this result is shown in Figure 6.
The terms in Figure 6 are from VDOT‘s crash tables. A non-collision crash is a crash where the
vehicle runs off the road and does not collide with another object.

10
Figure 6. Chart. Crash type counts per road segment.
IDENTIFYING INTERSECTION HOTSPOTS
The process of retrieving intersection traversals for evaluation in this study followed a two-stage
process in which the first stage was to identify intersections of interest, and the second stage was
to select individual instances of drivers in the naturalistic data passing through the selected
intersections.
Intersection Selection
The selection of intersections of interest was based on the number and types of crashes reported
by VDOT and the coverage of the 100-Car dataset at these intersections. The 100-Car data were
used in the intersection analysis because more of the intersection hotspots were in northern
Virginia where the 100-Car data are more extensive. VDOT provided a listing of crashes for the
years 2005 through 2007 at approximately 6,000 intersections, along with a ranking for each of
the intersections based on the total number of fatal or injury crashes over this three-year period.
ArcMap was used to create 200-ft buffers around each intersection‘s latitude-longitude pairing
and to identify which of the 100-Car trips passed through the intersection. Summary measures

11
were calculated for each intersection to estimate how many usable 100-Car trips passed through
the intersection, how many distinct drivers passed through the intersection, and the largest
contribution that a single driver made toward the total number of traversals.
High-Crash Intersections
Focus for selecting high-crash intersections was restricted to the 15 intersections with the largest
number of fatal or injury crashes in the 2005 through 2007 timeframe. Table 1 below provides a
listing of the summary measures relevant to high-crash intersection selection.
Table 1. Summary measures used in selection of high-crash intersections. Gray shading
indicates high-crash intersections used in analysis.
Fatal / Injury
Rank
(frequency)
Node
Number
Fatal /
Injury
Crash
Count
Number
100-Car
Trips
Number
Distinct
Drivers
Percentage of
Largest
Participant
Contribution
Fatal / Injury
Percentage of
Total Crashes
1 276819 70 649 39 36.52 63.64
2 547483 67 295 23 31.53 56.30
3 264119 62 157 35 13.38 61.39
3 722678 62 423 20 64.54 50.00
5 546653 61 494 17 79.35 95.31
6 278648 60 456 30 53.73 50.00
7 703414 59 166 9 74.70 86.76
8 263375 57 1260 56 24.37 60.00
8 265204 57 185 21 48.65 63.33
10 263249 56 461 45 13.88 41.18
10 263290 56 436 34 22.25 61.54
12 264849 55 408 38 32.11 39.01
13 263347 54 636 31 43.08 65.06
14 263090 51 249 25 36.14 83.61
15 277764 48 627 30 29.51 77.42
It was determined that a single participant should not contribute more than 30% of the total
observed intersection crossings in the 100-Car data and that fatal and injury crashes should
account for at least 60% of the total crashes reported at the intersection. Based upon these
criteria, the large number of 100-Car trips and relatively large number of distinct drivers
observed, the following intersections were selected: Braddock Rd at Backlick Rd (node 263290)
and Lee Hwy at Waples Mill Rd and Shirley Gate Rd (277764). Figure 7 and Figure 8 provide
aerial imagery of the selected intersections.

12
Figure 7. Aerial Image. Braddock Rd at Backlick Rd (node 263290). This intersection
served as a high-crash intersection in the analysis. (Source: www.bing.com, 2010)

13
Figure 8. Aerial Image. Lee Hwy at Waples Mill Rd and Shirley Gate Rd (node 277764).
This intersection served as a high-crash intersection in the analysis. (Source:
www.bing.com, 2010)
Low-Crash Intersections
In order to provide a normative comparison for the high-crash intersections, low-crash
intersections were identified. Although traffic density measures such as average annual daily
traffic (AADT) were not explicitly used in the normative intersection selection, efforts were
made to select intersections comparable to the high-crash intersections. The selection criteria for
low-crash intersections included the following: total fatal or injury crashes at low-crash
candidate intersections do not exceed 50% of the high-crash intersection total count; similar
geometry and curvature on approach legs; a single participant does not contribute more than 30%
of the total observed intersection crossings in the naturalistic driving data; a large number of
100-Car trips; and a relatively large number of distinct drivers. Based on these criteria, the
following intersections were selected as low-crash intersections: Waxpool Rd at Farmwell Rd
(713920) and Balls Ford Rd at Sudley Rd (546133). Table 2 contains the summary measures
used in selecting a low-crash intersection.

14
Table 2. Summary measures used in selection of low-crash intersections.
Fatal / Injury
Rank (frequency)
Node
Number
Fatal /
Injury
Crash
Count
Number
of 100-
Car
Trips
Number
of
Distinct
Drivers
Percentage of
Largest
Participant
Contribution
Fatal / Injury
Percentage of
Total Crashes
189 546133 20 1373 74 29.78 32.78
170 713920 21 1497 30 26.11 33.87
It can been seen in Table 1 and Table 2 that, although the low-crash intersections have a number
of fatal or injury crashes, these numbers are significantly less than those for the high-crash
intersections. Figure 9 and Figure 10 provide aerial imagery of the selected low-crash
intersections.
Figure 9. Aerial Image and Map. Waxpool Rd. at Farmwell Rd (node 713920). This
intersection served as a low-crash intersection in the analysis. (Source: www.bing.com,
2010)

15
Figure 10. Aerial Image. Balls Ford Rd at Sudley Rd. This intersection served as a low-
crash intersection during analysis. (Source: www.bing.com, 2010)
The graphs in Figure 11 and Figure 12 provide a breakdown of the crash types reported at each
location for the years 1999 through 2005. Earlier (Figure 6), raw counts of crashes had been used
to identify road segments with high crashes. Percentages were used here to compare crash types
between intersections. The high-crash intersections had been previously identified by VDOT
using raw counts.

16
Figure 11. Chart. Crash types reported at two intersections between the years 1999 and
2005.

17
Figure 12. Chart. Crash types reported at two intersections between the years 1999 and
2005.
Epoch Selection
The process of selecting individual intersection traversals for inclusion in the analysis was
straightforward and simple. Based on previous reduction efforts, files with undesirable attributes
(such as obstructed video views) were excluded from consideration. A random sample of 120
files per intersection node were drawn from the remaining files and presented to video analysts
for video validation and reduction.
VIDEO REDUCTION
Following the identification of 100-Car files with traversals through roadway segments or
intersections of interest, video analysis was completed. This video analysis, also referred to as
video reduction, was completed in order to collect information about the driving environment,
driver states (e.g., inattentive or impaired), driver behavior, and roadway infrastructure elements.
Trained video analysts completed the video reduction in secured computing labs using VTTI

18
proprietary software. The following sections briefly describe the different types of video analysis
completed, protocol development, and analyst training.
Reductionist Training
As the video reductionists employed in this task were quite experienced, training needs were
minimal. Training consisted primarily of familiarizing reductionists with the objectives of the
research task, discussing differences in video fidelity between the datasets, and reviewing the
reduction protocol. Although certain questions were only applicable to roadway segments or
intersections, there was one protocol provided for the video reduction. Aspects of this reduction
task that likely differed from previous research efforts were emphasized during the review of the
reduction protocol. After meeting with a researcher for the brief training session, reductionists
were instructed to read and familiarize themselves with the reduction protocol prior to beginning
reduction. Questions encountered during reduction were addressed to a researcher or the
reduction manager.
Event Validation
The first step in the reduction process was to determine if a trip that had been labeled as passing
along a roadway or intersection was, in fact, of interest. As can occasionally happen with
naturalistic data collection, there are times at which the video quality does not allow for reliable
video analysis. In addition, the GPS measures collected by the instrumentation package are at
times not amenable to accurate geospatial processing, resulting in trips that seem too short or
long for a particular road segment. In such cases, the reductionist does not complete the video
analysis and the trip is excluded from further analysis. As is mentioned in the section describing
trip selection, additional trips are sampled to account for the possibility of trips being discarded
due to unusable data.
Question Reduction
The question reduction was a detailed analysis that sought to address several factors relevant to
the traversal. Questions in the reduction were grouped according to the factor being addressed;
for example: video quality, driving environment, driver states (e.g., inattentive or impaired),
driver behavior, and roadway infrastructure. To the extent possible, questions included in this
reduction were based upon reductions completed in previous studies. This provided the
opportunity to make use of questions that have been successfully used in previous research
efforts and with which the reductionists are familiar. The question reduction protocol is listed in
the appendix.
Spot-Checking
The primary mechanism used to encourage consistent responses across reductionists was
frequent spot-checking. Each reductionist would spend a small amount of time during each shift
reviewing the work of another reductionist. Discrepancies between the reductionists were noted
and the reductionists would discuss reduction differences in order to converge on consistent use
of reduction values.

19
ANALYSIS METHODS
The focus of the analyses conducted in this study was on simple comparisons between high- and
low-crash road segments across a number of measures. These comparisons were conducted at
two different levels of aggregation, the first of which disregarded the specific roadway but
simply made comparisons between high-crash and low-crash segments. For example, the VA-7
and VA-28 segments were simply collapsed into high- and low-crash groupings. The second
comparison matched each segment within the roadway from which it was selected. For example,
the VA-7 high-crash segment was compared only to the VA-7 low-crash segment. Table 3
displays the number of trips used in the analysis for each of the levels of aggregation.
Table 3. Number of trips analyzed per roadway and segment type.
Roadway Naturalistic
Dataset Segment Type
Number of
Trips
VA-7 100-Car High-crash 81
VA-7 100-Car Low-crash 94
VA-28 100-Car High-crash 56
VA-28 100-Car Low-crash 89
US-460 Older Driver High-crash 48
US-460 Older Driver Low-crash 38
Prices Fork Rd Older Driver High-crash 61
Prices Fork Rd Older Driver Low-crash 95
Braddock & Backlick 100-Car High-crash 91
Lee Hwy & Waples Mill 100-Car High-crash 107
Waxpool & Farmwell 100-Car Low-crash 60
Balls Ford & Sudley 100-Car Low-crash 102
As can be seen in Table 3, although sampling efforts sought to have at least 100 trips for each
roadway and segment type, this could not be met in all cases. In particular, US-460 has a low
number of trips possible, resulting in an unpowered analysis.
The measures used in analysis were grouped into those that address roadway infrastructure, and
those that address driver states and behaviors. Driver state and behavior variables that were
analyzed include the following: secondary task engagement; driver impairment; unsafe, illegal,
or reckless actions; hand placement on the steering wheel; and seatbelt use. The roadway
infrastructure variables considered include the following: roadway elements such as sight
distance or roadway delineation; visual obstructions; traffic density; and lighting conditions.
As can be seen in Figure 13, these categories align well with the most frequent major crash
factors reported in the VDOT crash tables.
20
Figure 13. Chart. Major crash factors as reported in VDOT crash tables.

21
CHAPTER 3. RESULTS
DRIVER BEHAVIORS
This section describes the frequency of various driver behaviors, such as secondary task
engagement, observed in each of the high- and low-crash road segments. Findings are reported
separately for the 100-Car and Older Driver datasets.
Secondary Tasks
Table 4 through Table 9 provide comparisons of the crash segments using distraction-related
measures. The comparisons include measures related to number and duration of tasks, as well as
types of tasks. Table 4 focuses on the 100-Car dataset while Table 5 focuses on older drivers.
Table 6 through Table 9 provide distraction comparisons within individual road segments.
Table 4. 100-Car aggregate 95% confidence intervals.
Distraction Type
Low-crash
Mean or
Proportion
High-crash
Mean or
Proportion
Difference Lower
Bound
Upper
Bound
Segment with
Higher
Distraction
Involvement
Number of secondary tasks per
traversal 3.4200 3.0000 0.4208 0.0461 0.7954 Low-crash
Length of longest duration
secondary task (sec) 0.3318 0.3453 0.0135 -0.0741 0.1012
Not
significant
Number of distinct secondary
tasks per traversal 2.3443 2.1387 0.2056 -0.0469 0.4581
Not
significant
Proportion of traversals with
passenger distraction 0.4809 0.4818 0.0009 -0.1098 0.1115
Not
significant
Proportion of traversals with
cognitive distraction 0.1366 0.1314 0.0052 -0.0701 0.0806
Not
significant
Proportion of traversals with
object in vehicle distraction 0.3169 0.1825 0.1345 0.0410 0.2279 Low-crash
Proportion of traversals with
electronic device distraction 0.0383 0.1095 0.0712 0.0120 0.1305 High-crash
Proportion of traversals with
vehicle controls distraction 0.3552 0.3796 0.0244 -0.0825 0.1312
Not
significant
Proportion of traversals with
external distraction 0.4973 0.1971 0.3002 0.2018 0.3986 Low-crash
Proportion of traversals with
eating distraction 0.5082 0.5912 0.0830 -0.0266 0.1927
Not
significant
Proportion of traversals with
other distraction 0.0109 0.0657 0.0548 0.0106 0.0989 High-crash

22
Table 5. Older Driver aggregate 95% confidence intervals.
Distraction Type
Low-crash
Mean or
Proportion
High-crash
Mean or
Proportion
Difference Lower
Bound
Upper
Bound
Segment with
Higher
Distraction
Involvement
Number of secondary tasks per
traversal 3.57 3.44 0.1294 -0.3108 0.57 Not significant
Length of longest duration
secondary task (sec) 0.1232 0.1283 0.0051 -0.0540 0.0642 Not significant
Number of distinct secondary
tasks per traversal 2.1053 2.0183 0.0869 -0.1726 0.3464 Not significant
Proportion of traversals with
passenger distraction 0.4586 0.3945 0.0642 -0.0607 0.1890 Not significant
Proportion of traversals with
cognitive distraction 0.0226 0.0459 0.0233 -0.0234 0.0700 Not significant
Proportion of traversals with
object in vehicle distraction 0.2782 0.2477 0.0305 -0.0807 0.1417 Not significant
Proportion of traversals with
electronic device distraction NA NA NA NA NA Not significant
Proportion of traversals with
vehicle controls distraction 0.2105 0.2018 0.0087 -0.0937 0.1111 Not significant
Proportion of traversals with
external distraction 0.8045 0.6789 0.1256 0.0150 0.2362 Low-crash
Proportion of traversals with
eating distraction 0.3308 0.3761 0.0453 -0.0758 0.1664 Not significant
Proportion of traversals with
other distraction NA 0.0734 NA NA NA High-crash

23
Table 6. VA-7 95% confidence intervals.
Distraction Type
Low-crash
Mean or
Proportion
High-crash
Mean or
Proportion
Difference Lower
Bound
Upper
Bound
Segment with
Higher
Distraction
Involvement
Number of secondary tasks per
traversal 2.6 2.53 0.0649 -0.4317 0.5614 Not significant
Length of longest duration
secondary task (sec) 0.329 0.353 0.024 -0.1082 0.1562 Not significant
Number of distinct secondary
tasks per traversal 1.89 1.77 0.128 -0.1975 0.4539 Not significant
Proportion of traversals with
passenger distraction 0.3723 0.4198 0.0474 -0.0979 0.1927 Not significant
Proportion of traversals with
cognitive distraction 0.1702 0.1235 0.0468 -0.0577 0.1512 Not significant
Proportion of traversals with
object in vehicle distraction 0.1596 0.0988 0.0608 -0.0377 0.1593 Not significant
Proportion of traversals with
electronic device distraction 0.0319 0.0741 0.0422 -0.0250 0.1094 Not significant
Proportion of traversals with
vehicle controls distraction 0.4681 0.4198 0.0483 -0.0991 0.1957 Not significant
Proportion of traversals with
external distraction 0.2128 0.0988 0.1140 0.0088 0.2192 Low-crash
Proportion of traversals with
eating distraction 0.4574 0.5062 0.0487 -0.0996 0.1970 Not significant
Proportion of traversals with
other distraction 0.0213 0.0247 0.0034 -0.0412 0.0481 Not significant

24
Table 7. VA-28 95% confidence intervals.
Distraction Type
Low-crash
Mean or
Proportion
High-crash
Mean or
Proportion
Difference Lower
Bound
Upper
Bound
Segment with
Higher
Distraction
Involvement
Number of secondary tasks per
traversal 4.29 3.68 0.6136 0.1468 1.08 Low-crash
Length of longest duration
secondary task (sec) 0.3340 0.3370 0.0030 -0.1134 0.1193 Not significant
Number of distinct secondary
tasks per traversal 2.8200 2.6800 0.1417 -0.1948 0.4782 Not significant
Proportion of traversals with
passenger distraction 0.5955 0.5714 0.0241 -0.1408 0.1890 Not significant
Proportion of traversals with
cognitive distraction 0.1011 0.1429 0.0417 -0.0693 0.1527 Not significant
Proportion of traversals with
object in vehicle distraction 0.4831 0.3036 0.1796 0.0206 0.3386 Low-crash
Proportion of traversals with
electronic device distraction 0.0449 0.1607 0.1158 0.0104 0.2212 High-crash
Proportion of traversals with
vehicle controls distraction 0.2360 0.3214 0.0855 -0.0653 0.2363 Not significant
Proportion of traversals with
external distraction 0.7978 0.3393 0.4585 0.3090 0.6079 Low-crash
Proportion of traversals with
eating distraction 0.5618 0.7143 0.1525 -0.0044 0.3094 Not significant
Proportion of traversals with
other distraction NA 0.1250 NA NA NA High-crash

25
Table 8. US-460 95% confidence intervals.
Distraction Type
Low-crash
Mean or
Proportion
High-crash
Mean or
Proportion
Difference Lower
Bound
Upper
Bound
Segment with
Higher
Distraction
Involvement
Number of secondary tasks per
traversal 4.6 4.73 0.1239 -0.2604 0.5082 Not significant
Length of longest duration
secondary task (sec) 0.2144 0.1387 0.0757 -0.0395 0.1909 Not significant
Number of distinct secondary
tasks per traversal 2.68 2.43 0.2467 -0.1166 0.6101 Not significant
Proportion of traversals with
passenger distraction 0.5263 0.3750 0.1513 -0.0584 0.3610 Not significant
Proportion of traversals with
cognitive distraction 0.0263 0.0208 0.0055 -0.0595 0.0705 Not significant
Proportion of traversals with
object in vehicle distraction 0.3947 0.4167 0.0219 -0.1869 0.2308 Not significant
Proportion of traversals with
electronic device distraction NA NA NA NA NA NA
Proportion of traversals with
vehicle controls distraction 0.2632 0.1875 0.0757 -0.1027 0.2540 Not significant
Proportion of traversals with
external distraction 0.9737 0.9167 0.0570 -0.0363 0.1503 Not significant
Proportion of traversals with
eating distraction 0.5000 0.4792 0.0208 -0.1919 0.2335 Not significant
Proportion of traversals with
other distraction NA 0.0417 NA NA NA NA
26
Table 9. Prices Fork Road 95% confidence intervals.
Distraction Type
Low-crash
Mean or
Proportion
High-crash
Mean or
Proportion
Difference Lower
Bound
Upper
Bound
Segment with
Higher
Distraction
Involvement
Number of secondary tasks per
traversal 3.16 2.44 0.7258 0.176 1.275 Low-crash
Length of longest duration
secondary task (sec) 0.0826 0.118 0.0354 0.394 0.1102 High-crash
Number of distinct secondary
tasks per traversal 2 2.02 0.0196 -0.2697 0.3089 Not significant
Proportion of traversals with
passenger distraction 0.4316 0.4098 0.0217 -0.1369 0.1803 Not significant
Proportion of traversals with
cognitive distraction 0.0211 0.0656 0.0445 -0.0240 0.1130 Not significant
Proportion of traversals with
object in vehicle distraction 0.2316 0.1148 0.1168 0.0002 0.2334 Low-crash
Proportion of traversals with
electronic device distraction NA NA NA NA NA NA
Proportion of traversals with
vehicle controls distraction 0.1895 0.2131 0.0236 -0.1059 0.1531 Not significant
Proportion of traversals with
external distraction 0.7368 0.4918 0.2450 0.0915 0.3986 Low-crash
Proportion of traversals with
eating distraction 0.2632 0.2951 0.0319 -0.1128 0.1766 Not significant
Proportion of traversals with
other distraction NA 0.0984 NA NA NA High-crash
In fact, no significant differences were observed in any category between the high- and low-
crash segments on US-460 and only a single secondary task was significant for the VA-7
roadway. This would seem to indicate that the differences observed in the aggregate comparisons
are being driven by the VA-28 and Prices Fork roadways.
It is interesting to note that in cases in which differences were observed it is difficult to discern
generally applicable trends. For example, in Table 4 through Table 9 the direction of
difference—whether the low- or high-crash segment proportion is larger—changes across the
different types of secondary tasks within a road segment. However, the direction of difference
was consistent across roadway types. For example, the external distraction secondary task was
found to be significant on VA-7, VA-28, and Prices Fork, and in each case the proportion was
higher on the low-crash segment.
The number of observed secondary tasks differs significantly between the low-crash and high-
crash segments on the VA-28 and Prices Fork roadways, with the direction of difference toward
the low-crash segment. It is interesting to note that on the Prices Fork segments, although drivers
were engaged in more secondary tasks on the low-crash segment, the distraction-related glances
with the longest duration occurred on the high-risk segment.

27
Some of the results are notable for lack of an available comparison or a complete absence of
data. On VA-28, US-460, and Prices Fork Rd., the catchall ‗other distraction‘ category was only
observed on the high-risk segments. No electronic device distractions were noted on any of the
Older Driver segments.
SUMMARY OF ANALYSIS
As noted in the descriptions of many of the graphs and as can be noted in Table 4 through Table
9 (which present secondary task confidence interval estimates), few significant differences were
observed between the high-crash and low-crash segments, with the exception of a handful of
secondary tasks. Despite not finding many significant differences, the simple comparison
analysis revealed several potentially interesting findings, and these are discussed in the next
chapter.


29
CHAPTER 4. DISCUSSION AND CONCLUSIONS
The objectives of this study were twofold. The first was to identify roadway infrastructure
differences between high-crash and low-crash intersections and rural road segments that may
contribute to the higher crash counts. The second was to determine if drivers exhibit different
behavior when traversing a high-crash intersection or rural road segment as compared to when
traversing a low-crash intersection or rural road segment.
The lack of many significant differences across the road segments for both 100-Car and Older
Driver may be due to several different causes. One compelling possibility is that drivers simply
may not recognize that they have transitioned from a low-crash to a high-crash road segment.
That is, cues from either the infrastructure or driving environment are not sufficient or urgent
enough to prompt drivers to significantly alter behavior. Along a similar vein, it is also possible
that the low-crash segments that were selected for analysis are too similar to the high-crash
segments and do not capture drivers transitioning between different types of road segments. The
selection method for low-risk segments was based on the number of crashes reported on various
road segments relative to the reported number of crashes on the high-risk segments. It is possible
that the relative basis for selection was not sufficient to pair roadways with different
characteristics. As always, a lack of significant differences could be due to a lack of statistical
power due to using a small number of observations. Unlike controlled experimental comparisons,
insufficient power can be a problem with naturalistic data due to the resources required to locate
events of interest and complete the video reduction process.
The fact that consistent patterns are not apparent due to changing direction of difference may
indicate that generally identifying causes for crashes in rural road hotspots may be very
dependent on the specific location of interest. If this is the case, this may point to the need for
some form of infrastructure-based data collection that is capable of collecting all traversals
through a road segment for a specified period of time. This form of collection would allow for
customized solutions for each problematic road segment.
FUTURE WORK
While the outcome of this method has not revealed specific differences between driving behavior
and infrastructure in high- and low-crash locations, some possibilities have been identified that
could be pursued in the future.
Of particular interest is further look into the ability of drivers to identify high-crash intersections
and roadway segments. A study to examine the cues that drivers use to identify hotspots, or
areas that require different levels of attention or driving techniques could be pursued by
examining road segments with similar geometry and traffic patterns but with lower crash rates.
What cues are available to drivers that encourage successful and safe traversal in these areas?
Are some of the warnings, such as signage, more or less successful than others? Are there other
cues that could be provided that are more successful than those that are currently in use?
Also of interest is a more detailed evaluation of the different types of secondary tasks the
different cohorts engage in. For example, no electronic device secondary tasks were observed

30
among the older drivers but this was found to be significant on one of the 100-Car segments.
Older drivers did show higher-than-expected rates of secondary task engagement, particularly in
regard to external distraction and interacting with an object in the vehicle.
As with most safety-related events, problems arise infrequently, when a number of risk-
increasing conditions occur at the same time. When aggregating many traversals, the
infrequently occurring alignment of conditions into a high-risk situation may be obscured by the
larger number of routine situations. For this reason, it may be of value to employ a method that
focuses on the sequence of events occurring within the traversals. This approach might
investigate, for example, how drivers increase or decrease focus on the driving task when
approaching a segment or within a segment. Do numbers of distractions increase or decrease?
Within each traversal, what is the rate with which primary task demands, such as braking and
negotiating turns, arise?
In the course of the current work, the question of whether impairment influences route selection
was raised. For example, do drivers who are drowsy or under the influence of alcohol tend to
favor rural roads, interstates, or local roads? If so, is this different from the driver‘s typical route
selection? Geospatial tools and naturalistic driving data like those used in this effort would be
useful in this additional work.
Additional research projects that are of interest include selecting different control segments to
compare to the high-crash segments to evaluate the extent to which that control segment
selection has on the significance of differences. Other possibilities include increasing the sample
size at currently selected locations or selecting a small number of files and watching for
transition periods in which the drivers appear to alter behavior and determine if transitional cues
can be identified.
LIMITATIONS OF THE STUDY
As with any research endeavor, there are limitations to the current study. Although naturalistic
data collection provides valuable insight into many research questions of interest, it is
constrained to the participants in the study and to the locations that the participants traversed.
The primary limitation is that this study was restricted to eight roadway segments and a limited
number of trips were observed. In addition, the simple comparisons that were used did not
explicitly take into account participant-specific differences that may exist. These limitations
should be kept in mind when drawing general conclusions from these results.

31
APPENDIX A.
VIDEO REDUCTION
Research Task
The purpose of this research effort is to determine if behavioral differences exist when a
participant is traversing different roadway types. The following roadway types are under
consideration: urban intersections and rural roadway segments.
Reduction Task
Each epoch included in this reduction will consist of a single traversal across a predetermined
roadway segment. The reduction questions are grouped as follows:
1. questions regarding event spot-checking and video quality;
2. questions that use entry to roadway segment (i.e., the first sync of reduction epoch) for
timing information;
3. questions regarding the participant (behavior, impairment, driving style) and the driving
environment (lighting, weather, visual obstructions);
4. questions relevant only to intersection traversals.
In order to capture participant actions and behavior, multiple opportunities are provided for
recording values for some of the variables. In the event that multiple values are recorded for a
variable there is no need to attempt to rank the importance of the multiple values. For example,
if a participant is adjusting radio controls and eating a sandwich there is no need to attempt to
decide which is having a larger impact on driving performance.
The remainder of this manual lists the questions, responses, and answer guides for this question
reduction. It is strongly recommended that you familiarize yourself with the questions and
responses prior to beginning reduction.
Reduction Questions
1. Spot checking – Has this event been spot checked?
Yes
No
2. Video quality – forward view, face view, over the shoulder view, rearward view –
rear windshield, rearward view – passenger window
The purpose of the video quality questions is to determine if reduction should
continue on the current epoch and to provide an indication of video quality for a
given file.
If the forward view, face view, or over-the-shoulder view video is missing or of
unacceptable quality (including severe obstruction or misalignment) skip the current
epoch and proceed to the next epoch. These views, at minimum, should be marked as
―present and usable‖.

32
If one or both of the rearward views are less than ―present and usable‖ but the other
views are acceptable, complete the event as best as possible.
Present and usable – the video view is present with good video quality and free
of obstructions and misalignment. For the face view, this means that both eyes
and mouth are visible for at least 75% of the event.
Present with poor video quality – the video view is present but with degradation
of video quality.
Present but obscured – the video view is present but obscured. Obstructions
might include the sun visor, a hat, or lighting conditions.
Present but misaligned – the video view is present but the camera is not properly
aligned.
Not present – the video view is not present.
3. Lane of travel – what was the participant lane of travel on entry to roadway
segment?
1 thru 8
o The reference point for the lane of travel variable is the shoulder to the right
of the vehicle. The lanes are number from right to left, 1 – 8.
4. [roadway segment only] Other vehicles – how many other vehicles were present
around the subject during roadway traversal?
Only consider other vehicles that are close enough to restrict the participant‘s ability
to maneuver.
Count each vehicle a single time.
Only answer this question for roadway segments; separate questions exist for other
vehicles during intersection traversals.
5. Infrastructure – Which of the following roadway elements seemed to impact the
participant’s ability to navigate the roadway segment?
None
Roadway alignment – maneuver is difficult for the driver due to the geometry of the
roadway or intersection
o ex. Narrow roadway, sharp turn, short merge lane
Roadway sight distance – the driver is unable to see an adequate distance ahead
Traffic control device – lack of, positioning of, or poor visibility of traffic control
devices
Roadway delineation – poor visibility or positioning of roadway or lane borders
o ex. Faded paint on lane lines
Weather, visibility – roadway is not designed to accommodate certain weather
conditions and thus weather conditions influence driver capabilities
o Ex. Lane markings are difficult to distinguish on wet pavement
Other
o This category would include infrastructure elements such as construction
barrels or cones

33
Unable to determine
6. Visual obstructions – Which of the following best describes any visual obstructions
that were present during the roadway traversal?
No obstruction - No visual obstructions for the driver were obvious
Rain, snow, fog, smoke, sand, dust - Surrounding atmosphere included rain, snow,
fog, smoke, and/or dust, which decreased visibility
o If it is not raining or snowing, but rain or snow is on the windshield
obstructing the view, use the category "Broken or improperly cleaned
windshield"/If window is foggy (no fog in the air), use category "Inadequate
defrost or defog system" or "Broken or improperly cleaned windshield"
Reflected glare - Glare reflected off of the vehicle or other exterior objects decreased
visibility
Sunlight glare - Direct bright sunlight decreased visibility
Headlights - Headlights of other vehicle(s) decreased visibility
Curve or hill - The presence of a curve or hill in the field of view decreased visibility
Building, billboard, or other roadway infrastructure design features - The
presence of a man-made structure in the field of view decreased visibility includes
sign, embankment, building
Trees, crops, vegetation - The presence of trees, crops, or vegetation in the field of
view decreased visibility
Moving vehicle (with or without load) - The presence of a vehicle in motion on the
trafficway (with or without a load) in the field of view decreased visibility
Parked vehicle - The presence of a vehicle not in motion under its own accord in the
field of view decreased visibility
o Includes vehicles in-transport and not in-transport
Splash or spray of passing vehicle - A splash or spray of water, snow, sand, etc.
from a passing vehicle in the field of view decreased visibility
Inadequate defrost or defog system - The presence of frost or fog on the windshield
due to an inadequate defrost/defog system decreased visibility (defrost/defog system
was in use)
o If the defrost/defog system was not being used, use category "Broken or
improperly cleaned windshield"
Inadequate roadway lighting system - Inadequate lighting of the roadway (other
than lighting provided by vehicles) decreased visibility
Inadequate vehicle headlamps - An inadequate exterior lighting system of the
driver's vehicle (malfunctioning or turned off) decreased visibility
o Includes headlights, fog lights, but not lighting systems of other vehicles
Obstruction interior to vehicle - An interior vehicle feature (other than head
restraints) decreased visibility
o Includes interior mirrors
Mirrors - Exterior mirrors on the vehicle in the field of view decreased visibility
Broken or improperly cleaned windshield - The windshield of the vehicle was
broken or otherwise disfigured, or was at least partially covered by some material

34
such as dirt, rain, or snow, which decreased visibility (no attempt to clean the
windshield had been made)
o Includes not utilizing the defrost/defog system or wipers
Vision obscured - no details - The vision of the driver was obviously obscured, but
the source of the impediment cannot be determined
Other obstruction - A known impediment not listed in previous categories decreased
visibility
Unable to determine
7. Surface conditions – Which of the following best describes roadway conditions
during the roadway traversal?
Dry - There is no foreign material (rain, snow, oil, etc.) on the roadway (nothing on
the road to affect the driving task)
o A roadway made of sand or dirt would be coded "Dry" under dry conditions,
not "Other"
Wet -Roadway is completely or partially wet (not snowy, icy, muddy, or oily)
Icy - There is some amount of ice on the roadway, enough to affect the driving task
o If there is ice on the surface that affects the event, code as icy, regardless of
any other coexisting conditions
Snowy -There is some amount of snow or slush on the roadway, enough to affect the
driving task (no ice on the road in the area of interest)
o If other conditions are also present in the area affecting the event, choose the
first category from this list that is applicable: icy, snowy, oily, or muddy
Oily - There is some amount of oil, grease, or other slippery fluid on the roadway
enough to affect the driving task
o If the road is also icy (or icy and snowy) in the area affecting the event,
categorize as icy. If the road is also snowy, categorize as snowy.
Muddy -There is some amount of mud on the roadway, enough to affect the driving
task
o If other conditions (other than simply a wet road) are also present in the area
affecting the event, choose the first category from this list that is applicable:
icy, snowy, or oily
Other - There is some type of foreign substance on the road, not listed in previous
categories, enough to affect the driving task
o If the substance on the road can be driven over, but would affect the vehicle's
coefficient of friction, code as "other" road condition (material large or
harmful enough to necessitate maneuvering around it would be categorized as
an object or obstacle in the road)
Unable to determine
8. Traffic density – which of the following best describes traffic density during the
roadway traversal?
The traffic density variable is meant to assess the participant's ability to select their
own travel speed and maneuver between lanes of travel.
Level-of-service A: Free flow - Individual drivers are virtually unaffected by the
presence of others in the traffic stream.

35
o Freedom to select desired speeds and to maneuver within the traffic stream is
extremely high. The general level of comfort and convenience provided to the
motorist, passenger, or pedestrian is excellent.
Level-of-service B: Flow with some restrictions - In the range of stable flow, but
the presence of other users in the traffic stream begins to be noticeable.
o Freedom to select desired speeds is relatively unaffected, but there is a slight
decline in the freedom to maneuver within the traffic stream from LOS A.
The level of comfort and convenience provided is somewhat less than at LOS
A, because the presence of others in the traffic stream begins to affect
individual behavior.
Level-of-service C: Stable flow, maneuverability and speed are more restricted -
In the range of stable flow, but marks the beginning of the range of flow in which the
operation of individual users becomes significantly affected by interactions with
others in the traffic stream.
o The selection of speed is now affected by the presence of others, and
maneuvering within the traffic stream requires substantial vigilance on the
part of the user. The general level of comfort and convenience declines
noticeably at this level.
Level-of-service D: Unstable flow - temporary restrictions substantially slow
driver - High-density, but stable flow.
o Speed and freedom to maneuver are severely restricted, and the driver or
pedestrian experiences a generally poor level of comfort and convenience.
Small increases in traffic flow will generally cause operational problems at
this level.
Level-of-service E: Flow is unstable, vehicles are unable to pass, temporary
stoppages, etc. - Operating conditions at or near the capacity level. All speeds are
reduced to a low, but relatively uniform value.
o Freedom to maneuver within the traffic stream is extremely difficult, and-it is
generally accomplished by forcing a vehicle or pedestrian to "give way" to
accommodate such maneuvers. Comfort and convenience levels are
extremely poor, and driver or pedestrian frustration is generally high.
Operations at this level are usually unstable, because small increases in flow
or minor perturbations within the traffic stream will cause breakdowns.
Level-of-service F: Forced traffic flow condition with low speeds and traffic
volumes that are below capacity. - Forced or breakdown flow.
o This condition exists wherever the amount of traffic approaching a point
exceeds the amount which can traverse the point. Queues form behind such
locations. Operations within the queue are characterized by stop-and-go
waves, and they are extremely unstable. Vehicles may progress at reasonable
speeds for several hundred feet or more, then be required to stop in a cyclic
fashion. Level-of-service F is used to describe the operating conditions within
the queue, as well as the point of the breakdown. It should be noted, however,
that in many cases operating conditions of vehicles or pedestrians discharged
from the queue may be quite good. Nevertheless, it is the point at which
arrival flow exceeds discharge flow, which causes the queue to form, and
level-of-service F is an appropriate designation for such points.

36
9. Lighting conditions – which of the following best describes lighting conditions
during the roadway traversal?
Dawn
Daylight
Dusk
Darkness, lighted – it is dark during roadway traversal but the roadway is lighted
Darkness, not lighted
Unable to determine
10. Weather conditions – which of the following best describes weather conditions
during the roadway traversal?
No adverse conditions
Fog
Mist
Raining
o Check for windshield wiper use
Snowing
Sleeting
Smoke, dust
Other
o Ex. smog, blowing sand, blowing snow, crosswind, hail
Unable to determine
11. Lane change – did the participant complete a lane change during the roadway
traversal?
Yes
No
Unable to determine
12. Hand placement – select the condition that exists during the majority of the road
segment
No hands on wheel
One or two hands on the wheel (appropriate placement)
Inappropriate hand placement (e.g., cross placement or awkward placement,
possibly due to secondary task engagement)
Unable to determine
13. Hand placement – did the participant have both hands off the wheel, inappropriate
hand placement, or both at any moment during the road segment?
No, neither condition occurred
Yes, no hands on wheel
Yes, inappropriate hand placement (e.g. cross placement or awkward placement,
possibly due to secondary task engagement)
Yes, both no hands and inappropriate hand placement

37
Unable to determine
14. Seatbelt use – was the participant wearing their seatbelt during the roadway
traversal?
Yes – the participant was wearing their seatbelt during the entire traversal.
o Acceptable seatbelt use includes lap and shoulder belt, lap only or
shoulder only
Partial – the participant was wearing their seatbelt during a portion of the
traversal.
o Acceptable seatbelt use includes lap and shoulder belt, lap only or
shoulder only
No – the participant was not wearing their seatbelt.
Unable to determine
15. Vehicle Speed – Which of the following best describes the vehicle speed during
roadway traversal?
Consider speed only when vehicle is in motion. Things to check:
i. Speed relative to other vehicles
ii. Speed and roadway navigation vs. other traffic
Driving at appropriate speed – Driver is traveling at a speed appropriate for traffic
and / or roadway conditions
Driving fast relative to other traffic – Vehicle is traveling significantly faster than
surrounding traffic
Driving slow relative to other traffic- Vehicle is traveling significantly slower than
surrounding traffic
Driving too fast (no surrounding traffic) – No other vehicles in traffic stream, but
subject seems to be traveling fast for the roadway segment
Driving too slow (no surrounding traffic) - No other vehicle in traffic stream, but
subject seems to be traveling slow for the roadway segment
Unable to determine
16. Driving behavior – Which of the following driving behaviors did the participant
exhibit during roadway traversal?
consider driving behaviors only when vehicle is in motion. Things to check:
i. Intersection crossings/adherence to signs/signals and turn signal usage
ii. Lane changes with proper turn signals and gaps
iii. Sudden maneuvers (steering, braking, etc.)
iv. General driver confidence
None
Illegal passing - Vehicle passes another vehicle in an unsafe or illegal manner (other
than on the right)
o Ex. passing across double line, going straight through turn lane
Passing on right - Vehicle passes another vehicle in the lane immediately to the right
of the other vehicle
o This variable is not applicable in heavy traffic

38
Other improper or unsafe passing -Vehicle passes another vehicle in a manner not
included in previous categories
o Ex. passing on two-lane road with limited sight distance or other vehicle
present
Cutting in, too close in front of other vehicle - Vehicle enters lane of another
vehicle too closely to the front of that vehicle
Cutting in, too close behind other vehicle - Vehicle enters lane of another vehicle
too closely to the back of that vehicle
Following too closely – vehicle is traveling at an unsafe distance (too close) behind
the lead vehicle
Did not see other vehicle during lane change or merge - Vehicle entered a lane or
merged into a lane without being aware of another vehicle close by, already traveling
in that lane
Driving in other vehicle's blind zone - Vehicle is traveling close to another vehicle
in such a way that the driver of the other vehicle is not able to see it
o Code when vehicle maintaining this position for at least five seconds
Aggressive driving, specific, directed menacing actions - Driver is driving in a
purposefully aggressive manner, with actions intended for a specific recipient
o Ex. exhibiting road rage
Reckless driving - Driver is driving in an aggressive manner not described in
previous categories
o Ex. reckless driving without directed menacing actions, such as excessive
speed, weaving in and out of traffic, tailgating
Wrong side of road, not overtaking - Vehicle is traveling on the wrong side of the
road with no intent of passing or overtaking another vehicle
Failed to signal, or improper signal - Vehicle failed to properly signal its intent,
either signaling incorrectly or not at all
o Note: this category is partially redundant with the categories "Failure to
signal, with other violations or unsafe actions" and "Failure to signal, without
other violations or unsafe actions"--use with planned maneuvers, not sudden
evasive maneuvers
Improper turn, wide right turn - Vehicle turned right from the travel path,
unnecessarily encroaching into the adjacent lane
Improper turn, cut corner on left - Vehicle turned left from the travel path,
unnecessarily encroaching into the adjacent lane
o Ex. cuts into adjacent lane or oncoming traffic
Improper turn, other – Vehicle turned left or right from the travel path in an unsafe
manner not described in previous categories
Making turn from wrong lane – vehicle turns left or right from a lane not intended
for making that turn
Improper start from parked position - Vehicle moved from a parked position
(vehicle was turned on and advanced from a fully stopped position) in an unsafe
manner
o Ex. did not check mirrors

39
Disregarded officer or watchman - Driver did not notice or obey an officer of the
law or watchman providing guidance in the driving task
o Ex. unaware or late to react
Stop sign violation, apparently did not see stop sign - Driver did not notice and
thus disobeyed a stop sign
o Ex. unaware or late to react
Stop sign violation, intentionally ran stop sign at speed - Driver saw a stop sign
but purposefully drove through the intersection at a speed greater than 15 mph
o Ex. purposefully ran stop sign without decelerating below a speed of 15 mph
Stop sign violation, "rolling stop" – Driver did not come to a complete stop at a
stop sign (speed was below 15 mph, but above 0 mph)
Other sign (e.g., Yield) violation, apparently did not see sign - Driver did not
notice and thus disobeyed a traffic sign (other than a stop sign)
Other sign (e.g., Yield) violation, intentionally disregarded - Driver saw a traffic
sign (other than a stop sign) but purposefully disobeyed that sign
Other sign violation - Driver disobeyed a traffic sign in a manner not described in
previous categories
Right-of-way error in relation to other vehicle or person, apparent recognition
failure - Driver made the incorrect decision regarding who had the right-of-way, his
own vehicle or another vehicle or pedestrian, due to a misunderstanding of the
situation
o Ex. did not see other vehicle
Right-of-way error in relation to other vehicle or person, apparent decision
failure - Driver made the incorrect decision regarding who had the right-of-way, his
own vehicle or another vehicle or pedestrian, due to improper analysis of the situation
o Ex. did see other vehicle prior to action but misjudged gap
Right-of-way error in relation to other vehicle or person, other or unknown
cause - Driver made incorrect decision regarding who had the right-of-way, his own
vehicle or another vehicle or pedestrian, for reasons not described in previous
categories
Sudden or improper braking - Vehicle braked suddenly or in an unsafe manner in
the roadway (but did not come to a complete stop as a result)
o If the sudden braking leads directly to stopping (speed indicator goes to zero),
code as "sudden or improper stopping on roadway"
Sudden or improper stopping on roadway - Vehicle stopped without ample
warning or in an unsafe manner in the roadway
o Ex. hard or late braking/code only when driver speed indicator goes to zero--
code "sudden or improper braking" otherwise.
o The only time to code braking and stopping for one event would be when the
braking doesn't lead directly to the stopping (subject brakes, then a bit later
has to suddenly stop).
Use of cruise control contributed to late braking - Driver delayed applying brake
pedal because the cruise control was activated, resulting in an unsafe situation
Failure to signal, with other violations or unsafe actions - Driver failed to properly
signal intent during actions consisting of other unsafe driving manner(s)

40
o Ex. during an illegally executed lane change in the middle of an intersection -
use with planned maneuvers, not sudden evasive maneuvers
Failure to signal, without other violations or unsafe actions - Driver failed to
properly signal intent but did not exhibit other unsafe driving action(s)
o Ex. changing lanes without signaling or turning without signaling - use with
planned maneuvers, not sudden evasive maneuvers
Failure to dim headlights - Vehicle traveling with high beams activated on
headlights, without dimming the lights when appropriate
Driving without lights or insufficient lights - Vehicle traveling with no headlights
on (or inappropriate headlights on) when the situation requires such lighting for safety
Avoiding object in roadway – driver behaved in a manner intended to avoid conflict
with an object in or near roadway.
o Objects could include pedestrian, other vehicle, animal, boxes, snow / ice,
pothole etc.
Apparent unfamiliarity with roadway - Driver behaved in an unsafe manner,
apparently due to an unfamiliarity with the surrounding traffic situation
o Ex. repeated u-turns, reading maps, papers, etc.
Apparent unfamiliarity with vehicle - Driver behaved in an unsafe manner,
apparently due to an unfamiliarity with the vehicle
o Ex. unfamiliarity with displays and controls
Apparent general inexperience driving - Driver behaved in an unsafe manner,
apparently due to lack of experience with the driving task
o Ex. hyper-focused driving, overly cautious maneuvers, etc.
Other - Other behavior not described in previous categories
Unable to determine
17. Participant impairment – Which of the following impairments did the participant
exhibit during roadway traversal?
None apparent - No observable driver impairment
Drowsy, sleepy, asleep, fatigued - Driver exhibits obvious signs of being asleep or
tired, or is actually asleep while driving, degrading performance of the driving task
Ill, blackout - Driver exhibits obvious signs of physical illness or loss of
consciousness, degrading performance of the driving task
Angry - Driver exhibits obvious signs of anger, whether directed at a specific target
or not, degrading performance of the driving task
Other emotional state - Driver exhibits another emotional state not described in
previous categories that degrades performance of the driving task
o Ex. depressed, disturbed
Drugs, medication - Driver was obviously under the influence of a medication
(prescription or over-the-counter) during the event (medication not necessarily a
cause in the event)
o Record if clearly seen
Drugs, Alcohol - Driver was obviously under the influence of alcohol during the
event (alcohol not necessarily a cause in the event)
o Record if clearly seen

41
Other illicit drugs - Driver was obviously under the influence of an illegal drug or
other type of drug not described in other categories during the event (drug not
necessarily a cause in the event)
o Record if clearly seen
o ex. marijuana, cocaine
Restricted to wheelchair - Driver must use a wheelchair for mobility
Impaired due to previous injury - Driver is physically impaired due to some type of
pre-existing injury not described in previous categories
Deaf - Driver is obviously hearing impaired
Other - Driver exhibits obvious physical or mental impairment not described in
previous categories (specifics are known)
Unable to determine
18. Participant distraction – which of the following distractions did the participant
exhibit during roadway traversal?
If less than five distractions are observed, mark remaining distractions as ―Not
Distracted‖
Not Distracted - There are no observable signs of driver distraction
Lost in thought - Driver performs multiple non-specific eye glances within 6 second
period of time
Looked but did not see - Driver is looking right at where incident is occurring, but
shows no reaction
Passenger in vehicle -When the passenger is not visible, but the driver is clearly
interacting with a passenger in the vehicle. This could be talking, listening, reacting
to (i.e., laughing), moving toward or away from the passenger (i.e., reaching for the
passenger, or avoiding a pat from the person). If the passenger is visible (even if the
driver is not interacting at a given time), code this distraction.
o If the passenger is visible, even if the driver is not interacting at a given time,
code this distraction
o Use this distraction if you can see the passenger in the camera or the driver is
talking and looking in the direction of the passenger seat.
Talking/singing without obvious passenger -When driver is moving lips as if in
conversation or singing a song.
o Mark this if driver is talking or singing and there is no other passenger visible
in the car.
o Only use this distraction if you cannot see a passenger in the camera or the
driver is talking and not looking in the direction of a passenger seat and does
not turn head as if communicating with someone.
Dancing - This could be when the driver is using his/her arms to go with the beat of
the music or moving head.
Reading - This is reading material that is in the vehicle, but not a part of the vehicle
(i.e., not reading external signs, or radio display).
o This could be reading directions, paper material, or packaging. If reading a
phone number, record as dialing cell phone.

42
Cognitive - Other - Includes when driver is writing, emotionally upset or angry, or
other activity that requires the driver to obviously be thinking about something other
than driving.
Moving object in vehicle - When an object inside the vehicle is in motion, either due
to the motion of the vehicle or due to another passenger throwing the object.
o Ex. object fell off seat when driver stopped hard at a traffic light.
Insect in vehicle - Swatting at insect, moving body to avoid insect, looking around
trying to locate insect.
Pet in vehicle - Any interaction with pet, including petting, talking to, or moving pet
or pet carrier.
o Only code if animal/pet is visible at some point in the trip file or if there is
history/context with the driver and the driver is exhibiting behaviors that are
appropriate to having a pet in the vehicle.
Object dropped by driver - When a driver is holding something and it drops and the
driver then picks it back up.
Reaching for object (not cell phone) - When driver reaches for an object, other than
a cell phone.
o Once the driver has finished reaching for the object and has it in hand, then it
becomes 'object in vehicle_other', as long as it doesn't fit into any of the other
categories (i.e. eating or drinking).
Animal/Object in Vehicle--Other - When a driver clearly is looking at, handling, or
manipulating an object (visible or not) or thing located in the vehicle, other than those
listed in other categories
Talking/listening on cell phone -When a driver is talking or has phone up to ear as if
listening to a phone conversation or waiting for person they are calling to pick up the
phone. If driver has ear piece, reductionist must observe the driver talking repeatedly.
o Cell phone use is always categorized as distraction
Dialing / interacting with keys on hand-held cell phone - When a driver is pushing
buttons on a cell phone to dial a number or check something else on their cell phone.
This would also include reading a phone number from a sheet of paper.
Dialing hands-free cell phone using voice activated software - When a driver
speaks into open or activated cell phone with long, prior delay of no speaking into
device and no button presses (i.e., most likely not in prior conversation).
Locating/reaching/ answering cell phone - When the driver is reaching towards
his/her cell phone and then putting the phone to his/her ear.
o If more than one distraction happens (i.e., driver looks for phone, reaches for
it and then answers it), the last frame number would be the last distraction
(i.e.., answering cell phone.)
Cell phone - Other - When a driver is interacting with a cell phone in some manner,
i.e., looking at a cell phone but not necessarily manipulating the cell phone in any
way.
Locating/reaching PDA - When driver reaches or starts to glance around for PDA.
Operating PDA - When driver is pressing buttons on the PDA.
Viewing PDA - When driver is looking at PDA, but not pressing any buttons
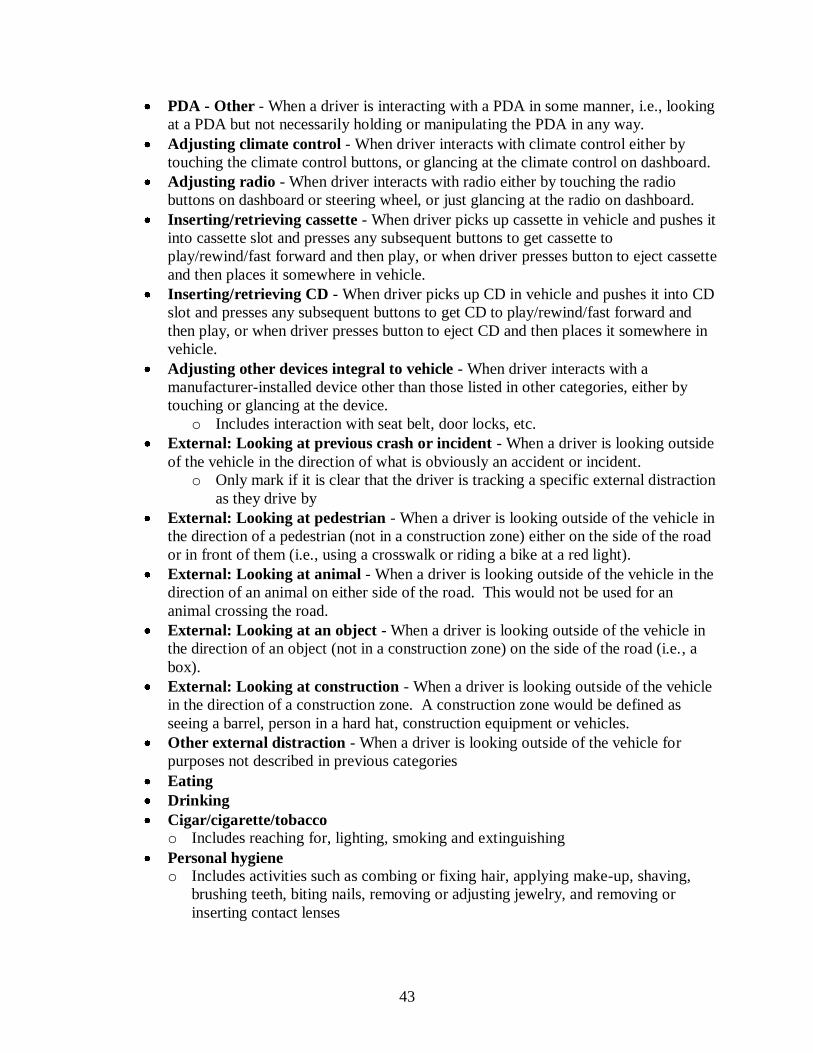
43
PDA - Other - When a driver is interacting with a PDA in some manner, i.e., looking
at a PDA but not necessarily holding or manipulating the PDA in any way.
Adjusting climate control - When driver interacts with climate control either by
touching the climate control buttons, or glancing at the climate control on dashboard.
Adjusting radio - When driver interacts with radio either by touching the radio
buttons on dashboard or steering wheel, or just glancing at the radio on dashboard.
Inserting/retrieving cassette - When driver picks up cassette in vehicle and pushes it
into cassette slot and presses any subsequent buttons to get cassette to
play/rewind/fast forward and then play, or when driver presses button to eject cassette
and then places it somewhere in vehicle.
Inserting/retrieving CD - When driver picks up CD in vehicle and pushes it into CD
slot and presses any subsequent buttons to get CD to play/rewind/fast forward and
then play, or when driver presses button to eject CD and then places it somewhere in
vehicle.
Adjusting other devices integral to vehicle - When driver interacts with a
manufacturer-installed device other than those listed in other categories, either by
touching or glancing at the device.
o Includes interaction with seat belt, door locks, etc.
External: Looking at previous crash or incident - When a driver is looking outside
of the vehicle in the direction of what is obviously an accident or incident.
o Only mark if it is clear that the driver is tracking a specific external distraction
as they drive by
External: Looking at pedestrian - When a driver is looking outside of the vehicle in
the direction of a pedestrian (not in a construction zone) either on the side of the road
or in front of them (i.e., using a crosswalk or riding a bike at a red light).
External: Looking at animal - When a driver is looking outside of the vehicle in the
direction of an animal on either side of the road. This would not be used for an
animal crossing the road.
External: Looking at an object - When a driver is looking outside of the vehicle in
the direction of an object (not in a construction zone) on the side of the road (i.e., a
box).
External: Looking at construction - When a driver is looking outside of the vehicle
in the direction of a construction zone. A construction zone would be defined as
seeing a barrel, person in a hard hat, construction equipment or vehicles.
Other external distraction - When a driver is looking outside of the vehicle for
purposes not described in previous categories
Eating
Drinking
Cigar/cigarette/tobacco o Includes reaching for, lighting, smoking and extinguishing
Personal hygiene
o Includes activities such as combing or fixing hair, applying make-up, shaving,
brushing teeth, biting nails, removing or adjusting jewelry, and removing or
inserting contact lenses

44
o EXCLUDE any minor activities which are not obvious distractions (i.e., lightly
touching/rubbing/scratching the chin, ear, cheek, etc., but not picking at anything
in particular)
Other
Unable to determine
19. Duration of distraction – distraction start sync & distraction stop sync
Distraction start sync
i. If no distraction is observed leave this field blank
ii. If the participant is engaged in the task prior to roadway entry then mark
as one sync prior to trigger start sync
iii. Else mark the sync the engagement begins after trigger start sync
Distraction end sync
i. If no distraction is observed leave this field blank
ii. If the participant is engaged in the task after exiting the roadway segment
then mark as one sync after the trigger end sync
iii. Else mark the sync the engagement begins prior to trigger end sync
A series of questions are relevant only to urban intersection traversals and are marked as
such. In the event that a selected epoch is not an urban intersection traversal, simply skip
these questions.
20. [INTERSECTION ONLY] Other vehicles – how many other vehicles were present
around the subject at the beginning of the intersection segment?
21. [INTERSECTION ONLY] Other vehicle location
If other vehicles are not present this field should be left blank.
Only consider other vehicles that are close enough to restrict the participant‘s ability
to maneuver.
The participant vehicle is always designated as vehicle #1. Other vehicles assume
vehicle numbers 2 thru 5.
Figure A.1 below provides a reference when determining the location of other
vehicles.
A: in front of subject vehicle
B: in front and to the immediate right of the subject vehicle
C: on the right side of the subject vehicle, closer to the front seat of the vehicle
D: on the right side of the subject vehicle, closer to the rear seat of the vehicle
E: behind and to the immediate right of the subject vehicle
F: behind the subject vehicle
G: behind and to the immediate left of the subject vehicle
H: on the left side of the subject vehicle, closer to the rear seat of the vehicle
I: on the left side of the subject vehicle, closer to the front seat of the vehicle
J: in front and to the immediate left of the subject vehicle
Unable to determine

45
Figure A.1. Other vehicle location.
22. [INTERSECTION ONLY]Other vehicle type
Car (sedan, coupe, station wagon)
Van (minivan or standard) / pickup truck (including regular tow trucks that are
not towing) / SUV (includes Jeep, crossovers)
Bus (transit, motor coach or school bus)
Single-unit straight truck (includes panel truck, U-haul)
Tractor trailer (with or without the trailer)
Motorcycle or moped
Emergency vehicle (police (vehicle or on horseback), fire, EMS) - in-service
Vehicle pulling trailer
Other vehicle type
Pedestrian
Pedalcyclist
Animal
Unable to determine
23. [INTERSECTION ONLY] signal phase prompts
If the signal phase is clearly visible mark the first signal phase prompt as ―phase
clearly visible‖ and disregard the second signal phase prompt question
In some instances it is not possible to clearly see the signal phase (green, amber, red)
but is possible to use additional information from the video to estimate the signal
phase. This additional information has been termed signal phase prompts.
Phase clearly visible
Relative position of phase ball
Movement of vehicles in same direction
Movement of vehicles in opposite direction
Movement of cross-traffic

46
Visible shift in signal phase
Signal phase for cross-traffic clearly visible
None
Unable to determine
24. [INTERSECTION ONLY] – signal phase
If the signal phase is clearly visible then use the unqualified categories (green, amber
or red)
If only one signal phase prompt is available and it is possible to estimate signal phase
then make use of the qualified (―Signal phase indiscernible – likely‖) categories
If two signal phase prompts are available and it is possible to estimate signal phase
then make use of the unqualified categories (green, amber, red)
Green
Amber
Red
Signal phase indiscernible
Signal phase indiscernible – likely green
Signal phase indiscernible – likely amber
Signal phase indiscernible – likely red
25. [INTERSECTION ONLY] Stopping behavior – which of the following best
characterizes the participant’s stopping behavior?
Participant does not come to a stop – the driver does not bring the vehicle to a
complete stop.
o Include low speed ―rolling stops‖ in this category
Participant stops as first vehicle in queue, at or before the stop bar
Participant stops as first vehicle in queue, but beyond the stop bar
Participant stops behind leading vehicle
Unable to determine
26. [INTERSECTION ONLY] signal violation – which of the following best describes
the type of observed signal violation?
A signal violation is defined by the following conditions:
i. the last visible signal phase is red or likely red
ii. the participant did not come to a stop
No signal violation
Signal violation, apparently did not see signal – participant did not notice and thus
disobeyed traffic signal
Signal violation, intentionally disregarded signal – driver saw traffic signal
purposefully disregarded it
Signal violation, tried to beat signal change – driver accelerated or continued at a
speed intended to pass through an intersection before the signal turned red
Unable to determine

47
27. [INTERSECTION ONLY] Vehicle path – which of the following best describe the
vehicle path during intersection traversal?
Left turn
Right turn
Straight crossing – the vehicle crosses straight through the intersection.
U-turn – the vehicle completes a turn resulting in a heading 180° from entry heading
Unable to determine
28. [INTERSECTION ONLY] Appropriate destination lane – did the participant exit in
the correct lane?
Yes
No – driver changed lanes during intersection traversal
No – driver changed lanes on intersection approach
No – driver changed lanes on approach and in the middle of the intersection
Unable to determine
29. [INTERSECTION ONLY] Was the intersection traversal in compliance with lane
type?
Yes.
No – straight crossing from turn only lane.
No – turn from straight crossing only lane.
Unable to determine
30. Comments
Please keep the following in mind to include in the comment text box
i. Construction on the roadway segment
ii. Any infrastructure element that seems relevant such as roadside signage
with warnings or pavement markings with warnings
iii. Anything that should be brought to the attention of the researcher such as
driver or environmental conditions not captured by the reduction but
relevant to intersection traversal.


49
REFERENCES
(1) Cannon, B.R., McLaughlin, S.B., & Hankey, J.M. (2009). Method for Identifying Rural,
Urban, and Interstate Driving in Naturalistic Driving Data (09-UT-005). Blacksburg, VA:
National Surface Transportation Safety Center for Excellence
(2) Dingus, T. A., Klauer, S. G., Neale, V. L., Petersen, A., Lee, S. E., Sudweeks, J., Perez, M.
A., Hankey, J., Ramsey, D., Gupta, S., Bucher, C., Doerzaph, Z. R., Jermeland J., &
Knipling, R. R. (2006). The 100-Car naturalistic driving study, phase II - results of the 100-
Car field experiment. Washington, DC: National Highway Traffic Safety Administration.