georgia state government fy2015 workforce reportdoas.ga.gov/assets/human resources...
TRANSCRIPT
Georgia State Government
FY2015 Workforce Report July 1, 2014 – June 30, 2015
Department of Administrative Services
Human Resources Administration Division
200 Piedmont Avenue, West Tower Suite 500
T: 1-877-318-2722 or 404-656-2705
Page 2 of 42
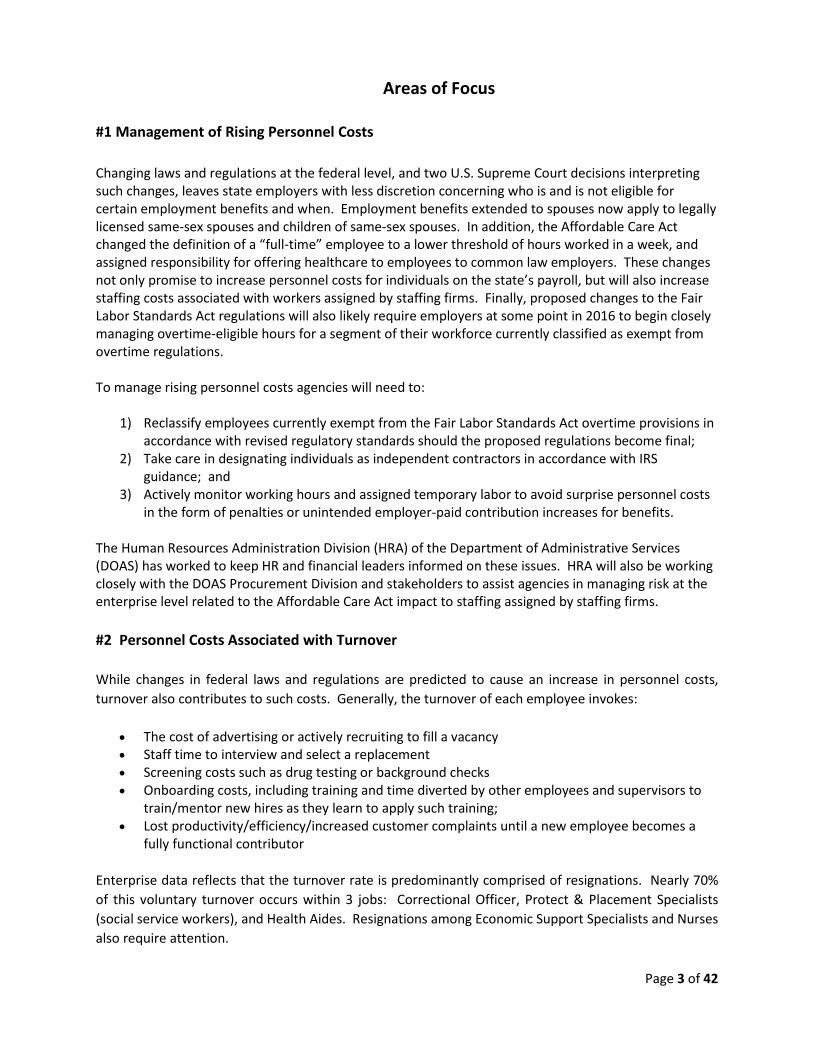
EXECUTIVE SUMMARY
Information in this report provides a snapshot of the State’s workforce for Fiscal Year 2015. The first section containing Tables 1-6 provides a basic overview of all state entities, all branches of government. The remainder of the report focuses on Executive Branch entities only. All data excludes Georgia World Congress Center and Board of Regents, and is further limited to entities utilizing the State’s enterprise HRIS Peoplesoft/TeamWorks.
Top 3 Takeaways
1. Workforce. The state’s benefit-eligible workforce continued to shrink slightly, but still accounts for more than 80% of public sector staffing. State entities supplemented benefit-eligible staffing with various non-permanent employment arrangements, which accounted for another 16% of staffing. Nearly 2% of these non-permanent employees were on course to work 30 hours or more per week in any one month, and therefore will likely be eligible for healthcare benefits during open enrollment for the 2016 calendar year. These numbers do not reflect staffing assigned to government employers by staffing firms or independent contractors. Management of rising personal service costs will be one of the significant challenges agencies will face in 2016.
2. Turnover. The general turnover rate continues to climb marginally, with voluntary resignations
the primary driver. Specifically, more than 18% of new hires left employment with less than 1 year of service, and nearly 50% of new hires left before their second anniversary. The top three jobs driving nearly 70% of this turnover are Correctional Officers at Corrections and Department of Juvenile Justice; Protect & Placement Specialists (social workers) at Department of Human Services; and Health Aides at Department of Behavioral Health. While a robust level of hiring has been underway for entry-level Protect & Placement Specialist and Correctional Officers, agencies must focus on narrowly tailored retention strategies.
3. Retirements. The number of employees that retired in FY2015 was slightly higher than the previous year, and 10% of the workforce remains eligible to retire today. This number is conservative in that it does not account for categories of employees that may retire at an earlier age nor employees that have purchased service credits. Nevertheless, as estimated 15-25% of the workforce will be eligible to retire over the next 5 years, which is 5-10% higher than percentages other employers recently reported. State entities of particular vulnerability include Georgia Student Finance, State Board of Workers’ Compensation, Georgia Building Authority, and Office Commissioner of Insurance, each with more than 20% of their workforce eligible to retire today and climbing to around 30% within the next five years. This data also supports the recommendation that agencies focus on data-driven retention strategies so that they are prepared to replace their retirement-eligible population.
Page 3 of 42
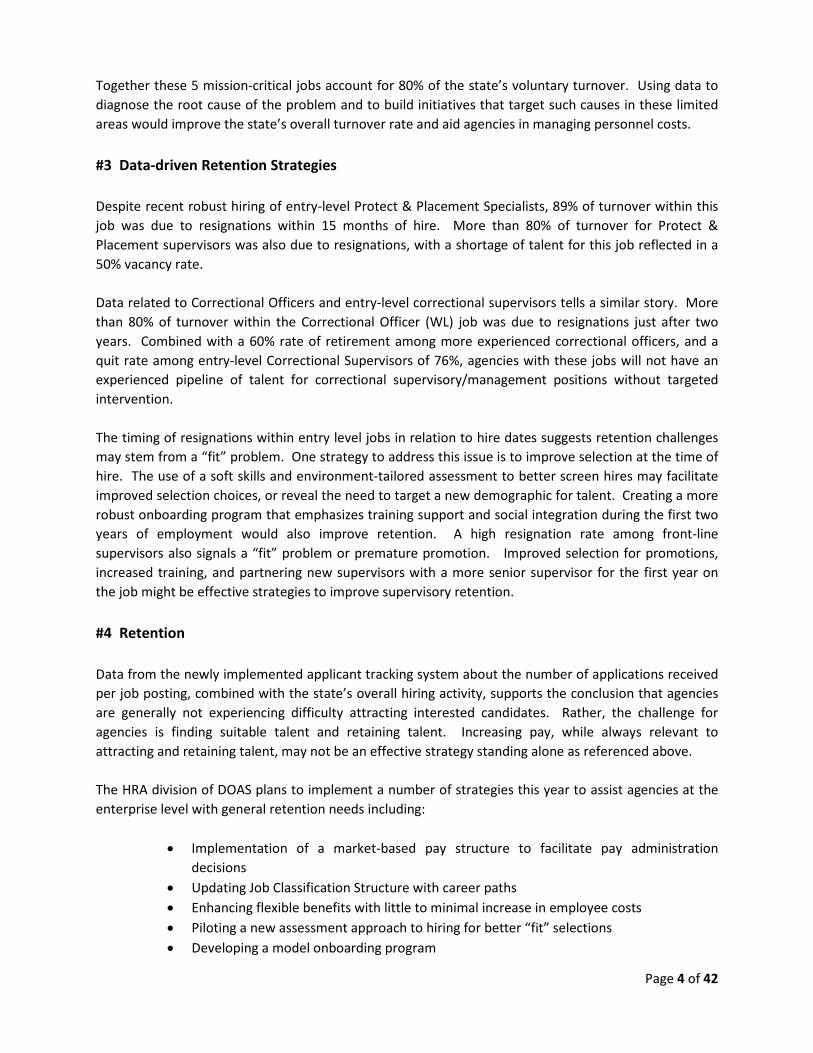
Areas of Focus #1 Management of Rising Personnel Costs Changing laws and regulations at the federal level, and two U.S. Supreme Court decisions interpreting such changes, leaves state employers with less discretion concerning who is and is not eligible for certain employment benefits and when. Employment benefits extended to spouses now apply to legally licensed same-sex spouses and children of same-sex spouses. In addition, the Affordable Care Act changed the definition of a “full-time” employee to a lower threshold of hours worked in a week, and assigned responsibility for offering healthcare to employees to common law employers. These changes not only promise to increase personnel costs for individuals on the state’s payroll, but will also increase staffing costs associated with workers assigned by staffing firms. Finally, proposed changes to the Fair Labor Standards Act regulations will also likely require employers at some point in 2016 to begin closely managing overtime-eligible hours for a segment of their workforce currently classified as exempt from overtime regulations. To manage rising personnel costs agencies will need to:
1) Reclassify employees currently exempt from the Fair Labor Standards Act overtime provisions in accordance with revised regulatory standards should the proposed regulations become final;
2) Take care in designating individuals as independent contractors in accordance with IRS guidance; and
3) Actively monitor working hours and assigned temporary labor to avoid surprise personnel costs in the form of penalties or unintended employer-paid contribution increases for benefits.
The Human Resources Administration Division (HRA) of the Department of Administrative Services (DOAS) has worked to keep HR and financial leaders informed on these issues. HRA will also be working closely with the DOAS Procurement Division and stakeholders to assist agencies in managing risk at the enterprise level related to the Affordable Care Act impact to staffing assigned by staffing firms. #2 Personnel Costs Associated with Turnover While changes in federal laws and regulations are predicted to cause an increase in personnel costs, turnover also contributes to such costs. Generally, the turnover of each employee invokes:
• The cost of advertising or actively recruiting to fill a vacancy • Staff time to interview and select a replacement • Screening costs such as drug testing or background checks • Onboarding costs, including training and time diverted by other employees and supervisors to
train/mentor new hires as they learn to apply such training; • Lost productivity/efficiency/increased customer complaints until a new employee becomes a
fully functional contributor
Enterprise data reflects that the turnover rate is predominantly comprised of resignations. Nearly 70% of this voluntary turnover occurs within 3 jobs: Correctional Officer, Protect & Placement Specialists (social service workers), and Health Aides. Resignations among Economic Support Specialists and Nurses also require attention.
Page 4 of 42
Together these 5 mission-critical jobs account for 80% of the state’s voluntary turnover. Using data to diagnose the root cause of the problem and to build initiatives that target such causes in these limited areas would improve the state’s overall turnover rate and aid agencies in managing personnel costs. #3 Data-driven Retention Strategies Despite recent robust hiring of entry-level Protect & Placement Specialists, 89% of turnover within this job was due to resignations within 15 months of hire. More than 80% of turnover for Protect & Placement supervisors was also due to resignations, with a shortage of talent for this job reflected in a 50% vacancy rate. Data related to Correctional Officers and entry-level correctional supervisors tells a similar story. More than 80% of turnover within the Correctional Officer (WL) job was due to resignations just after two years. Combined with a 60% rate of retirement among more experienced correctional officers, and a quit rate among entry-level Correctional Supervisors of 76%, agencies with these jobs will not have an experienced pipeline of talent for correctional supervisory/management positions without targeted intervention. The timing of resignations within entry level jobs in relation to hire dates suggests retention challenges may stem from a “fit” problem. One strategy to address this issue is to improve selection at the time of hire. The use of a soft skills and environment-tailored assessment to better screen hires may facilitate improved selection choices, or reveal the need to target a new demographic for talent. Creating a more robust onboarding program that emphasizes training support and social integration during the first two years of employment would also improve retention. A high resignation rate among front-line supervisors also signals a “fit” problem or premature promotion. Improved selection for promotions, increased training, and partnering new supervisors with a more senior supervisor for the first year on the job might be effective strategies to improve supervisory retention. #4 Retention Data from the newly implemented applicant tracking system about the number of applications received per job posting, combined with the state’s overall hiring activity, supports the conclusion that agencies are generally not experiencing difficulty attracting interested candidates. Rather, the challenge for agencies is finding suitable talent and retaining talent. Increasing pay, while always relevant to attracting and retaining talent, may not be an effective strategy standing alone as referenced above. The HRA division of DOAS plans to implement a number of strategies this year to assist agencies at the enterprise level with general retention needs including:
• Implementation of a market-based pay structure to facilitate pay administration decisions
• Updating Job Classification Structure with career paths • Enhancing flexible benefits with little to minimal increase in employee costs • Piloting a new assessment approach to hiring for better “fit” selections • Developing a model onboarding program
Page 5 of 42
• Developing a common training curriculum for managers • Developing leadership competencies to promote a focus on leadership development
Table of Contents ENTERPRISE
Table 1: FY2014 / FY2015 Workforce Comparison ...................................................................................... 7
Table 2: Workforce Breakdown By Branch of Government ....................................................................... 8
Table 3: Headcount By Fiscal Year ............................................................................................................... 8
Table 4: Turnover Trend By Fiscal Year ....................................................................................................... 9
Table 5: Employment Category .................................................................................................................. 11
Table 6: Workforce By Entity ..................................................................................................................... 12
EXECUTIVE
Table 7: FY2015 Executive Branch Workforce Profile ............................................................................... 14
Table 8: Ethnic Group Distribution ............................................................................................................ 15
Table 9: Workforce By Job Family .............................................................................................................. 16
Table 10: Workforce Job Family Detail ...................................................................................................... 17
Table 11: Job Family Total – Three Year Trend ......................................................................................... 18
Table 12: Most Populous Jobs Three Year Trend ...................................................................................... 19
Table 13: Age & Tenure By Classification .................................................................................................. 20
Table 14: Retirement Eligibility .................................................................................................................. 21
Table 15: Retiree Eligibility By Agency ...................................................................................................... 22
Table 16: Workforce By Generations ......................................................................................................... 24
Table 17: Years of Service Distribution ...................................................................................................... 25
TALENT ACQUISITION
Table 18: Hiring Activity By Category ........................................................................................................ 26
Table 19: Hires By Generation ................................................................................................................... 26
Table 20: Hires By Gender & Ethnic Group ................................................................................................ 27
Table 21: Hires By Highest Education Level ............................................................................................... 27
Table 22: Hires By Job Family Three Year Trend ....................................................................................... 28
Table 23: Top Jobs Filled in 2015 - Three Year Trend ................................................................................ 29
SEPARATIONS
Table 24: Separations By Major Category ................................................................................................. 30
Table 25: Voluntary Separations By Years of Service ............................................................................... 31
Table 26: Voluntary Separations By Generations ..................................................................................... 31

Page 6 of 42
Table 27: Job Family Separations/Hires Comparison ................................................................................ 32
Table 28: Top Separations By Jobs w/Hires Comparison .......................................................................... 33
Table 29: Agency Turnover Breakdown ..................................................................................................... 34
EXHIBITS
Exhibit A: Trends in Hiring .......................................................................................................................... 37
Exhibit B: Trends in Separations ................................................................................................................ 38
Exhibit C: Separations Major Category Descriptions ................................................................................ 40
Exhibit D: State of Georgia Salary Plans .................................................................................................... 41
Page 7 of 42
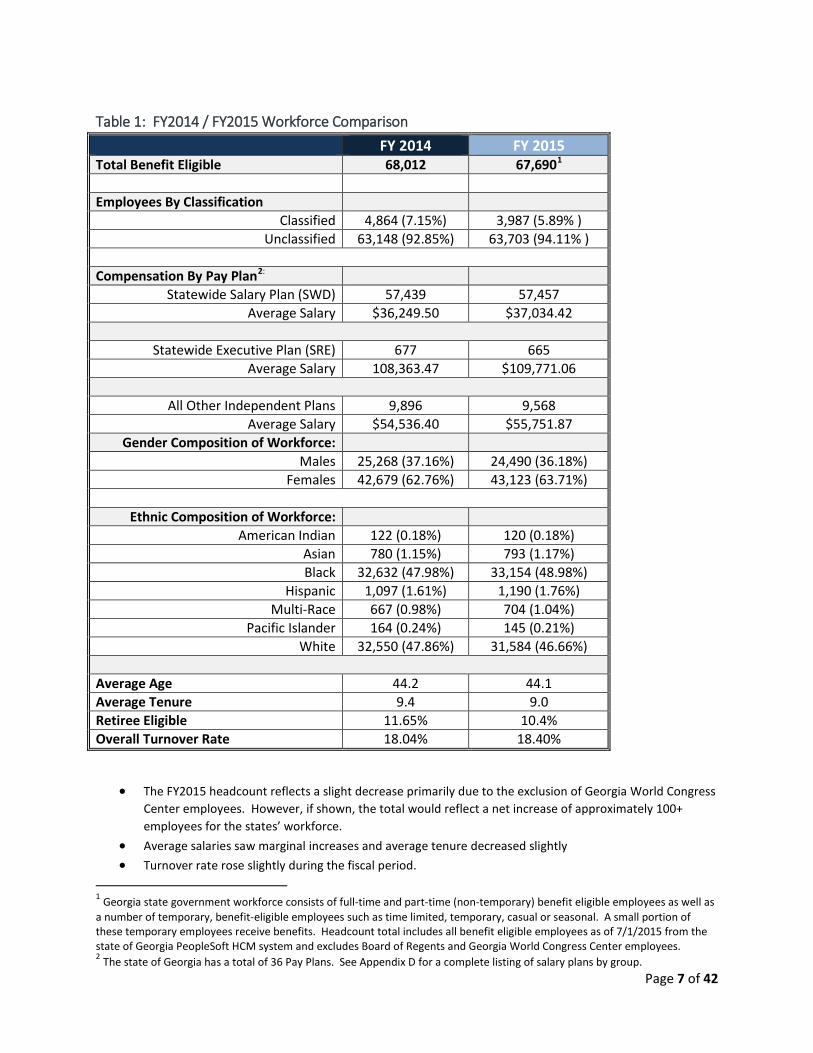
Table 1: FY2014 / FY2015 Workforce Comparison FY 2014 FY 2015 Total Benefit Eligible 68,012 67,6901
Employees By Classification
Classified 4,864 (7.15%) 3,987 (5.89% ) Unclassified 63,148 (92.85%) 63,703 (94.11% )
Compensation By Pay Plan2:
Statewide Salary Plan (SWD) 57,439 57,457 Average Salary $36,249.50 $37,034.42
Statewide Executive Plan (SRE) 677 665
Average Salary 108,363.47 $109,771.06
All Other Independent Plans 9,896 9,568 Average Salary $54,536.40 $55,751.87
Gender Composition of Workforce: Males 25,268 (37.16%) 24,490 (36.18%)
Females 42,679 (62.76%) 43,123 (63.71%)
Ethnic Composition of Workforce: American Indian 122 (0.18%) 120 (0.18%)
Asian 780 (1.15%) 793 (1.17%) Black 32,632 (47.98%) 33,154 (48.98%)
Hispanic 1,097 (1.61%) 1,190 (1.76%) Multi-Race 667 (0.98%) 704 (1.04%)
Pacific Islander 164 (0.24%) 145 (0.21%) White 32,550 (47.86%) 31,584 (46.66%)
Average Age 44.2 44.1 Average Tenure 9.4 9.0 Retiree Eligible 11.65% 10.4% Overall Turnover Rate 18.04% 18.40%
• The FY2015 headcount reflects a slight decrease primarily due to the exclusion of Georgia World Congress Center employees. However, if shown, the total would reflect a net increase of approximately 100+ employees for the states’ workforce.
• Average salaries saw marginal increases and average tenure decreased slightly • Turnover rate rose slightly during the fiscal period.
1 Georgia state government workforce consists of full-time and part-time (non-temporary) benefit eligible employees as well as a number of temporary, benefit-eligible employees such as time limited, temporary, casual or seasonal. A small portion of these temporary employees receive benefits. Headcount total includes all benefit eligible employees as of 7/1/2015 from the state of Georgia PeopleSoft HCM system and excludes Board of Regents and Georgia World Congress Center employees. 2 The state of Georgia has a total of 36 Pay Plans. See Appendix D for a complete listing of salary plans by group.
Page 8 of 42
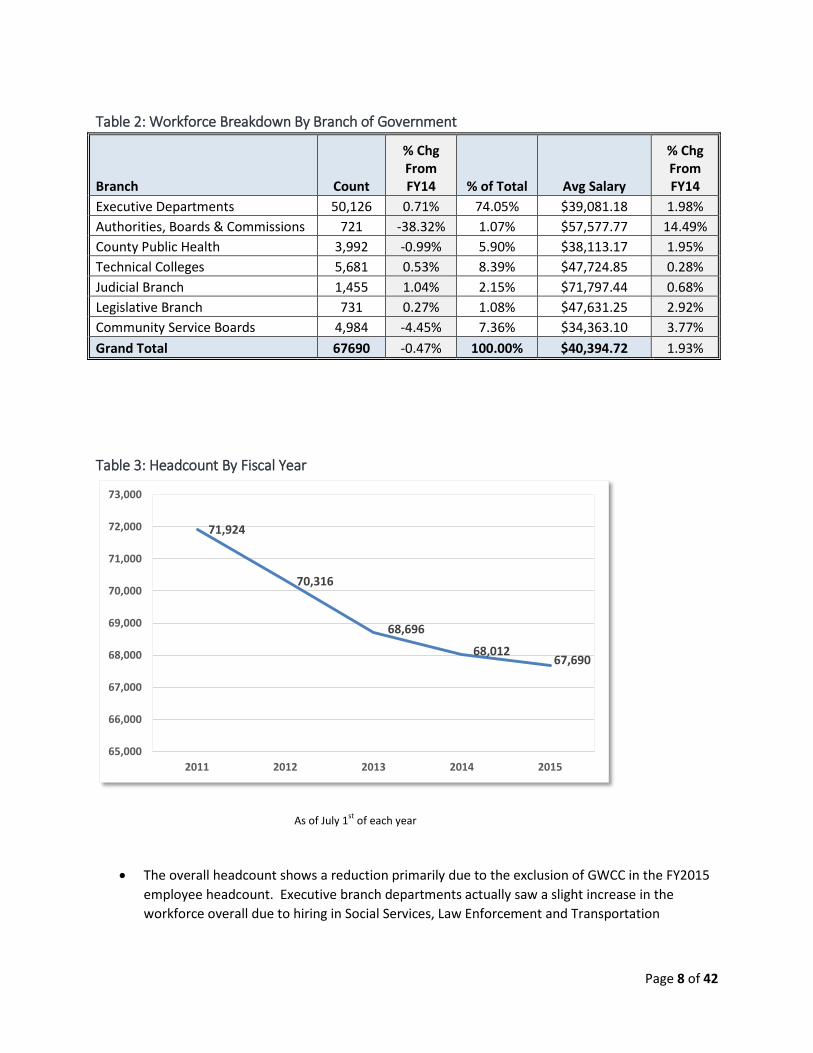
Table 2: Workforce Breakdown By Branch of Government
Branch Count
% Chg From FY14 % of Total Avg Salary
% Chg From FY14
Executive Departments 50,126 0.71% 74.05% $39,081.18 1.98% Authorities, Boards & Commissions 721 -38.32% 1.07% $57,577.77 14.49% County Public Health 3,992 -0.99% 5.90% $38,113.17 1.95% Technical Colleges 5,681 0.53% 8.39% $47,724.85 0.28% Judicial Branch 1,455 1.04% 2.15% $71,797.44 0.68% Legislative Branch 731 0.27% 1.08% $47,631.25 2.92% Community Service Boards 4,984 -4.45% 7.36% $34,363.10 3.77% Grand Total 67690 -0.47% 100.00% $40,394.72 1.93%
Table 3: Headcount By Fiscal Year
• The overall headcount shows a reduction primarily due to the exclusion of GWCC in the FY2015 employee headcount. Executive branch departments actually saw a slight increase in the workforce overall due to hiring in Social Services, Law Enforcement and Transportation
71,924
70,316
68,696
68,012 67,690
65,000
66,000
67,000
68,000
69,000
70,000
71,000
72,000
73,000
2011 2012 2013 2014 2015
As of July 1st of each year
Page 9 of 42
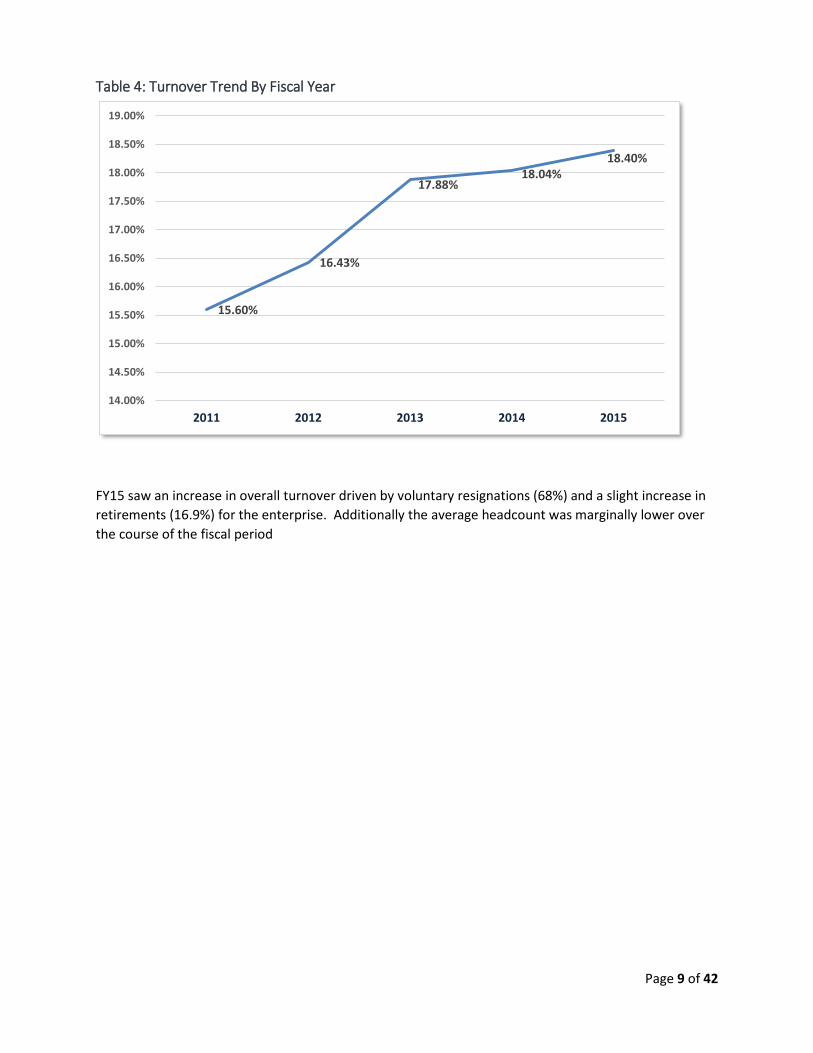
Table 4: Turnover Trend By Fiscal Year
FY15 saw an increase in overall turnover driven by voluntary resignations (68%) and a slight increase in retirements (16.9%) for the enterprise. Additionally the average headcount was marginally lower over the course of the fiscal period
15.60%
16.43%
17.88% 18.04%
18.40%
14.00%
14.50%
15.00%
15.50%
16.00%
16.50%
17.00%
17.50%
18.00%
18.50%
19.00%
2011 2012 2013 2014 2015
Executive Branch
Georgia State Government
Page 11 of 42
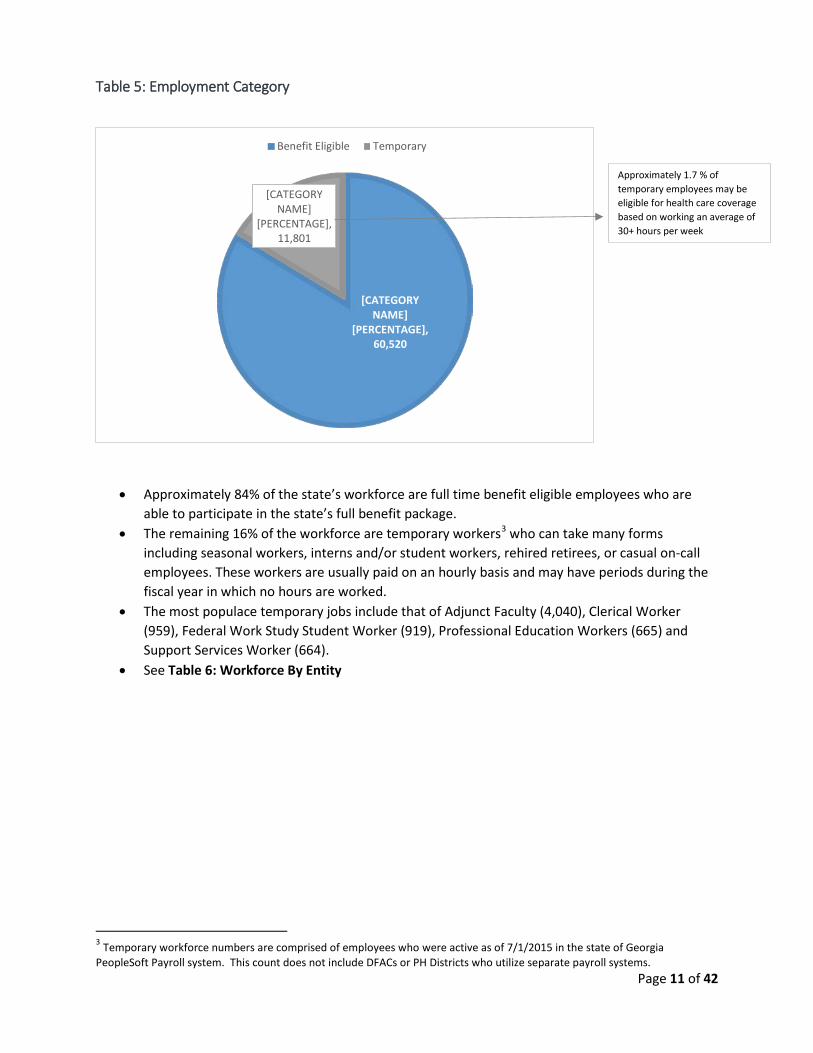
Table 5: Employment Category
• Approximately 84% of the state’s workforce are full time benefit eligible employees who are able to participate in the state’s full benefit package.
• The remaining 16% of the workforce are temporary workers3 who can take many forms including seasonal workers, interns and/or student workers, rehired retirees, or casual on-call employees. These workers are usually paid on an hourly basis and may have periods during the fiscal year in which no hours are worked.
• The most populace temporary jobs include that of Adjunct Faculty (4,040), Clerical Worker (959), Federal Work Study Student Worker (919), Professional Education Workers (665) and Support Services Worker (664).
• See Table 6: Workforce By Entity
3 Temporary workforce numbers are comprised of employees who were active as of 7/1/2015 in the state of Georgia PeopleSoft Payroll system. This count does not include DFACs or PH Districts who utilize separate payroll systems.
[CATEGORY NAME]
[PERCENTAGE], 60,520
[CATEGORY NAME]
[PERCENTAGE], 11,801
Benefit Eligible Temporary
Approximately 1.7 % of temporary employees may be eligible for health care coverage based on working an average of 30+ hours per week
Page 12 of 42
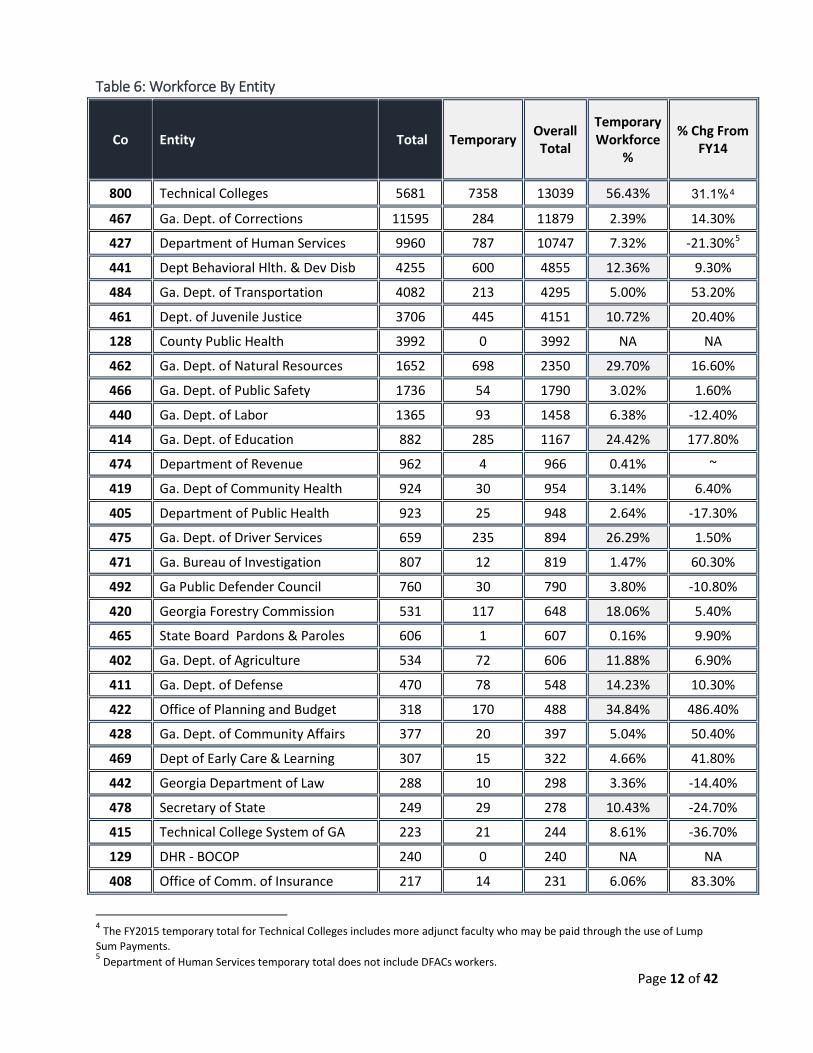
Table 6: Workforce By Entity
Co Entity Total Temporary Overall Total
Temporary Workforce
%
% Chg From FY14
800 Technical Colleges 5681 7358 13039 56.43% 31.1%4
467 Ga. Dept. of Corrections 11595 284 11879 2.39% 14.30%
427 Department of Human Services 9960 787 10747 7.32% -21.30%5
441 Dept Behavioral Hlth. & Dev Disb 4255 600 4855 12.36% 9.30%
484 Ga. Dept. of Transportation 4082 213 4295 5.00% 53.20%
461 Dept. of Juvenile Justice 3706 445 4151 10.72% 20.40%
128 County Public Health 3992 0 3992 NA NA
462 Ga. Dept. of Natural Resources 1652 698 2350 29.70% 16.60%
466 Ga. Dept. of Public Safety 1736 54 1790 3.02% 1.60%
440 Ga. Dept. of Labor 1365 93 1458 6.38% -12.40%
414 Ga. Dept. of Education 882 285 1167 24.42% 177.80%
474 Department of Revenue 962 4 966 0.41% ~
419 Ga. Dept of Community Health 924 30 954 3.14% 6.40%
405 Department of Public Health 923 25 948 2.64% -17.30%
475 Ga. Dept. of Driver Services 659 235 894 26.29% 1.50%
471 Ga. Bureau of Investigation 807 12 819 1.47% 60.30%
492 Ga Public Defender Council 760 30 790 3.80% -10.80%
420 Georgia Forestry Commission 531 117 648 18.06% 5.40%
465 State Board Pardons & Paroles 606 1 607 0.16% 9.90%
402 Ga. Dept. of Agriculture 534 72 606 11.88% 6.90%
411 Ga. Dept. of Defense 470 78 548 14.23% 10.30%
422 Office of Planning and Budget 318 170 488 34.84% 486.40%
428 Ga. Dept. of Community Affairs 377 20 397 5.04% 50.40%
469 Dept of Early Care & Learning 307 15 322 4.66% 41.80%
442 Georgia Department of Law 288 10 298 3.36% -14.40%
478 Secretary of State 249 29 278 10.43% -24.70%
415 Technical College System of GA 223 21 244 8.61% -36.70%
129 DHR - BOCOP 240 0 240 NA NA
408 Office of Comm. of Insurance 217 14 231 6.06% 83.30%
4 The FY2015 temporary total for Technical Colleges includes more adjunct faculty who may be paid through the use of Lump Sum Payments. 5 Department of Human Services temporary total does not include DFACs workers.
Page 13 of 42
Co Entity Total Temporary Overall Total
Temporary Workforce
%
% Chg From FY14
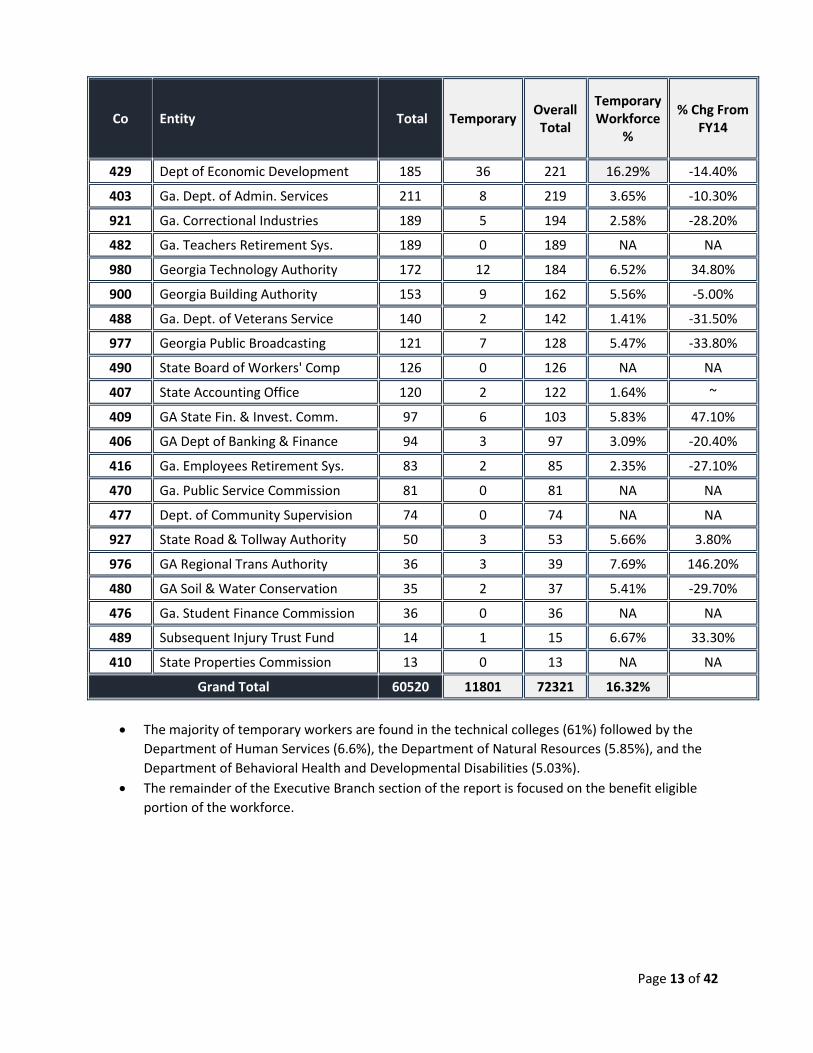
429 Dept of Economic Development 185 36 221 16.29% -14.40%
403 Ga. Dept. of Admin. Services 211 8 219 3.65% -10.30%
921 Ga. Correctional Industries 189 5 194 2.58% -28.20%
482 Ga. Teachers Retirement Sys. 189 0 189 NA NA
980 Georgia Technology Authority 172 12 184 6.52% 34.80%
900 Georgia Building Authority 153 9 162 5.56% -5.00%
488 Ga. Dept. of Veterans Service 140 2 142 1.41% -31.50%
977 Georgia Public Broadcasting 121 7 128 5.47% -33.80%
490 State Board of Workers' Comp 126 0 126 NA NA
407 State Accounting Office 120 2 122 1.64% ~
409 GA State Fin. & Invest. Comm. 97 6 103 5.83% 47.10%
406 GA Dept of Banking & Finance 94 3 97 3.09% -20.40%
416 Ga. Employees Retirement Sys. 83 2 85 2.35% -27.10%
470 Ga. Public Service Commission 81 0 81 NA NA
477 Dept. of Community Supervision 74 0 74 NA NA
927 State Road & Tollway Authority 50 3 53 5.66% 3.80%
976 GA Regional Trans Authority 36 3 39 7.69% 146.20%
480 GA Soil & Water Conservation 35 2 37 5.41% -29.70%
476 Ga. Student Finance Commission 36 0 36 NA NA
489 Subsequent Injury Trust Fund 14 1 15 6.67% 33.30%
410 State Properties Commission 13 0 13 NA NA
Grand Total 60520 11801 72321 16.32%
• The majority of temporary workers are found in the technical colleges (61%) followed by the Department of Human Services (6.6%), the Department of Natural Resources (5.85%), and the Department of Behavioral Health and Developmental Disabilities (5.03%).
• The remainder of the Executive Branch section of the report is focused on the benefit eligible portion of the workforce.

Page 14 of 42
Table 7: FY2015 Executive Branch Workforce Profile6
FY14 FY15 % Change Number: 60,627 60,520 -0.18% Full-Time 60,566 60,459 -0.18% Part-Time 61 61 0.00% Classified 4,439 3,621 -18.43% Average Age 44 44 0.00% Average Salary $39,355.89 $40,049.06 1.76% Average Years of Service 9.5 9.2 -3.16% Percent Minorities 52.60% 53.87% 2.41% Percent Female 61.50% 62.56% 1.72%
Highlights of FY15 Workforce Hires
Number of Total Hires 9,813 11,091 13.02% Percent of Hires Female 60.2% 63.5% 5.48% Percent of Hires Minorities 62.3% 66.1% 6.10% Average Age of New Hire (FT) 34.8 34.8 0.00%
Turnover Overall Turnover Rate 17.72% 17.83% 0.62% Total Number of Separations 10,823 10,770 -0.49% Percent Voluntary Resignations 63.9% 66.8% 4.41% Percent Retirements 17.1% 18.2% 6.55% Percent Involuntary Terminations 18.2% 14.3% -21.79%
Gender Female 61.5% 62.5% 1.69% Male 38.5% 37.30% -3.12%
Ethnicity American Indian 0.2% 0.2% 0.00% Asian 1.1% 1.2% 2.65% Black 48.6% 49.5% 1.96% Hawaiian Pacific Islander 0.2% 0.17% -15.00% Hispanic 1.7% 1.9% 8.82% Multi-Race 0.9% 1.0% 7.87% White 47.4% 46.1% -2.60%
Retirement Employees Retired 1,850 1,966 6.3% Percent of Employees Eligible to Retire7 10.0% 10.3% 2.90%
6 Effective FY2013, Executive Branch excludes Community Service Boards (CSB) which total approximately 5,000 employees. Board of Regents and Georgia World Congress Center are also not included in Executive branch employee count. 7 Retirement eligibility figures are based on tenure and age records from the states’ PeopleSoft HCM system and do not reflect service credit which may have been purchased from the Employees’ Retirement System.
Page 15 of 42
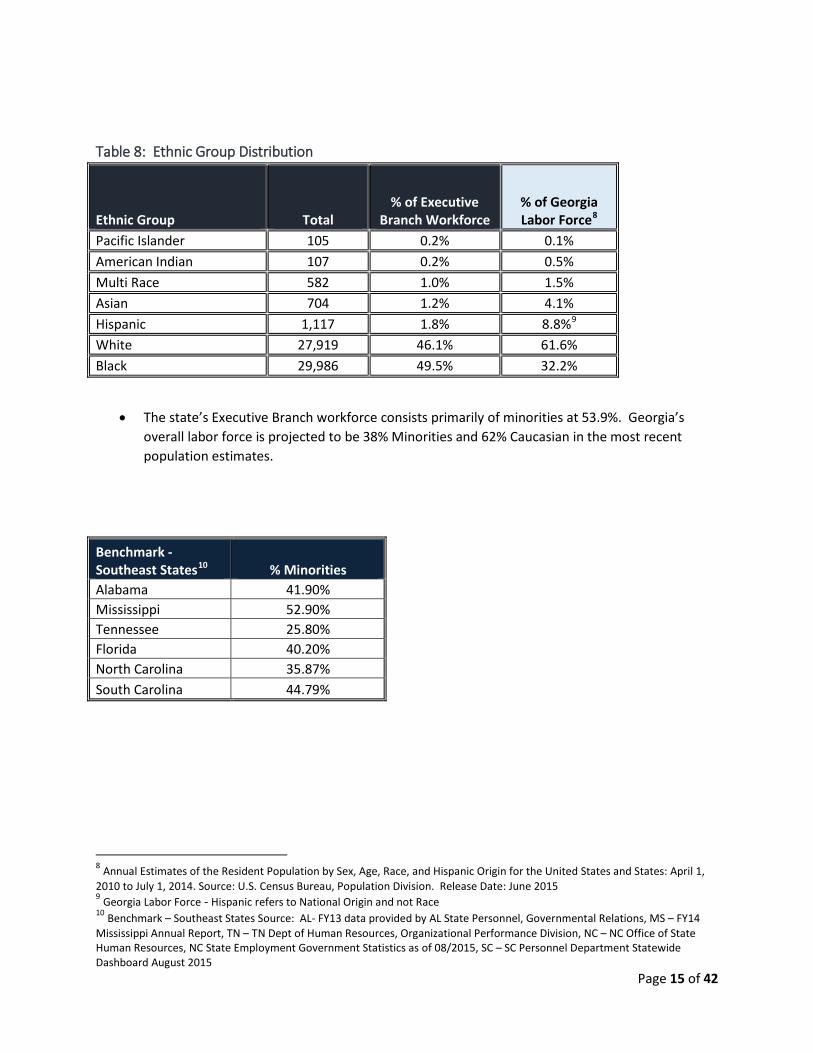
Table 8: Ethnic Group Distribution
Ethnic Group Total % of Executive
Branch Workforce % of Georgia Labor Force8
Pacific Islander 105 0.2% 0.1% American Indian 107 0.2% 0.5% Multi Race 582 1.0% 1.5% Asian 704 1.2% 4.1% Hispanic 1,117 1.8% 8.8%9 White 27,919 46.1% 61.6% Black 29,986 49.5% 32.2%
• The state’s Executive Branch workforce consists primarily of minorities at 53.9%. Georgia’s overall labor force is projected to be 38% Minorities and 62% Caucasian in the most recent population estimates.
Benchmark - Southeast States10 % Minorities Alabama 41.90% Mississippi 52.90% Tennessee 25.80% Florida 40.20% North Carolina 35.87% South Carolina 44.79%
8 Annual Estimates of the Resident Population by Sex, Age, Race, and Hispanic Origin for the United States and States: April 1, 2010 to July 1, 2014. Source: U.S. Census Bureau, Population Division. Release Date: June 2015 9 Georgia Labor Force - Hispanic refers to National Origin and not Race 10 Benchmark – Southeast States Source: AL- FY13 data provided by AL State Personnel, Governmental Relations, MS – FY14 Mississippi Annual Report, TN – TN Dept of Human Resources, Organizational Performance Division, NC – NC Office of State Human Resources, NC State Employment Government Statistics as of 08/2015, SC – SC Personnel Department Statewide Dashboard August 2015
Page 16 of 42
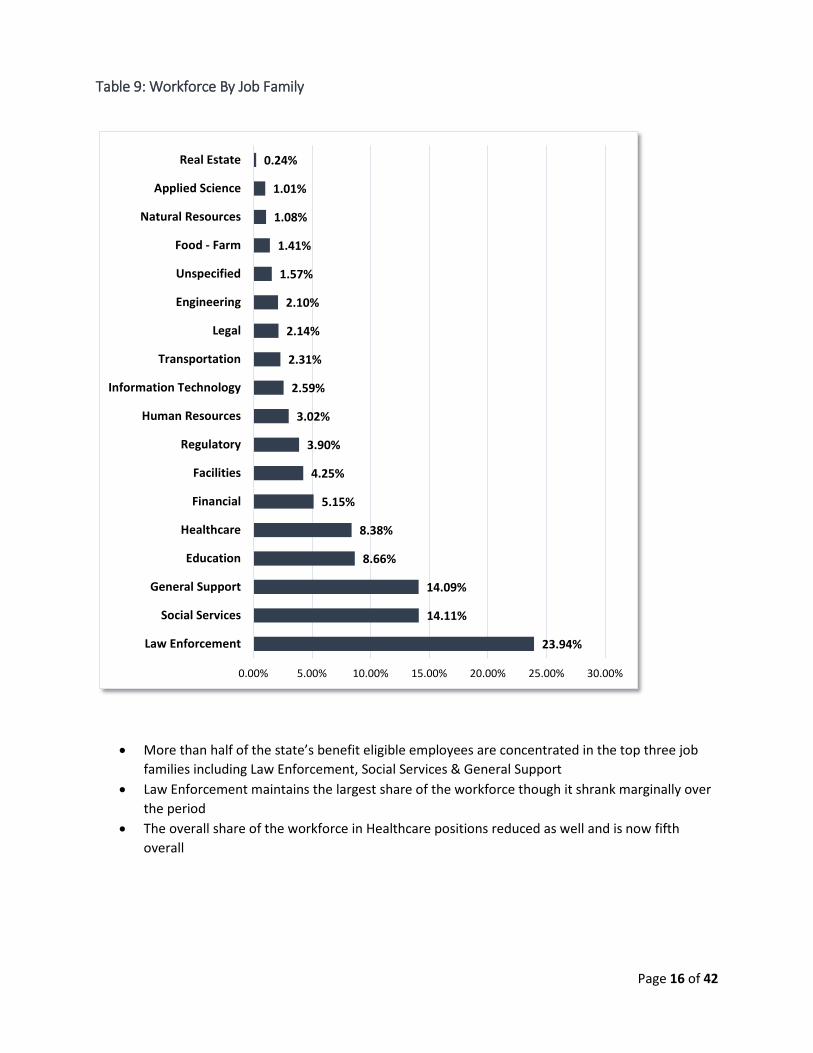
Table 9: Workforce By Job Family
• More than half of the state’s benefit eligible employees are concentrated in the top three job families including Law Enforcement, Social Services & General Support
• Law Enforcement maintains the largest share of the workforce though it shrank marginally over the period
• The overall share of the workforce in Healthcare positions reduced as well and is now fifth overall
23.94%
14.11%
14.09%
8.66%
8.38%
5.15%
4.25%
3.90%
3.02%
2.59%
2.31%
2.14%
2.10%
1.57%
1.41%
1.08%
1.01%
0.24%
0.00% 5.00% 10.00% 15.00% 20.00% 25.00% 30.00%
Law Enforcement
Social Services
General Support
Education
Healthcare
Financial
Facilities
Regulatory
Human Resources
Information Technology
Transportation
Legal
Engineering
Unspecified
Food - Farm
Natural Resources
Applied Science
Real Estate
Page 17 of 42
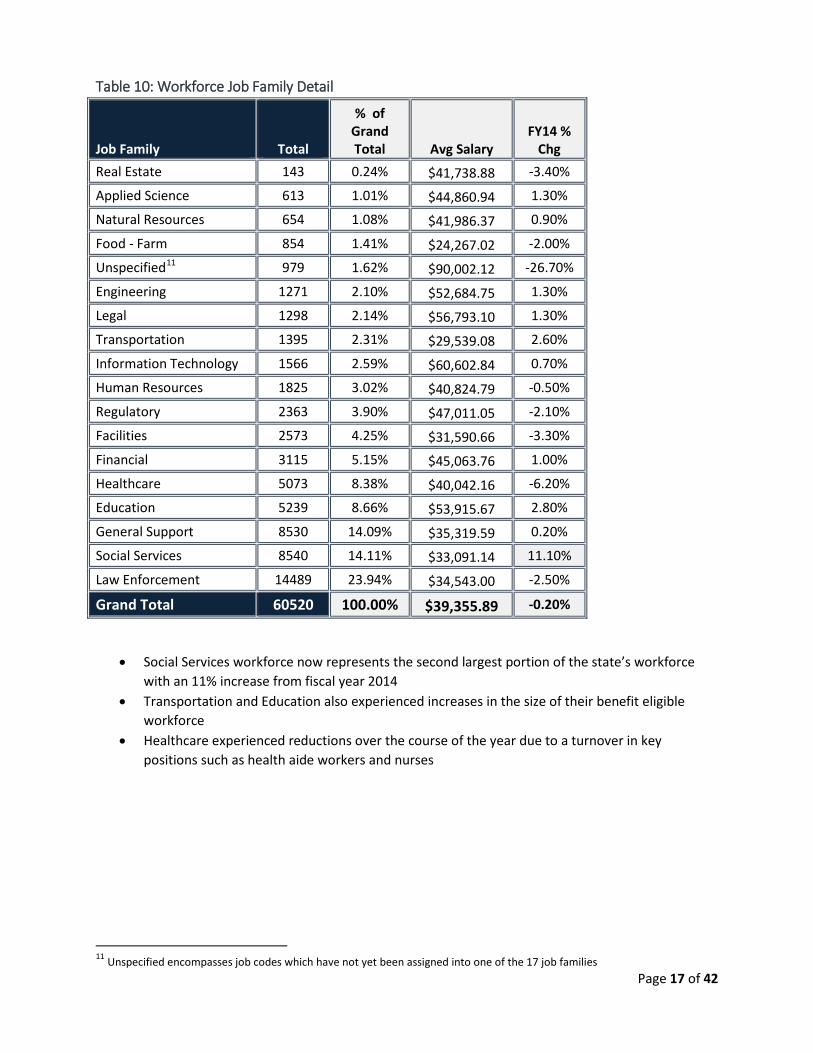
Table 10: Workforce Job Family Detail
Job Family Total
% of Grand Total Avg Salary
FY14 % Chg
Real Estate 143 0.24% $41,738.88 -3.40%
Applied Science 613 1.01% $44,860.94 1.30%
Natural Resources 654 1.08% $41,986.37 0.90%
Food - Farm 854 1.41% $24,267.02 -2.00%
Unspecified11 979 1.62% $90,002.12 -26.70%
Engineering 1271 2.10% $52,684.75 1.30%
Legal 1298 2.14% $56,793.10 1.30%
Transportation 1395 2.31% $29,539.08 2.60%
Information Technology 1566 2.59% $60,602.84 0.70%
Human Resources 1825 3.02% $40,824.79 -0.50%
Regulatory 2363 3.90% $47,011.05 -2.10%
Facilities 2573 4.25% $31,590.66 -3.30%
Financial 3115 5.15% $45,063.76 1.00%
Healthcare 5073 8.38% $40,042.16 -6.20%
Education 5239 8.66% $53,915.67 2.80%
General Support 8530 14.09% $35,319.59 0.20%
Social Services 8540 14.11% $33,091.14 11.10%
Law Enforcement 14489 23.94% $34,543.00 -2.50%
Grand Total 60520 100.00% $39,355.89 -0.20%
• Social Services workforce now represents the second largest portion of the state’s workforce
with an 11% increase from fiscal year 2014 • Transportation and Education also experienced increases in the size of their benefit eligible
workforce • Healthcare experienced reductions over the course of the year due to a turnover in key
positions such as health aide workers and nurses
11 Unspecified encompasses job codes which have not yet been assigned into one of the 17 job families
Page 18 of 42
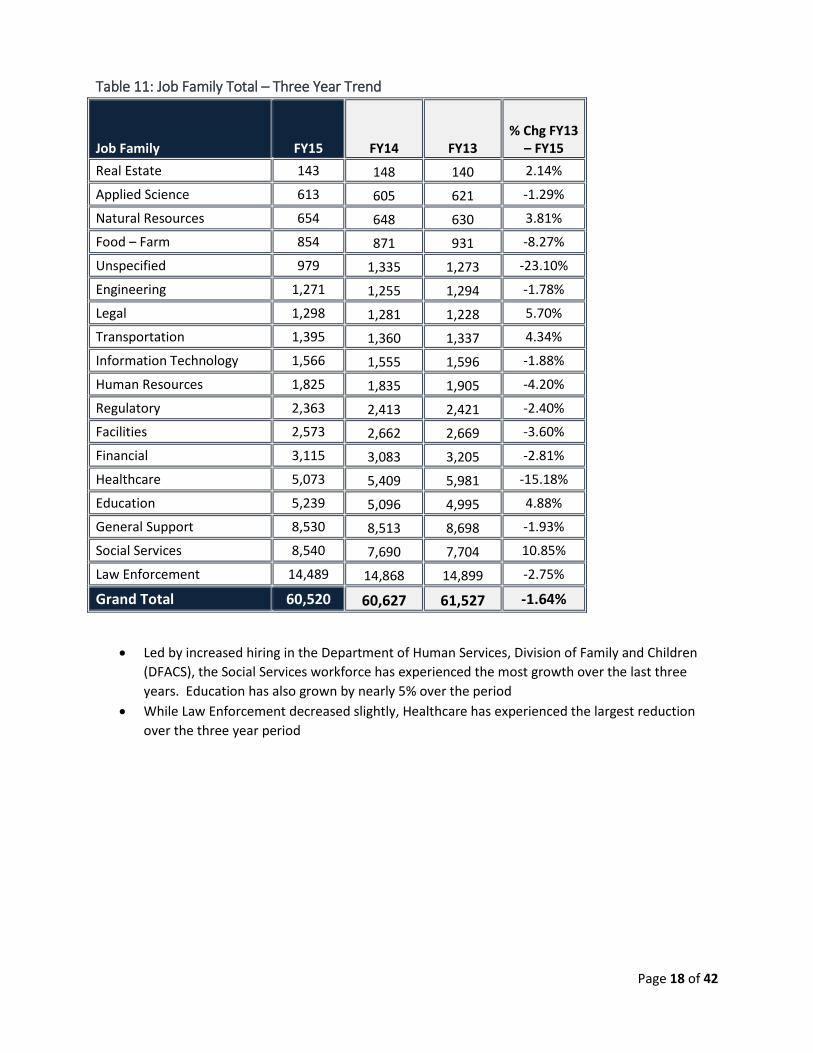
Table 11: Job Family Total – Three Year Trend
Job Family FY15 FY14 FY13 % Chg FY13
– FY15 Real Estate 143 148 140 2.14%
Applied Science 613 605 621 -1.29%
Natural Resources 654 648 630 3.81%
Food – Farm 854 871 931 -8.27%
Unspecified 979 1,335 1,273 -23.10%
Engineering 1,271 1,255 1,294 -1.78%
Legal 1,298 1,281 1,228 5.70%
Transportation 1,395 1,360 1,337 4.34%
Information Technology 1,566 1,555 1,596 -1.88%
Human Resources 1,825 1,835 1,905 -4.20%
Regulatory 2,363 2,413 2,421 -2.40%
Facilities 2,573 2,662 2,669 -3.60%
Financial 3,115 3,083 3,205 -2.81%
Healthcare 5,073 5,409 5,981 -15.18%
Education 5,239 5,096 4,995 4.88%
General Support 8,530 8,513 8,698 -1.93%
Social Services 8,540 7,690 7,704 10.85%
Law Enforcement 14,489 14,868 14,899 -2.75%
Grand Total 60,520 60,627 61,527 -1.64%
• Led by increased hiring in the Department of Human Services, Division of Family and Children (DFACS), the Social Services workforce has experienced the most growth over the last three years. Education has also grown by nearly 5% over the period
• While Law Enforcement decreased slightly, Healthcare has experienced the largest reduction over the three year period

Page 19 of 42
Table 12: Most Populous Jobs Three Year Trend
Job Title FY15 FY14 FY13 % Chg FY13
to FY15 Corrections Officer (WL) 6664 6989 7721 -13.69%
Corrections Officer (SP) 1743 1689 1067 63.36%
Technical Instructor 1677 1672 1637 2.44%
Clerk (WL) 1647 1679 1869 -11.88%
Economic Support Spec (WL) 1560 1126 1136 37.32%
Protect & Placement Spec (WL) 1531 1386 1386 10.46%
Probation /Parole Officer (WL) 1165 1208 1182 -1.44%
Clerk (AL) 1030 1012 1019 1.08%
Health Aide (WL) 930 959 1074 -13.41%
Economic Support Spec (AL) 755 790 880 -14.20%
Secretary (AL) 608 623 683 -10.98%
Financial Ops Gen (AL) 553 569 610 -9.34%
Beh. Health/Counselor (WL) 520 527 553 -5.97%
Protect & Placement Spec (SP) 464 394 387 19.90%
Protect & Placement Spec (EL) 462 266 152 203.95%
MG1: Business Operations 425 385 348 22.13%
Registered Nurse (WL) 419 498 554 -24.37%
Office Admin Generalist WL 388 244 481 -19.33%
General Core Instructor 378 375 368 2.72%
Business Op Generalist (AL) 373 369 373 0.00%
• Over the last three years more supervisory Corrections Officer positions were filled while fewer working level positions have been replaced
• Social Services positions have experienced significant growth over the period: Entry level Protect & Placement Specialists (203%), Economic Support Specialists (37%), supervisory Protect & Placement Specialists (19%), and working level Protect & Placement Specialists (10%)
• Working level Registered Nurses experienced the most reductions at 24% over the three year period
Page 20 of 42
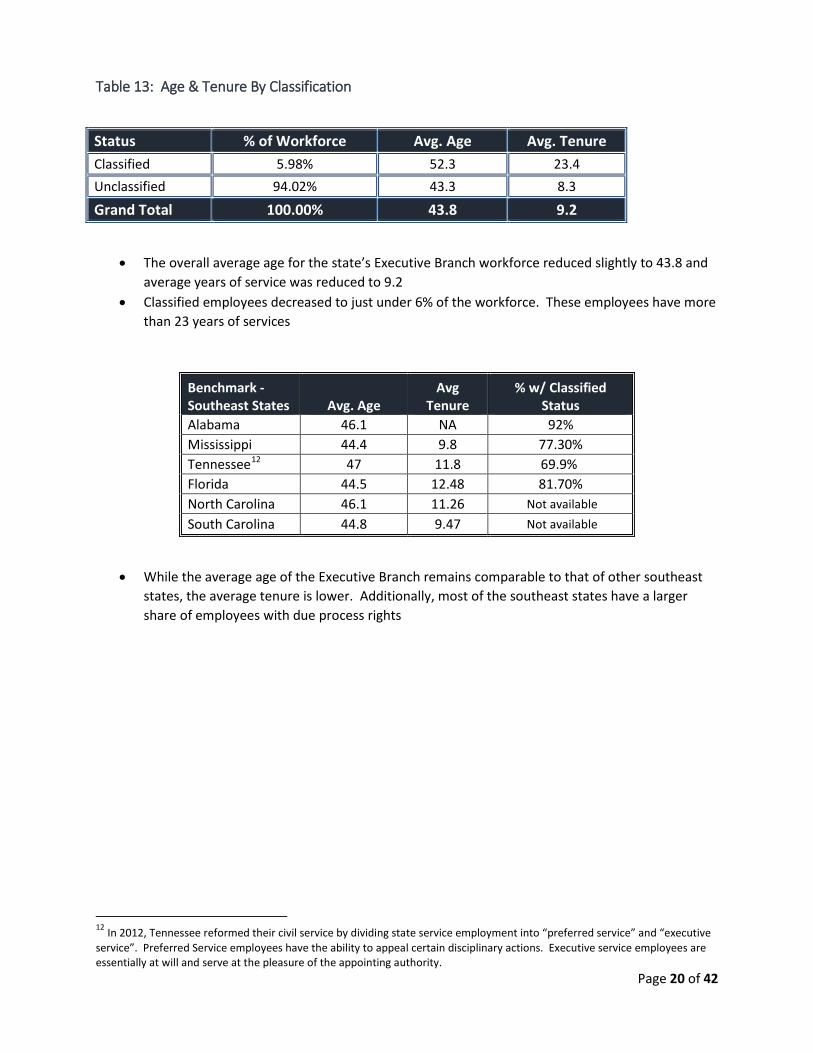
Table 13: Age & Tenure By Classification
Status % of Workforce Avg. Age Avg. Tenure Classified 5.98% 52.3 23.4 Unclassified 94.02% 43.3 8.3
Grand Total 100.00% 43.8 9.2
• The overall average age for the state’s Executive Branch workforce reduced slightly to 43.8 and average years of service was reduced to 9.2
• Classified employees decreased to just under 6% of the workforce. These employees have more than 23 years of services
Benchmark - Southeast States Avg. Age
Avg Tenure
% w/ Classified Status
Alabama 46.1 NA 92% Mississippi 44.4 9.8 77.30% Tennessee12 47 11.8 69.9% Florida 44.5 12.48 81.70% North Carolina 46.1 11.26 Not available South Carolina 44.8 9.47 Not available
• While the average age of the Executive Branch remains comparable to that of other southeast states, the average tenure is lower. Additionally, most of the southeast states have a larger share of employees with due process rights
12 In 2012, Tennessee reformed their civil service by dividing state service employment into “preferred service” and “executive service”. Preferred Service employees have the ability to appeal certain disciplinary actions. Executive service employees are essentially at will and serve at the pleasure of the appointing authority.
Page 21 of 42
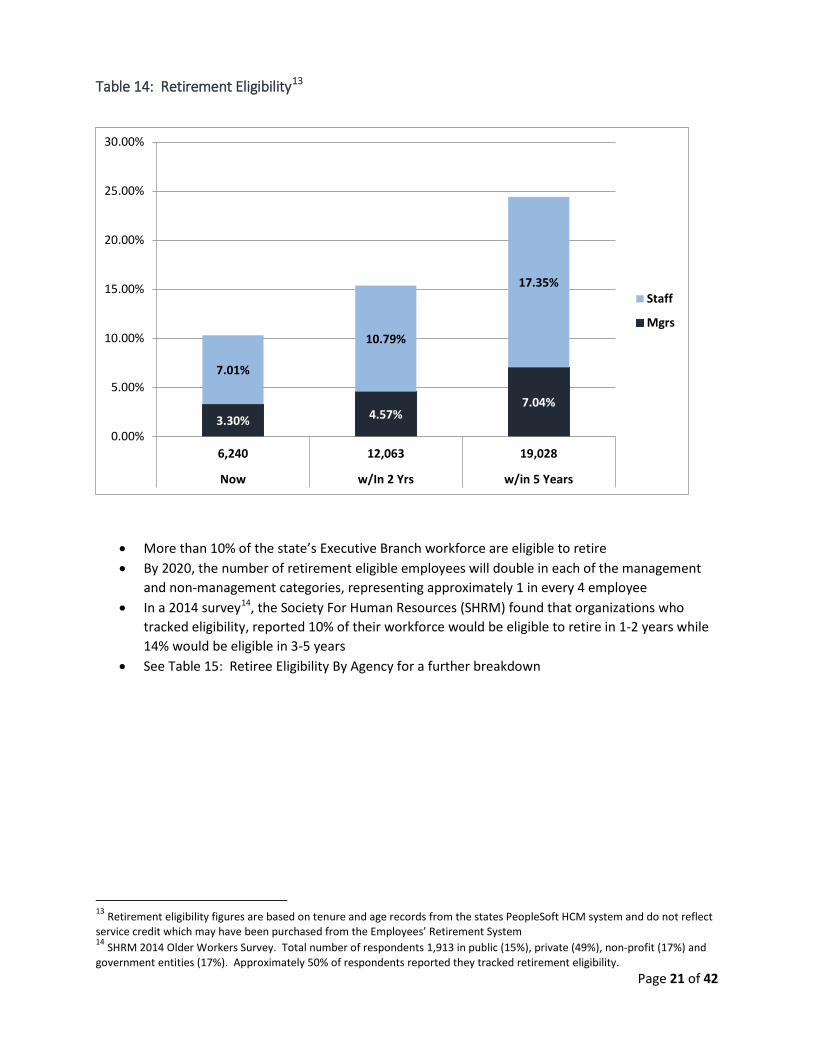
Table 14: Retirement Eligibility13
• More than 10% of the state’s Executive Branch workforce are eligible to retire • By 2020, the number of retirement eligible employees will double in each of the management
and non-management categories, representing approximately 1 in every 4 employee • In a 2014 survey14, the Society For Human Resources (SHRM) found that organizations who
tracked eligibility, reported 10% of their workforce would be eligible to retire in 1-2 years while 14% would be eligible in 3-5 years
• See Table 15: Retiree Eligibility By Agency for a further breakdown
13 Retirement eligibility figures are based on tenure and age records from the states PeopleSoft HCM system and do not reflect service credit which may have been purchased from the Employees’ Retirement System 14 SHRM 2014 Older Workers Survey. Total number of respondents 1,913 in public (15%), private (49%), non-profit (17%) and government entities (17%). Approximately 50% of respondents reported they tracked retirement eligibility.
3.30% 4.57% 7.04%
7.01%
10.79%
17.35%
0.00%
5.00%
10.00%
15.00%
20.00%
25.00%
30.00%
6,240 12,063 19,028
Now w/In 2 Yrs w/in 5 Years
Staff
Mgrs
Page 22 of 42
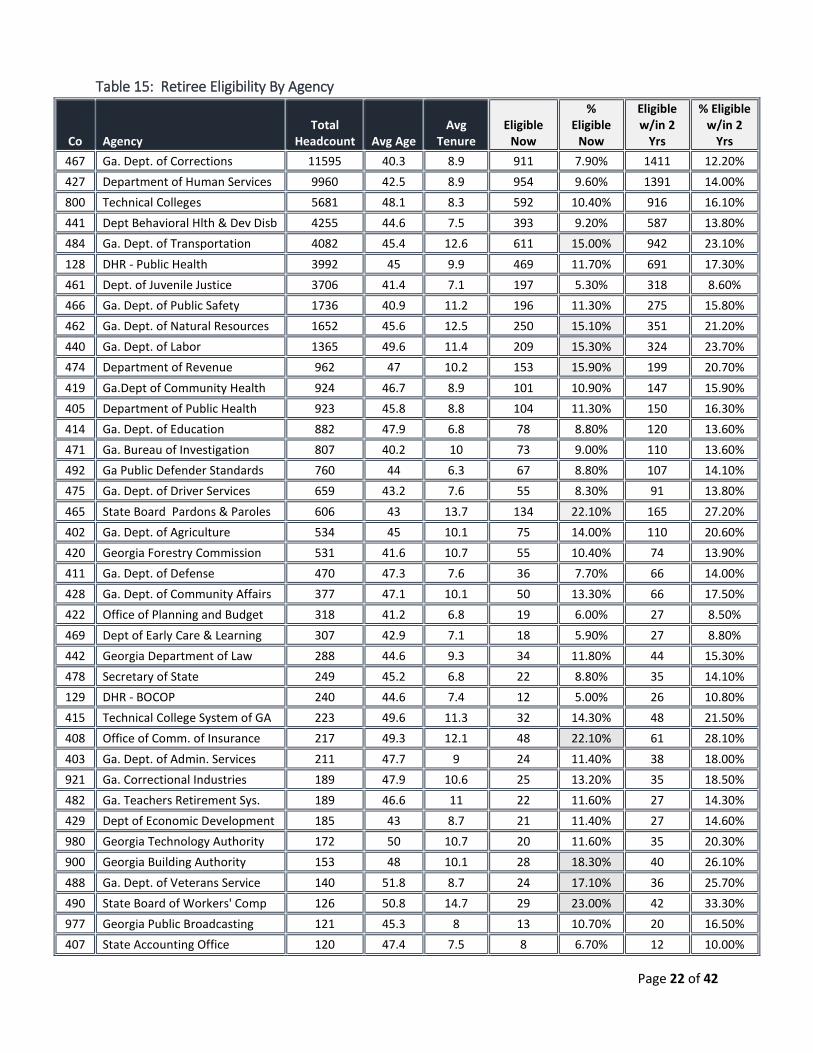
Table 15: Retiree Eligibility By Agency
Co Agency Total
Headcount Avg Age Avg
Tenure Eligible
Now
% Eligible
Now
Eligible w/in 2
Yrs
% Eligible w/in 2
Yrs 467 Ga. Dept. of Corrections 11595 40.3 8.9 911 7.90% 1411 12.20% 427 Department of Human Services 9960 42.5 8.9 954 9.60% 1391 14.00% 800 Technical Colleges 5681 48.1 8.3 592 10.40% 916 16.10% 441 Dept Behavioral Hlth & Dev Disb 4255 44.6 7.5 393 9.20% 587 13.80% 484 Ga. Dept. of Transportation 4082 45.4 12.6 611 15.00% 942 23.10% 128 DHR - Public Health 3992 45 9.9 469 11.70% 691 17.30% 461 Dept. of Juvenile Justice 3706 41.4 7.1 197 5.30% 318 8.60% 466 Ga. Dept. of Public Safety 1736 40.9 11.2 196 11.30% 275 15.80% 462 Ga. Dept. of Natural Resources 1652 45.6 12.5 250 15.10% 351 21.20% 440 Ga. Dept. of Labor 1365 49.6 11.4 209 15.30% 324 23.70% 474 Department of Revenue 962 47 10.2 153 15.90% 199 20.70% 419 Ga.Dept of Community Health 924 46.7 8.9 101 10.90% 147 15.90% 405 Department of Public Health 923 45.8 8.8 104 11.30% 150 16.30% 414 Ga. Dept. of Education 882 47.9 6.8 78 8.80% 120 13.60% 471 Ga. Bureau of Investigation 807 40.2 10 73 9.00% 110 13.60% 492 Ga Public Defender Standards 760 44 6.3 67 8.80% 107 14.10% 475 Ga. Dept. of Driver Services 659 43.2 7.6 55 8.30% 91 13.80% 465 State Board Pardons & Paroles 606 43 13.7 134 22.10% 165 27.20% 402 Ga. Dept. of Agriculture 534 45 10.1 75 14.00% 110 20.60% 420 Georgia Forestry Commission 531 41.6 10.7 55 10.40% 74 13.90% 411 Ga. Dept. of Defense 470 47.3 7.6 36 7.70% 66 14.00% 428 Ga. Dept. of Community Affairs 377 47.1 10.1 50 13.30% 66 17.50% 422 Office of Planning and Budget 318 41.2 6.8 19 6.00% 27 8.50% 469 Dept of Early Care & Learning 307 42.9 7.1 18 5.90% 27 8.80% 442 Georgia Department of Law 288 44.6 9.3 34 11.80% 44 15.30% 478 Secretary of State 249 45.2 6.8 22 8.80% 35 14.10% 129 DHR - BOCOP 240 44.6 7.4 12 5.00% 26 10.80% 415 Technical College System of GA 223 49.6 11.3 32 14.30% 48 21.50% 408 Office of Comm. of Insurance 217 49.3 12.1 48 22.10% 61 28.10% 403 Ga. Dept. of Admin. Services 211 47.7 9 24 11.40% 38 18.00% 921 Ga. Correctional Industries 189 47.9 10.6 25 13.20% 35 18.50% 482 Ga. Teachers Retirement Sys. 189 46.6 11 22 11.60% 27 14.30% 429 Dept of Economic Development 185 43 8.7 21 11.40% 27 14.60% 980 Georgia Technology Authority 172 50 10.7 20 11.60% 35 20.30% 900 Georgia Building Authority 153 48 10.1 28 18.30% 40 26.10% 488 Ga. Dept. of Veterans Service 140 51.8 8.7 24 17.10% 36 25.70% 490 State Board of Workers' Comp 126 50.8 14.7 29 23.00% 42 33.30% 977 Georgia Public Broadcasting 121 45.3 8 13 10.70% 20 16.50% 407 State Accounting Office 120 47.4 7.5 8 6.70% 12 10.00%
Page 23 of 42
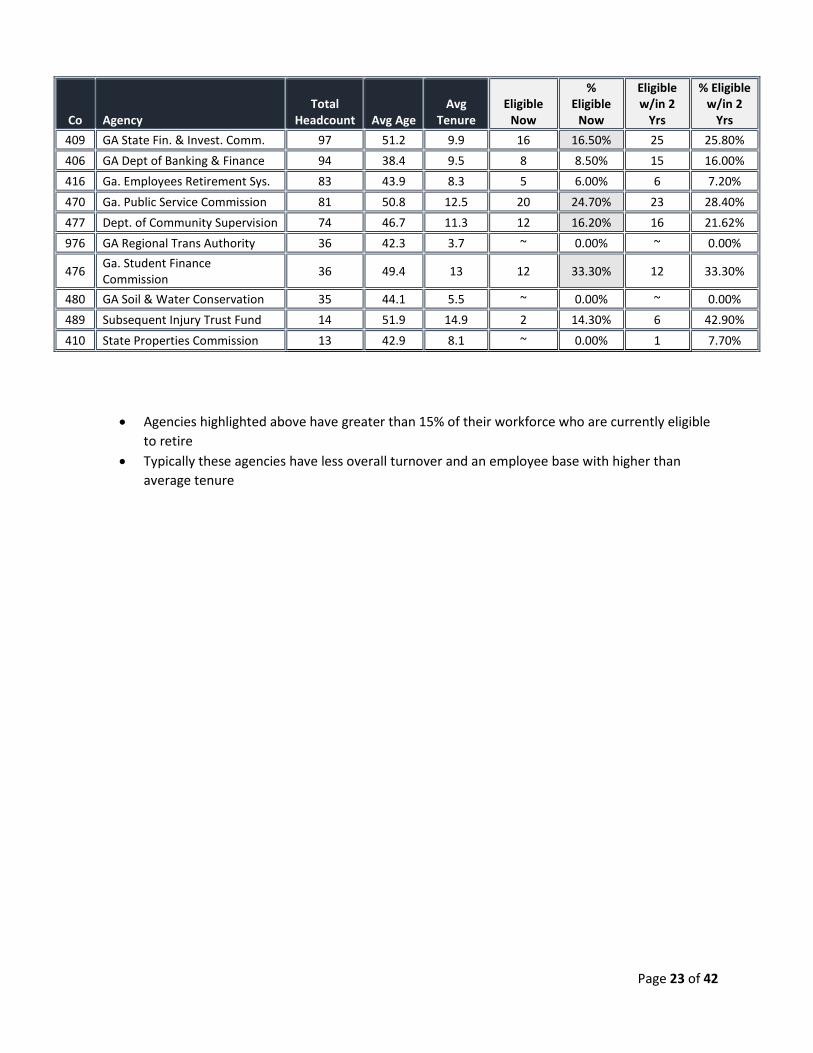
Co Agency Total
Headcount Avg Age Avg
Tenure Eligible
Now
% Eligible
Now
Eligible w/in 2
Yrs
% Eligible w/in 2
Yrs 409 GA State Fin. & Invest. Comm. 97 51.2 9.9 16 16.50% 25 25.80% 406 GA Dept of Banking & Finance 94 38.4 9.5 8 8.50% 15 16.00% 416 Ga. Employees Retirement Sys. 83 43.9 8.3 5 6.00% 6 7.20% 470 Ga. Public Service Commission 81 50.8 12.5 20 24.70% 23 28.40% 477 Dept. of Community Supervision 74 46.7 11.3 12 16.20% 16 21.62% 976 GA Regional Trans Authority 36 42.3 3.7 ~ 0.00% ~ 0.00%
476 Ga. Student Finance Commission 36 49.4 13 12 33.30% 12 33.30%
480 GA Soil & Water Conservation 35 44.1 5.5 ~ 0.00% ~ 0.00% 489 Subsequent Injury Trust Fund 14 51.9 14.9 2 14.30% 6 42.90% 410 State Properties Commission 13 42.9 8.1 ~ 0.00% 1 7.70%
• Agencies highlighted above have greater than 15% of their workforce who are currently eligible to retire
• Typically these agencies have less overall turnover and an employee base with higher than average tenure
Page 24 of 42
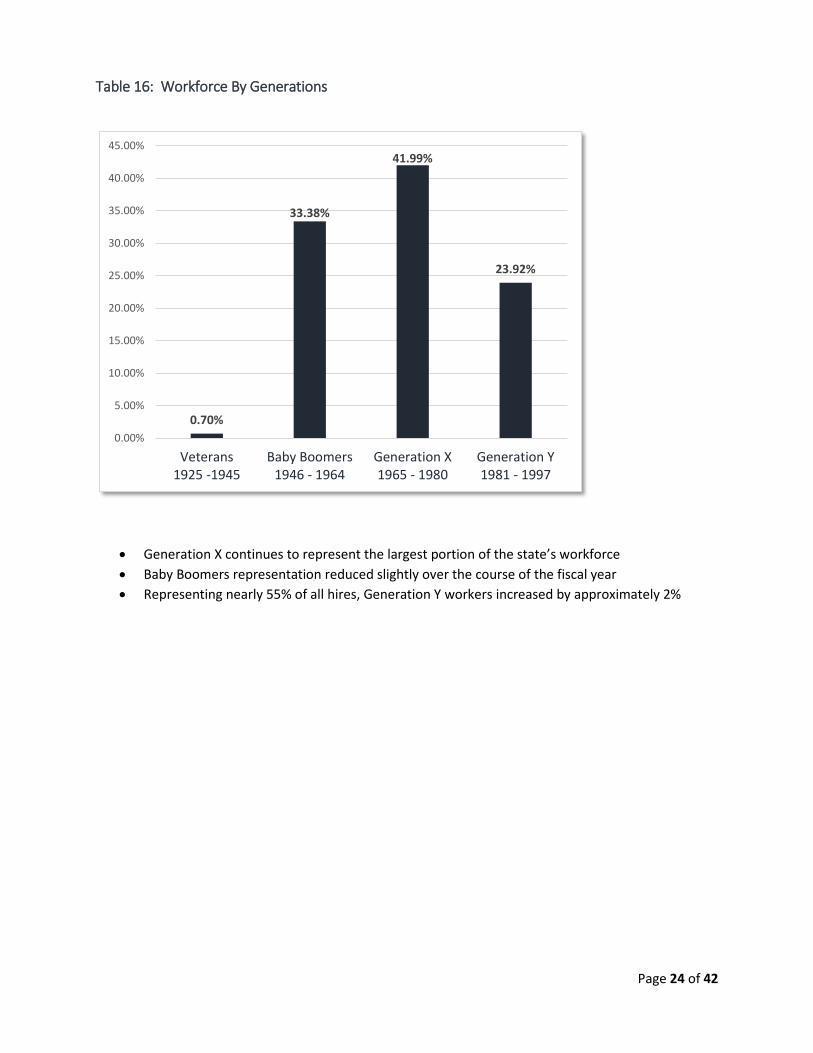
Table 16: Workforce By Generations
• Generation X continues to represent the largest portion of the state’s workforce • Baby Boomers representation reduced slightly over the course of the fiscal year • Representing nearly 55% of all hires, Generation Y workers increased by approximately 2%
0.70%
33.38%
41.99%
23.92%
0.00%
5.00%
10.00%
15.00%
20.00%
25.00%
30.00%
35.00%
40.00%
45.00%
Veterans1925 -1945
Baby Boomers1946 - 1964
Generation X1965 - 1980
Generation Y1981 - 1997
Page 25 of 42
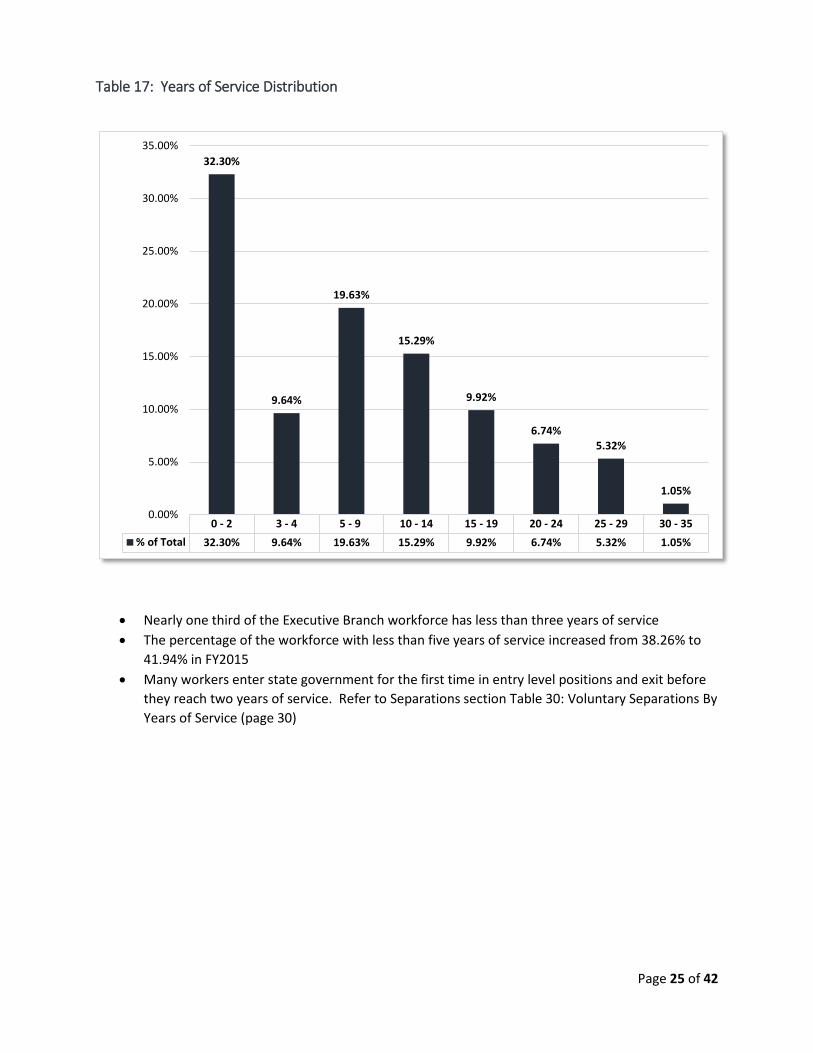
Table 17: Years of Service Distribution
• Nearly one third of the Executive Branch workforce has less than three years of service • The percentage of the workforce with less than five years of service increased from 38.26% to
41.94% in FY2015 • Many workers enter state government for the first time in entry level positions and exit before
they reach two years of service. Refer to Separations section Table 30: Voluntary Separations By Years of Service (page 30)
0 - 2 3 - 4 5 - 9 10 - 14 15 - 19 20 - 24 25 - 29 30 - 35% of Total 32.30% 9.64% 19.63% 15.29% 9.92% 6.74% 5.32% 1.05%
32.30%
9.64%
19.63%
15.29%
9.92%
6.74% 5.32%
1.05%
0.00%
5.00%
10.00%
15.00%
20.00%
25.00%
30.00%
35.00%

Page 26 of 42
T A L E N T A C Q U I S I T I O N Table 18: Hiring Activity By Category
• The Executive branch workforce saw increased hiring and transfers among employees in state government entities during FY2015
Table 19: Hires By Generation
• A majority of all hires to the Executive Branch workforce were Generation Y employees. Many of these workers are first time hires to state government and are filling some of the most challenging entry levels jobs in Law Enforcement, Social Services and Healthcare
9386
1636 859
8245
1568
663
0
1000
2000
3000
4000
5000
6000
7000
8000
9000
10000
Hires Rehires Transfers
FY15 FY14
13%
32% 55%
0%
Baby Boomers Generation X Generation Y Veterans
Page 27 of 42
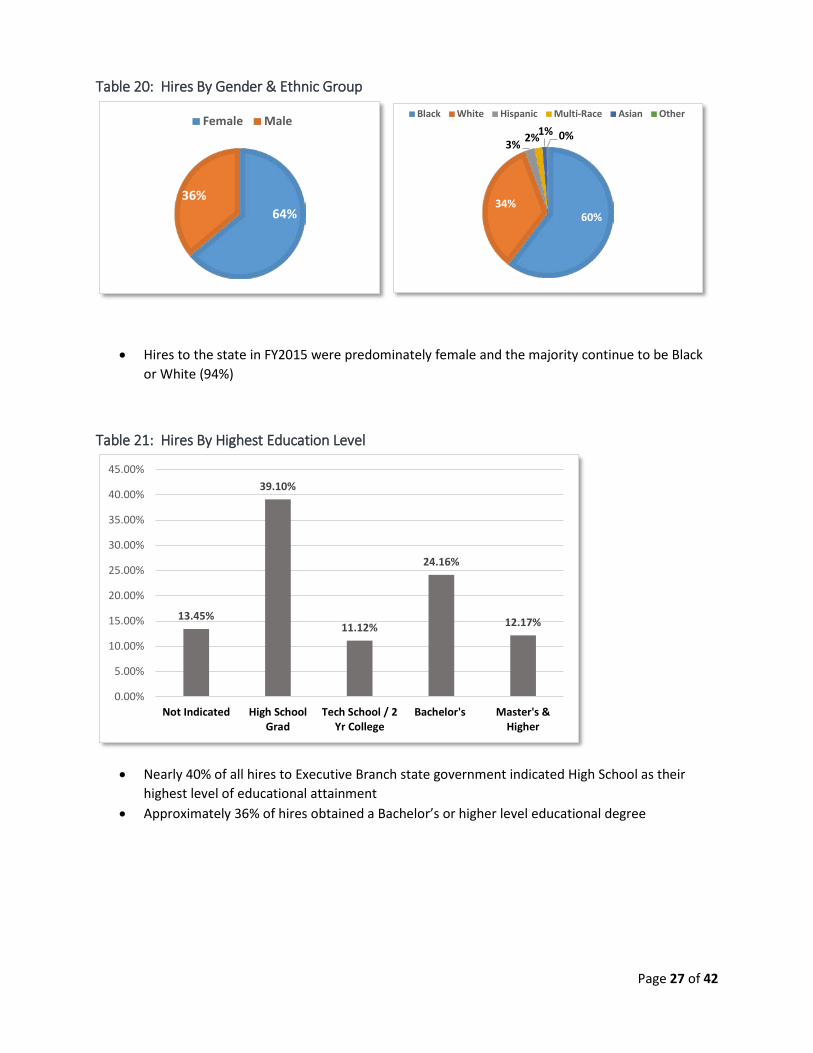
Table 20: Hires By Gender & Ethnic Group
• Hires to the state in FY2015 were predominately female and the majority continue to be Black or White (94%)
Table 21: Hires By Highest Education Level
• Nearly 40% of all hires to Executive Branch state government indicated High School as their highest level of educational attainment
• Approximately 36% of hires obtained a Bachelor’s or higher level educational degree
64% 36%
Female Male
60% 34%
3% 2% 1% 0%
Black White Hispanic Multi-Race Asian Other
13.45%
39.10%
11.12%
24.16%
12.17%
0.00%
5.00%
10.00%
15.00%
20.00%
25.00%
30.00%
35.00%
40.00%
45.00%
Not Indicated High SchoolGrad
Tech School / 2Yr College
Bachelor's Master's &Higher

Page 28 of 42
Table 22: Hires By Job Family Three Year Trend
Job Family FY15 FY14 FY13 % Chg FY13
to FY15
Law Enforcement 30.23% 35.96% 39.14% -22.76%
Social Services 20.53% 13.11% 10.59% 93.88%
Healthcare 11.48% 12.99% 14.29% -19.68%
General Support 10.30% 10.50% 9.46% 8.85%
Education 6.88% 7.11% 6.99% -1.61%
Facilities 3.67% 4.39% 3.04% 20.57%
Financial 2.59% 2.15% 2.43% 6.78%
Transportation 2.22% 0.63% 0.58% 283.25%
Regulatory 2.07% 2.24% 1.74% 18.88%
Food - Farm 2.02% 2.19% 1.92% 5.38%
Human Resources 1.62% 1.33% 1.76% -7.73%
Legal 1.62% 1.70% 1.96% -17.14%
Information Technology 1.56% 1.45% 1.69% -7.66%
Engineering 1.21% 0.90% 1.07% 12.77%
Natural Resources 0.83% 1.19% 1.26% -34.47%
Unspecified 0.64% 1.48% 1.40% -54.64%
Applied Science 0.39% 0.49% 0.51% -23.50%
Real Estate 0.15% 0.18% 0.14% 3.69%
• As hiring has picked up in Social Services over the last few years, Law Enforcement’s overall portion in hiring activity has decreased
• Healthcare hiring has also continued to decrease, in part due to reductions in force over the last three years

Page 29 of 42
Table 23: Top Jobs Filled in 2015 - Three Year Trend
Job Title FY15 FY14 FY13
FY13 to FY15 %
Chg
Corrections Officer(WL) 2723 2,832 2858 -4.7%
Economic Support Spec (WL) 803 310 184 336.4%
Protect & Placement Spec(WL) 475 298 283 67.8%
Protect & Placement Spec(EL) 470 191 137 243.1%
Health Aide (WL) 442 429 369 19.8%
Clerk (WL) 324 206 157 106.4%
Technical Instructor 242 229 179 35.2%
Transp /Construction Wkr (EL) 226 42 43 425.6%
Probation / Parole Officer (WL) 170 174 182 -6.6%
Registered Nurse (WL) 163 229 204 -20.1%
Protect & Placement Spec (AL) 121 99 83 45.8%
Clerk (AL) 120 96 59 103.4%
Food Svc Operation Wkr (SP) 113 119 91 24.2%
Lic Prac Nurse (WL) 93 112 148 -37.2%
Driver Examiner (EL) 82 101 74 10.8%
Food Svc Operation Wkr (WL) 82 67 64 28.1%
Housekeeper (EL) 77 89 68 13.2%
Corrections Officer (SP) 73 40 29 151.7%
Legal Officer (WL) 67 69 63 6.3%
Secretary (AL) 64 74 42 52.4%
• Over the last three years, most of the top jobs have experienced increased hiring levels from FY2013 to FY2015
• Licensed Practical Nurses and Registered Nurses have experienced the most reductions over the period
Page 30 of 42
S E P A R A T I O N S
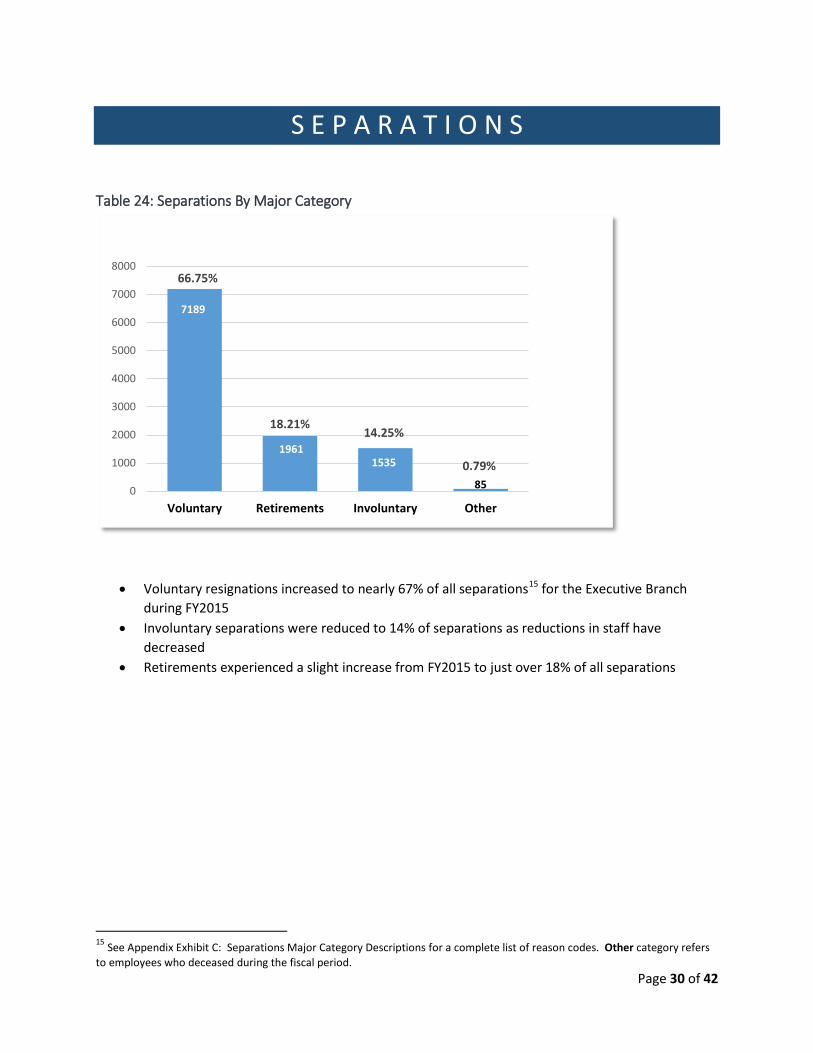
Table 24: Separations By Major Category
• Voluntary resignations increased to nearly 67% of all separations15 for the Executive Branch during FY2015
• Involuntary separations were reduced to 14% of separations as reductions in staff have decreased
• Retirements experienced a slight increase from FY2015 to just over 18% of all separations
15 See Appendix Exhibit C: Separations Major Category Descriptions for a complete list of reason codes. Other category refers to employees who deceased during the fiscal period.
7189
1961 1535
85
66.75%
18.21% 14.25%
0.79%
0
1000
2000
3000
4000
5000
6000
7000
8000
Voluntary Retirements Involuntary Other
Page 31 of 42
Table 25: Voluntary Separations By Years of Service
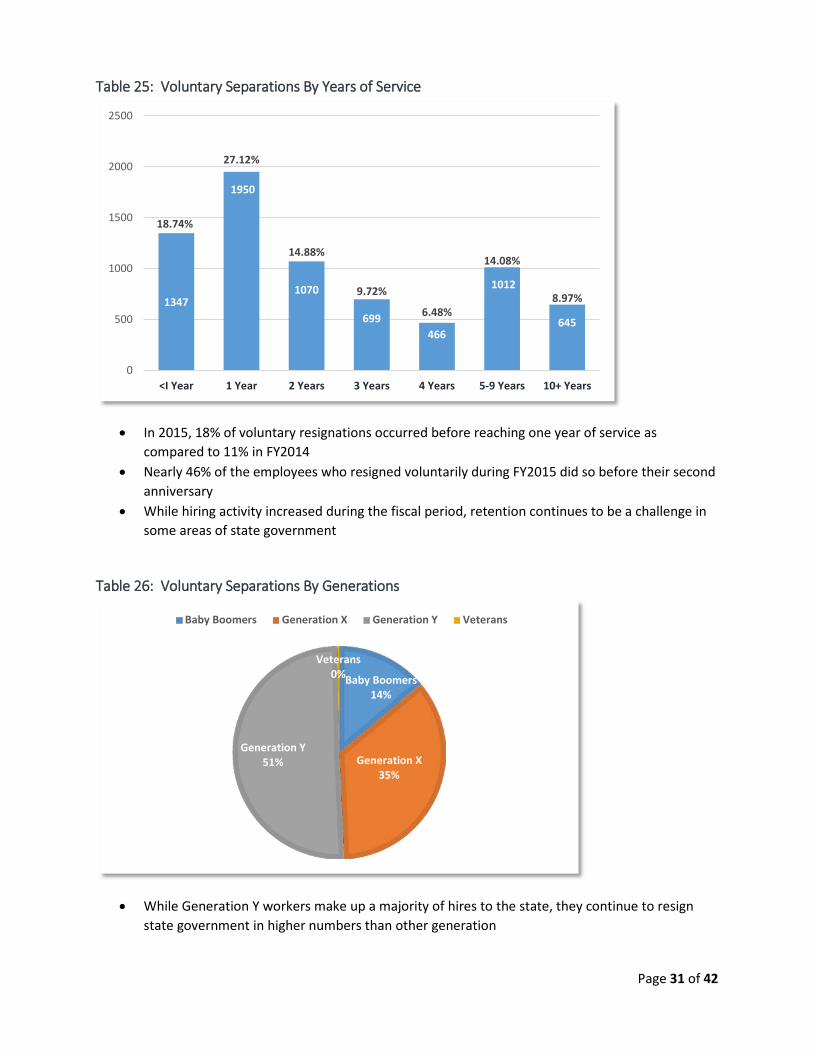
• In 2015, 18% of voluntary resignations occurred before reaching one year of service as compared to 11% in FY2014
• Nearly 46% of the employees who resigned voluntarily during FY2015 did so before their second anniversary
• While hiring activity increased during the fiscal period, retention continues to be a challenge in some areas of state government
Table 26: Voluntary Separations By Generations
• While Generation Y workers make up a majority of hires to the state, they continue to resign state government in higher numbers than other generation
1347
1950
1070
699 466
1012
645
18.74%
27.12%
14.88%
9.72%
6.48%
14.08%
8.97%
0
500
1000
1500
2000
2500
<I Year 1 Year 2 Years 3 Years 4 Years 5-9 Years 10+ Years
Baby Boomers 14%
Generation X 35%
Generation Y 51%
Veterans 0%
Baby Boomers Generation X Generation Y Veterans
Page 32 of 42
Table 27: Job Family Separations/Hires Comparison
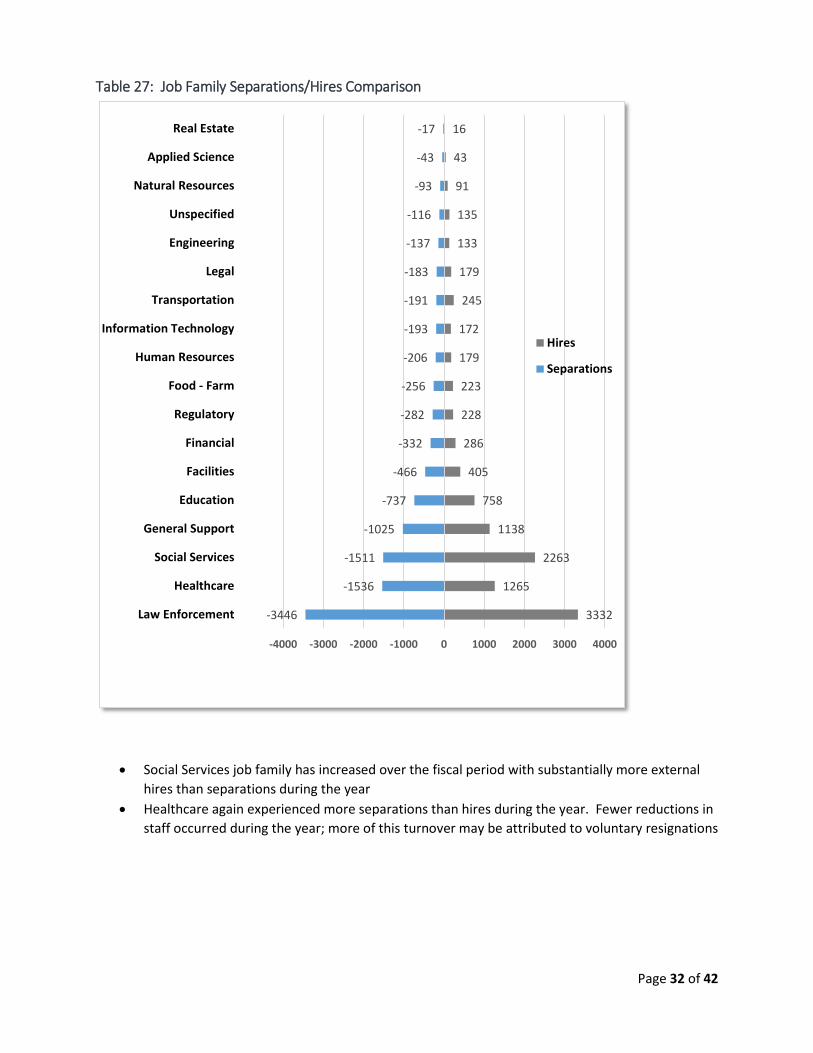
• Social Services job family has increased over the fiscal period with substantially more external hires than separations during the year
• Healthcare again experienced more separations than hires during the year. Fewer reductions in staff occurred during the year; more of this turnover may be attributed to voluntary resignations
-3446
-1536
-1511
-1025
-737
-466
-332
-282
-256
-206
-193
-191
-183
-137
-116
-93
-43
-17
3332
1265
2263
1138
758
405
286
228
223
179
172
245
179
133
135
91
43
16
-4000 -3000 -2000 -1000 0 1000 2000 3000 4000
Law Enforcement
Healthcare
Social Services
General Support
Education
Facilities
Financial
Regulatory
Food - Farm
Human Resources
Information Technology
Transportation
Legal
Engineering
Unspecified
Natural Resources
Applied Science
Real Estate
Hires
Separations
Page 33 of 42
Table 28: Top Separations By Jobs w/Hires Comparison
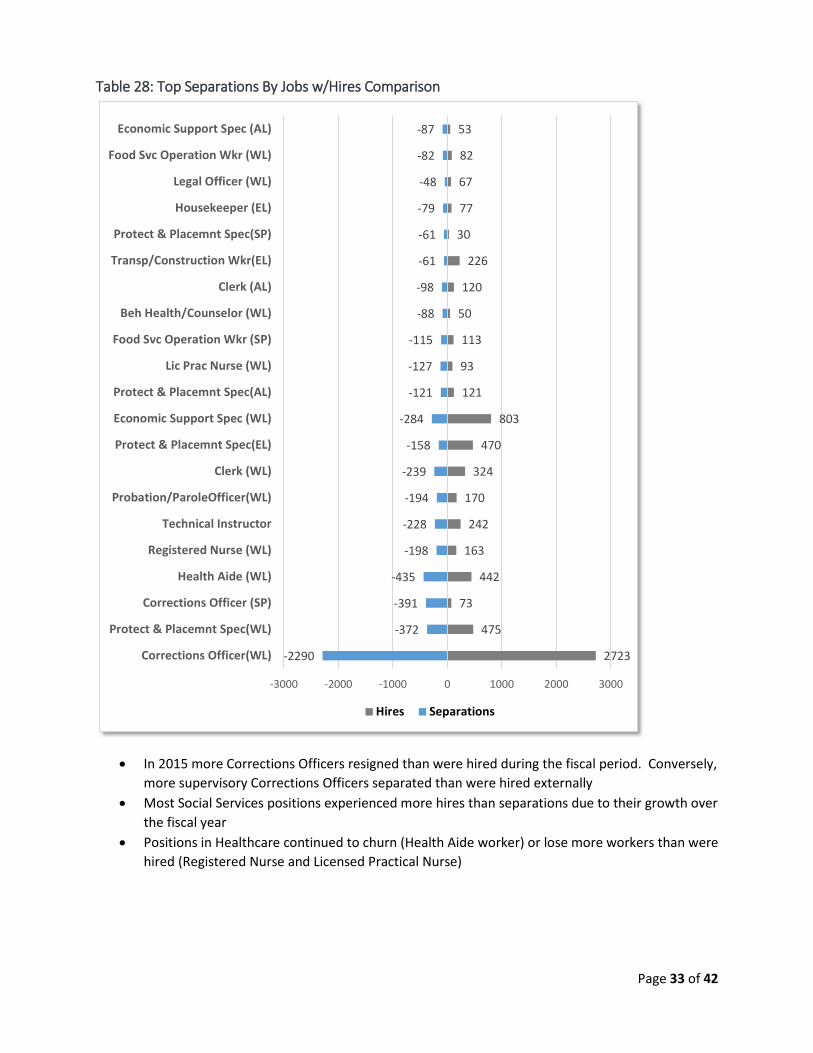
• In 2015 more Corrections Officers resigned than were hired during the fiscal period. Conversely, more supervisory Corrections Officers separated than were hired externally
• Most Social Services positions experienced more hires than separations due to their growth over the fiscal year
• Positions in Healthcare continued to churn (Health Aide worker) or lose more workers than were hired (Registered Nurse and Licensed Practical Nurse)
-2290
-372
-391
-435
-198
-228
-194
-239
-158
-284
-121
-127
-115
-88
-98
-61
-61
-79
-48
-82
-87
2723
475
73
442
163
242
170
324
470
803
121
93
113
50
120
226
30
77
67
82
53
-3000 -2000 -1000 0 1000 2000 3000
Corrections Officer(WL)
Protect & Placemnt Spec(WL)
Corrections Officer (SP)
Health Aide (WL)
Registered Nurse (WL)
Technical Instructor
Probation/ParoleOfficer(WL)
Clerk (WL)
Protect & Placemnt Spec(EL)
Economic Support Spec (WL)
Protect & Placemnt Spec(AL)
Lic Prac Nurse (WL)
Food Svc Operation Wkr (SP)
Beh Health/Counselor (WL)
Clerk (AL)
Transp/Construction Wkr(EL)
Protect & Placemnt Spec(SP)
Housekeeper (EL)
Legal Officer (WL)
Food Svc Operation Wkr (WL)
Economic Support Spec (AL)
Hires Separations
Page 34 of 42
Table 29: Agency Turnover Breakdown
Co ID Entity Involuntary Other Retirement Voluntary
Transfers Out16
Grand Total
Turnover Rate
467 Ga. Dept. of Corrections 235 22 372 2087 99 2815 24.0%
427 Department of Human Services 309 7 301 1050 241 1908 20.0%
441 Dept Behavioral Hlth & Dev Disb 373 9 170 828 66 1446 32.9%
461 Dept. of Juvenile Justice 110 6 58 818 73 1065 29.2%
800 Technical Colleges 87 9 156 474 38 764 13.4%
128 County Public Health 108 3 120 426 48 705 17.6%
484 Ga. Dept. of Transportation 54 4 202 241 20 521 12.6%
466 Ga. Dept. of Public Safety 16 1 73 106 17 213 11.9%
405 Department of Public Health 30 3 29 83 40 185 20.1%
440 Ga. Dept. of Labor 10 2 51 82 14 159 11.5%
462 Ga. Dept. of Natural Resources 10 3 48 81 7 149 9.0%
474 Department of Revenue 18 2 53 55 8 136 13.8%
414 Ga. Dept. of Education 10 1 27 78 13 129 14.5%
419 Ga.Dept of Community Health 19 1 29 63 16 128 14.4%
475 Ga. Dept. of Driver Services 21 22 62 16 121 18.5%
492 Ga Public Defender Council 11 1 17 73 5 107 14.3%
422 Office of Planning and Budget 13 9 49 23 94 25.2%
411 Ga. Dept. of Defense 11 13 60 3 87 18.9%
420 Georgia Forestry Commission 10 19 45 6 80 16.3%
465 State Board Pardons & Paroles 6 25 35 8 74 11.2%
402 Ga. Dept. of Agriculture 6 1 20 34 6 67 12.7%
428 Ga. Dept. of Community Affairs 4 2 10 38 8 62 16.6%
129 DHR - BOCOP 4 5 42 0 51 20.9%
471 Ga. Bureau of Investigation 17 29 3 49 6.3%
478 Secretary of State 10 1 6 21 8 46 19.6%
921 Ga. Correctional Industries 1 2 14 20 2 39 20.7%
442 Georgia Department of Law 6 20 8 34 13.9%
469 Dept of Early Care & Learning 8 5 16 4 33 11.4%
408 Office of Comm. of Insurance 3 1 12 16 0 32 14.2%
403 Ga. Dept. of Admin. Services 1 4 20 6 31 15.0%
900 Georgia Building Authority 8 11 5 4 28 18.3%
415 Technical College System of GA 2 7 8 5 22 9.9%
429 Dept of Economic Development 2 3 17 0 22 11.8%
16 Transfers Out include employees who moved to a different company ID during the fiscal period.
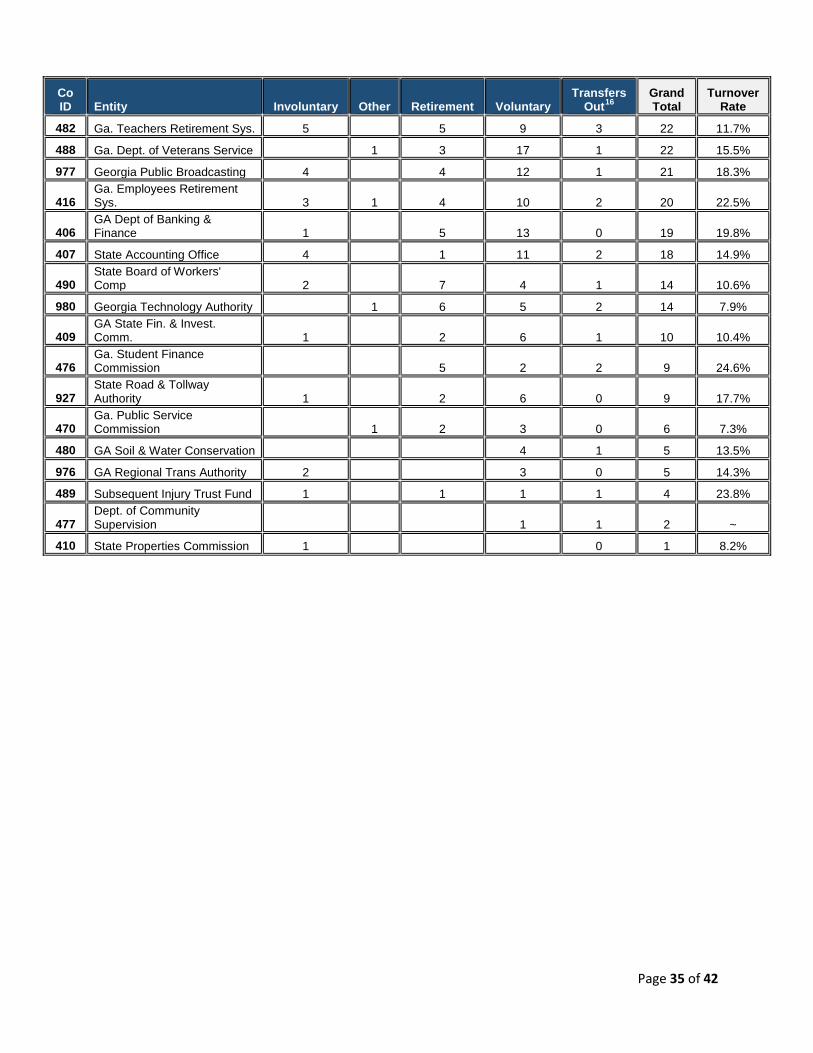
Page 35 of 42
Co ID Entity Involuntary Other Retirement Voluntary
Transfers Out16
Grand Total
Turnover Rate
482 Ga. Teachers Retirement Sys. 5 5 9 3 22 11.7%
488 Ga. Dept. of Veterans Service 1 3 17 1 22 15.5%
977 Georgia Public Broadcasting 4 4 12 1 21 18.3%
416 Ga. Employees Retirement Sys. 3 1 4 10 2 20 22.5%
406 GA Dept of Banking & Finance 1 5 13 0 19 19.8%
407 State Accounting Office 4 1 11 2 18 14.9%
490 State Board of Workers' Comp 2 7 4 1 14 10.6%
980 Georgia Technology Authority 1 6 5 2 14 7.9%
409 GA State Fin. & Invest. Comm. 1 2 6 1 10 10.4%
476 Ga. Student Finance Commission 5 2 2 9 24.6%
927 State Road & Tollway Authority 1 2 6 0 9 17.7%
470 Ga. Public Service Commission 1 2 3 0 6 7.3%
480 GA Soil & Water Conservation 4 1 5 13.5%
976 GA Regional Trans Authority 2 3 0 5 14.3%
489 Subsequent Injury Trust Fund 1 1 1 1 4 23.8%
477 Dept. of Community Supervision 1 1 2 ~
410 State Properties Commission 1 0 1 8.2%
Appendix
Page 37 of 42
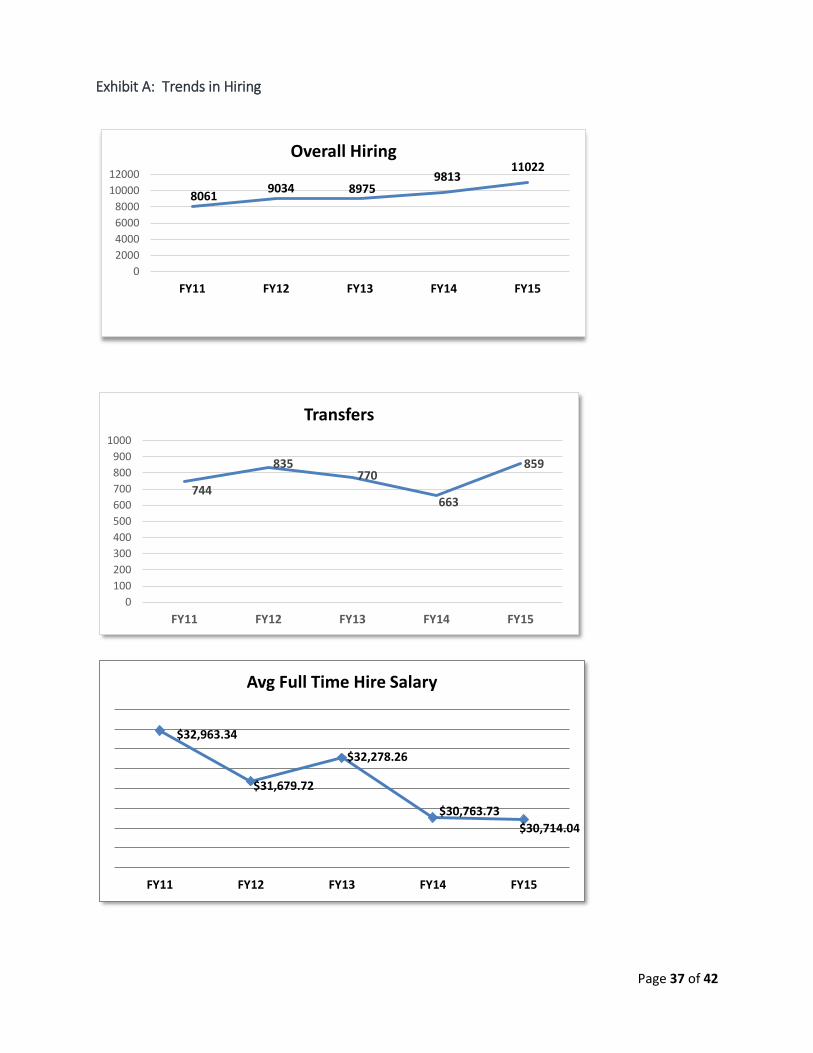
Exhibit A: Trends in Hiring
8061 9034 8975 9813
11022
02000400060008000
1000012000
FY11 FY12 FY13 FY14 FY15
Overall Hiring
744
835 770
663
859
0100200300400500600700800900
1000
FY11 FY12 FY13 FY14 FY15
Transfers
$32,963.34
$31,679.72
$32,278.26
$30,763.73 $30,714.04
FY11 FY12 FY13 FY14 FY15
Avg Full Time Hire Salary
Page 38 of 42
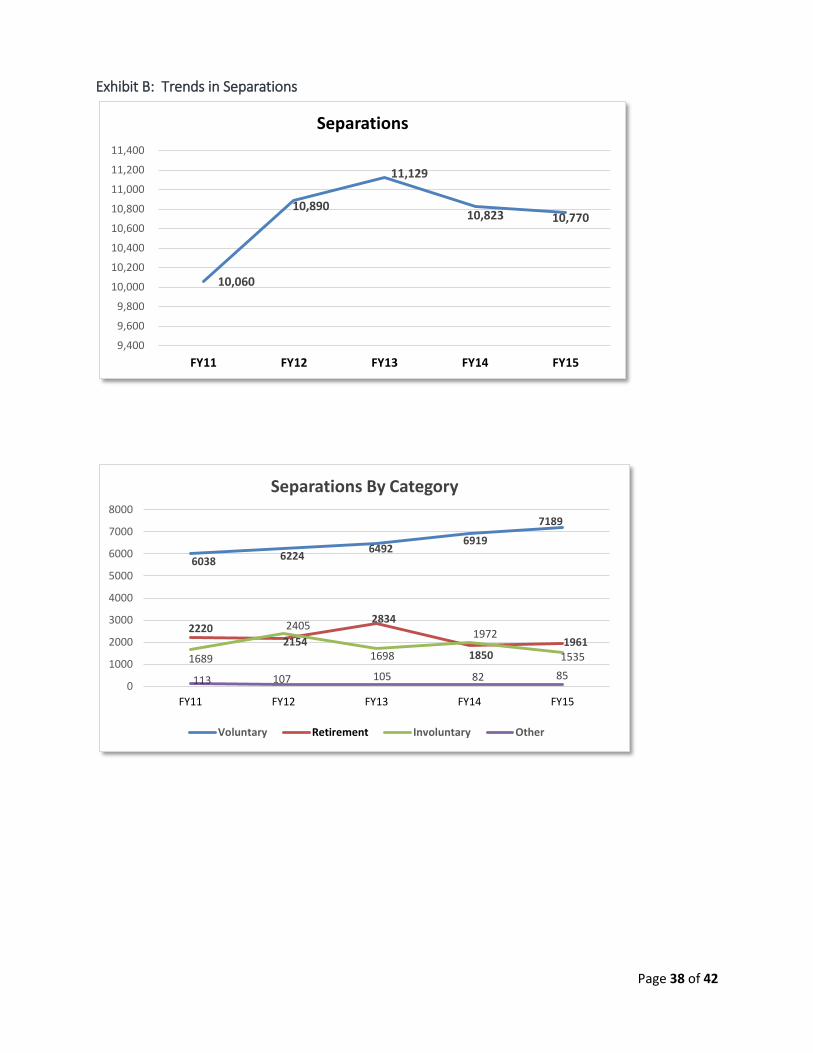
Exhibit B: Trends in Separations
10,060
10,890
11,129
10,823 10,770
9,400
9,600
9,800
10,000
10,200
10,400
10,600
10,800
11,000
11,200
11,400
FY11 FY12 FY13 FY14 FY15
Separations
6038 6224 6492 6919
7189
2220 2154
2834
1850 1961
1689
2405
1698
1972
1535
113 107 105 82 85 0
1000
2000
3000
4000
5000
6000
7000
8000
FY11 FY12 FY13 FY14 FY15
Separations By Category
Voluntary Retirement Involuntary Other
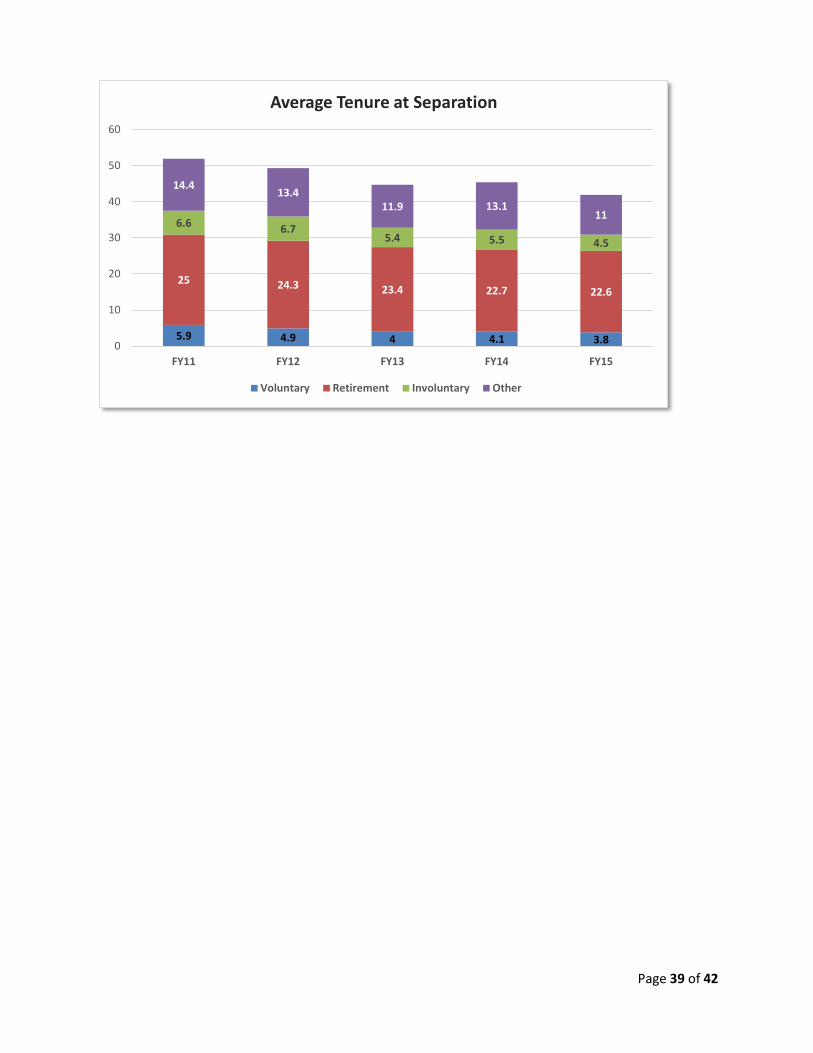
Page 39 of 42
5.9 4.9 4 4.1 3.8
25 24.3 23.4 22.7 22.6
6.6 6.7 5.4 5.5 4.5
14.4 13.4
11.9 13.1 11
0
10
20
30
40
50
60
FY11 FY12 FY13 FY14 FY15
Average Tenure at Separation
Voluntary Retirement Involuntary Other

Page 40 of 42
Exhibit C: Separations Major Category Descriptions Action Reason Description Short Desc Category
OTHER TER DEA Death Death Other TER KLD Killed in Line of Duty KilledDuty Other
INVOLUNTARY
TER ATT Attendance Attendance Involuntary TER CON Misconduct Misconduct Involuntary TER DIS Dismissal Dismissal Involuntary TER DRG Drug Testing Drug Test Involuntary TER MIS Misstatement on Application Misstatemt Involuntary TER NPR No Position Return From Leave Con Leave Involuntary TER RIF Reduction in Force RIF Involuntary TER RLS Release Release Involuntary TER TAR Tardiness Tardiness Involuntary TER UNS Unsatisfactory Performance Unsat Perf Involuntary TER INS Insubordination Insubordin Involuntary TER VIO Violation of Rules Violation Involuntary
RETIREMENT TER RTM Retirement Retirement Retirement
VOLUNTARY
TER CHI Child/House Care Child/Hse Voluntary TER EES Dissatisfied w/Fellow Employee Employees Voluntary TER FAM Family Reasons Family Rsn Voluntary TER FOR Forfeiture of Position Forfeit Voluntary TER HEA Health Reasons Health Voluntary TER HRS Dissatisfied with Hours Hours Voluntary TER ILL Illness in Family Illness Voluntary TER LOC Dissatisfied with Location Location Voluntary TER LVE Failure to Return from Leave Leave Voluntary TER MAR Marriage Marriage Voluntary TER PAY Dissatisfied with Pay Pay Voluntary TER PER Personal Reasons Personal Voluntary TER PLE Paid Leave Exhausted Lv Exhaust Voluntary TER POL Dissatisfied w/Comp. Policies Comp Polic Voluntary TER PRE Presumptive Resignation Presume Voluntary TER PRM Dissatisfied w/Promotion Opps Promo Opps Voluntary TER PSE Private Sector Employment PriSectEmp Voluntary TER PTD Partial/Total Disability Pt/Tot Dis Voluntary TER REF Refused Transfer Refus Xfer Voluntary TER REL Relocation Relocation Voluntary TER RES Resignation Resignatn Voluntary TER RTS Return to School School Voluntary TER SUP Dissatisfied with Supervision Supervisn Voluntary TER TRA Transportation Problems Transportn Voluntary TER TYP Dissatisfied w/Type of Work Work Type Voluntary TER WOR Dissatisfied w/Work Conditions Work Conds Voluntary TER MUT Mutual Consent Mut Consnt Voluntary
Page 41 of 42
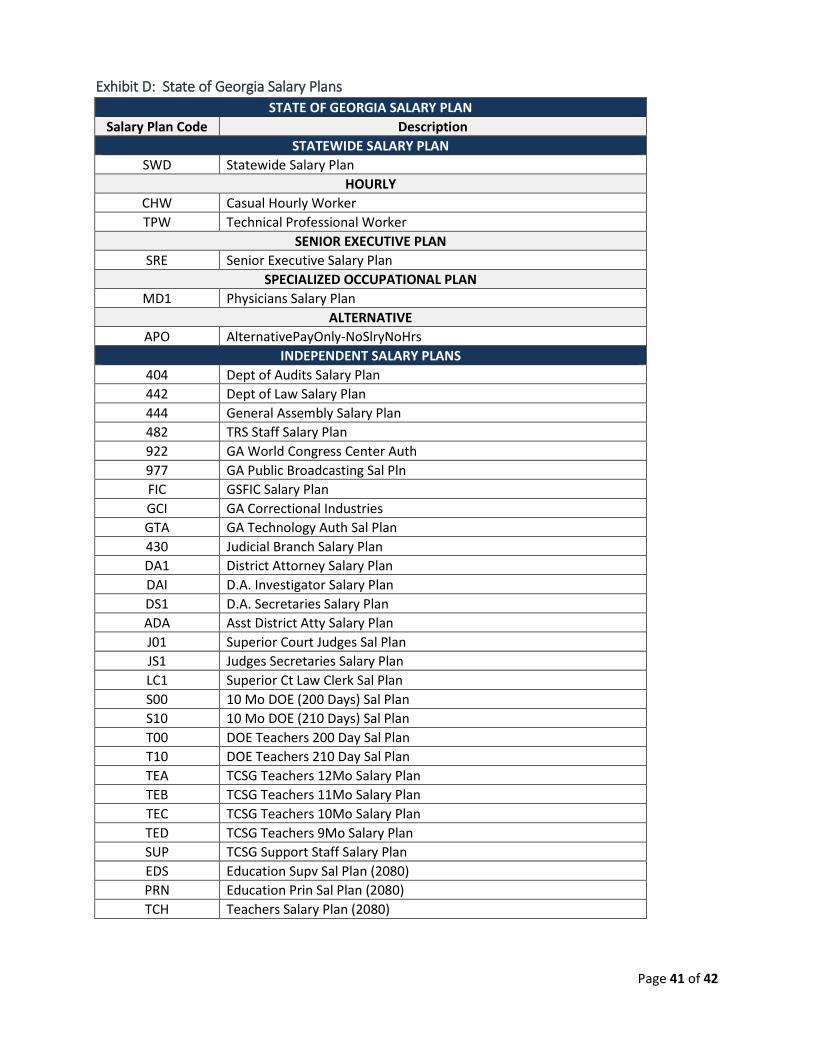
Exhibit D: State of Georgia Salary Plans STATE OF GEORGIA SALARY PLAN
Salary Plan Code Description STATEWIDE SALARY PLAN
SWD Statewide Salary Plan HOURLY
CHW Casual Hourly Worker TPW Technical Professional Worker
SENIOR EXECUTIVE PLAN SRE Senior Executive Salary Plan
SPECIALIZED OCCUPATIONAL PLAN MD1 Physicians Salary Plan
ALTERNATIVE APO AlternativePayOnly-NoSlryNoHrs
INDEPENDENT SALARY PLANS 404 Dept of Audits Salary Plan 442 Dept of Law Salary Plan 444 General Assembly Salary Plan 482 TRS Staff Salary Plan 922 GA World Congress Center Auth 977 GA Public Broadcasting Sal Pln FIC GSFIC Salary Plan GCI GA Correctional Industries GTA GA Technology Auth Sal Plan 430 Judicial Branch Salary Plan DA1 District Attorney Salary Plan DAI D.A. Investigator Salary Plan DS1 D.A. Secretaries Salary Plan ADA Asst District Atty Salary Plan J01 Superior Court Judges Sal Plan JS1 Judges Secretaries Salary Plan LC1 Superior Ct Law Clerk Sal Plan S00 10 Mo DOE (200 Days) Sal Plan S10 10 Mo DOE (210 Days) Sal Plan T00 DOE Teachers 200 Day Sal Plan T10 DOE Teachers 210 Day Sal Plan TEA TCSG Teachers 12Mo Salary Plan TEB TCSG Teachers 11Mo Salary Plan TEC TCSG Teachers 10Mo Salary Plan TED TCSG Teachers 9Mo Salary Plan SUP TCSG Support Staff Salary Plan EDS Education Supv Sal Plan (2080) PRN Education Prin Sal Plan (2080) TCH Teachers Salary Plan (2080)
For inquiries, contact:
Department of Administrative Services
Human Resources Administration Division
200 Piedmont Avenue, West Tower Suite 500
T: 1-877-318-2722 or 404-656-2705