fy2015 presentation
TRANSCRIPT
FY2015 Results Briefing25 February 2016
GAINING MOMENTUM
Financial Highlights Toll Road Operations Report Looking Ahead Question-and-Answer
Agenda
2
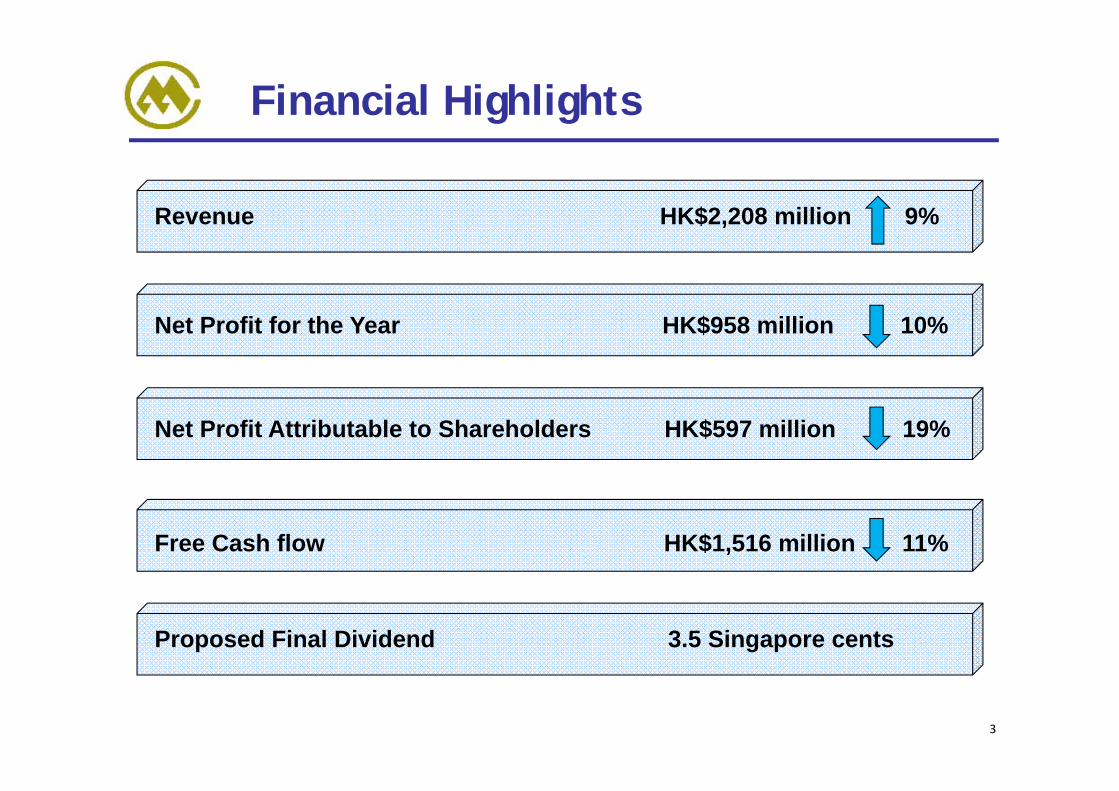
Financial Highlights
Proposed Final Dividend 3.5 Singapore cents
Net Profit for the Year HK$958 million 10%
Net Profit Attributable to Shareholders HK$597 million 19%
Free Cash flow HK$1,516 million 11%
Revenue HK$2,208 million 9%
3
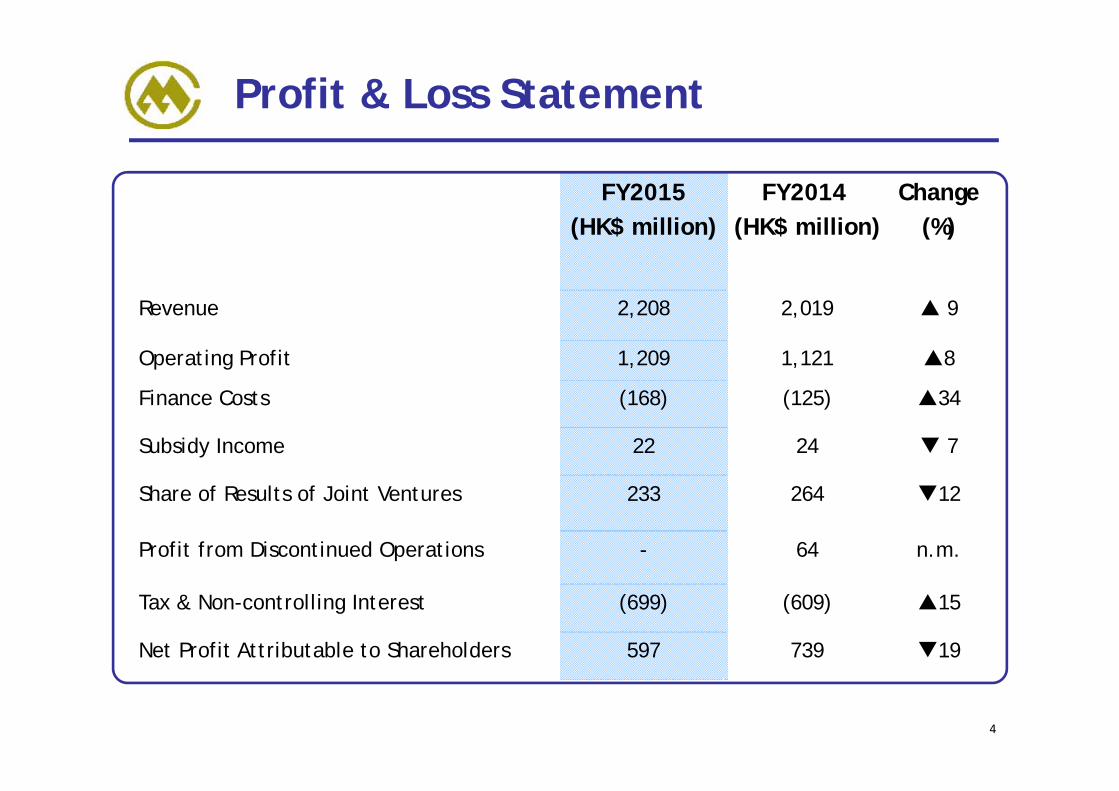
Profit & Loss Statement
FY2015(HK$ million)
FY2014(HK$ million)
Change(%)
Revenue 2,208 2,019 9
Operating Profit 1,209 1,121 8
Finance Costs (168) (125) 34
Subsidy Income 22 24 7
Share of Results of Joint Ventures 233 264 12
Profit from Discontinued Operations - 64 n.m.
Tax & Non-controlling Interest (699) (609) 15
Net Profit Attributable to Shareholders 597 739 19
4
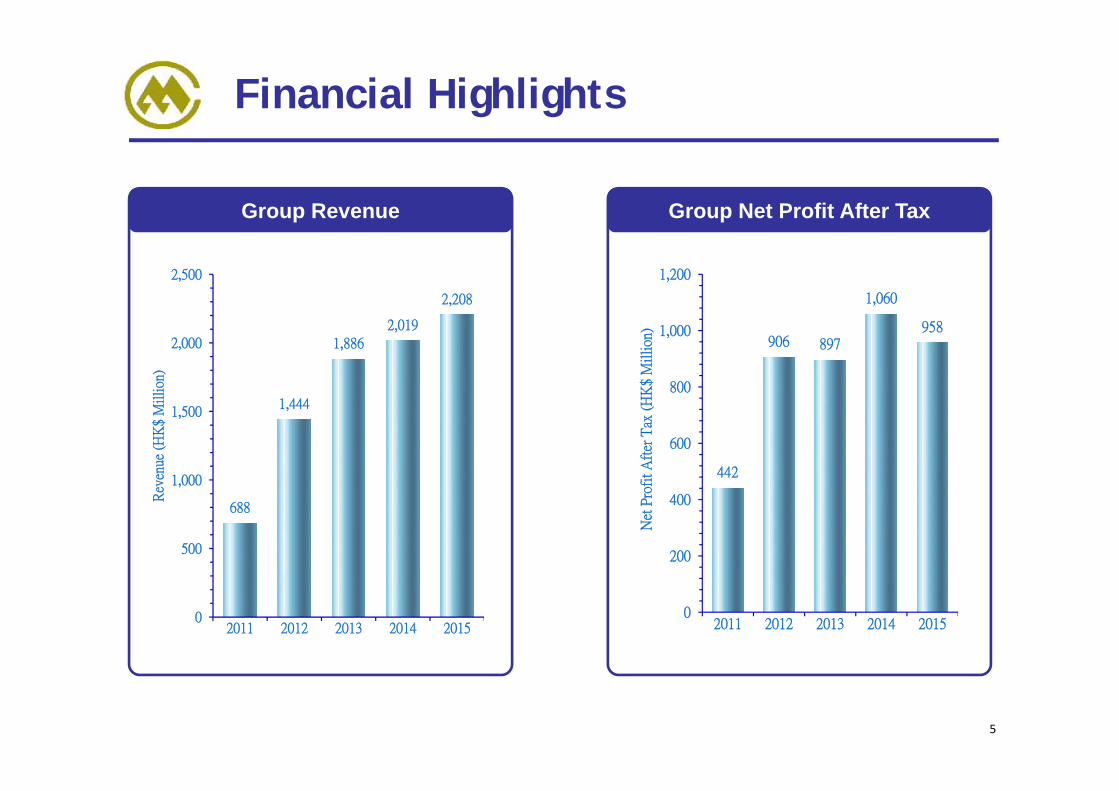
Financial Highlights
442
906 897
1,060
958
0
200
400
600
800
1,000
1,200
2011 2012 2013 2014 2015
Net
Pro
fit A
fter
Tax
(H
K$
Mil
lion
)
688
1,444
1,886
2,019
2,208
0
500
1,000
1,500
2,000
2,500
2011 2012 2013 2014 2015
Rev
enue
(H
K$
Mil
lion
)
Group Net Profit After TaxGroup Revenue
5
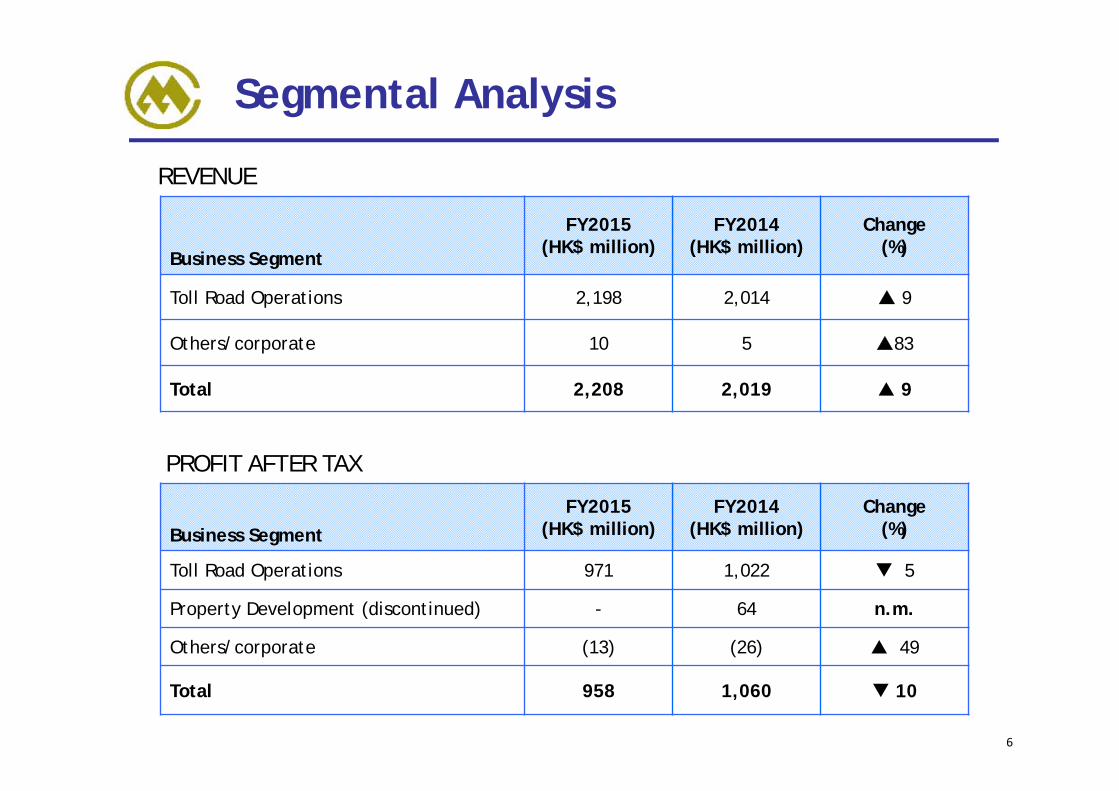
Segmental Analysis
Business Segment
FY2015(HK$ million)
FY2014(HK$ million)
Change(%)
Toll Road Operations 2,198 2,014 9
Others/corporate 10 5 83
Total 2,208 2,019 9
REVENUE
Business SegmentFY2015
(HK$ million)FY2014
(HK$ million)Change
(%)
Toll Road Operations 971 1,022 5
Property Development (discontinued) - 64 n.m.
Others/corporate (13) (26) 49
Total 958 1,060 10
PROFIT AFTER TAX
6
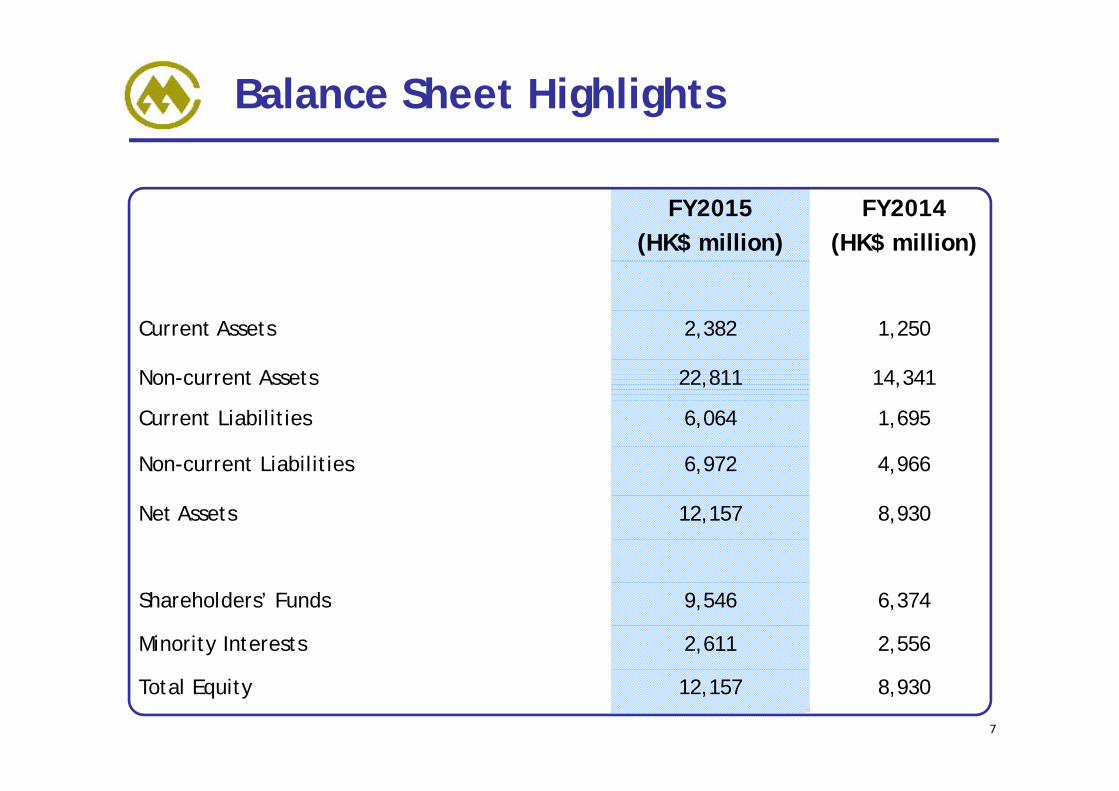
Balance Sheet Highlights
FY2015(HK$ million)
FY2014(HK$ million)
Current Assets 2,382 1,250
Non-current Assets 22,811 14,341
Current Liabilities 6,064 1,695
Non-current Liabilities 6,972 4,966
Net Assets 12,157 8,930
Shareholders’ Funds 9,546 6,374
Minority Interests 2,611 2,556
Total Equity 12,157 8,930
7
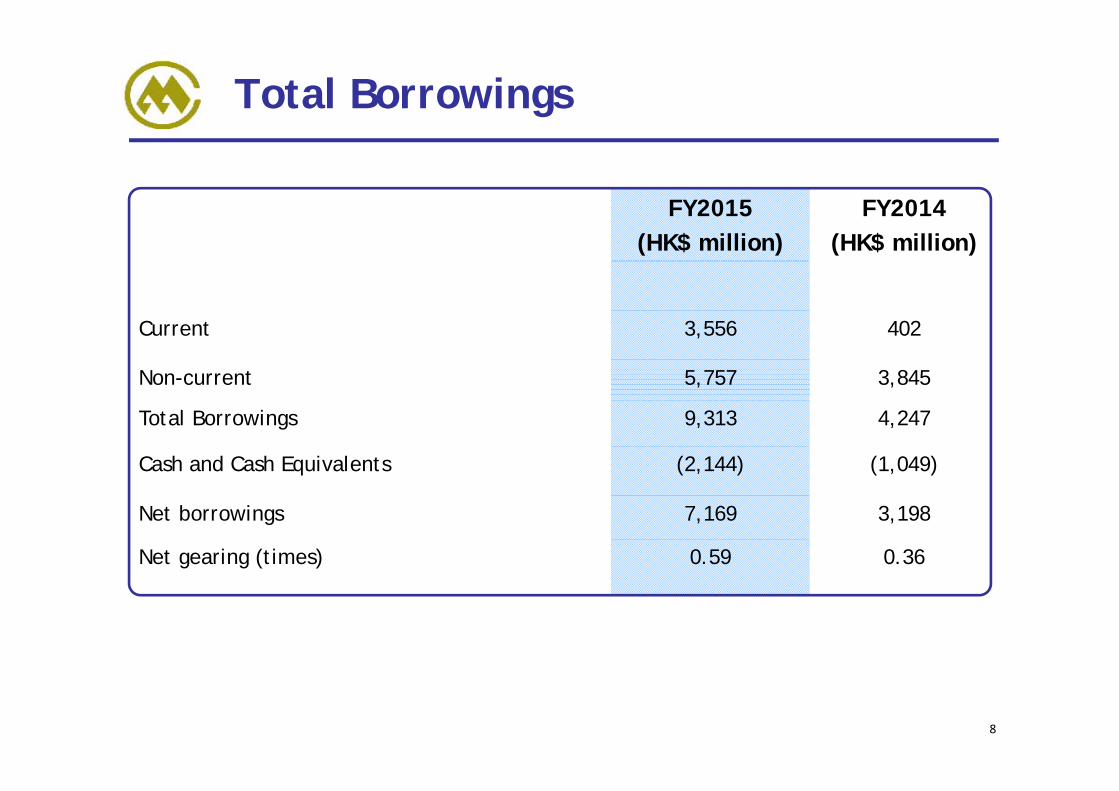
Total Borrowings
FY2015(HK$ million)
FY2014(HK$ million)
Current 3,556 402
Non-current 5,757 3,845
Total Borrowings 9,313 4,247
Cash and Cash Equivalents (2,144) (1,049)
Net borrowings 7,169 3,198
Net gearing (times) 0.59 0.36
8
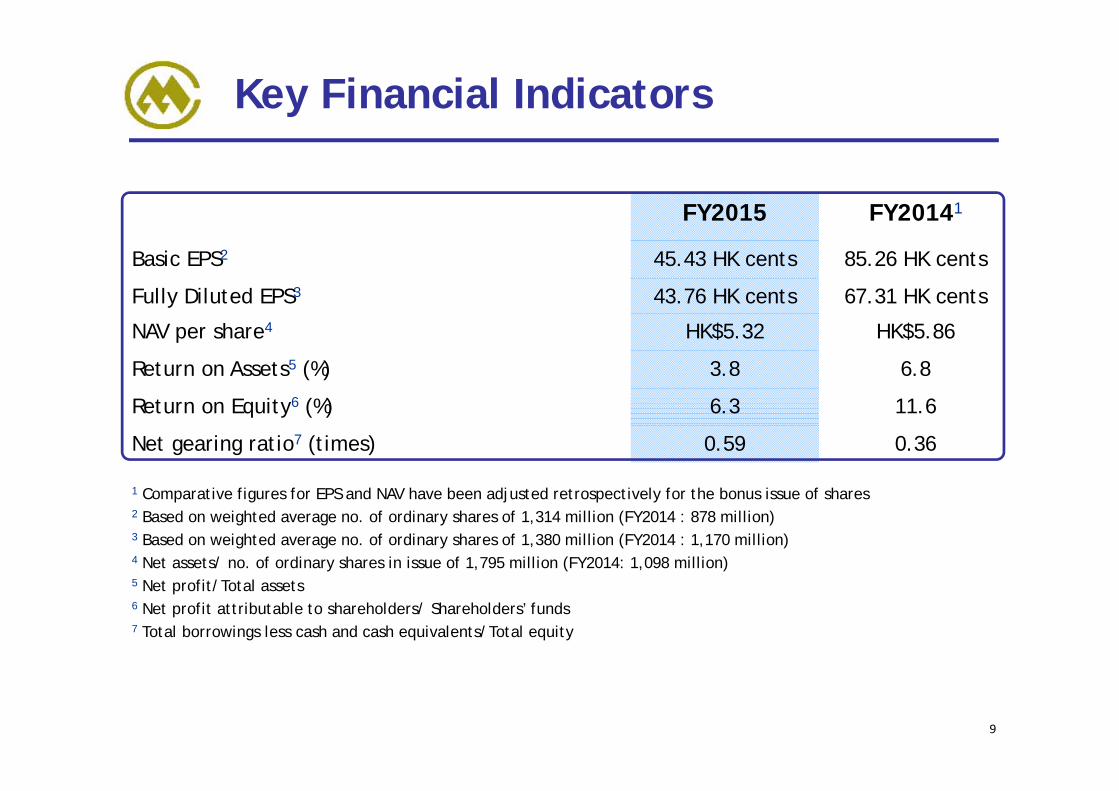
Key Financial Indicators
FY2015 FY20141
Basic EPS2 45.43 HK cents 85.26 HK cents
Fully Diluted EPS3 43.76 HK cents 67.31 HK cents
NAV per share4 HK$5.32 HK$5.86
Return on Assets5 (%) 3.8 6.8
Return on Equity6 (%) 6.3 11.6
Net gearing ratio7 (times) 0.59 0.36
1 Comparative figures for EPS and NAV have been adjusted retrospectively for the bonus issue of shares2 Based on weighted average no. of ordinary shares of 1,314 million (FY2014 : 878 million)3 Based on weighted average no. of ordinary shares of 1,380 million (FY2014 : 1,170 million)4 Net assets/ no. of ordinary shares in issue of 1,795 million (FY2014: 1,098 million)5 Net profit/Total assets 6 Net profit attributable to shareholders/ Shareholders’ funds7 Total borrowings less cash and cash equivalents/Total equity
9
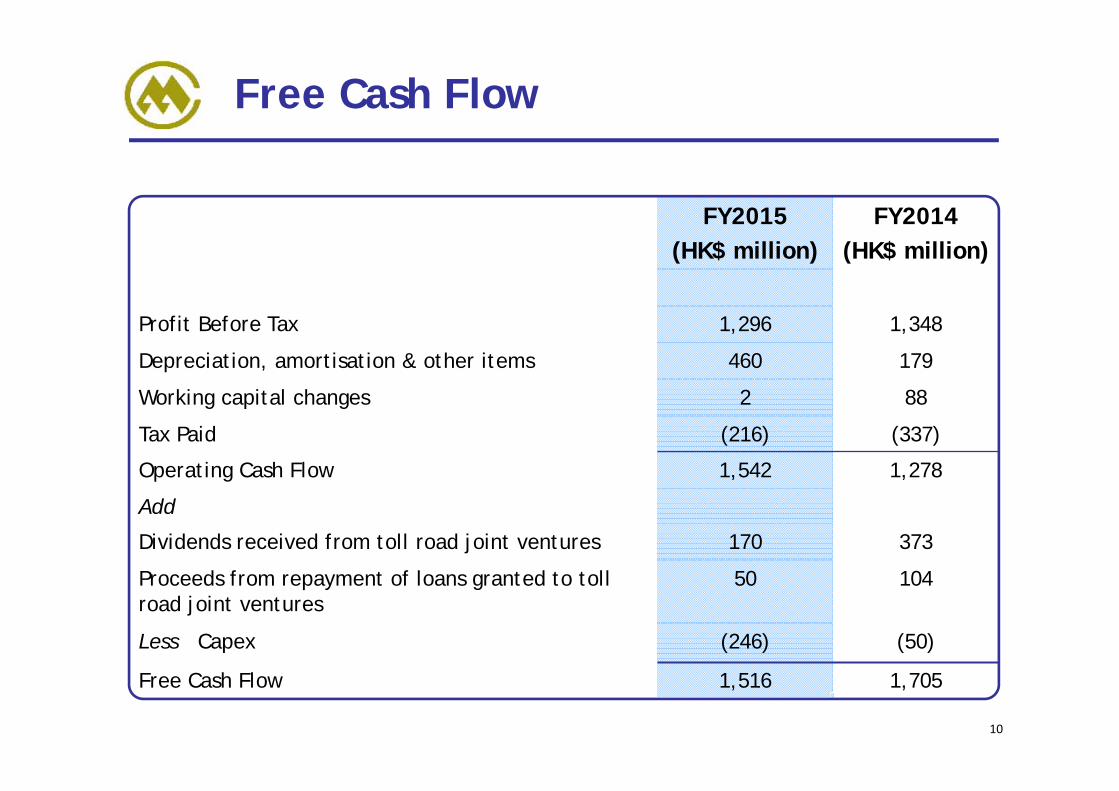
Free Cash Flow
FY2015(HK$ million)
FY2014(HK$ million)
Profit Before Tax 1,296 1,348
Depreciation, amortisation & other items 460 179
Working capital changes 2 88
Tax Paid (216) (337)
Operating Cash Flow 1,542 1,278
Add
Dividends received from toll road joint ventures 170 373
Proceeds from repayment of loans granted to toll road joint ventures
50 104
Less Capex (246) (50)
Free Cash Flow 1,516 1,705
10

Financial Highlights
Toll Road Operations Report Looking Ahead Question-and-Answer
Agenda
11
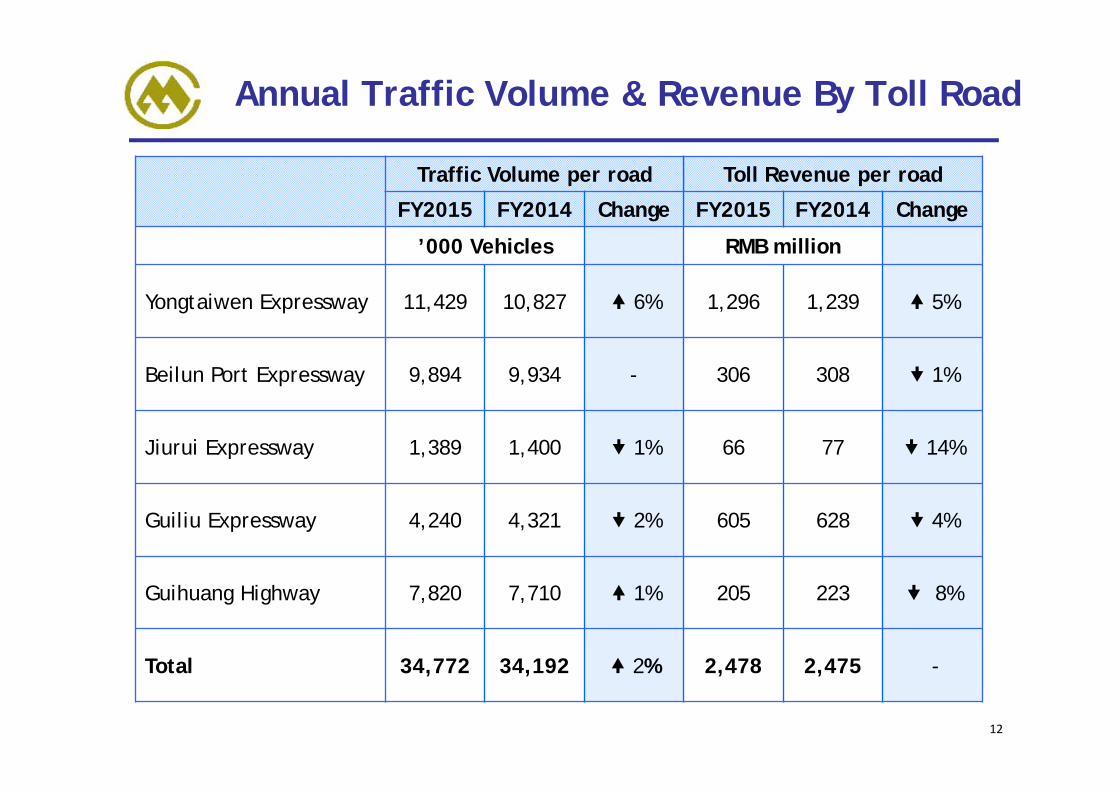
Annual Traffic Volume & Revenue By Toll Road
Traffic Volume per road Toll Revenue per road
FY2015 FY2014 Change FY2015 FY2014 Change
’000 Vehicles RMB million
Yongtaiwen Expressway 11,429 10,827 6% 1,296 1,239 5%
Beilun Port Expressway 9,894 9,934 - 306 308 1%
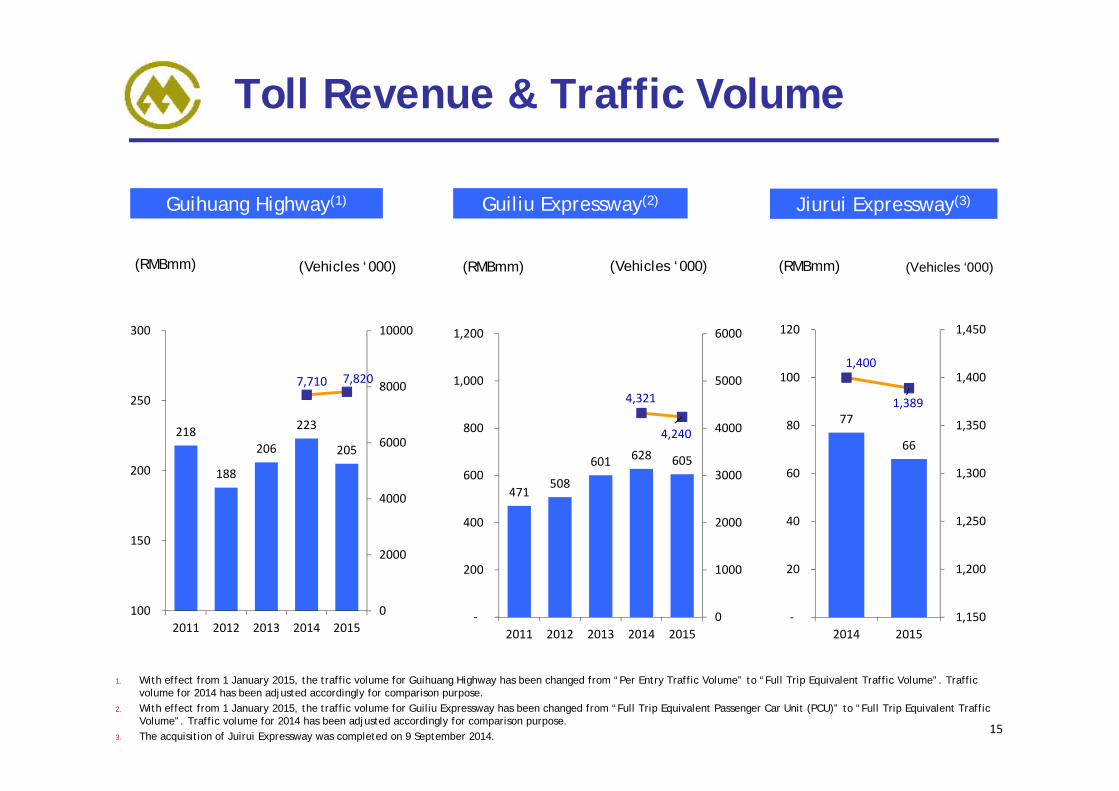
Jiurui Expressway 1,389 1,400 1% 66 77 14%
Guiliu Expressway 4,240 4,321 2% 605 628 4%
Guihuang Highway 7,820 7,710 1% 205 223 8%
Total 34,772 34,192 2% 2,478 2,475 -
12
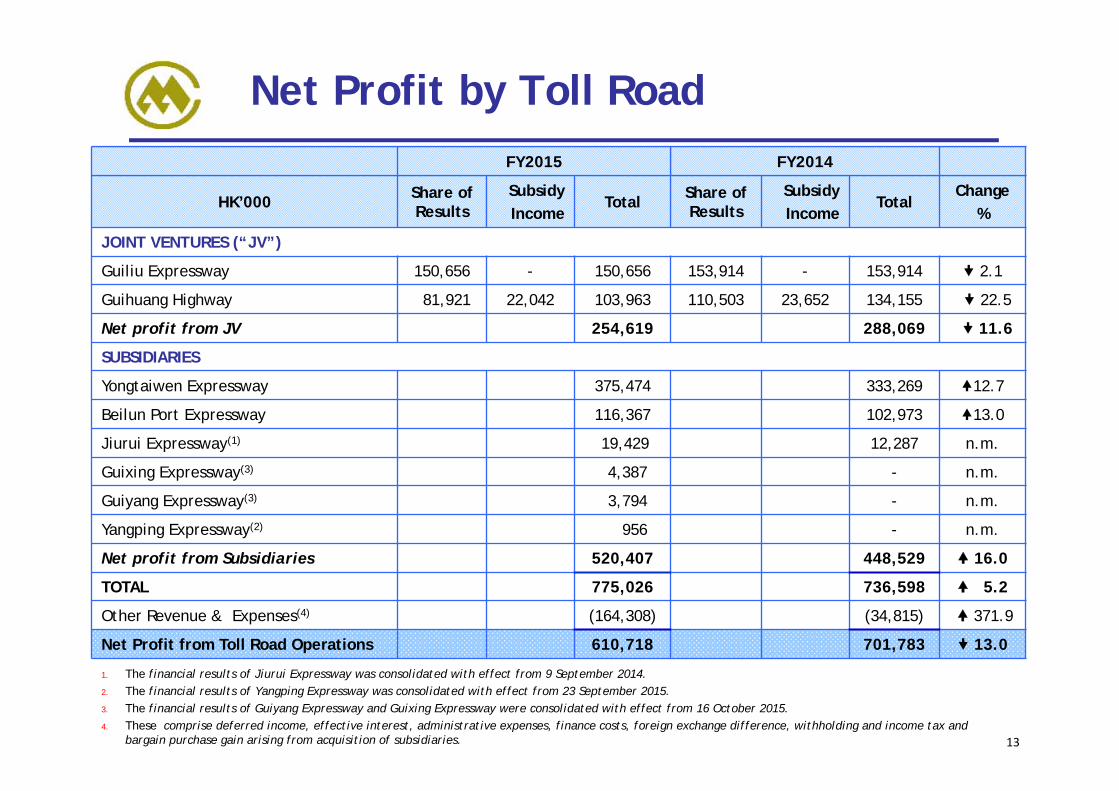
Net Profit by Toll RoadFY2015 FY2014
HK’000 Share of Results
SubsidyIncome
Total Share of Results
SubsidyIncome
TotalChange
%
JOINT VENTURES (“JV”)
Guiliu Expressway 150,656 - 150,656 153,914 - 153,914 2.1
Guihuang Highway 81,921 22,042 103,963 110,503 23,652 134,155 22.5
Net profit from JV 254,619 288,069 11.6
SUBSIDIARIES
Yongtaiwen Expressway 375,474 333,269 12.7
Beilun Port Expressway 116,367 102,973 13.0
Jiurui Expressway(1) 19,429 12,287 n.m.
Guixing Expressway(3) 4,387 - n.m.
Guiyang Expressway(3) 3,794 - n.m.
Yangping Expressway(2) 956 - n.m.
Net profit from Subsidiaries 520,407 448,529 16.0
TOTAL 775,026 736,598 5.2
Other Revenue & Expenses(4) (164,308) (34,815) 371.9
Net Profit from Toll Road Operations 610,718 701,783 13.0
1. The financial results of Jiurui Expressway was consolidated with effect from 9 September 2014.2. The financial results of Yangping Expressway was consolidated with effect from 23 September 2015.3. The financial results of Guiyang Expressway and Guixing Expressway were consolidated with effect from 16 October 2015.4. These comprise deferred income, effective interest, administrative expenses, finance costs, foreign exchange difference, withholding and income tax and
bargain purchase gain arising from acquisition of subsidiaries. 13
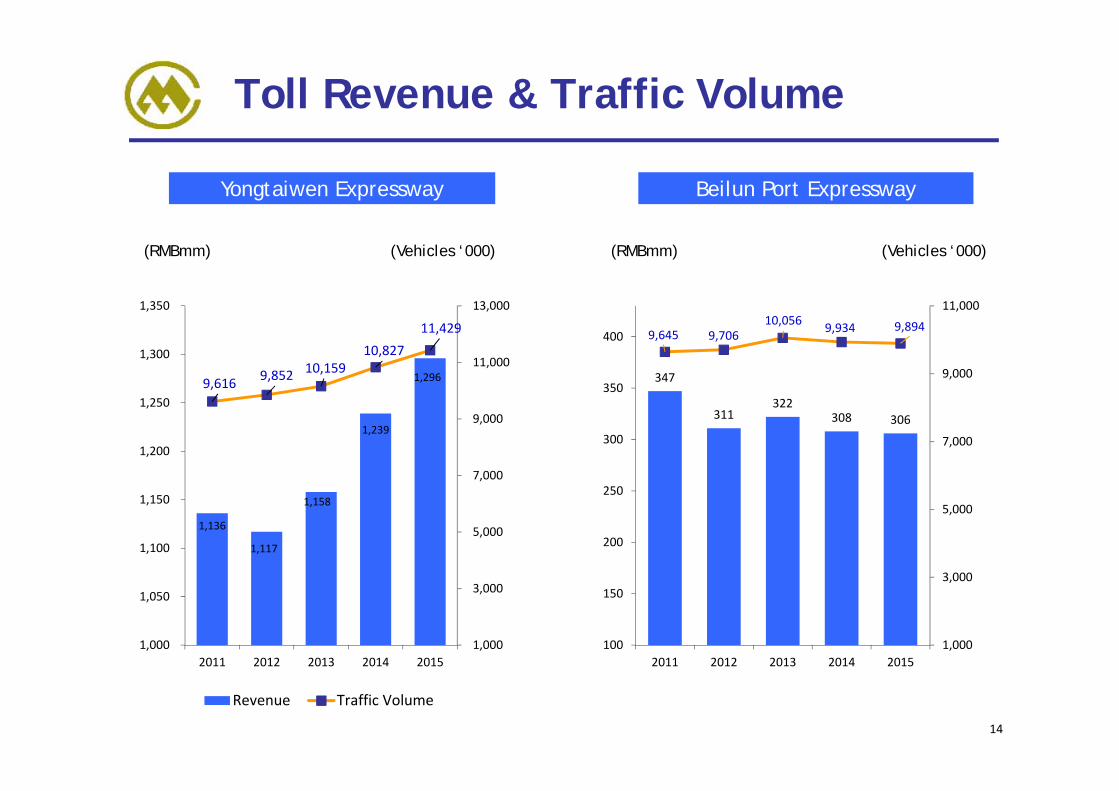
Toll Revenue & Traffic Volume
1,136
1,117
1,158
1,239
1,2969,616 9,852 10,159 10,827
11,429
1,000
3,000
5,000
7,000
9,000
11,000
13,000
1,000
1,050
1,100
1,150
1,200
1,250
1,300
1,350
2011 2012 2013 2014 2015
Revenue Traffic Volume
Yongtaiwen Expressway
(RMBmm)
Beilun Port Expressway
(Vehicles ‘000)
14
347
311322
308 306
9,645 9,70610,056 9,934 9,894
1,000
3,000
5,000
7,000
9,000
11,000
100
150
200
250
300
350
400
2011 2012 2013 2014 2015
(RMBmm) (Vehicles ‘000)
Toll Revenue & Traffic Volume
77
66
1,400
1,389
1,150
1,200
1,250
1,300
1,350
1,400
1,450
‐
20
40
60
80
100
120
2014 2015
Guihuang Highway(1)
(RMBmm)
15
(Vehicles ‘000)
218
188
206
223
205
7,710 7,820
0
2000
4000
6000
8000
10000
100
150
200
250
300
2011 2012 2013 2014 2015
471508
601 628 605
4,321
4,240
0
1000
2000
3000
4000
5000
6000
‐
200
400
600
800
1,000
1,200
2011 2012 2013 2014 2015
1. With effect from 1 January 2015, the traffic volume for Guihuang Highway has been changed from “Per Entry Traffic Volume” to “Full Trip Equivalent Traffic Volume”. Traffic volume for 2014 has been adjusted accordingly for comparison purpose.
2. With effect from 1 January 2015, the traffic volume for Guiliu Expressway has been changed from “Full Trip Equivalent Passenger Car Unit (PCU)” to “Full Trip Equivalent Traffic Volume”. Traffic volume for 2014 has been adjusted accordingly for comparison purpose.
3. The acquisition of Juirui Expressway was completed on 9 September 2014.
Guiliu Expressway(2) Jiurui Expressway(3)
(RMBmm)(RMBmm)(Vehicles ‘000) (Vehicles ‘000)

Financial Highlights Toll Road Operations Report
Looking Ahead Question-and-Answer
Agenda
16
FY2016 Outlook
The operating environment in China is expected to remainchallenging but we believe the fundamentals of the toll roadindustry in China remain strong.
China’s slower economic growth is expected to have animpact on our toll roads’ traffic volume and toll revenue.
Barring unforeseen circumstances, we expect the Group toremain profitable in the forthcoming year.
17

Dividend Payout
96%
63%
54%
89%
73%
FINANCIAL YEAR
2015- Interim Dividend- Final Dividend
3.503.50
FINANCIAL YEAR
2014- Interim Dividend- Final Dividend
3.503.50
FINANCIAL YEAR
2013- Interim Dividend- Final Dividend
2.754.25
FINANCIAL YEAR
2012- Interim Dividend- Final Dividend
2.752.75
FINANCIAL YEAR
2011- Interim Dividend- Final Dividend
2.503.00
% of Dividend Payout(1)Historical Dividend Payout (Singapore cents)
THE COMPANY WILL MAINTAIN THE TARGET ANNUAL DIVIDEND PAYOUT OF AT LEAST 50% OF UNDERLYING NET PROFITS 18
(1) Excludes exceptional items
Financial Highlights Toll Road Operations Report Looking Ahead
Question-and-Answer
Agenda
19
Thank youQuestion & Answer
Panel:
1. Luo Hui Lai, Chairman & CEO
2. Jiang Yan Fei, Vice Chairman, General Manager & COO
3. Shi Xiu Li, Chief Financial Officer
4. Selene Lim, Company Secretary
20
Disclaimer
This presentation may contain forward-looking statements regarding, among otherthings, the Company’s outlook, business and strategy which are current as of thedate they are made. These forward-looking statements are subject to risks anduncertainties that could cause actual results to differ materially from suchstatements. You are cautioned not to place undue reliance on these forward-lookingstatements which are based on the current views of Company’s Management onfuture developments and events.