george moundreas & co. sa dry cargo segment 2013 is it over? forward prospects… cash flow...
TRANSCRIPT

George Moundreas & CO. SA
Dry Cargo Segment 2013
Is it over? Forward prospects…
Cash Flow Break Even Point
George Logothetis February 2014

G.M. & CO. SA LAST YEAR - How It Started…

G.M. & CO. SA What Happened Since Then…
DECEMBER 05, 2013
INDEX AVG. T/C 5 yrs Vessel Price
BDI 2.145
BCI ( CAPESIZE ) 3.843 $28.899 $38.000.000
BPI ( PANAMAX ) 1.867 $14.338 $23.000.000
BSI ( SUPRAMAX ) 1.531 $15.917 $22.500.000
BHSI ( HANDYSIZE ) 780 $11.141 $18.500.000
LAST YEAR SAME TIME NOVEMBER 30, 2012
INDEX AVG. T/C 5 yrs Vessel Price
BDI 1.086
BCI ( CAPESIZE ) 2.199 $15.869 $32.000.000
BPI ( PANAMAX ) 980 $7.815 $19.000.000
BSI ( SUPRAMAX ) 766 $8.005 $20.000.000
BHSI ( HANDYSIZE ) 448 $6.605 $16.000.000
% Δ - NOVEMBER 30, 2012- DECEMBER 06, 2012
INDEX AVG. T/C 5 yrs Vessel PriceBDI 97,51%
BCI ( CAPESIZE ) 74,76% 82,11% 19%
BPI ( PANAMAX ) 90,51% 83,47% 21%
BSI ( SUPRAMAX ) 99,87% 98,84% 13%
BHSI ( HANDYSIZE ) 74,11% 68,68% 16%
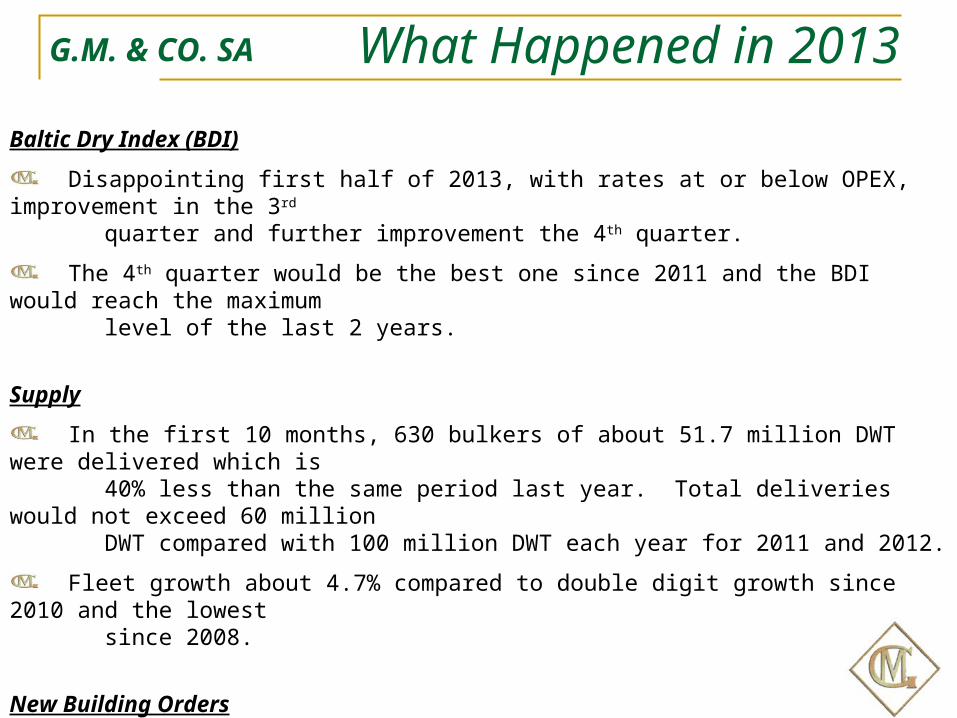
G.M. & CO. SA What Happened in 2013
Baltic Dry Index (BDI)
Disappointing first half of 2013, with rates at or below OPEX, improvement in the 3rd quarter and further improvement the 4th quarter.
The 4th quarter would be the best one since 2011 and the BDI would reach the maximum level of the last 2 years.
Supply
In the first 10 months, 630 bulkers of about 51.7 million DWT were delivered which is 40% less than the same period last year. Total deliveries would not exceed 60 million DWT compared with 100 million DWT each year for 2011 and 2012.
Fleet growth about 4.7% compared to double digit growth since 2010 and the lowest since 2008.
New Building Orders
The first 10 months, about 811 bulkers were ordered of about 55 million DWT, an increase of 145% y-o-y. Greek Ship owners have placed orders in excess of 100 vessels ($ 2.8 billion) representing 22% of total orders in DWT.

G.M. & CO. SA What Happened in 2013
Second Hand Activity
Strong S&P activity world wide with about 500 bulkers sold in the first ten months in excess of $ 6.2 billion. Strong Greek presence with the acquisition of more than 210 vessels in excess of $ 3 billion.
Recycling
Diminished recycling activity compared to 2012. It is estimated that the year will close with about 25 million DWT, 30% down from the total of 36 million DWT last year.
Finance
Limited finance with the exception of Top Tier clients. Alternative methods?

G.M. & CO. SA What to expect ? Supply growth to be reduced in the next couple of years. For 2014 and 2015 fleet
supply about 4% each year.
Supply might be reduced further due to environmental regulations which will increase demolition activity thus we expect more than the 25 million DWT of 2013.
Demand growth in terms of tonne miles for 2014 and 2015 around 6%, surpassing the fleet growth.
Asset prices for New Building and Second hand vessels on an upward trend.
Finance, better than 2013 but still very selective. Alternative methods would be the Capital Markets and the P.E but traditional debt will be the primary source.
Conference Board estimates World annual growth rate for 2014 at 3.1% with upward trend for 2015 and OECD at 3.6%, in contrast with the low 2.8% of 2013.
As per CPB, World Trade (Trade Volumes) to increase 4.8% in 2014 vs. 3% in 2013. The WTO estimates an increase 4.5% in 2014 vs. 2.5% in 2013. The upward trend is there however.
Caution for possible correction of the market towards the end of 2015 and in 2016 due to increased orders placed this year and maybe next year.

G.M. & CO. SA Cyclicality
When reviewing the BDI from 1985, and using written
reports on the shipping industry as far back as the early
1970′s, we believe we have uncovered a regular 13 year
cycle.
It appears every 13 years shipping rates make a cyclical
low: 1973 -1986 -1999 -2012. After the low is in place
rates generally:
rise for the next 9 years,
then decline 4 years into the next cyclical low.
During the 9 year bull market, rates
rise for 5 years
decline for 1 year and
then rise for another 3 years into the cyclical
peak.
Provided that we are in the 9 years recovery period,
based on the above historical data, the next correction
which will last for about a year, will take place around
2016 due to the increased orders of 2013 and 2014.

G.M. & CO. SA Cash Flow Break Even PointCash Flow Break Even Point, is the daily earnings required in order for the vessel to be
able to cover only the daily OPEX and the daily Loan requirements (Capital + Interest) without taking under consideration any kind of returns.
Loan Assumptions
Equity: 40%
Loan: 60%
Interest Rate (Libor + Spread): 4%
Tenor: 10 years
Balloon: 20%

G.M. & CO. SA Cash Flow Break Even PointCAPE NEW BUILDING
PRICE: $ 53.500.000
EQUITY (40%): $ 21.400.000
LOAN (60%): $ 32.100.000
BALLOON (20%): $ 6.420.000
OPEX per day: $ 7.758
AVG. B.E.P: $ 19.630 / day
AVG B.E.P excl. Balloon: $ 17.822 / day
CAPE 5 Years
PRICE: $ 38.000.000
EQUITY (40%): $ 15.200.000
LOAN (60%): $ 22.800.000
BALLOON (20%): $ 4.560.000
OPEX per day: $ 7.758
AVG. B.E.P: $ 16.361 / day
AVG B.E.P excl. Balloon: $ 15.076 / day

G.M. & CO. SA Cash Flow Break Even PointPANAMAX NEW BUILDING
PRICE: $ 29.00.000
EQUITY (40%): $ 11.600.000
LOAN (60%): $ 17.400.000
BALLOON (20%): $ 3.480.000
OPEX per day: $ 6.600
AVG. B.E.P: $ 13.217 / day
AVG B.E.P excl. Balloon: $ 12.236 / day
PANAMAX 5 Years
PRICE: $ 23.000.000
EQUITY (40%): $ 9.200.000
LOAN (60%): $ 13.800.000
BALLOON (20%): $ 2.760.000
OPEX per day: $ 6.600
AVG. B.E.P: $ 11.951 / day
AVG B.E.P excl. Balloon: $ 11.173 / day

G.M. & CO. SA Cash Flow Break Even PointULTRAMAX NEW BUILDING
PRICE: $ 29.00.000
EQUITY (40%): $ 11.600.000
LOAN (60%): $ 17.400.000
BALLOON (20%): $ 3.480.000
OPEX per day: $ 6.400
AVG. B.E.P: $ 13.000 / day
AVG B.E.P excl. Balloon: $ 12.021 / day
ULTRAMAX 5 Years (estimation)
PRICE: $ 23.000.000
EQUITY (40%): $ 9.200.000
LOAN (60%): $ 13.800.000
BALLOON (20%): $ 2.760.000
OPEX per day: $ 6.400
AVG. B.E.P: $ 11.736 / day
AVG B.E.P excl. Balloon: $ 10.958 / day

G.M. & CO. SA Cash Flow Break Even PointSUPRAMAX NEW BUILDING SUPRAMAX 5 Years
PRICE: $ 22.500.000
EQUITY (40%): $ 9.000.000
LOAN (60%): $ 13.500.000
BALLOON (20%): $ 2.700.000
OPEX per day: $ 6.200
AVG. B.E.P: $ 11.415 / day
AVG B.E.P excl. Balloon: $ 10.655 / day

G.M. & CO. SA Cash Flow Break Even PointHANDYSIZE NEW BUILDING
PRICE: $ 23.00.000
EQUITY (40%): $ 9.200.000
LOAN (60%): $ 13.800.000
BALLOON (20%): $ 2.760.000
OPEX per day: $ 5.340
AVG. B.E.P: $ 10.596 / day
AVG B.E.P excl. Balloon: $ 9.818 / day
HANDYSIZE 5 Years
PRICE: $ 18.500.000
EQUITY (40%): $ 7.400.000
LOAN (60%): $ 11.100.000
BALLOON (20%): $ 2.220.000
OPEX per day: $ 5.340
AVG. B.E.P: $ 9.646 / day
AVG B.E.P excl. Balloon: $ 9.021 / day

G.M. & CO. SA LAST YEAR
Opportunities ?SWOT ANALYSIS
Strengths:
Weaknesses:
Opportunities:
Threats:
Determined by the current Financial position of each company.
High Demolition prices (Minimization of Losses – Cash Injection).
Fleet expansion - Low Second Hand & New Building Prices with favourable payment terms, back-end loaded.
Reduction in average age fleet.
Diversification in size.
Market Leader in new ECO type vessels and tonnage.
Eurozone Crisis.
Regardless of the outcome on Fiscal Cliff in USA, possible slow down.
Chinese growth stabilized at current levels.
Geopolitical issues – China & Japan - Arab Spring
Rising of Protectionism
BACK TO THE
BASICS
“CA$H IS KING”

George Moundreas & CO. SA
George Logothetis February 2014