geopier foundation co inc technical bulletin foundation co inc technical bulletin construction...
TRANSCRIPT

v i b r a t i o n a n d n o i s e l e v e l s
No.9g e o p i e r f o u n d a t i o n c o i n c
t e c h n i c a l b u l l e t i n
Construction vibration and noise levels are important when considering the effect of construction activities on
adjacent buildings, building additions and neighbors. This technical bulletin describes the results of vibration
and noise monitoring performed adjacent to Rammed Aggregate Pier® (RAP) activities using the Geopier®,
Impact®, and Rampact® systems. This information should be used when evaluating the feasibility of a RAP
solution at a particular site. For sites with increased vibration and noise sensitivity, a site-specific monitoring
program should be considered.
1 . c o n s t r u c t i o n v i b r a t i o n s
Many construction activities result in the transmission
of vibrations across the construction site. Vibration
levels depend on the types of construction activities
as well as the soil conditions at the site. The effect of
vibrations on adjacent buildings depends on the build-
ing’s construction (wood, masonry, steel, concrete),
building age, distance of the adjacent building from
the source of vibration, duration of vibration, vibration
frequency, vibration amplitude and soil conditions. In
general, low frequency (long period) motions result in
a greater likelihood of building damage compared to
high frequency (short period) motions. This is because
of the significant damping effect that occurs in soils
subjected to high frequency (short period) motions. In
contrast, soils subjected to low frequency (long period)
motions may amplify the vibrations.
In the United States, high frequency vibrations levels
less than two in/sec at the building location are gener-
ally considered to be acceptable (Wiss 1981). These
levels of vibrations are unlikely to lead to building dam-
age. Vibration levels between 0.5 in/sec and 2 in/sec,
are generally considered to be an annoyance but not
structurally damaging. Vibration levels of less than 0.5
in/sec are often not noticeable.

p a g e t w o
Rammed Aggregate Pier construction is described
in detail in the Geopier Reference Manual (Fox and
Cowell 1998). RAP installation using the Geopier
system is constructed by drilling out a volume of
compressible soil to create a cavity and then ramming
select aggregate into the cavity in thin lifts using the
patented beveled tamper. The Impact system and
Rampact system are each installed in caving soils
through the use of a hollow mandrel driven to the
design depth. Aggregate placed down the center of
the hollow mandrel fills the cavity and is compacted
in thin lifts as the mandrel is raised up and rammed
down to achieve compaction. The ramming action
during Rammed Aggregate Pier construction causes
the aggregate to compact vertically and to push
laterally against the matrix soil, thereby increasing
the horizontal stress in the matrix soil. Rammed
Aggregate Pier construction results in a very dense
aggregate pier with superior strength and stiffness.
During installation, the hammers that produce the
ramming action operate at ranges of 400 to 600
cycles per minute (7 to 10 cycles per second) for
the Geopier system and 2,000 to 2,400 cycles per
minute for Impact and Rampact systems. These high
frequency vibration levels are higher than most other
construction activities resulting in a large amount of
damping within the reinforced soils at the project site.
Conversely, pile driving typically produces vibrations
associated with low frequencies on the order of 60
cycles per minute (one cycle per second) and an
associated period of one second. The RAP vibration
levels are thus both lower in amplitude and higher in
frequency than pile driving activities, resulting in lower
vibrations measured at adjacent sites.
Vibration monitoring has been performed at a
number of Rammed Aggregate Pier project sites to
evaluate the amplitude and frequency of vibrations as
a function of distance from the energy source. The
following table contains a sample of the collected
data. The table includes a description of the soil
conditions, installation technique, distance ranges
from source, as well as the field vibration data for
each of the project sites.
2 . r a m m e d a g g r e g a t e p i e r ® c o n s t r u c t i o n
3 . v i b r a t i o n m o n i t o r i n g

p a g e t h r e e
Table 1.
Vibration Monitoring Results*
LOCATION SOIL DESCRIPTION
REINFORCEMENT SOLUTION
DISTANCE FROM SOURCE (ft)
PEAK PARTICLE VELOCITY (ips)
FREQUENCY (Hz)
MEMPHIS, TN MED. STIFF CLAYGEOPIER 1.7 - 2 .18 - 2.96 43 - 57
GEOPIER 5 - 10 .12 - .70 43 - 73
SOMERVILLE, MA MED. DENSE GRANULAR FILL GEOPIER 1.5 - 10 .50 - .65 30 - 85
SAN LUIS OBISPO, CA STIFF CLAY GEOPIER 7 - 15 .04 - .55 15 - 60
MINNEAPOLIS, MN LOOSE SAND GEOPIER 3 - 50 .07 - .90 27 - 57
MINNEAPOLIS, MN LOOSE SANDIMPACT 3 - 20 .56 - .99 21 - 47
IMPACT 30 - 100 .02 - .48 21 - 47
MANALAPAN, NJ MED. DENSE SILTY SAND
IMPACT 5 - 10 .57 - 3.19 37 - 64
IMPACT 25 - 50 .10 - .62 34 - 73
*Monitoring results are also plotted in Figures 2 and 3.
At one project site, the Baptist Memorial Hospital
Addition in Memphis, Tennessee, Geopier elements
were installed in close proximity to existing hospital
facilities. An accelerometer was used at the site
to measure both accelerations and peak particle
velocities (PPV) during the installation of the Geopier
system. The accelerometer was positioned at
distances ranging from 1.7 feet to 10 feet away from
the Geopier elements as the tamper head elevation
ranged from the ground surface to greater than 13 feet
below grade. The subsurface conditions consisted of
medium-stiff clay with groundwater below the bottoms
of the piers. The results of the accelerometer testing
are shown graphically in Figure 1.

Figure 1.
Peak Particle Velocity With Depth
For Different Energy Source Distances
Radial Distance From Source
0
2
4
6
8
10
12
14
16
0.0 0.5 1.0 1.5 2.0 2.5 3.0 3.5Peak Particle Velocity (in/sec)
Depth below grade (ft)
1.7 ft2 ft5 ft10 ft
Peak Particle Velocity (in/sec)D
epth
Bel
ow G
rade
(ft)
The results of the vibration monitoring data (Figure
1) indicate that RAP construction vibration amplitudes
decrease with increasing depth below the ground
surface. The highest vibration amplitudes are observed
when the tamper is at the ground surface. Table 1 and
Figures 2 to 4 show the ranges of peak particle velocity
with distance from the source. The data indicates that
vibration amplitudes reduce with radial distance from
the energy source. This rapid dissipation of vibration
amplitudes is attributed to the high frequency
(low period) vibrations resulting from the hammers
used during RAP construction. For Geopier elements,
the peak particle velocities are generally less than two
in/sec at distances of two feet from the installation
location and less than 0.75 in/sec at distances of
five feet from the installation location. For Impact
and Rampact elements, the peak particle velocities
are less than two in/sec at distances on the order of
10 to 15 feet from the pier installation location and
less than 0.75 in/sec at distances of 20 to 25 feet
from the installation location. The higher amplitudes
observed for the Impact and Rampact installations
are likely attributed to the displacement installation
procedure and the densification of the granular soils
during installation. As shown, predrilling and other
construction methods are effective at reducing
vibrations of displacement installations. Figure 4
shows a comparison of Geopier vibration levels from
the site in San Luis Obispo, California compared
with other construction equipment. As indicated, the
measured vibration levels are comparable to those
induced by a jack hammer or a large bulldozer and are
considerably lower than pile driving operations.
4 . d i s c u s s i o n o f v i b r a t i o n r e s u l t s
p a g e f o u r

Figure 2.
Peak Particle Velocities For Geopier System
With Distance From Energy Source
Figure 3.
Peak Particle Velocities For Impact and Rampact Systems
With Distance From Energy Source
0.0
0.5
1.0
1.5
2.0
2.5
3.0
1 10 100
Distance from Source (ft)
Peak Particle Velocity (in/sec)
Range of PPV - Memphis, TNRange of PPV - San Luis Obispo, CA
Maximum PPV values - Minneapolis, MNMaximum PPV values - Somerville, MA
Distance From Source (ft)
Peak
Par
ticl
e Ve
loci
ty (i
n/se
c)
Distance From Source (ft)
Max
imum
Pea
k Pa
rtic
le V
eloc
ity
(in/s
ec)
Impact RAP Vibration Data
0.0
0.5
1.0
1.5
2.0
2.5
3.0
3.5
4.0
4.5
5.0
1 10 100 1000
Distance from Source (ft)
Max
imum
Pea
k Pa
rtic
le V
eloc
ity (i
n/se
c)
Manalapan, NJMinneapolis, MNDedham, MASeattle, WABow, NHNorth Kingstown, RILynn, MAGrand Rapids, MI
Range of Vibration Data
Typical Design Threshold
p a g e f i v e

Peak
Vel
ocit
y (m
m/s
ec) (
25 m
m/s
ec =
1 in
/sec
)
Distance from Source (m) (1 m = 3.28 ft)
Figure 4.
Peak Particle Velocity With Distance
From Geopier Installation (Fiegel 2005)
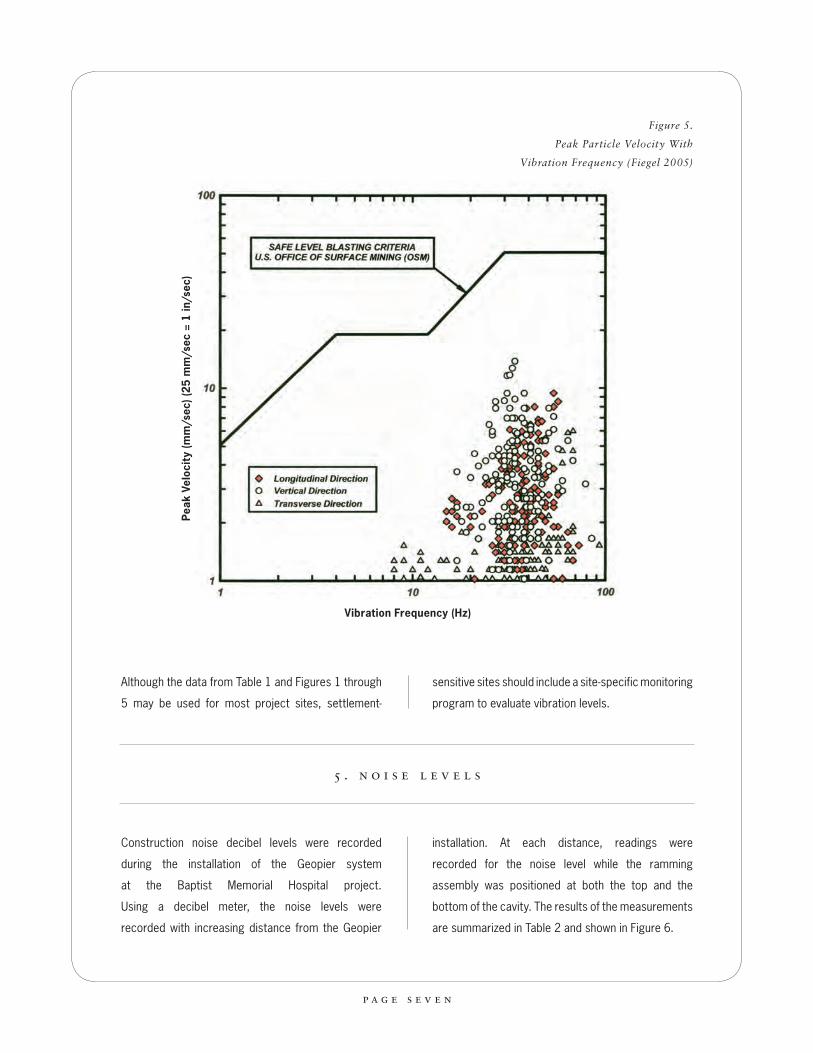
Figure 5 shows the peak particle velocities caused by
Geopier installation plotted with vibration frequency
as measured at the San Luis Obispo, California project
site. The figure indicates that the high frequency
energy used during installations results in peak
particle velocities lower than the recognized standard
threshold for building damage.
p a g e s i x
5 . n o i s e l e v e l s
Although the data from Table 1 and Figures 1 through
5 may be used for most project sites, settlement-
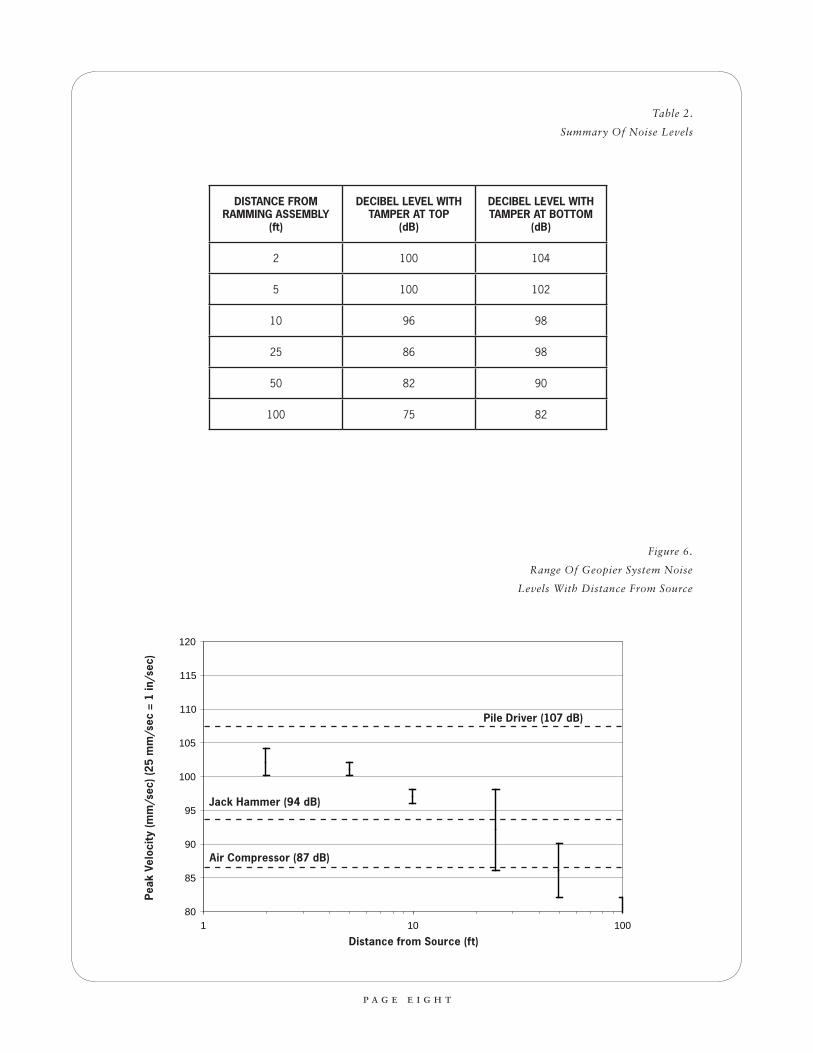
Construction noise decibel levels were recorded
during the installation of the Geopier system
at the Baptist Memorial Hospital project.
Using a decibel meter, the noise levels were
recorded with increasing distance from the Geopier
sensitive sites should include a site-specific monitoring
program to evaluate vibration levels.
installation. At each distance, readings were
recorded for the noise level while the ramming
assembly was positioned at both the top and the
bottom of the cavity. The results of the measurements
are summarized in Table 2 and shown in Figure 6.
Vibration Frequency (Hz)
Figure 5.
Peak Particle Velocity With
Vibration Frequency (Fiegel 2005)
Peak
Vel
ocit
y (m
m/s
ec) (
25 m
m/s
ec =
1 in
/sec
)
p a g e s e v e n
DISTANCE FROM RAMMING ASSEMBLY
(ft)
DECIBEL LEVEL WITH TAMPER AT TOP
(dB)
DECIBEL LEVEL WITH TAMPER AT BOTTOM
(dB)
2 100 104
5 100 102
10 96 98
25 86 98
50 82 90
100 75 82
Table 2.
Summary Of Noise Levels
Figure 6.
Range Of Geopier System Noise
Levels With Distance From Source
80
85
90
95
100
105
110
115
120
1 10 100
Distance from Source (ft)
Decibels (dB)
Pile Driver (107 dB)
Distance from Source (ft)
Peak
Vel
ocit
y (m
m/s
ec) (
25 m
m/s
ec =
1 in
/sec
)
Jack Hammer (94 dB)
Air Compressor (87 dB)
p a g e e i g h t

The decibel level for the Geopier installation process
reduces significantly with distance from the ramming
assembly. The decibel levels drop from approximately
100 dB adjacent to the Geopier installation equipment
to approximately 75 to 80 dB at a distance of 50 to
100 feet. For comparison purposes, it should be noted
that interpersonal communication is on the order of 60
dB, heavy truck traffic is on the order of 85 dB and pile
driving operations are on the order of 105 dB.
Rammed Aggregate Pier installations induce
high frequency (low period) vibrations during the
construction process. Vibration levels for the Geopier
system are typically within acceptable levels at
distances between 2 and 5 feet from the installation
location, while vibration levels for displacement Impact
and Rampact systems are within tolerable levels at
distances between 10 and 20 feet from installation
locations. Alternative construction approaches such
as predrilling helps reduce the vibration levels in close
proximity to Impact and Rampact piers. Noise levels
for all Rammed Aggregate Pier systems are consistent
with construction-type activities.
5 . n o i s e l e v e l s
p a g e n i n e

a c k n o w l e d g e m e n t s
The authors are indebted to Peterson Contractors, Inc. for providing vibration results and JGI/Eastern, Inc., French and Parrello Associates, and American Engineering Testing, Inc. for providing vibration monitoring ser-vices.
r e f e r e n c e s
Fiegel, G. (2005). Measurement of Vibration and Noise During the Installation of Rammed Aggregate Piers - Preliminary Data Report Draft, Department of Civil and Environmental Engineering. California Polytechnic State University. San Luis Obispo, CA.
Fox, N.S. and Cowell, M.J. (1998). Geopier Foundation and Soil Reinforcement Manual, Geopier Foundation Company, Inc., Scottsdale, AZ.
Wiss, J.F. (1981). Construction Vibrations: State-of-the-Art. ASCE Journal of the Geotechnical Engineering Division, 107 (GT2), pp. 167-181.
a u t h o r s
Brendan T. FitzPatrick, Director of Engineering/Development - North America, Geopier Foundation Company, Inc.Kord J. Wissmann, Ph.D., P.E., President / Chief Engineer, Geopier Foundation Company, Inc.
© 2006 Geopier Foundation Company, Inc.
© 2006 Geopier Foundation Company, Inc.Geopier®, Rammed Aggregate Pier®, Impact® and Intermediate Foundation® are registered trademarks of Geopier Foundation Company. The Rammed Aggregate Pier systems are protected under U.S. Patent Nos. 6,425,713; 6,688,815; 6,988,855; 5,249,892; 7,226,246; 6,354,766; 7,004,684; 6,354,768; 7,326,004 and other patents pending. The information contained herein has been carefully compiled by Geopier Foundation Company and to the best of its knowledge accurately represents RAP product use in the applications, which are illustrated. Printed in the U.S.A.

Geopier Foundation Company, Inc.150 Fairview Road, Suite 335Mooresville, NC 28117
Telephone: (704) 799.3185 or (800) 371.7470Fax: (704) 799.3235
e-mail: [email protected]

02_2012
Geopier Foundation Company, Inc.
800.371.7470www.geopier.com