geophysical methods of subsurface exploration applied to
TRANSCRIPT

85
Geophysical Methods of Subsurface Exploration Applied to Materials Surveys R. WOODWARD MOORE, Highway Engineer, Physical Research Branch, Bureau of Public Roads
• GEOPHYSICAL methods of exploring the subsurface have proved their worth for preliminary surveys in connection with many of the problems encountered in civil engineering. These rapid and relatively inexpensive methods have been used to explore foundation conditions at proposed sites for buildings, bridges, and large dams, to classify excavation materials in highway grading operations, to determine the depth of swampy materials, to investigate proposed tunnel sites, to study potential and existing slide conditions, and to locate and outline supplies of construction materials such as sand, gravel, solid rock, and other special geologic formations of engineering importance.
Although each of the above-named fields of application may be of primary importance in cases where a particular construction problem is concerned, the last-named application is unique m that the search for construction materials is likely to be of importance in almost every type of engineermg construction. The vast expansion in construction work, with its demand for greatly increased quantities of materials, already threatens to exhaust known sources of supply in some areas. Exploration for additional supply sources IS necessary and every means available, including the geophysical tests, should be employed in this important task.
Of the several geophysical test methods used in the fields of mining and oil exploration, only two have been found to be well adapted to the shallow explorations usually associated with civil-engineermg works. These are the refraction-seismic and the earth-resistivity methods of test.
The use of magnetic methods has been reported by several investigators in connection with the location of basalt plugs and other geologic formations possessing measurable magnetic properties. Although
the magnetic method may be used to advantage m such instances, its use and the interpretation of the data obtamed are somewhat involved, requiring specially trained personnel. It is the writer's opinion that magnetic methods have a limited value for use in a search for construction materials. Because of this limitation no further discussion will be made of the magnetic method.
The Bureau of Public Roads has done considerable research since 1933 in establishing the value of earth-resistivity and seismic methods in connection with highway construction. Field studies and demonstration tests have been made in 26 states and in the District of Columbia, and at the present time 13 states have used or are now using one or the other of these methods in their subsurface exploration work in connection with highway construction (5, 9, 10, 15, 39). Four other state highway departments are completing plans for use of the resistivity test m the immediate future. In addition, both seismic and resistivity methods are being used by other federal agencies, notably the Geological Survey, Bureau of Reclamation, and the Department of the Army, in ever-expanding fields of application having to do with water-supply problems, engineering geology, and investigations of dam sites for irrigation and flood-control purposes. Some of this work has been described in published papers (20, 22, 23, 24, 25, 27, 31, 42, 43). The reaHir Ts also referred to certain works for detailed discussions dealing with the theoretical aspects of the seismic and resistivity methods of test (4, 6, 7, 12, 14, 16, 19, 26, 28, 30). However, a limited description of the principles involved in these two methods of test will be presented in subsequent paragraphs in order that the reader may better understand graphs to be

86
E X P L O S I O N S E I S M O G R A P H
W I R E S -
.GROUND D E T E C T O R S
f I C L ' l O I M l
/yV S O L I D R O C K . ~ ^ 7 ^ S L O W _ , ^ S O I L / ^ T H R O U G H /
\ / S O I L ^
F A S T T H R O U G H ~ R O G k " " Figure 1. Sietch illustrating refraction seismic test.
D I S T A N C E T O
presented containing data obtained in field tests with both seismic and resistivity apparatus.
REFRACTION SEISMIC TEST
In this test the velocity of propagation of sound or vibration waves is used as a means for determining the character of and the depth to a given geologic formation lying belowthe earth's surface. Loose unconsolidated soils can have a wave transmission velocity as low as 600 ft. per sec. whereas wave velocity in solid, hard rock may approach 20,000 ft. per sec. Various intermediate velocities have been recorded for materials of varying densities such as
shale; cemented gravel; heavy dense clay or hardpan; weathered, badly seamed, or shattered rock; and for water-logged, silty soils found in some river deposits. Little trouble is experienced in locating solid rock beneath loose soils or beneath an ordinary moist clay formation. Some care must be exercised, however, in attempting to predict the type of material to be found in areas where the intermediate velocities (4,000 to 9,000 ft. per sec.) are obtained. It is good practice to make several calibration tests with the seismograph over exposures of formations believed to be typical for a given area, using the results obtained as a guide in properly identifying the various materials
Figure 2. Refraction seismograph developed by the Bureau of Public Poads for use in shallow subsurface e]9loration.

87
as they are encountered elsewhere in the immediate locality.
The simplified sketch shown in Figure 1 illustrates the principle of the refraction seismic test. The two detectors shown are for illustrative purposes only, since in practice the number of detector units may vary from 3 to 12 or more, depending upon the type of apparatus being
Figure 3. Typical film records obtained in seismic tests; note the kick displacement on the
right-hand trace.
used. In the seismic work done by the Bureau of Public Roads three detectors are used in conjunction with a rather simple oscillograph requiring no electronic amplication of seismic impulses. This apparatus has proved very satisfactory for use in the shallow explorations usual in civil engineering work. Figure 2 shows the apparatus with the three detectors shown in the foreground.
When making a test in the field the three sensitive detectors are placed in a
D E P T H OF S O I L , Hi = V. x 0 E
D E P T H O F S H A L E . H i = V i x E F
D E P T H T O R O C K - Hi * H i
S H O O T I N G D I S T A N C E
5UFIFACE
S H A L E - V E L O C I T Y - Vt
R O C K - V E L O C I T Y = V»
Figure 4. Theoretical time-and-distance curve.
line on the ground surface, spaced 25 to 50 ft. apart, and are connected by suitable two-conductor cables to the oscillograph which comprises the principal unit of the system. Small charges of dynamite, ranging from about 1/8 lb. to 1 or 2 lb., buried 3 or 4 ft. beneath the surface, are then fired at various distances from the group of detectors, on the detector line extended, and the time of wave travel from the shot point to each detector is recorded. Usually this line of shots must extend to a distance from the detectors, equal to approximately three to four times the depth to the particular formation under study. If rock is expected at, say, 50 ft., several shots will be required within the range 150 to 250 ft. from the detector group.
A record of the instant of firing the shot normally is obtained by a special circuit, one part of which is a length of small copper wire wrapped around the explosive. Through this wire a few milli-
SHOT
S O I L - V E L O C I T Y = V i /
\ e i H, \S r 1 ^ L E A S T T I M E PATH k /
V - " ^ ?= R O C K - V E L O C I T Y ^ '
Figure 5. Seismic-wave path of least time.

88
amperes of current is passed. The rupture of this wire by the explosion causes a break in one of the traces produced on the oscillograph f i lm . In Figure 3 the initial break may be seen in the right-hand trace on each of the f i lm records. The space between the time lines, shown as horizontal straight lines in this figure, represents a time interval of 0.005 sec., being obtained from an electrically driven
used by most investigators and has been used in the work of BPR at times where long shot distances were required and, where it was inconvenient to extend the four-conductor cable ordinarily used for the shot circuit.
Measured time and distance data are plotted in the form of a time-distance curve, such as the assumed or theoretical curve shown in the upper part of Figure 4.
o z o o llJ v>
- I I
UJ
30
25
20
15
10
o SHOT 238- 10' NORTH OF CENTER
X I I 239 - 50" u I I I I
I I 240 - 85" II I I I I
• I I 24 I - I2C' II a I I
I I I 242-175' I I I I I I
• " 243 -225' I I I I I I
/ 7
"Hr= ' ^4§o°^° + 1.5'= 4 2' LOOSE SURFACE SOIL" 1420 .
He' 13 6' L O E S S A L SOIL
19.2' GLACIAL T I L L 3 7 0 ' TO ROCK (LIMESTONE)
100 200
SHOOTING DISTANCE - F E E T
300 400
Figure 6. Time-distance graph for seismic test made near Council Bluffs, Iowa, in search for quarry material.
tuning fork operating at 100 cycles per second and so equipped as to permit 200 flashes of light from a suitably placed light source to reach the f i lm each second.
A second method for recording the time at which the shot is fired makes use of the rupture of the bridge wire in the electric detonator to indicate the event on the oscillograph record. An auxiliary circuit is provided for this purpose.
This second method, while probably not as precise as the first method, is that
The reciprocal of the slope of the line OA represents the wave velocity, V i , in the first layer of surface soil. As the shots are fired at increasingly greater distances from the detector locations a critical distance is reached, such as OG (or SDi), for which the wave traveling through the surface soil reaches the nearest detector at the same instant as a wave which passes down through the surface soil to the second layer, is refracted along the interface to a point beneath the detector and thence

89
travels upward to the detector (see Fig. 1 and the lower part of Fig. 4). Beyond this critical distance a new slope, AB, wil l obtain, the reciprocal of which represents the velocity, Va, in the second layer. For a path SQRD2 the time JK or OE is that required for the wave to travel through the surface soil from S to Q and from R to Da. KL represents the time of wave travel from Q to R in the second layer which will vary with the density of the second layer and the distance from the show point S. For the purpose of illustration, the distance SDa was arbitrarily chosen. Lettmg Hi represent the thickness of the surface layer, we may set up the relation
Hi = Vi X OE (1)
In like manner, for a third layer, such as rock, having a greater density than the overlymg formations, there wil l be a second critical distance, OM, and a second break in the graph at B to a new slope, BC, the reciprocal of which will give the velocity, Vs, in the rock. The time intercept, EF, in this instance, represents the time required for the wave to travel down through the second layer and back again. Letting Ha represent the thickness of the second layer we have
the two layers involved. Figure 5 shows this relation for a two-layer system. From this
Vi T a
Since a = 90°,
sin e ~ sin a sin a = 1 and
Va sin e
Thus the ratio of the velocities in the two layers determines the angle of incidence at the mterface. As stated previously, where the value of this ratio is of the order of one half or greater, a correction may be required, particularly for deeper work. This correction is necessary because the distance traveled and consequently the time of travel of the wave in a given layer increases as the angle of incidence increases, the increased distance being H . When this change is taken
cos e into account in Equation 1 for example, the expression for depth becomes
Hi = y^xOE (3) 2 cos e
Ha = Va X EF (2)
There are other, and perhaps more exact, formulas for obtaining corrected values for the computed depths which are described in some detail in the published literature (12, 19, 25,31, 40). The reader IS referreff lo these puElications for more detailed discussions of the analysis of seismic data.
For the equations given above it was assumed that the waves traveled vertically downward to the interface and vertically upward to the detector. This is not strictly true. However, the accuracy obtained when using Equations 1 and 2 is adequate for most shallow explorations ordinarily met with in highway work. When the ratio of Vi to Va or Va to Vs is of the order of one half or greater, a correction to take into account the inclination of the wave path may be required for use in the deeper tests such as may be involved in explorations of large dam sites and deep-lying geologic formations in order to attain the desired degree of accuracy.
Since the laws of optics apply to the path taken by the fastest wave, the ratio of the sine of the angle of incidence to the sine of the angle of refraction may be equated to the ratio of the velocities for
TYPICAL APPLICATIONS OF THE REFRACTION SEISMIC TEST
Figure 6 contains a time-distance graph for seismic data obtained in southwest Iowa while searching for quarry material in an area where surface geology indications were lacking. As shown in the figure, rock (limestone) was found at a depth of 37 f t . below the surface. The depth obtained from a seismic test is an average of the depth at the shot point and at the detector location. For this reason a correction of 1. 5 f t . , equal to half the shot depth, has been added as a second term in the equation for the depth of the f i rs t layer, as shown in Figure 6 and m subsequent figures dealing with seismic tests.
As stated previously, the geophysical tests may be applied to the solution of a number of the problems common to high-

90
way construction. Figure 7 shows data from a seismic test made in western North Carolina while investigating a section of the Blue Ridge Parkway in the Great Smoky Mountains National Park. This test, made at the location of a portal of one of five tunnels proposed for the 5-mi. -long project, indicated that there was little l ikel ihood of encountering rock within 43 f t . of the surface at this particular location. The relatively low wave velocity of 7,920 f t . per sec. suggests further that the formation immediately below this depth is either
S IS
T T H . .
H i •
H> •
2 0 « 9 5 0 . 4 0 0
2 8 8 . 1640 4 0 0
3 4 « 3110 4 0 0
10 4'
2 6 4 : 4 J .0 '
TO WEATHEREO OR FRACTURED ROCK FORMATION
O SHOT 10 WEST OF CENTER 15 E A S T
100 200 SHOOTING D I S T A N C E - F E E T
Figure 7. Seismic data obtained at proposed location of Tunnel 3, Project 2Z2, Blue Ridge
Parioray, in western North Carolina.
a weathered rock or a badly shattered or jointed rock, neither of which would be well suited for successful tunnel work without lining throughout and perhaps other special construction procedures.
Being portable, the seismic apparatus may be taken into areas virtually inaccessible to other means of exploring the subsurface. Figure 8 shows the apparatus being carried into rough mountain terrain to reach the several tunnel sites referred to above.
Figure 9 shows seismic data obtained in northeast California at the proposed site for a bridge to carry the Shasta-Lassen Highway across Lake Britton. The relatively soft, chalky material found near the surface is shown to extend down
Figure 8. Seismic equipment being transported over rough mountain slopes.
to a depth of about 54 f t . to firmer, better foundation materials.
Although other data could be presented and instances cited in which seismic tests have been successfully employed, it is believed that this test has a limited value for general use in prospecting for materials of construction, other than solid rock. For this reason discussion of the use of this method for this particular application wil l not be extended.
1 3 9 0 * 19-10 4
4 0 0
TO WEATHEREO OR BROKEN ROCK
p 20
SHOT 10- WEST OF CENTER
145'
100 2 0 0
S H O O T I N G D I S T A N C E - F E E T
Figure 9. Refraction seismic test at north abutment location for bridge across Lake Btitton,
California, on 9iasta-Lassen Highway.

91
Figure 10. >̂ ewof the resistivity apparatus usedby the Bureau of [\iblic Roads.
EARTH-RESISTIVITY TESTS
The earth-resistivity test consists of passing a direct current of electricity through the ground and measuring the resistance to current flow through the earth's materials. This current flow is electrolytic in nature and is dependent upon the moisture and dissolved salts within the soil and rock formations to provide a suitable path. Consequently, any materials having reasonably high moisture content, such as moist clays, silts, and organic muck soils, with an increased capacity for dissolved impurities, wi l l usually conduct a direct current readily and wil l have a low re
sistivity. Conversely, materials such as dry, loose soil; sand and gravel; hard-pan; and solid rock, having a limited amount of moisture and the all-'important dissolved salts, wi l l usually possess relatively high resistance to current flow. Because of this variation in resistivity i t is quite often possible, by means of rather simple field tests, with electrodes placed on the surface or driven a few inches into the surface soil, to obtain useful information regarding the subsurface formations by utilizing measured values of resistivity at a particular location. However, materials quite different from an engineering viewpoint, that IS, easy to excavate or quite difficult to
BATTERY M I L L I A M M E T E R POTENTIOMETER
O 888
t 3 _f«—C=VOLTS—j
J=AMPERES
NON-POLARIZING ELECTRODES GROUND SURFACE STEEL PIN ELECTRODE
SOIL WITH LOW RESISTIVITY CURREilT FLOW LINE
ROCK WITH HIGH RESISTIVITY
Figure 11. Electrical-resistivity instrument and the four-electrode configuration ocnmnly used.

92
remove, may possess similar resistivities, particularly when found in different geogrj«)hical regions, and it is essential that tr ial or calibration tests be made in each general area where resistivity surveys are to be made. These tr ial tests, made over known geologic formations exposed to view in existing road cuts or identified by dr i l l holes, test pits, etc., provide characteristic resistivity curves for each type of soil, weathered material or solid rock t j^ ical of the area. These type curves may then be compared with each field curve obtained in testing over unknown conditions in the course of the resistivity survey. Close similarity between a field curve and a particular calibration curve is indicative of similar geologic conditions in the subsurface.
The instruments used are portable and can be taken into areas virtually inaccessible to other, less portable, apparatus. Figure 10 shows a view of the simple milliammeter-potentiometer type of resistivity apparatus used by the Bureau of Public Roads.
Although the resistivity test has been used to advantage on numerous projects having to do with classification of earthwork and for slope design, as well as the exploration of bridge foundations, tunnel sites, swampy areas, etc., its most unique application, perhaps, is in the field of materials surveys. Rapid tests, extended across relatively large areas, make it possible to locate isolated deposits of sand and gravel or solid rock where no surface indications exist. Furthermore, having located a hidden deposit of granular material, much useful information may be obtained regarding the lateral extent and thickness of the useful material. Other material such as chert, soft sandstone, caliche, solid rock, ^ d special soil types may be located in a similar manner if the material has resistivity characteristics differing from those of the surrounding or overlying material.
THEORY AND PROCEDURE IN MAKING EARTH-RESISTIVITY TESTS
The Resistivity-Depth Test
In Figure 11 a schematic diagram
shows the Wenner (1) four-electrode configuration ordinarily used in making resistivity measurements and the several component parts of the ^paratus used by the Bureau of Public Roads. When conducting a test a direct current of electricity, I , supplied by a group of radio B or C batteries, is sent through the ground between electrodes Ci and Cz and a potential drop, E, is measured between electrodes Pi and P 2 which are equally spaced between the two current electrodes. The measured values of E and I are inserted in a simple formula P = 2n AE/ I , in which P is the resistivity in ohm-centimeters, A is the electrode spacing in centimeters, E is the potential drop in volts and I is the current, in amperes, flowing through the soil. In practice it has been found that an empirical relation exists between the electrode spacing and the effective depth of the test such that the electrode spacing is equal to the depth involved. Using an electrode spacing of 6 f t . , for example, it may be assumed that the measured resistivity applies to the soil lying within 6 f t . of the surface. By progressively increasing the electrode spacing the test is carried deeper and deeper into the subsurface and the measured values of resistivity are plotted in a curve showing the relation of resistivity to electrode spacing or depth. This type of test is commonly referred to as the resistivity-depth test. For the two-layer formation shown in Figure 11 the relatively low resistivity of the soil overburden wil l control the measured values of resistivity until the test has been carried deep e-nough to involve increasingly larger volumes of the underlying high resistivity layer of rock. As this occurs an upward trend develops in the resistivity-depth curve indicating the presence of the high resistance layer and its approximate depth below the surface. Gishand Rooney (2) found that the inflection point in the curve could be taken as an indication of the thickness of the surface layer. A l though this rather simple empirical method of analyzing earth resistivity data has had considerable use in the past, i t is possible to obtain smoothly rounded curves which show no clearly defined inflection point, and are, therefore, difficult to analyze directly.

93
Another equally simple empirical method, developed by the Bureau of Public Roads, makes use of the Gish-Rooney curve together with a graphical integration of the curve for analyzing the data obtained in the depth test. This method of analysis, the cumulative-curve method, can be applied to all types of curves, whether smoothly rounded or showmg sharp mflection points, with surprisingly good results.
Figure 12 contains curves illustratmg the cumulative method of analysis, the upper curve, labeled A, being the Gish-Rooney curve plotted from data obtained over a two-layer formation and the lower curve, labeled B, being the cumulative curve. Table 1 contains the field data used in plotting the curves shown in the figure.
TABLE 1
RESISTIVITY-DEPTH TEST DATA USED IN n C U R E 12
l aOi - 30|
Electrode Apparent Cumulative spacing resistivity resistivity Remarks
It Ohm- Ohm-centlmetera centimeters
3 8885 6885 Drill hole record 6 5990 12875 showed clay to 9 6325 19200 13 2 feet under
12 7735 26935 lain by hard 15 9260 36195 rock 18 10925 47120 21 V 12730 59850
1 5 7955 Not used In cumu latWe curve.
7.5 6045 do
The cumulative-curve method of analysis has been described in earlier publications (34, 36, 37, 46, 48) and it has been used by the Bureau of Public Roads with satisfactory results. Briefly, the Gish-Rooney curve (Curve A, Figure 12) is used to determine the probable number of subsurface strata while the inflection points on this curve are used to give significance to the straight-line intersection points obtained from the cumulative curve (Curve B, Figure 12). The trend in Curve A at an electrode spacing of 7. 5 to 9 f t . suggests the presence of the rock found at 13.0 f t . m Curve B. Had Curve A been extended on to a depth of 30 to 40 f t . an additional intersection might have been obtamed in Curve B, but no significance could be given this second intersection if there was no corresponding trend in Curve
150
z s z
°^ at *"
120 I-J20 s
90
60
30
25
0 ' - 0
CURVE A x' /
K y
" / / /
t u R V E B
112' / CLAY 1 HARD ROCK
40 10 20 30 ELECTRODE S W C I N G - F E E T
Figure 12. Bipirical method of analysis applied to resistivity curve for a clay stratum underlain by rock in the v ic ini ty of Washington, D.C
A. Very slight trends in Curve A, often obtained where thick layers of soil overburden rest upon bedrock or sand and gravel, are used m this manner to give credence to the intersections obtained in the B curve.
Theoretical methods of analysis,based upon assumed ideal conditions seldom found in the field, have been used by many investigators in analyzing earth-resistivity data. The writer has found them of little use in the shallow explorations ordinarily involved in highway-engineermg explorations. For the most part, the theoretical methods consist of using groups of curves, obtained for data computed for various assumed formation layers, resistivities, and layer thicknesses, to which the field curves are fitted to ascertain which of the assumed conditions most nearly approaches those existing where the field tests were made. Use of such methods appears to be more practical for the deeper explorations in areas where the geologic formations are likely to be of considerable thickness and more uniform in character, and where simple calibration tests over known conditions may be impractical.
These methods have been described in some detail and no attempt will be made
94
to discuss them further. The reader should review references given in the appended bibliography for a thorough treatment of the subject (4, 6, 7, 14, 26, 28, 30). It should be emphasized, however, that m
u 150
w l O O
100 2 0 0 300 4 0 0 500 6 0 0 TRAVERSE DISTANCE - FEET
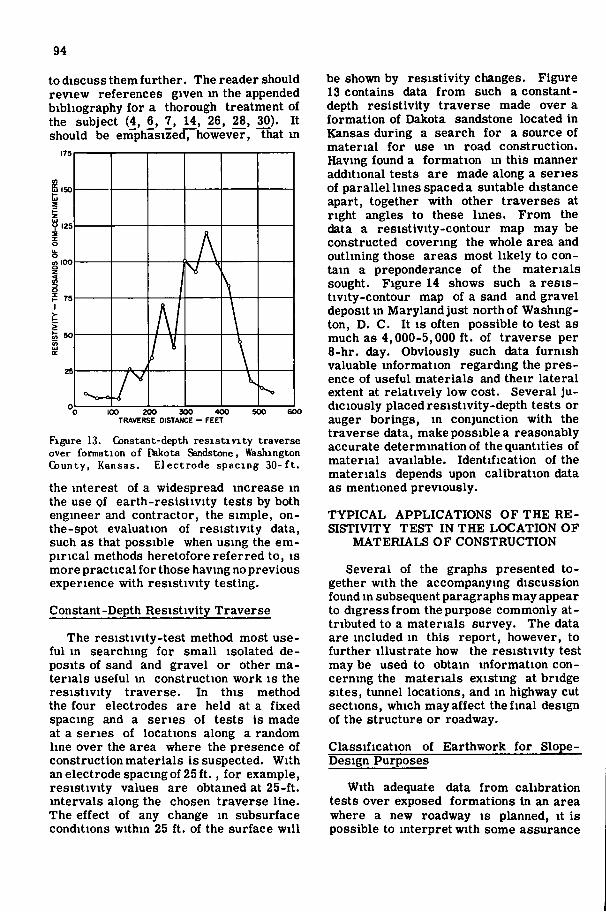
Figure 13. Constant-depth resistivity traverse over formation of [bkota Sandstone, Washington County, Kansas. Electrode spacing 30-ft .
the interest of a widespread increase in the use of earth-resistivity tests by both engineer and contractor, the simple, on-the-spot evaluation of resistivity data, such as that possible when using the empirical methods heretofore referred to, is more practical for those having no previous experience with resistivity testing.
Constant-Depth Resistivity Traverse
The resistivity-test method most useful in searching for small isolated deposits of sand and gravel or other materials useful m construction work is the resistivity traverse. In this method the four electrodes are held at a fixed spacing and a series of tests is made at a series of locations along a random line over the area where the presence of construction materials is suspected. With an electrode spacing of 25 f t . , for example, resistivity values are obtained at 25-ft. intervals along the chosen traverse line. The effect of any change in subsurface conditions within 25 f t . of the surface wil l
be shown by resistivity changes. Figure 13 contains data from such a constant-depth resistivity traverse made over a formation of Dakota sandstone located in Kansas during a search for a source of material for use in road construction. Having found a formation in this manner additional tests are made along a series of parallel lines spaced a suitable distance apart, together with other traverses at right angles to these lines. From the data a resistivity-contour map may be constructed covering the whole area and outlining those areas most likely to contain a preponderance of the materials sought. Figure 14 shows such a resis-tivity-contour map of a sand and gravel deposit in Maryland just north of Washington, D. C. It is often possible to test as much as 4,000-5,000 f t . of traverse per 8-hr. day. Obviously such data furnish valuable information regarding the presence of useful materials and their lateral extent at relatively low cost. Several judiciously placed resistivity-depth tests or auger borings, in conjunction with the traverse data, make possible a reasonably accurate determination of the quantities of material available. Identification of the materials depends upon calibration data as mentioned previously.
TYPICAL APPLICATIONS OF THE RESISTIVITY TEST IN THE LOCATION OF
MATERIALS OF CONSTRUCTION
Several of the graphs presented together with the accompanying discussion found in subsequent paragraphs may appear to digress from the purpose commonly attributed to a materials survey. The data are included in this report, however, to further illustrate how the resistivity test may be used to obtain information concerning the materials existing at bridge sites, tunnel locations, and in highway cut sections, which may affect the final design of the structure or roadway.
Classification of Earthwork for Slope-Design Purposes
With adequate data from calibration tests over exposed formations in an area where a new roadway is planned, it is possible to interpret with some assurance

4+50
0+00 NO.M
6+00
0+00
0+00
Naie 0+00
0+00 No I I
0+00 No 24
-^0+00 No 3
orking Fou Ol of 9 / t 0 / 4 0
0+00
O+OO No 21
Scolo - I " . 50'
Rnl t l i f l ty Rtcofdod ID Oha - Boltri
Figure 14. Resistivity-contour map of area adjacent to gravel pit near Vkiirkirk, Maryland.
CO O l

96
u
0>
p r — 0 -
\ \
/ /
\
\ \
^ 0
\ \
\ /
/ / 1
\ / b
\
\
EA (
\
\ -~-o 4
L
9 /
\ \
\ \ \
/
t / 1 t
1 / t
1 ^ S A N O
7 J -
•a'
v . .
r HTM.
" — \
10 I>T3-F
20 3 0 20 30 4 0 90 0 ELECTRODE SMCINO OR OEPTM-FEET
Figure 15. Resistivity-calibration curves ( left) and typical field curves obtained in the Ozark National Forest near nissel lvi l le , Arkansas.
40 SO
the resistivity data obtained elsewhere m the area and to obtain sufficient information regarding the subsurface formations to make possible a proper slope design without analyzing the individual curves for a specific depth to formation changes at each test location. Figure 15 shows curves for resistivity data obtained in northwest Arkansas over exposed sandstone, clay, and shale formations (left-hand graph) typical of the area, and over representative cut sections from about 22 mi. of proposed roadway (right-hand graph). This investigation, carried out in rugged country in the Ozark Mountains, required only 12 working days and the tests were made by inexperienced men with only minor supervision by the writer. Yet, even an inexperienced man could readily see the striking resemblance between many of the field curves obtained and the calibration curves obtained over "earth" easily excavated by large self-loading scraper units. Slopes designed for earth, as interpreted from the resistivity data.
were found to meet actual field conditions in practically every instance for the cut sections on the two grading projects thus far completed. Wherever rock was present it was found at depths closely approximating those predicted from the results of the resistivity tests. Other investigations, made in Tennessee and Virginia, have also been quite helpful in slop design.
Foundations for Bridges
Although the mere knowledge that bedrock does or does not exist within practical depths at a particular structure location is often sufficient for preliminary design purposes, rather accurate depth determm-ations are possible in instances where the geologic conditions approach those assumed in a theoretical treatment of the resistivity test. Figure 16 shows data obtained in Virginia near the west abutment of the Memorial Bridge spanning the Potomac River at Washington, D. C., showing rock at a depth closely approximating the depth

97
found by the dr i l l at the abutment located about 150 f t . away. Other tests for structure foundations made in New Hampshire, Georgia, and Kansas have been even more accurate when compared with results obtained by drilling.
Investigations for Tunnel Sites
By calibrating over materials considered good for tunneling purposes and over materials considered unsatisfactory, control curves are obtained which make-it possible to obtain valuable preliminary
O u
o -> ?c2
/ » -« I x '
- 4 l t f
<
/ 1 noon. SHO« }F ABUTME
NAT4q'F0 NT ISO TO
IMEDGE SOUTH OCATION 2
IMEDGE SOUTH OCATION
~0 2 0 4 0 6 0 s o 100 ELECTRODE SRACldO-FEET
Figure 16. Resistivity test near west abutment of Arlington Meirorial Bridge, Washington, P.C.
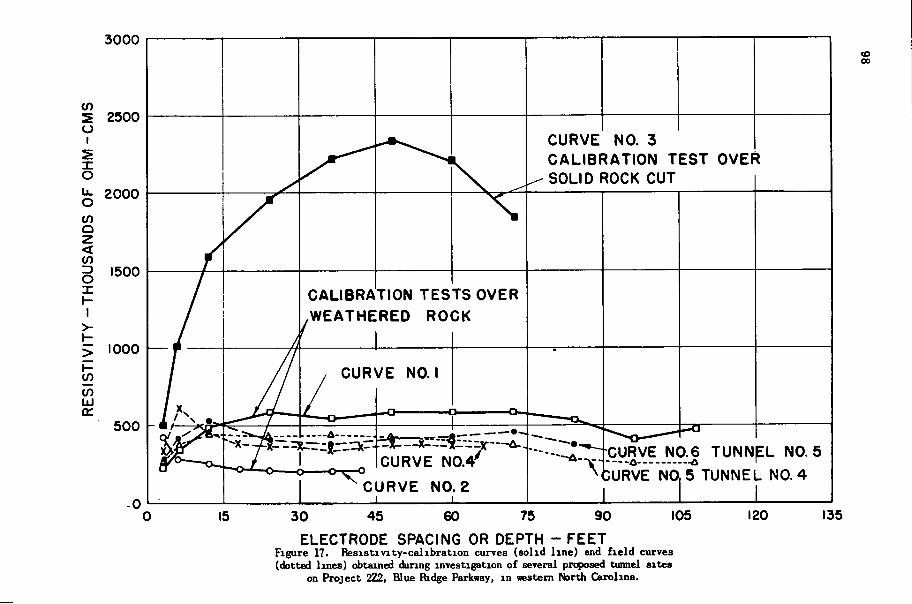
information regarding the materials present at a tunnel site with a few rapidly made resistivity tests. While studying the subsurface conditions on a section of the Blue Ridge Parkway in western North Carolina, five tunnel sites and several miles of grading were investigated in kbout four days' time and information obtained regarding the probable character of the materials to be found in 21 cut sections and at the several tunnel locations. Figure 17 contains resistivity curves for data obtained at two of the tunnel locations (Curves 5 and 6) and over one large cut (Curve 4), together with data from three calibration tests made over known geologic formations exposed to view on a partially completed construction project adjoining the project under investigation. Curves
1 and 2 of the calibration tests (solid-line curves) were obtained over a weathered rock formation at a location where a projected tunnel had collapsed during the early construction stages due to the unsatisfactory character of the formation involved. These two curves completely bracket the three curves obtained over unknown formations. From these data one would expect that the conditions at the two proposed tunnel sites and at the location of the large cut could be little different from that found at the location where the tunnel failure had occurred. Accordingly, as a result of these tests, and others made throughout the length of the project, earth and weathered rock formations were predicted for all five tunnel sites and m most of the 21 cut sections investigated. The sharply rising trend m Curve 3 of Figure 17, obtained from a test made over a solid rock formation exposed m a cut on the nearby project, by its contrast, adds support to the prediciton that weathered rock would probably be found at the locations of tunnels 4 and 5.
Several refraction seismic tests were made at locations where resistivity curves had been obtained that were thought to be typical of those obtained throughout the project. The rather low wave velocities obtained for the materials above grade also were characteristic of weathered material. Thus the seismic test served as a convenient and rapid check upon the more detailed resistivity survey.
Many other instances could be cited and data presented further emphasizing the practical use of the resistivity test in field surveys to study subsurface conditions in swampy areas, slide areas and soil-boulder or glacial t i l l formations, the two latter formations bemg very troublesome to the dr i l l operator. As stated previously, however, the resistivity method of test has special promise when applied in a search for materials of construction, and this important application will be discussed in subsequent paragraphs.
Location of Materials of Construction
Certain sections of the country are fortunate in havmg almost unlimited sup-
< O X »-
I >-
en
UJ a :
3000
2500 to o
I
X O ^ 2000 CO o
1500
1000
500
C U R V E C A L I B F
^ SOLID 1
NO. 3 NATION T ROCK CUT
E S T OVEf
CAL IBRA .WEATHE
TION T E S R E D RO
T S OVER CK
/ ^
, CUR
^ - o -
y/E NO. 1
^ C
C U R V E N0.4''
U R V E NO. 2
CURVE N( DURVE NO
1 D.6 TUNN
5 TUNNE
E L NO. 5
- NO. 4
CO 00
15 30 45 60 75 90 105 120 135 ELECTRODE SPACING OR DEPTH - F E E T
Figure 17. Elesistivity-calibration curves (solid line) and field curves (dotted lines) obtained during investigation of several proposed tunnel sites
on Project 2Z2, Blue Ridge Parkway, in nestem North Carolina.

99
plies of sand, gravel, and other materials useful in construction work. Other areas are less fortunate and those concerned with maintaining adequate supplies of such materials must hunt far and wide for usable deposits. Even in areas plentifully supplied there have been instances where materials have been transported for some distance for use in construction work while adequate supplies lay hidden immediately adjacent to the project. The ultimate goal for the materials survey is not only to locate the quantities of material needed, but to locate the materials as near to the project on which they are to be used as is possible.
The Baltimore-Washington Parkway, now under construction, passes through a section of Maryland underlain, for the most part, by clay soils that make it desirable to use a layer of granular materials under the pavement to provide greater stability than would obtain if the pavement were laid directly upon the clay. A recent resistivity survey was made on a 3-mi. section of the parkway, now under construction, in an effort to locate some 85,000 to 90,000 cu. yd. of granular materials needed for use over soils of the type described. Considerable trouble and expense would be avoided if the material could be located within the right-of-way boundaries at locations within the limits of the project, eliminating the necessity for purchase of the materials and hauling them in from more distant locations.
In planning a survey of this type, the usual procedure is to make ful l use of all existing geologic information, such as that to be obtained from geologic maps, aerial photographs, and in records of dr i l l holes or borings made within the area. This general procedure was followed in the example being described. Reference was made to recorded data obtained from dr i l l holes and borings that had been made in several of the larger cuts and also to an existing geologic map that showed scattered remnants of plateau gravels, laid down by ancient river action, within the general area traversed by the parkway. The projected roadway apparently passed through one of these small areas in a cut section some 30 to 40 f t . deep at a location near the north end of the project. This area was selected as the most likely for
finding substantial quantities of granular materials. Aerial photographs indicated well-drained soils at this location also.
A tr ial test was made consisting of a constant-depth resistivity traverse to a 30-ft. depth, run along the ditchline of an existing roadway which crossed the line of the parkway at an angle with the center-line. Other tests were made along the centerline of each roadway of the parkway and a fourth test was run across a prominent "high" resistivity area that appeared in each of these two latter traverses. Figure 18 shows the plotted data from each of these tests. The high resistivity zones shown on traverses 2, 3, and 4 are characteristic of sand and gravel found in this part of Maryland.
Figure 19 shows a resistivity contour map drawn up from the data contained in Figure 18. The circled crosses marked D. T. indicate locations where resistivity depth tests were made. This map indicates a reasonably large area underlain by sand and gravel of the type desired. Figure 20 shows the results of eight depth tests made in the area to determine the depth of the materials causing the high resistivity zone shown on the map of Figure 19. Graphs B, C, and H indicate that the depth of the sand and gravel throughout the area enclosed by the 400,000 ohm-cm. contour will be m excess of the actual cut to grade, as shown on the profile sheets for the northbound and southbound roadways. In fact, within the area enclosed by the 200,000 ohm-cm. contour, the proposed cut probably contains materials equally as suitable as that shown by the log of boring No. 50, made at a point 35 f t . to the right of station 2+85, traverse No. 3, on the northbound roadway. This is indicated by the relatively low value of resistivity, 130,000 to 140,000 ohm-cms., obtained at a depth of 30 f t . in a depth test made m the vicinity of the bore hole (see Graph A of Figure 20). A rough estimate of the volume of the material available is 85,000 cu. yd. A more conservative f i g ure for a quantity of sand and gravel comparatively free of clay might be obtained by restricting the area to that within the 300,000 ohm-cm. contour. Within this area a quantity of about 60,000 yd. of material of good quality is indicated.
Another area located in a similar man-

TRAVERSE NO I 0 + 0 0 468 ' RIGHT OF STA 832 + 10 N B ROADWAY, TEST ALONG S DITCH LINE LAUREL-FT MEAOE RO ELECTRODE SPACING SO'
400 SCO fOO TOO
TRAVERSE DISTANCE - FEET
TRAVERSE NO 2 ALONG i S B ROADWAY 0 + 0 0 STA 8S3 + S0 + RUNNING TO SOOTH ELECTRODE SPACING 3 0
in 300
O o
300 400 900 w o TRAVERSE DISTANCE -FEET
IDO
t o n
1 1 1 TRAVERSE NO 3 0 + 0 0 STA 834 + 0 0 i N B ROADWAY,
900
( XECTROO E SPACIN( > 30 '
400
300
0 TOO 900 10 400 900 ( 0 0
TRAVERSE DISTANCE - FEET
Figure 18. Qirves showing effect of localized areas of high-resistivity sand and gravel upon constant-d^th resistivity traverse, electrode spacing 30 ft.
TRAVERSE NO 4 0 + 0 0 3 0 0 RIGHT OF STA 828 + 0 0 K B ROADWAY.RUNNING APPROX RIGHT ANGLES TO I ELECTRODE SPACING 3 0
300 400 900
TRAVERSE DISTANCE •

101
D T ^ ® D E N O T E S D E P T H T E S T L O C A T I O N
R E S I S T I V I T Y IN O H M - C M S S C A L E l " - 1 0 0 '
T R A V E R S E N ^ T * ? /
^ 6 + 8 0
DT 6
NO. 4
BORING ^ iNO 50 ^
\ OT I
4 0 A 0 0 ' ' ' 3 Q , Q Q q
5 6
T O F T M E A D E T R A V E R S E
T R A V E R S E T R A V E R S E N O 3 N 0 . 2
Figure 19. Resistivity-contour map outlines lateral extent of sand and gravel deposit, Baltimore-Washington Parkway.
ner within the right-of-way limits near the south end of the construction project appeared to contain a considerable amount of suitable granular material.
This somewhat-detailed discussion of the application of earth-resistivity tests to a search for granular materials has been included to emphasize the usefulness of such tests in the preliminary planning stages for a construction project. A survey such as that described in the preceding paragraphs will be of greatest value if made prior to any program of direct investigation involving borings or test pits. These slower and more expensive methods would then be restricted to areas where the resistivity tests showed promising resistivity zones, high for granular soils and low for the clayey, impervious soils. For a particular location more complete information would be obtained with a minimum of bore holes by this procedure.
For example, the granular materials found at this location by the resistivity tests had not been disclosed in a satisfactory manner by the single boring made prior to the resistivity survey. The best material was situated at some distance from the arbitrarily chosen bore-hole site. More useful information would have been obtained if the location for the boring had been selected on the basis of the resistivity survey data, that is, in the center of the high resistivity zone shown in Figure 19. Use of the resistivity test in this manner as a guide for more direct exploration work and to expand the information already available from such direct means of exploration is one of its more valuable applications.
LIMITATIONS AND RELATIVE MERITS OF SEISMIC AND RESISTIVITY TESTS
Al l methods of exploring the subsurface

o to
I - 4 -
CCPTHT 1 n r M
. V
m -<L
a t t i n mivm
-r' m -<L
I f / / . s a&s^w riiM)jy|
CUXTMOC IHCBB 01 DOTM ' K C I
E
•OOTH TOT KLft' m T+30 n u y o s » s
(Mnflaa M t - o i m i t a a i
*•
r'
t
1 ' OCRK TOT n 1 '
fTLS«OOTIUVCRSCttt
• 0
•
F
1 1
STA 4««o n u v c s s t » 4
r
7 f / I y
r f
nfc i iB t t n c M t 01 ocffH • n t r
m. 4+<o n ST 104 IVOBC
•CM cor as r o A ) -
/ oicnmt snem oi ocnit-rtn
10 - § w w
1 • KPTHTCST « •
m i*» T u v m c m i I MB AAA am-at M w r n t s j
\ i \
f J
/ /
1 m
1 1 oOTi n *n T u
1 1 VCRSt M •mom
1 > 4 M l —
/ * •-
aCCTWOC SPttiM « DtPTH-Ftr ELECTBOM SMCIMfi OS MPTH-fKT 0 « n M «o M
CLCCTROOC SP4CINC (ff OCPTH rCET
STA
I I (EPTH TEST n t ' 4«40 TUVCRSC « l 1 no OMI-CII (BMTllIR \
*
f /
fl t f /
N
CUCTROtC SMCIWM OCPTH-FCET
Figure 20. Resistivity-depth tests showing thickness of surface layer of clean sand and gravel underlain by clay.

103
have their limitations and geophysical tests are no exception to the rule. Seismic tests are efficient m locating rock formations, particularly in a restricted area such as that for a bridge location, tunnel, or dam site. This method of test, however, is not well adapted to rapid surveys over large areas. It appears to have little value in systematic surveys for sand and gravel deposits and other materials having little of the rigidity mherent in solid rock. Its use on highway-grading projects for obtaming information to control slope design has met with success in the work of the Bureau of Public Roads and in the subsurface exploration work of New York and Massachusetts (39). In certain areas where the geologic formations are made up of alternating beds of shale and limestone or sandstone, the seismic test has not proved applicable. Although the dense rock can be located without difficulty, the less-dense shale underlying the higher velocity rock layers will be difficult, if not impossible, to locate. On the other hand, this test can locate solid rock beneath the talus and boulder formations that are so troublesome in drilling operations. While the seismic method can be used in mucky soils and swampy areas its use is costly compared with the conventional methods employed for probing through such materials.
Usually from two to eight locations per day can be explored with the seismic method, the depth to be explored being the controlling factor. Although many times faster and much less expensive than any of the direct methods commonly used, the seismic test is much slower than the resistivity test in the shallow explorations (15 to 50 f t . ) commonly required for highway work and cannot compete, except in areas where the conditions are such as to preclude the use of the resistivity method.
In areas where the subsurface formations are reasonably uniform and not badly upheaved or unevenly weathered, the seismic data obtained are not difficult to analyze, the novice obtaming substantially the same depth determination as the experienced operator. However, the field operation and mamtenance of the seismic apparatus will require more extensive training than that required for the resistivity apparatus, and the transportation.
use, and storage of explosives can be a troublesome factor at times.
Earth-resistivity tests, except under unfavorable geologic conditions, wil l produce results as dependable as those obtained for seismic tests in the shallow explorations required in highway work. Although interpretation of the resistivity data can become complicated for the deeper tests, it has been the writer's experience that the simple empirical methods of analysis described, together with adequate calibration of the test over known formations, can be relied upon to produce data useful for a study of foundation conditions and of problems of slope design. The talus and soil-boulder formations can be successfully explored by resistivity tests also, since the rock fragments and boulders when mixed with soil usually possess resistivities differing from that of a solid mass of rock or shale. Sand and gravel can possess a resistivity more than 100 times as high as that of some rocks and shales. However, even a superficial knowledge of local geology, coupled with the all-important calibration tests over typical local formations, will enable one to properly eveluate the results of resistivity tests in most instances.
Extremely dry, loose sand may have resistivities closely approximating that of solid rock upon which it rests and may prevent a proper identification of the boundary between the two materials by this method. In such a case seismic tests will locate the rock without difficulty.
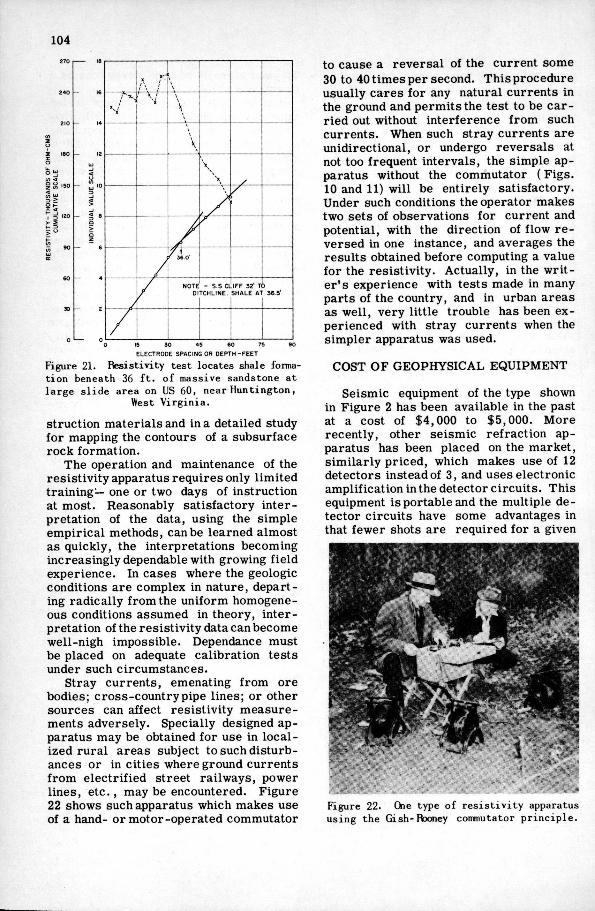
The resistivity test can be useful m a study of formations that consist of alternate beds of hard rock and less dense materials such as shale. Figure 21 shows data, obtained in a study of slide conditions in West Virginia, that indicate the method may have possibilities for locatmg a shale formation beneath dense sandstone. Seismic tests at this location would have been futile.
An important advantage of the resistivity method over the seismic method is that it may be used in a constant-depth traverse procedure to locate the lateral limits of subsurface formations and abrupt irregularities in an underlymg rock formation. Such a traverse, made at a rate of 4,000 to 5,000 f t . per day, can be of great value in a rapid reconnaissance survey for con-
104
i§ 150
op J <
I 3 '20
i X ' - '
' \ / \
' 56.0'
NOTE D
- 5 .S CI T C H L I N E .
I F F 32' T S H A L E A1
) 36 5'
E L E C T R O D E SP/ICING OR O E P T H - F E E T
Figure 21. Resistivity test locates shale formation beneath 36 f t . of massive sandstone at large slide area on US 60, near Huntington,
West Virginia.
struction materials and in a detailed study for mapping the contours of a subsurface rock formation.
The operation and maintenance of the resistivity apparatus requires only limited training— one or two days of instruction at most. Reasonably satisfactory interpretation of the data, using the simple empirical methods, can be learned almost as quickly, the interpretations becoming increasingly dependable with growing field experience. In cases where the geologic conditions are complex in nature, departing radically from the uniform homogeneous conditions assumed in theory, interpretation of the resistivity data can become well-nigh impossible. Dependance must be placed on adequate calibration tests under such circumstances.
Stray currents, emenating from ore bodies; cross-country pipe lines; or other sources can affect resistivity measurements adversely. Specially designed apparatus may be obtained for use in localized rural areas subject to such disturbances or in cities where ground currents from electrified street railways, power lines, etc., may be encountered. Figure 22 shows such apparatus which makes use of a hand- or motor-operated commutator
to cause a reversal of the current some 30 to 40 times per second. This procedure usually cares for any natural currents in the ground and permits the test to be carried out without interference from such currents. When such stray currents are unidirectional, or undergo reversals at not too frequent intervals, the simple apparatus without the commutator (Figs. 10 and 11) will be entirely satisfactory. Under such conditions the operator makes two sets of observations for current and potential, with the direction of flow reversed in one instance, and averages the results obtained before computing a value for the resistivity. Actually, in the writer's experience with tests made in many parts of the country, and in urban areas as well, very little trouble has been experienced with stray currents when the simpler apparatus was used.
COST OF GEOPHYSICAL EQUIPMENT
Seismic equipment of the type shown in Figure 2 has been available in the past at a cost of $4,000 to $5,000. More recently, other seismic refraction apparatus has been placed on the market, similarly priced, which makes use of 12 detectors instead of 3, and uses electronic amplification in the detector circuits. This equipment is portable and the multiple detector circuits have some advantages in that fewer shots are required for a given
Figure 22. One type of resist ivity apparatus using the Gish-Rooney commutator principle .

105
depth determination. Amplifying the recorded seismic impulses permits smaller charges of explosives to be used, a distinct advantage when making tests in urban areas. Some difficulty may be experienced in attempting to use the 12 detectors in rough mountain terrain due to differences m surface elevations, relative thickness of surface soil at each detector, etc. Extra weight, such as that resulting from the nine extra detector units, wil l be objectionable if the apparatus must be transported by hand into a reas far removed from roads and trails. The emergency repair of such equipment wil l require some training in electronics for those attempting i t . Repairs to the apparatus used by the BPR are comparatively simple.
Earth-resistivity apparatus of the type shown in Figure 10 can be purchased for about $800 and can be built for less in instances where the prospective buyer wishes to construct his own apparatus. The commutator-equipped apparatus usually has sold for about twice as much as the simpler apparatus.
TIME REQUIRED FOR TESTS
way and other civil engineering construction. The earth-resistivity test is probably the better of the two methods in that it is faster and has wide application to air of the problems involving the shallow tests; while the seismic refraction test is of greatest use for the deeper tests to locate a rigid, dense medium, such as solid rock. In the light of the foregoing discussion, it I S evident that both methods may be used jomtly to explore a given subsurface condition, one to corroborate the results obtained with the other. This procedure is followed in the work done-by BPR, the seismic test being used to obtain a rapid check on the accuracy of the indications from the more-rapidly made resistivity survey. The resistivity test is particularly adapted to prospectmg for construction materials while the seismic test has only a limited value for such work. Use of these geophysical tests in conjunction with presently employed methods of direct exploration should result in a considerable saving of time and expense in future explorations of the subsurface and make possible a better, more-economical design of engineering structures.
Resistivity-depth tests can be made at a rate of three per hour in rough mountain areas to depths of about 60 f t . In open fields, with successive tests made at closely spaced intervals (100 to 200 f t . ) , more rapid progress is possible. The nature of the problem under study, however, wil l determine the need for large or small increments of depth and thus will control the number of resistivity determinations required at a particular test location and the time required for completing the test. The resistivity traverse can be made at a rate of 4,000 to 5,000 f t . per 8-hr. day. Seismic tests can be made at a rate approximately one third of that possible when making resistivity tests for the shallower depths (40 to 50 f t . or less).
CONCLUSION
In conclusion, it can be stated that both seismic and resistivity tests are capable of providing dependable information when used in subsurface exploration studies for many of the problems associated with high-
REFERENCES
1. Frank Wenner, "Method of Measuring Earth Resistivity". Dept. of Commerce, Bureau of Standards, Scientific Paper 258, 1915.
2. O. H. Gish, "Improved Equipment for Measuring Earth Current Potentials and Earth Resistivity". National Research Council Bulletin, Vol. 11, No. 56, 1926.
3. Irwin B. Crosby and E. G. Leonard-on, "Electrical Prospecting Applied to Foundation Problems". Trans. Amer. Inst. Min. and Met. Eng., 1929, Vol. 81, p. 199.
4. J. N. Hummel, "A Theoretical Study of Apparent Resistivity in Surface Potential Methods". Trans. Amer. Inst. Min. and Met. Eng., 1932, Vol. 97, p. 392.
5. R. C. Schappler and F. C. Farn-ham, "The Earth-Resistivity Method Applied to the Prediction of Materials in Excavation". Paper presented at the Twenty^ifth Mississippi Valley Conference of State Highway Departments, Chicago, Illinois, February 1933. •

106
6. I rwin Roman, "Some Interpretations of Earth-ResistivityData". Trans. Amer. Inst. M m . and Met. Eng. , 1934, Vol . 110, p. 18a.
7. G. F. Tagg, "Interpretation oi Earth-ResistivityMeasurements". Trans. Amer. Inst. Min . and Met. Eng. , 1934, Vol . 110, p. 133-147.
8. M . KmgHubbert, "Results of Earth-Resistivity Survey on Various Geologic Structures in I l l ino i s" . Trans. Amer. Inst. Min . and Met. Eng. , 1934, Vol . 110, p. 9-40.
9. K a r l S. Kurtenacker, "Some Practical Applications of Resistivity Measurements to Highway Problems". Trans. Amer. Inst. Min . and Met. Eng. , 1934, Vol . 110, p. 49-59.
10. Kar l S. Kurtenacker, "Use of Resist ivity Methods for Locating and Exploring Deposits of Stone and Gravel". Rock Products, July 1934, p. 32.
11. W. D. Keller , "Earth Resistivities at Depths Less Than 100 Feet". Bui . Amer. Assoc. Petroleum Geologists, Tulsa, Okla . , Vo l . 18, No. 1, 1934, p. 39-62.
12. F. L . Partlo andJerry H. Service, "Seismic Refraction Methods as Applied to Shallow Overburdens". Trans. Amer. Inst. M i n . and Met. Eng. , 1934, Vol . 110, p. 473-92.
13. C. A. Heiland, "Geophysics mthe Nonmetallic Fie ld" . Trans. Amer. Inst. Min . and Met. Eng. , 1934, Vol . 110, p. 546-77.
14. R. J . Watson, "A Contribution to the Theory of the Interpretation of Resist iv i ty Measurements Obtained f r o m Surface Potential Observations". Trans. Amer. Inst. Min . and Met. Eng. , 1934, Vol . 110, p. 201-36.
15. Stanley W. Wilcox, "Prospectmg fo r Road Materials by Geophysics". Engineering News-Record, February 21, 1935, p. 271.
16. E. R. Shepard, "Subsurface Exploration by Earth-Resistivity and Seismic Methods". Public Roads, Vol . 16, No. 4, June 1935, p. 57-67.
17. F. W. Lee, "Geophysical Prospecting for Underground Waters in Desert Areas". U . S. Bureau of Mines Inf. Ci rc . 6899, August 1936.
18. E. R. Shepard, "The App 1 ication of Geophysical Methods to Grading and
Other Highway Construction Problems". Proc. Highway Research Board, November 1936.
19. Maurice Ewing, A. P. Crary and H. M . Rutherford, "Geophysical Studies in the Atlantic Coastal Plain". Lehigh University Publications, Vol . 11, No. 9, Part 1, September 1937.
20. A. N . SayreandE. L.Stephenson, "The Use of Resistivity Methods in the Location of Salt-Water Bodies in the E l Paso, Texas, Area". Trans. American Geophysical Union, 1937, Part n , p. 393-98.
21. C. A. Heiland, "Prospecting for Water with Geophysical Methods". Trans. American Geophysical Union, 1937, Part n, p. 574-88.
22. L . E. Workman and M . M . Leigh-ton, "Search for Ground Waters by the Electrical Resistivity Method". Trans. American Geophysical Union, 1937, Part n , p. 403-09.
23. B. E. Jones, "Results to be Expected f r o m Earth-Resistivity Measurements". Trans. American Geophysical Union, 1937, Part H , p. 399-403.
24. J . H. Swartz, "Resistivity Studies of Some Salt-Water Boundaries in the Hawaiian Islands". Trans. American Geophysical Union, 1937, Part H , p. 387-93.
25. E. R. Shepard, "The Seismic Method of Exploration Applied to Construction Projects". The Mi l i t a ry Engineer, Vol . 31, No. 179, September-October 1939.
26. W. W. Wetzel and H. V . M c M u r r y , "A Set of Curves to Assist in the Interpretation of the Three-Layer Problems". Geophysics, Vol . 2, No. 4, October 1939, p. 329.
27. A. E. Wood, "Damsite Surveying by Seismograph". Engineering News-Record, Vol . 124, No. 13, March 28, 1940, p. 438-41.
28. G. F. Tagg, "Interpretation of Earth-ResistivityCurves". Trans. Amer. Inst. M i n . and Met. Eng. , 1940, Vol . 138, p. 399-407.
29. "Electr ical Resistivity Investigations". Corps of Engineers, Omaha Dist r i c t , 1941, 53 pp.
30. I rw in Roman, "Superposition in the Interpretation of Two-Layer Earth-Resist iv i ty Curves". Geological Survey Bu i -

107
letin No. 927-A, 1941. 31. E. R. Shepard and R. M . Haines,
"Seismic Subsurface Exploration on the St. Lawrence River Project". Proc. Amer. Society of Civ i l Engineers, December 1942, p. 1743.
32. J . B. Eby, "Seismic and Resistivity Geophysical Exploration Methods". U . S. Waterways Experiment Station, Tech. Memo. No. 198-1, 1943, 90 pp.
33. "Cr i t i ca l Study of Shallow Seismic Exploration in the Limestone areas of the Ozark Highlands". Corps of Engineers, Waterways Experiment Station, Tech. Memo. No. 199-1, 1943, 69 pp.
34. R. Woodward Moore, "An Empir ical Method of Interpretation of Earth-Resis-t ivi ty Measurements". Amer. Inst. M m . and Met. Eng. , Tech. Publ. No. 1743. Published in Petroleum Technology, Vol . 7, No. 4, July 1944, Trans. A. I . M . E . , Vol . 164, 1945, p. 197-223, and in Public Roads, Vol . 24, No. 3, January-February-March 1945.
35. R. Woodward Moore, "Prospecting for Gravel Deposits by Resistivity Methods". Public Roads, Vol . 24, No. 1, July-August-September 1944.
36. Mor r i s Muskat, "The Interpretation of Earth-Resistivity Measurements". Trans. Amer. Inst. M i n . and Met. Eng. , 1945, V O L 164, p. 224-31.
37. R. Ruedy, "The Use of Cumulative Resistance in Earth-ResistivitySurveys". Canadian Journal of Research, Vol . 23, No. 4, July 1945, p. 57-72.
38. G. L . Paver, "The Application of the Electr ical Resistivity Method of Geophysical Surveying to the Location of Underground Water". Proc. Geological Society, London, Session 1944-45. No. 1407-15, 1945, p. 56-61.
39. Daniel Linehan, S. J . , "The Seismic Method as a Geologic Technique in Highway Location and Design". Bulletin No. 13, Highway Research Board, November 1948.
40. Corps of Engineers, Engineering Manual, Part CXVIU, Chapter 2, Geophysical Exploration, 1948, 46 pp.
41. J . F. Enslin, "Lateral Effects
on Electr ical Resistivity Depth Probe Curves". Trans. Geological Society of South A f r i c a , Vol . 51, 1949, p. 249-270.
42. W. R. Perret , "Electr ical Resist iv i ty Exploration". Corps of Engineers, Waterways Experiment Station, Bulletin No. 33, September 1949, 48 pp.
43. E. R. Shepard, "Subsurface Exploration by Geophysical Methods". Proceedings, A . S. T , M . , Vol . 49, 1949, p. 993-1009.
44. F . W. Cron and R. Woodward Moore, "Subsurface Road Conditions Revealed by Geophysical Methods". Engineering News-Record, Vol . 143, No. 15, October 13, 1949, p. 40-44.
45. H. HedstromandR. KoUert, "Seismic Sounding of Shallow Depths". Tel lus, Vol . 1, No. 4, November 1949, p. 24-36.
46. R. Woodward Moore, "Geophysical Methods of Subsurface Exploration Applied to the Location and Evaluation of Sand and Gravel Deposits". National Sand and Gravel Association, Circular No. 37, March 1950, 18 pp.
47. Michael A. Spronck, "Highway Application of Seismic Technique". Contractors and Engineers Monthly, Vo l . 47, No. 6, June 1950, p. 26-28.
48. R. Woodward Moore, "Geophysical Methods of Subsurface Exploration in Highway Construction". Public Roads, Vol . 26, No. 3, August 1950, p. 49-64; also Highway Research Board Bulletin No. 28, November 1950, p. 73-98.
49. Arthur B. Cleaves and H. Leroy Scharon, "Electr ical Resistivity Surveys and Test Borings Expedited Pennsylvania Turnpike Extensions". Roads and Streets, Vol . 9 3, No. 9, September 1950, p. 54-58.
50. G. Dessau, "Some Results of Geophysical Prospecting Conducted for the Geological Survey of India f r o m 1945-1948". Geophysics, Vo l . 15, No. 4, October 1950, p. 704-731.
51. E. A. Abdun-Nur and Dart Want-land, "Electr ical Resistivity Method A p plied to the Investigation of Construction Materials Deposits". Proceedings Amer. Soc. for Testing Materials, Vo l . 50, 1950, p. 1364-78.