geomorphology and geomorphological landscapes of fuentes carrionas
TRANSCRIPT
This article was downloaded by: [Universidad de Sevilla]On: 26 November 2014, At: 02:28Publisher: Taylor & FrancisInforma Ltd Registered in England and Wales Registered Number: 1072954 Registeredoffice: Mortimer House, 37-41 Mortimer Street, London W1T 3JH, UK
Journal of MapsPublication details, including instructions for authors andsubscription information:http://www.tandfonline.com/loi/tjom20
Geomorphology and geomorphologicallandscapes of Fuentes CarrionasRamón Pelliteroa
a Department of Geography and Environment, School ofGeosciences, University of Aberdeen, United KingdomPublished online: 09 Dec 2013.
To cite this article: Ramón Pellitero (2014) Geomorphology and geomorphological landscapes ofFuentes Carrionas, Journal of Maps, 10:2, 313-323, DOI: 10.1080/17445647.2013.867822
To link to this article: http://dx.doi.org/10.1080/17445647.2013.867822
PLEASE SCROLL DOWN FOR ARTICLE
Taylor & Francis makes every effort to ensure the accuracy of all the information (the“Content”) contained in the publications on our platform. However, Taylor & Francis,our agents, and our licensors make no representations or warranties whatsoever as tothe accuracy, completeness, or suitability for any purpose of the Content. Any opinionsand views expressed in this publication are the opinions and views of the authors,and are not the views of or endorsed by Taylor & Francis. The accuracy of the Contentshould not be relied upon and should be independently verified with primary sourcesof information. Taylor and Francis shall not be liable for any losses, actions, claims,proceedings, demands, costs, expenses, damages, and other liabilities whatsoever orhowsoever caused arising directly or indirectly in connection with, in relation to or arisingout of the use of the Content.
This article may be used for research, teaching, and private study purposes. Anysubstantial or systematic reproduction, redistribution, reselling, loan, sub-licensing,systematic supply, or distribution in any form to anyone is expressly forbidden. Terms &Conditions of access and use can be found at http://www.tandfonline.com/page/terms-and-conditions

SCIENCE
Geomorphology and geomorphological landscapes of Fuentes Carrionas
Ramon Pellitero∗
Department of Geography and Environment, School of Geosciences, University of Aberdeen, UnitedKingdom
(Received 26 December 2012; resubmitted 11 September 2013; accepted 18 November 2013)
A 1:12,000 geomorphological map of Fuentes Carrionas (Northern Spain) is presented.Geomorphological landscapes maps are also shown to support map interpretation and showthe area’s geomorphological diversity. The maps were developed using the IGUL (Institutde Geographie, Universite de Lausanne) geomorphological mapping legend. This has beenadapted to GIS scheme in order to use the map as a basis for further work. The IGULlegend has been demonstrated to be highly effective for mountain environments where themain morphogenetical agents are dynamic and climatic processes.
Keywords: geomorphological map; GIS; geomorphological landscapes; Fuentes Carrionas;Cantabrian Range; geodiversity
1. Introduction
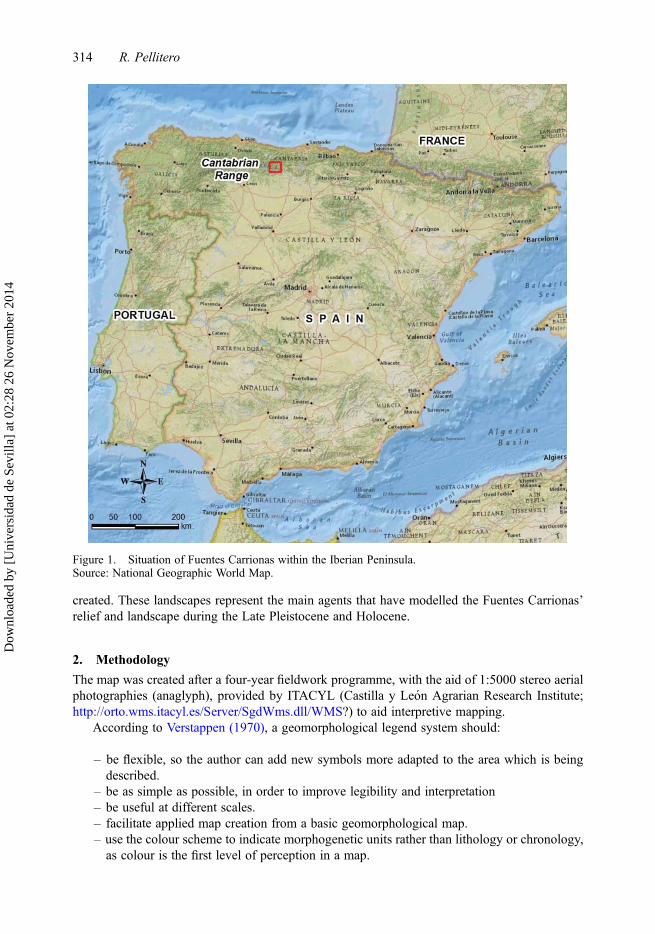
This article depicts the geomorphology of the Fuentes Carrionas Massif. This is a part of Cantab-rian Range, on the North of the Iberian Peninsula (Figure 1). The study area is situated at theborder of the Leon, Palencia and Cantabria provinces (the central peak of the massif is MojonTres Provincias, which means Three Provinces Landmark). It is also a hydrological border,because most northern slopes drain to the Cantabrian Sea, and southern ones drain to theDuero basin and therefore to the Atlantic Ocean. Altitudes range between 1200 m.a.s.l. and2536 m.a.s.l. The total study area is 175 sq. km.
Due to the high altitude, human occupation has traditionally been scarce. Moreover, themountain climate has made cultivation extremely difficult. The high altitude makes it possibleto keep fresh pasture during summer, so the traditional use of this land has been sheep andgoat grazing, which has changed to cow grazing during the twentieth century. Since the 1950sand 1960s rural abandonment has deeply affected this region. Pressure on the landscape andnatural resources has dramatically decreased and many pastures have been abandoned.
Most of the area is covered by pastures or scrubland, which results from pasture abandonment.The highest areas remain almost free of vegetation due to climate. As a result landforms are themain visual feature of the landscape. The ‘geomorphological map’ has been developed in order toimprove understanding of the terrain; several ‘geomorphological landscapes’ cards have been
# 2013 Ramon Pellitero
∗Email: [email protected]
Journal of Maps, 2014Vol. 10, No. 2, 313–323, http://dx.doi.org/10.1080/17445647.2013.867822
Dow
nloa
ded
by [
Uni
vers
idad
de
Sevi
lla]
at 0
2:28
26
Nov
embe
r 20
14
created. These landscapes represent the main agents that have modelled the Fuentes Carrionas’relief and landscape during the Late Pleistocene and Holocene.
2. Methodology
The map was created after a four-year fieldwork programme, with the aid of 1:5000 stereo aerialphotographies (anaglyph), provided by ITACYL (Castilla y Leon Agrarian Research Institute;http://orto.wms.itacyl.es/Server/SgdWms.dll/WMS?) to aid interpretive mapping.
According to Verstappen (1970), a geomorphological legend system should:
– be flexible, so the author can add new symbols more adapted to the area which is beingdescribed.
– be as simple as possible, in order to improve legibility and interpretation– be useful at different scales.– facilitate applied map creation from a basic geomorphological map.– use the colour scheme to indicate morphogenetic units rather than lithology or chronology,
as colour is the first level of perception in a map.
Figure 1. Situation of Fuentes Carrionas within the Iberian Peninsula.Source: National Geographic World Map.
314 R. Pellitero
Dow
nloa
ded
by [
Uni
vers
idad
de
Sevi
lla]
at 0
2:28
26
Nov
embe
r 20
14

Following these principles, ideally the Fuentes Carrionas geomorphological map should belegible, semiologicly correct, aesthetically attractive and useful to obtain secondary informationusing a geographic information system (GIS). Given an alpine environment where climatic anddynamic aspects are more important for relief creation than lithology, the IGUL (Institute ofGeography of Lausanne University in Switzerland) legend was chosen due to:
– Its simplicity (only a topographic basemap is required).– its focus on Geomorphology rather than other information.– Its adaptation for glacial and periglacial environments.– Its faithful representation of reality, as all features are scale shaped.– Its distinction between erosion dominant areas (no colour) and sedimentation dominant
areas (a colour depending on the process that created the sedimentation).
The IGUL legend was developed during the 1990s by Schoeneich (1993) to create a simplebut coherent mapping system at 1:10,000 scale, which could be used directly by students(Reynard, Holzmann, Lambiel, & Phillips, 2005). This method has been widely adopted in anacademic environment for mountain areas (Dorthe, 2007; Golaz, 1995; Ondicol, 2009; Scapozza,2008). It is based on Centre National de la Recherche Scientifique (CNRS) legend, from which ittakes many symbols; colours are taken from the German legend (Maillard et al., 2011). Distinc-tions between landforms (points, lines or polygons with no background) and deposits (degradedcolour background) is also taken from the CNRS legend. The colour scheme is shown in Table 1.
The glacial and periglacial colours (purple and pink) were interchanged in order to create twodifferent shades for periglacial landforms: a pale purple for relict periglacial landforms and anintense purple for active periglacial landforms (e.g., Ondicol, 2009). Several new symbolswere also created in order to represent landform geodiversity, such as that related to periglacialquartzitic surfaces.
The chart’s main shortcoming is that it sacrifices lithological and geological information,which have to be presented in separate maps. This is the opposite to the Martin-Serrano et al.(2005) methodology, which has been used in Spain (Benito-Calvo, Tarrino, Lobo, Junguitu, &Larreina, 2010), and which gives a semiologic importance to lithology. On the other hand, themap results more applicable than maps created using the Pena, Pellicer, Chueca, and Julian(1997) legend, one of the most extensively used in Spain (Ruiz-Fernandez, 2011), where land-forms are always represented as lines. In our case landforms and deposits are dominantly
Table 1. Colours for morphogenesis in the IGUL legend.
Geomorphogenetic agent Colour
Structures RedHydrography Light blueFluvial GreenGravitational BrownKarstic TurquoiseLacustrine Deep blueEolic YellowNival BourdoirPeriglacial Pink/mauveGlacial VioletOrganogenic Olive greenAnthropogenic Grey
Journal of Maps 315
Dow
nloa
ded
by [
Uni
vers
idad
de
Sevi
lla]
at 0
2:28
26
Nov
embe
r 20
14
shown as polygons, so they have extension, and spatial analysis can be performed after the pro-duction of the geomorphological map (e.g., Pellitero et al., 2011a).
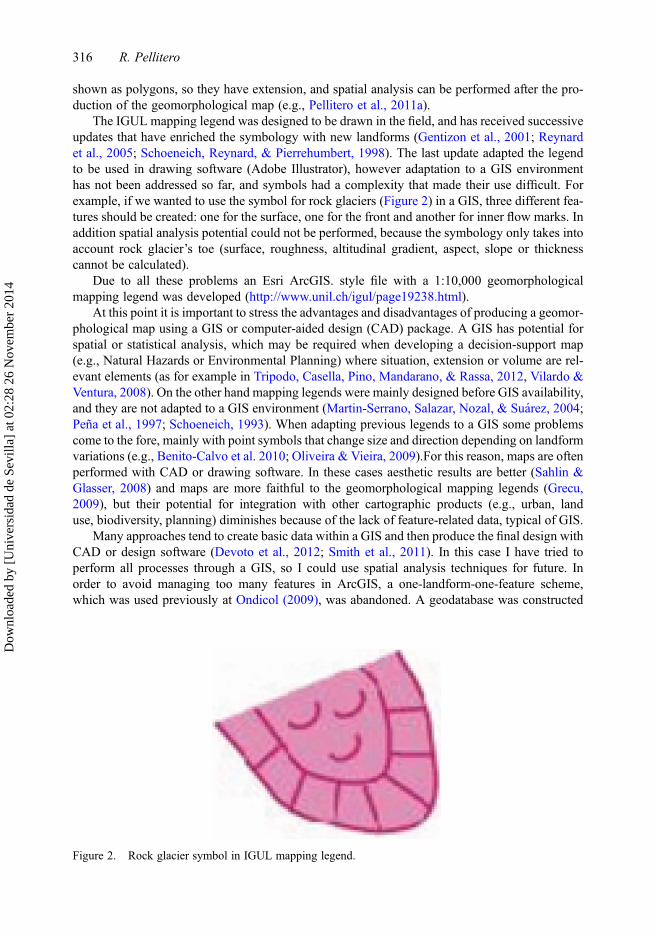
The IGUL mapping legend was designed to be drawn in the field, and has received successiveupdates that have enriched the symbology with new landforms (Gentizon et al., 2001; Reynardet al., 2005; Schoeneich, Reynard, & Pierrehumbert, 1998). The last update adapted the legendto be used in drawing software (Adobe Illustrator), however adaptation to a GIS environmenthas not been addressed so far, and symbols had a complexity that made their use difficult. Forexample, if we wanted to use the symbol for rock glaciers (Figure 2) in a GIS, three different fea-tures should be created: one for the surface, one for the front and another for inner flow marks. Inaddition spatial analysis potential could not be performed, because the symbology only takes intoaccount rock glacier’s toe (surface, roughness, altitudinal gradient, aspect, slope or thicknesscannot be calculated).
Due to all these problems an Esri ArcGIS. style file with a 1:10,000 geomorphologicalmapping legend was developed (http://www.unil.ch/igul/page19238.html).
At this point it is important to stress the advantages and disadvantages of producing a geomor-phological map using a GIS or computer-aided design (CAD) package. A GIS has potential forspatial or statistical analysis, which may be required when developing a decision-support map(e.g., Natural Hazards or Environmental Planning) where situation, extension or volume are rel-evant elements (as for example in Tripodo, Casella, Pino, Mandarano, & Rassa, 2012, Vilardo &Ventura, 2008). On the other hand mapping legends were mainly designed before GIS availability,and they are not adapted to a GIS environment (Martin-Serrano, Salazar, Nozal, & Suarez, 2004;Pena et al., 1997; Schoeneich, 1993). When adapting previous legends to a GIS some problemscome to the fore, mainly with point symbols that change size and direction depending on landformvariations (e.g., Benito-Calvo et al. 2010; Oliveira & Vieira, 2009).For this reason, maps are oftenperformed with CAD or drawing software. In these cases aesthetic results are better (Sahlin &Glasser, 2008) and maps are more faithful to the geomorphological mapping legends (Grecu,2009), but their potential for integration with other cartographic products (e.g., urban, landuse, biodiversity, planning) diminishes because of the lack of feature-related data, typical of GIS.
Many approaches tend to create basic data within a GIS and then produce the final design withCAD or design software (Devoto et al., 2012; Smith et al., 2011). In this case I have tried toperform all processes through a GIS, so I could use spatial analysis techniques for future. Inorder to avoid managing too many features in ArcGIS, a one-landform-one-feature scheme,which was used previously at Ondicol (2009), was abandoned. A geodatabase was constructed
Figure 2. Rock glacier symbol in IGUL mapping legend.
316 R. Pellitero
Dow
nloa
ded
by [
Uni
vers
idad
de
Sevi
lla]
at 0
2:28
26
Nov
embe
r 20
14
where data were distinguished whether they were point, line or polygon features. Several land-forms have joint topology. Screes for example, are represented by their shape (polygon) andlines which show slope direction.
The most interesting decision was to use the Representations toolset to produce the map. Thisdecision has improved map performance for three complementary reasons:
– Different landforms can be stored within a single feature, so you can easily draw differentlandforms during the same edition session without changing the editing target.
– It is not necessary to create a field to identify landforms in the feature data table. Whileediting you choose which landform you are drawing, and this information is automaticallystored in the table.
– the Representations toolset lets you improve the final layout by individually changingorientation, shape or size of each single symbol without changing the representation ofall features which represent the same landform type. This is called ‘Free Representation’.
3. Results
Due to its size, 1:10,000 geomorphological map was divided into six parts and the scale waschanged to 1:12,000, so that it could fit into six A1 sized pages. Eight ‘geomorphological land-scapes maps’ were also created. They are presented at a variable scale, from 1:8000 to 1:25,000,depending on the area shown. Some landforms were removed from the geomorphological land-scape maps to enhance relevant landform visibility and lighten the legends.
In total 3164 landforms and features have been mapped, comprising 78 landform types and 8hydrological features and anthropic constructions. The resulting map has two basic reading levels.
– Simple: colours depict the predominant morphogenetic system.– Detailed: different patterns depict which landforms exist.
These features have been divided into seven different morphogenetic systems: structural,glacial, periglacial, fluvial, karstic, nival, gravitational and anthropic. Not all of the agentshave been equally important in relief modelling since the Pleistocene. Structures were inheritedfrom previous uplift during the Miocene, and they are not the main target of the study, so theyhave not been drawn in detail.
3.1. Glacial
During the Late Pleistocene an ice mass about 105 sq. km in extent developed in the Fuentes Car-rionas. Glacier fronts fell as low as 1240 m.a.s.l. and ice tongues reached a maximum length of15 km. The highest and central part of the ice mass, the Tres Provincias area (Map 1, E3-E4), wasa dome from where ice flowed in three different directions towards the Lechada, Cardano andCarrion valleys. Glaciers originated in the northern cirques of of Cubil del Can (Map 1, E2)and Pena Prieta (Map 1, E3) joined Lechada and Carrion glaciers through glacial transfluencesat Bobias (Map 1, D2) and Vega la Canal (Map 2, C3). The result was an ‘icefield’ thatmainly flowed towards the east. Ice thickness reached at least 300 metres in the Vega deCantos (Map 2, C5 and Geomorphological landscapes 2) area, in the Carriœn valley.
Paradoxically, while northern faced slopes in Tres Provincias, Cuartas, Curavacas and Espi-guete were covered by ice hundreds of metres thick, southern and western faced slopes remainedunglaciated or scarcely covered by cirque glaciers. The importance of orientation is typical of
Journal of Maps 317
Dow
nloa
ded
by [
Uni
vers
idad
de
Sevi
lla]
at 0
2:28
26
Nov
embe
r 20
14
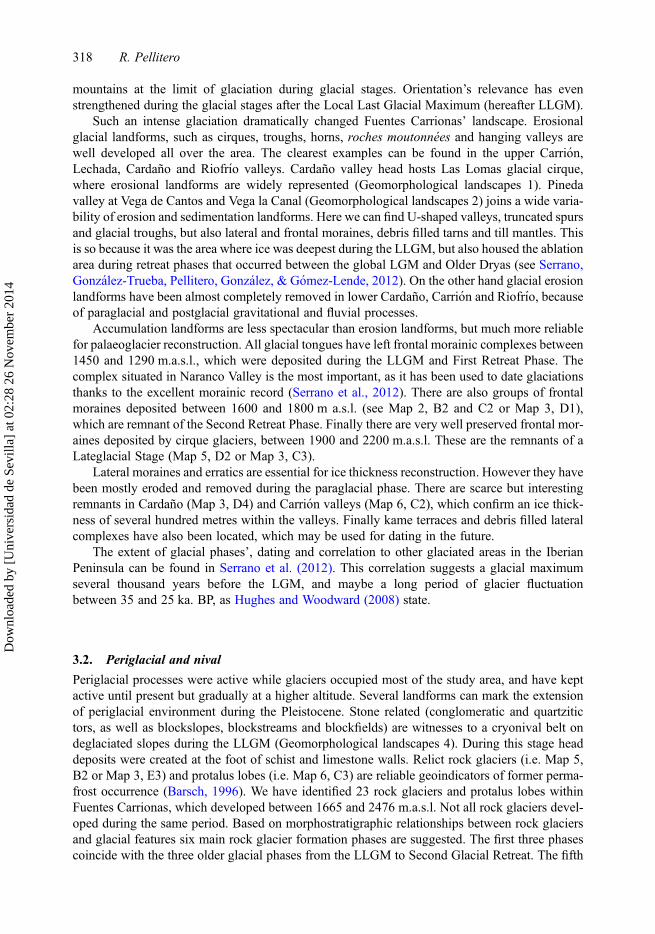
mountains at the limit of glaciation during glacial stages. Orientation’s relevance has evenstrengthened during the glacial stages after the Local Last Glacial Maximum (hereafter LLGM).
Such an intense glaciation dramatically changed Fuentes Carrionas’ landscape. Erosionalglacial landforms, such as cirques, troughs, horns, roches moutonnees and hanging valleys arewell developed all over the area. The clearest examples can be found in the upper Carrion,Lechada, Cardano and Riofrıo valleys. Cardano valley head hosts Las Lomas glacial cirque,where erosional landforms are widely represented (Geomorphological landscapes 1). Pinedavalley at Vega de Cantos and Vega la Canal (Geomorphological landscapes 2) joins a wide varia-bility of erosion and sedimentation landforms. Here we can find U-shaped valleys, truncated spursand glacial troughs, but also lateral and frontal moraines, debris filled tarns and till mantles. Thisis so because it was the area where ice was deepest during the LLGM, but also housed the ablationarea during retreat phases that occurred between the global LGM and Older Dryas (see Serrano,Gonzalez-Trueba, Pellitero, Gonzalez, & Gomez-Lende, 2012). On the other hand glacial erosionlandforms have been almost completely removed in lower Cardano, Carrion and Riofrıo, becauseof paraglacial and postglacial gravitational and fluvial processes.
Accumulation landforms are less spectacular than erosion landforms, but much more reliablefor palaeoglacier reconstruction. All glacial tongues have left frontal morainic complexes between1450 and 1290 m.a.s.l., which were deposited during the LLGM and First Retreat Phase. Thecomplex situated in Naranco Valley is the most important, as it has been used to date glaciationsthanks to the excellent morainic record (Serrano et al., 2012). There are also groups of frontalmoraines deposited between 1600 and 1800 m a.s.l. (see Map 2, B2 and C2 or Map 3, D1),which are remnant of the Second Retreat Phase. Finally there are very well preserved frontal mor-aines deposited by cirque glaciers, between 1900 and 2200 m.a.s.l. These are the remnants of aLateglacial Stage (Map 5, D2 or Map 3, C3).
Lateral moraines and erratics are essential for ice thickness reconstruction. However they havebeen mostly eroded and removed during the paraglacial phase. There are scarce but interestingremnants in Cardano (Map 3, D4) and Carrion valleys (Map 6, C2), which confirm an ice thick-ness of several hundred metres within the valleys. Finally kame terraces and debris filled lateralcomplexes have also been located, which may be used for dating in the future.
The extent of glacial phases’, dating and correlation to other glaciated areas in the IberianPeninsula can be found in Serrano et al. (2012). This correlation suggests a glacial maximumseveral thousand years before the LGM, and maybe a long period of glacier fluctuationbetween 35 and 25 ka. BP, as Hughes and Woodward (2008) state.
3.2. Periglacial and nival
Periglacial processes were active while glaciers occupied most of the study area, and have keptactive until present but gradually at a higher altitude. Several landforms can mark the extensionof periglacial environment during the Pleistocene. Stone related (conglomeratic and quartzitictors, as well as blockslopes, blockstreams and blockfields) are witnesses to a cryonival belt ondeglaciated slopes during the LLGM (Geomorphological landscapes 4). During this stage headdeposits were created at the foot of schist and limestone walls. Relict rock glaciers (i.e. Map 5,B2 or Map 3, E3) and protalus lobes (i.e. Map 6, C3) are reliable geoindicators of former perma-frost occurrence (Barsch, 1996). We have identified 23 rock glaciers and protalus lobes withinFuentes Carrionas, which developed between 1665 and 2476 m.a.s.l. Not all rock glaciers devel-oped during the same period. Based on morphostratigraphic relationships between rock glaciersand glacial features six main rock glacier formation phases are suggested. The first three phasescoincide with the three older glacial phases from the LLGM to Second Glacial Retreat. The fifth
318 R. Pellitero
Dow
nloa
ded
by [
Uni
vers
idad
de
Sevi
lla]
at 0
2:28
26
Nov
embe
r 20
14
and sixth phase developed during the Older and Younger Dryas. Finally some protalus lobes mayhave been formed during the Holocene (Pellitero et al. 2011b).
Small landforms, such as terracettes, solifluction lobes, ploughing boulders, and processeslike pipcrake are the most active periglacial features nowadays. Terracettes are active over1900–2000 m.a.s.l., and they developed due to both pipcrake and snowmelt solifluction. Turf-banked solifluction lobes are active over 1900 m.a.s.l. on northern slopes where snow cover isconstant in winter, and they are directly related to snow melt and abundant water supply.Stone-banked solifluction lobes are active above 2300 m.a.s.l. on western and northern shapedslopes, and they are the only remnant of an active crionival belt, with no permafrost but adeep, long-lasting freezed soil about 7–9 months per year (Geomorphological landscapes 5).Ploughing boulders, like turf-banked lobes, are related to a mixture of soil moisture and climaticconditions (Ballantyne, 2001). Screes and debris cones are the most extensive periglacial land-forms within Fuentes Carrionas. Screes are usually active above 1900 m.a.s.l. Active screes(Geomorphological landscapes 5) and debris cones usually have a convex profile and a slopeover 308. Snow avalanche, rockfall and debris flow are the main processes on active screes. Inac-tive screes and talus are always concave shaped, with their slope below 308. Solifluction, laminarerosion and sands and clay lixiviation are the main processes within them.
Nival landforms are obviously related to snow distribution during winter and spring, so theyare usually found on northern and eastern facing slopes. There are still some permanent snow-patches in Fuentes Carrionas, located at the foot of the highest peaks in northern cirques. Attheir foot there are active protalus ramparts. There are also permanent snowpatches coveringnival dolines at the Espiguete limestone outcrop (Geomorphological landscapes 8). Nivationhollows have developed mainly on eastern facing slopes, where snow blown from peaks andwestern slopes accumulates. Here we can find some very interesting nival abrasion processesthat have even lead to the formation of nival roches moutonnees and nival push-moraines (Sha-kesby, Matthews, McEwen, & Berrisford, 1999) (Geomorphological landscapes 4). Avalanchesare common at the highest peaks, and they usually happen along the same avalanche corridors.
3.3. Gravitational
Landsides and rockfall are very well represented in Fuentes Carrionas. Seven mass movementtypes have been identified following the Dikau, Brunsden, Schrott, and Ibsen (1996) classifi-cation, although only five different symbols exist on the map. Rotational landslides are thelargest gravitational landforms of the area (Geomorphological landscapes 6). They usuallyoccur in deglaciated slopes, and are frequently related to faults, lithological contacts and steepslope facing tilts. Due to their size, they induce instability on slopes and so provoke secondarylandslides. Traslational slides (i.e. Map 5, E2) usually affect unstable till mantles and moraines.They can be provoked by previous rotational landslides or by upwelling fluvial erosion. Sackun-gen also affect deglaciated slopes at areas with a varied lithology. They always provoke slopeinstability and therefore secondary landslides (i.e. Map 5, D3). Rock avalanches always occurin Fuentes Carrionas on quartzitic slopes which have been destabilized by sackungen (i.e. Map5, D3). Rockslides are a special type of movement in which the slide body keeps the originalshape. They only occur in massive hard lithologies, such as Curavacas conglomerates andCaliza de Montana limestones (i.e. Map 4, D2). Rockfall or rubble are found at steep cirquewalls and glacial troughs, and they are still actively occurring (Geomorphological landscapes7). Finally debris flows can be found at the highest debris cones and talus of the massif. Theyare almost always related to summer storms and sudden snow melts (i.e. Map 1, E2).
Six different slope instability phases have been identified, although no direct dating has beenperformed. Interpretation is based upon landform degradation state and morphostratigraphical
Journal of Maps 319
Dow
nloa
ded
by [
Uni
vers
idad
de
Sevi
lla]
at 0
2:28
26
Nov
embe
r 20
14
relationship to other landforms (fluvial, glacial and periglacial). There is an initial phase previousto the LLGM, three paraglacial phases after the glaciers retreated, a fifth phase where paraglacialinstability is extended due to human occupation and deforestation, and the final present phase.This phase is characterized by continuous instability on the slopes eroded by the Riofrıo (Geo-morphological landscapes 6) drainage system and on the slopes of the Riuplanes area (Map 5,E2). On the peaks there are still rockfall and debris flow formation processes, which directlyrelate to climatic conditions rather than fluvial dynamics.
3.4. Karst
In spite of the scarce extent of limestone outcrops (only 7% of the study area), a wide variety ofkarst landforms have developed in Fuentes Carrionas. Exokarst is mainly represented by nivalkarren fields. At the northern face of Espiguete an extensive karren field has developed on aglacial cirque (Geomorphological landscapes 8). Here we can find rillenkarren, rinnenkarren,wandkarren, meanderkarren, splitkarren and dolomization-related karren, often mixedbetween them (Miotke, 1968). On the other hand dolines are quite scarce, and only nivaldolines can be found in the Espiguete area. A dense endokarst network has developed departingfrom very frequent sinks (more than 100 in 1 sq. km in the Espiguete area). This network usuallyfollows stone tilting. Galleries use to be vadose until 1400 m.a.s.l., the level where freatic mantleis found, and where we can find many springs at the limits of limestone outcrops. Perched aban-doned galleries also exist.
3.5. Fluvial
In spite of the differences between valleys, especially between the Cantabrian Sea and DueroBasin drainage systems, there is a common pattern in fluvial landform creation in Fuentes Carrio-nas. There is an almost ubiquitous accumulation level perched between 5 and 10 metres above thepresent fluvial level (i.e. in Pineda valley, Map 5, D1). This level would have been depositedduring a phase of low vegetation, and active paraglacial and periglacial processes, which wepropose is coetaneous to the Lateglacial stage. The level was later eroded by an organizedfluvial network, in a less active environment, that we date to the early Holocene. A secondaccumulation phase, about 3 metres above the present fluvial level, can be found in thevalleys. Slopes were again destabilized, but in this case due to anthopic activity (mainly defores-tation for pasture creation) which started about 4500 years ago (Perez-Rodrıguez, 2010). Finally,today the Carrion and Cardano rivers are locally accumulating sediments in the valleys, whereasthe Riofrıo river is constantly eroding its margins due to the Cantabrian Sea basin differential drai-nage (Map 2, C2).
3.6. Anthropic
Besides deforestation, human communities that have used the resources of the Fuentes Carrionas’and have directly created landforms. Channels are common at the highest meadows and pasturesof the Carrion and Riofrıo valley (Map 2, B1). They used to start at springs and take advantage oflandforms (as for example lateral moraines) for gently descending and irrigating pastures. Culti-vation terraces were built near the villages on southern facing slopes until 1600 m.a.s.l., but thesewere overwhelmingly abandoned during the 1960s and 1970s (i.e. Map 4, D4). Finally there is asmall talc mine in the Lechada valley at 2035 m.a.s.l. (Map 1, D3).
320 R. Pellitero
Dow
nloa
ded
by [
Uni
vers
idad
de
Sevi
lla]
at 0
2:28
26
Nov
embe
r 20
14
4. Conclusions
The IGUL system is highly suitable for the cartographic representation of mountain areas wherelandforms are climatic or dynamic related rather than lithology related. For the study area this isthe profusion of glacial, periglacial and gravitational landforms. In spite of being developed for1:10,000 scale, it can be used between 1:5000 and 1:25,000. Adaptation for GIS can be useful forfurther spatial analysis (Theler et al. 2008). On the other hand it has a major weakness: structureand lithology are scarcely represented because the colour layer is used for mapping differentdeposits. This shortcoming is offset by the frequent use of symbols that usually consider land-forms and deposits as a consequence of some processes applied to a determinate lithology(e.g., blockslopes are formed because of periglacial weathering on quartzitic rocks). In anyevent, this system is less suitable for small-scale maps (1:50,000 or lower) because these areused to relate landforms to structure and lithology rather than to climatic environments. Adap-tation for the Fuentes Carrionas has permitted us to distinguish active and inherited periglacialfeatures, which is useful to determine the contemporary geoecological environment.
Fuentes Carrionas holds a wide variety of glacial, periglacial, gravitational and karstic land-forms which are highly relevant in landscape configuration, given a dominant absence of signifi-cant vegetal formations. This geodiversity has been shown on ‘Geomorphological landscapesmaps’, and should also be taken into account when acting in this environment. Maps presentedare therefore essential tool for land management in Fuentes Carrionas.
Software
ArcGIS 10.0 has been used to create the new data, process the data acquired and perform the finallayout.
AcknowledgementsThe author would like to thank PANGEA (Natural Heritage and Applied Geography Group) and LACASIG(GIS and Cartography Laboratory) for their help. This research has been supported by OAPN 053-2010 andCGL-2010-19729 projects. Mr Chris Orton, Dr. Matteo Spagnolo and two anonymous reviewers are thankedfor suggesting improvements that have made map and paper more expressive.
ReferencesBallantyne, C. K. (2001). Measurement and theory of ploughing boulder movement. Permafrost and
Periglacial Processes, 12, 267–288.Barsch, D. (1996). Rock-glaciers. Indicators for the present and former geoecology in high mountain
environments. Berlin: Springer-Verlag.Benito-Calvo, A., Tarrino, A., Lobo, P. J., Junguitu, I., & Larreina, D. (2010). Geomorphology and prehis-
toric flint mining evidence in the Sierra de Araico (Basque-Cantabrian Basin), Burgos-Alava, Spain.Journal of Maps, 6, 584–590. doi:10.4113/jom.2010.1147
Devoto, S., Biolchi, S., Bruschi, V. M., Furlani, S., Mantovani, M., Piacentini, D., & Pasuto, A. (2012).Geomorphological map of the NW Coast of the Island of Malta (Mediterranean Sea). Journal ofMaps, 8, 33–40. doi:10.1080/17445647.2012.668425
Dikau, R., Brunsden, D., Schrott, L., & Ibsen, M. (1996). Landslide recognition. Identification, movementand causes. Chichester: Wiley.
Dorthe, J. (2007). Ventilation des eboulis froids et des glaciers rocheux fossiles des Prealpes suissesromandes. Travail de Diplome: Institut de Geographie, Universite de Fribourg. Retrieved February 5,2012, from, http://www.unifr.ch/geoscience/geographie/pub/lib/exe/fetch.php?id¼pub%3Amaster&cache¼cache&media¼master:diplome_sm-jd.pdf
Gentizon, C., Baud, M., Holzmann, C., Lambiel, C., Reynard, E., & Schoeneich, P. (2001). GIS and geomor-phological mapping as management tools in alpine periglacial areas. In M. F. Buchroithner (Ed.), High
Journal of Maps 321
Dow
nloa
ded
by [
Uni
vers
idad
de
Sevi
lla]
at 0
2:28
26
Nov
embe
r 20
14
mountain cartography 2000 (pp. 215–228). Dresden: Institute for Cartography of the DresdenUniversity of Technology, Kartographische Bausteine, Band 18.
Golaz, F. (1995). Le Val de Moiry, Valais. Morphologie glaciaire, periglaciaire et essai de reconstitutionpaleogeographique des stades glaciaires, volumen 13 de Travaux et Recherches. Institut deGeographie, Universite de Lausanne.
Grecu, F. (2009). Geomorphological Map of the Prahova Subcarpathians (Romania). Journal of Maps, 5,108–116. doi:10.4113/jom.2009.1052
Hughes, P. D., & Woodward, J. C. (2008). Timing of glaciation in the Mediterranean mountains during thelast cold stage. Journal of Quaternary Science, 23(6–7), 575–588.
Maillard, B., Lambiel, C., Martin, S., Pellitero, R., Reynard, E., & Schoeneich, P. (2011). The ArcGIS versionof the geomorphological mapping legend of the University of Lausanne. Technical report, Universite deLausanne.
Martın-Serrano, A., Salazar, A., Nozal, F., & Suarez, A. (2005). Mapa geomorfologico de Espana a escala1:50.000. Guıa para su elaboracion. Madrid: Instituto Geologico y Minero de Espana.
Miotke, F. D. (1968). Karstmorfologische studien in der glacial ubertormten Hohenstute der Picos deEuropa. Jahrbuch der Geographischen Gesellschft zu Hannover.
Oliveira, F. A., & Vieira, C. V. (2009). Semi-detailed geomorphological map of Northeastern Santa CatarinaState, Brazil—the Garuva Sheet. Journal of Maps, 5, 66–74. doi:10.4113/jom.2009.1037
Ondicol, R. P. (2009). Application of an alpine geomorphological mapping system to an atlantic mountainenvironment: The Curavacas Massif (Cantabrian Range, Northwest Spain). Journal of Maps, 5, 194–205. doi:10.4113/jom.2009.1065
Pellitero, R., Gonzalez-Amuchastegui, M. J. Ruiz-Flano, P., & Serrano, E. (2011a). Geodiversity and geo-morphosite assessment applied to a natural protected area: The Ebro and rudron gorges natural park(Spain). Geoheritage, 3(3), 163–174. doi:10.1007/s12371-010-0022-9
Pellitero, R., Serrano, E., & Gonzalez, J. J. (2011b). Glaciares rocosos del sector central de la MontanaCantabrica: indicadores paleoambientales. Cuadernos de Investigacion Geografica, 37(2), 119–144.
Pena, J., Pellicer, F., Chueca, J., & Julian, A. (1997). Leyenda para mapas geomorfologicos a escalas1:25.000/1:50.000. In J. Pena (ed.), Cartografıa geomorfologica basica y aplicada. (p. separata)Logrono: Geoforma ediciones, Universidad de La Rioja.
Perez-Rodrıguez, F. (2010). El fenomeno megalıtico en la Montana Palentina. Coleccion de Historia de laMontana Palentina. Ediciones Aruz, 4, 11–64.
Reynard, E., Holzmann, C., Lambiel, C., & Phillips, M. (2005). Legende geomorphologique de l’IGUL etGuide pratique pour le leve de cartes geomorphologiques. Lausanne: Institut de Geographie.
Ruiz-Fernandez, J. (2011). Geomorphological map of an Atlantic mid-height mountain area: The Juan Robreand Jana Ridge (Cantabrian Range, Northwest Spain). Journal of Maps, 7, 260–272. doi:10.4113/jom.2011.1173
Sahlin, E. A. U., & Glasser, N. F. (2008). A geomorphological map of Cadair Idris, Wales. Journal of Maps,4, 299–314. doi:10.4113/jom.2008.1011
Scapozza, C. (2008). Contribution a l’etude geomorphologique et geophysique des environmentsperiglaciaires des Alpes Tessinoises orientales. Master thesis Universite de Lausanne, 2008.Retrieved from http://mesoscaphe.unil.ch/igul/doc.php?id¼TIGL-691.pdf
Schoeneich, P. (1993). Comparaison des syst_emes de l_egendes fran_cais, allemand et suisse prıncipes de lalegende IGUL. In E. Reynard and P. Schoeneich (eds.), Cartographie geomorphologique, cartographiedes risques (pp. 15–24). Lausanne: Travaux et Recherches, vol. 9. Universite de Lausanne.
Schoeneich, P., Reynard, E., & Pierrehumbert, G. (1998). Geomorphological mapping in the Swiss Alps andPrealps. In K. Kriz (ed.), Hochgebirgskartographie Silvretta’98 (pp. 145–153). Wiener Schriften zurGeographie und Kartographie, 11.
Serrano, E., Gonzalez-Trueba, J. J., Pellitero, R., Gonzalez, M., & Gomez-Lende, M. (2012). Quaternaryglacial evolution in the Central Cantabrian Mountains (Northern Spain). Geomorphology, 196,65–82. doi:http://dx.doi.org/10.1016/j.geomorph.2012.05.001
Shakesby, R. A., Matthews, J. A., McEwen, L. J., & Berrisford, M. S. (1999). Snow-push processes in pro-nival (protalus) rampart formation: Geomorphological evidence from Smorbotn, Romsda lsalpane,Southern Norway. Geografiska Annaler, 81A, 31–45.
Smith, B., Pellitero, R., & Alexander, G. (2011). Mapping slope instability at the Giant’s causeway and cau-seway coast world heritage site: Implications for site management. Geoheritage, 3, 253–266. doi:10.1007/s12371-010-0021-x
Theler, D., Reynard, E., & Bardou, E. (2008). Assessing sediment dynamics from geomorphological maps:Bruchi torrential system, Swiss Alps. Journal of Maps, 4, 277–289. doi:10.4113/jom.2008.1013
322 R. Pellitero
Dow
nloa
ded
by [
Uni
vers
idad
de
Sevi
lla]
at 0
2:28
26
Nov
embe
r 20
14

Tripodo, A., Casella, S., Pino, P., Mandarano, M., & Rassa, R. (2012). Geomorphological map of the Liparivolcanic island (Aeolian Archipelago – Italy). Journal of Maps, 8, 107–112. doi:10.1080/17445647.2012.668770
Verstappen, H. T. (1970). “Introduction to the ITC system of geomorphological survey.” KoninlijkNederlands Aardijkkundig Genootschap. Geografisch Niewe Reeks, 4.1, 85–91.
Vilardo, G., & Ventura, G. (2008). Geomorphological map of the 1944 Vesuvius lava flow (Italy). Journal ofMaps, 4, 225–234. doi:10.4113/jom.2008.1003
Journal of Maps 323
Dow
nloa
ded
by [
Uni
vers
idad
de
Sevi
lla]
at 0
2:28
26
Nov
embe
r 20
14