geomatics faculty of architecture & the built environment
TRANSCRIPT

TUDelft
Geomatics
Faculty of Architecture & the Built Environment


Geomatics for the Built Environment
What is Geomatics?
Geodata is key
Learn to look ‘under the hood’
Where are you and where do you go?
Challenges in 3D modelling
Serious gaming for decision support
Projects
Geo database management
The era of BIG data
‘Internet of things’
Quality influences the outcome
Provide the key legalisation framework
Computational thinking
3
5
6
8
9
10
12
13
14
16
17
18
20
21
1

2 Zoo of Prague during the flooding of late spring 2013.2
Geomatics provides vital spatial knowledge
on the built environment. Students learn to
use advanced techniques in data collection
and analysis, spatial information modelling
and the visualisation of data. They learn
about the use, governance and application
of geographic data for solving
real-world problems in an innovative
way. The programme at TU Delft differs
from other geomatics programmes in its
interdisciplinary nature and technical depth.
Closely tied to the Faculty of Architecture
and the Built Environment, Geomatics
combines knowledge from mathematics,
computer science and geography in order
to better understand and shape the built
environment. Students apply their skills
in 3D modelling, GIS, mapping, serious
gaming, simulation and visualisation to
a wide range of fields such as disaster
management, urban design and planning,
landscape architecture, location based
services and land administration.
Advanced tools for solving
complex spatial challenges
The first year of the programme consists of
core foundation courses complimented by
various domain electives, enabling students
to broaden and deepen their knowledge
in one of the many application fields of
geomatics. In the second year, students
choose to take additional electives and
participate in the synthesis project, an
opportunity to gain hands on experience
on a real-world project. This is followed
by an individual graduation project. The
recent increase in geo-information use has
created a huge need for qualified engineers.
The geomatics working field is expanding
quickly so there is ample opportunity to find
a position that suits you best.
Geomatics for the Built Environment
3
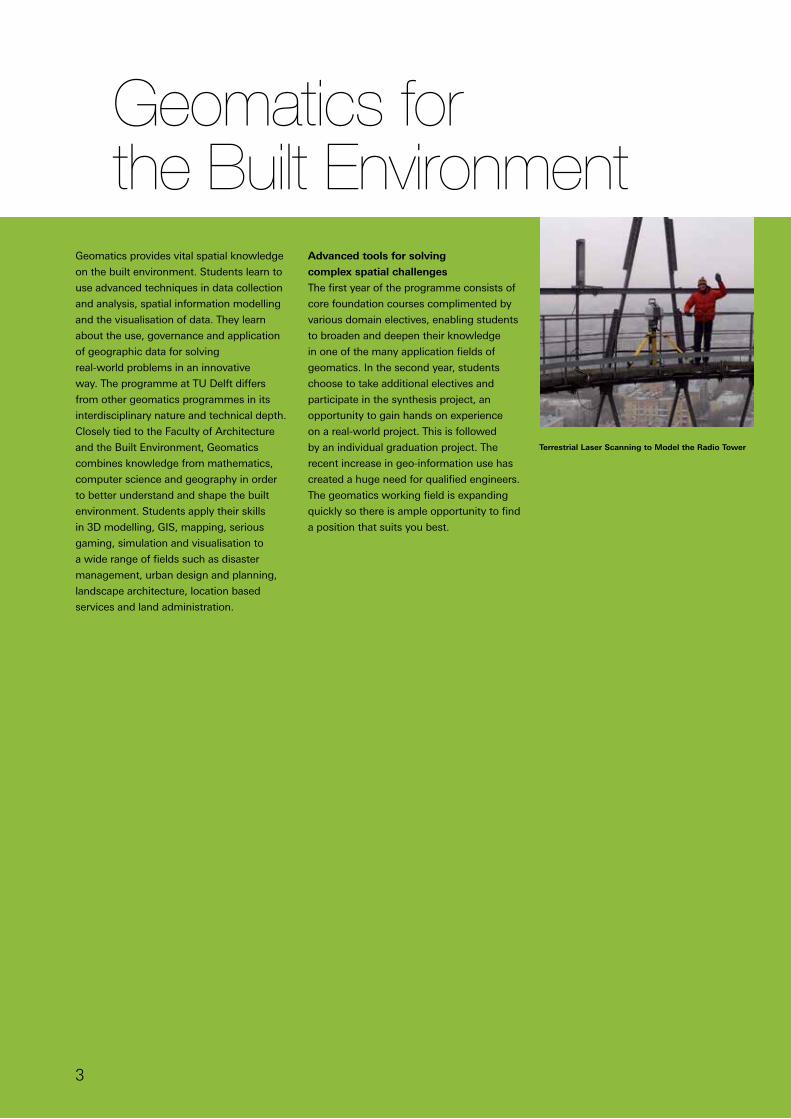
Terrestrial Laser Scanning to Model the Radio Tower

4

Welcome! In this booklet you will find
more information on the Master of Science
programme ‘Geomatics for the Built
Environment’ offered by the Faculty of
Architecture and the Built Environment of
the TU Delft.
Sensing technologies are entering our
daily life, measuring our behaviour and
monitoring our environment. Geomatics is
an innovative and developing field focussing
on the Built Environment. More and more
datasets become available, services are
extending and portals offer world-wide and
unplugged access to the huge datasets.
Location Based Services have become
the backbone of our society. Location
Awareness is embedded in most devices
and applications: Google, Facebook, Twitter,
travel apps such as Tomtom and Garmin.
Unconsciously we produce gigabytes of
geo-referenced data. The services improve
our daily life, facilitate management for
governmental bodies and give access to
knowledge for scientific and educational
institutions. The key is to efficiently make
us of the overkill of available information,
smartly develop new outcomes based on
fusion of datasets and secure privacy of
individuals.
Geomatics is a high-level 2-year full-English
Master programme. The first year the
programme is divided in two semesters,
four quarters. In the first semester the
fundamentals are taught; In the second
semester the focus shifts to the application
in the field and in the lab. The second year,
students carry out the Synthese group
project and their individual graduation
project.
The courses are taught by high-qualified
staff, either researchers at TU Delft or
part-time practitioners at companies or
government bodies. The programme
is internationally oriented: half of the
students come from other parts in Europe
or other continents. The staff -which
is partly international- produces high-
ranking publications and is renown for
the achievements (innovation? leader?)
in 3D modelling, point-cloud data, 3D
cadaster, big data and indoor positioning.
The collaboration with Architecture &
Urbanism leads to the integration of
additional applications such as GeoDesign
and Parametric Design. Examples of these
studies are Urbanism on Track and Sensing
the City.
This booklet covers the subjects/themes
taught in the Geomatics for the Built
Environment curriculum. The booklet
is not a programme guide. For detailed
information on the courses and schedule
we refer to:
http://studyguide.tudelft.nl and
http://actualschedule.tudelft.nl.
What is Geomatics?
Dr. ir. S.C. van der Spek is Director of Geomatics.
He has special interest in GeoDesign and the
Application of Advanced Tracking Technologies.
5

6
Geodata is key
Laymen are often impressed by glossy 3D
city models or flood animations. However,
their fitness for use entirely depends on
the accuracy and detail of the underlying
geo datasets. Indeed high quality geo-data
is crucial, as are the piles of concrete for
upholding buildings and bridges. As geo-
data is key to any geomatics task gaining
insight in the characteristics of the sensors
that acquire the data is essential. And that
is what the course on Sensing Technologies
provides. Global Navigation Satellite
Systems (GNSSs) head the list of most
important geo-data collection techniques
already for decades. GNSS is not only used
for navigation and sub-centimetre mapping
but is also essential for using laser scanners
and conducting photogrammetric surveys
either by manned or unmanned aircraft.
Lidar scanners can be mounted on a tripod
– terrestrial laser scanning (TLS) – or on
moving platforms such as aircraft, cars and
vessels. Measuring range and intensity TLS
allows detailed and accurate modelling
of a diversity of objects in their full three
dimensions. Additionally equipped with
GNSS and other navigation sensors, they
enable creating accurate 3D models of
roads, highways and dikes with high speed.
No other sensor technology has become as
popular among so many geo-data collectors
in such a short time as Unmanned
Airborne Systems (UASs). Their rapid rise
ensued from a the convergence of micro-
electronics, auto-piloting, high-capacity
batteries, super materials that are strong
yet lightweight, wireless communication,
compact digital cameras, image-processing
software and miniaturisation of GNSS and
other navigation sensors.
It is an empirical reality that all
measurements contain error and avoiding
or removing them is essential. The methods,
based on least squares adjustment, were
invented by Carl Gauss, famous of his
bell-shaped curve in statistics. As a result
the modelling and processing of sensor
data requires a thorough understanding of
mathematics and statistics.
Geo-data collection, also called land
surveying, is one of the oldest professions.
Famous people have started their career
as land surveyor, including George
Washington, Thomas Jefferson and
Abraham Lincoln. As so many others,
also these former presidents of the US
experienced that geo-data collection is
labour intensive and thus costly. Therefore,
throughout the ages, automation has been
hoisted into the zenith. Photogrammetry,
already in existence for more than 150
years, focussed during its long history on
automating the extraction of 3D information
of buildings and other objects from planar
image coordinates. Today, automation
of 3D mapping from images and lasers
heavily relies on fundamental research in
the realms of computer vision, artificial
intelligence and robotics.
dr. ir. M.J.P.M. Lemmens
is specialized in geo-information technology,
including photogrammetry, remote sensing, Lidar
technology and land surveying. He is senior editor of
the journal GIM international.
www.gim-international.com

7
8
Geographical information systems (GISs)
were developed in the 1960s to
automate the production and the analysis of
maps, and were used mostly by goverments
to manage natural resources. Nowadays,
they are (almost) ubiquitous, and they have
become an indispensable tool for engineers,
spatial planners, architects, geologists, etc.
Moreover, in recent years, Google Earth and
other web-based tools have made the use
and analyse of maps accessible to everyone
(even your mum!). Think for instance of the
route planning functions available online or
in your telephone.
GIS & Cartography
This course provides an overview of GISs,
and of how they can be used in practice
to solve real-world problems. You will not
learn how to use a specific GIS package (by
learning a sequence of buttons to press),
we will rather look “under the hood” of a
GIS to be able to understand what happens
when a button is clicked. You will first
learn what a GIS is, its components, and
what can be done with one. You’ll be given
several real-world datasets commonly
used (eg buildings, roads, satellite images,
GPS tracks, etc.), and you’ll have to fix
errors and integrate them together. We will
then explore the concepts under-pinning
a GIS. We will cover, among others, the
most popular data structures used to store
geographical datasets, and we’ll study the
algorithms used to extract information
from these datasets (eg buffers, spatial
interpolation, overlays, etc.). Finally, you’ll
also learn how to produce maps---the
cartographic principles that permit you to
create beautiful and efficient maps will be
studied.
The course has both a theoretical part and
a practical part, both divided equally in
terms of hours spent during the course and
in terms of the marking. One particularity
of this course is that only free and open-
source software is used for the laboratories,
in which the concepts seen during the
lectures are tested and applied with a GIS.
Scripting in Python is also used, so that you
can automate processes in a GIS, or even
build programs that would replace totally
a GIS. Previous knowledge of a scripting
language is required (Matlab or others); if
not then the course GEO3001 has to be
followed in parallel.
The course doesn’t target one specific
discipline, but rather aims at offering the
fundamental skills necessary for different
applications. However, each year, there is a
group project where students have to solve
a specific real-world problem with a GIS.
Examples are:
(1) how many people in Delft are bothered
by the noise from the railway?;
(2) what is the optimal location for a new
railway between Delft and Pijnacker?;
(3) how many people in the Nethelands
live within a 15-min bike ride of a train
station?
Learn to look ‘under the hood’
dr. H. Ledoux
is a GIS specialist and is particularly interested
in combining the fields of computational geometry
and GIS.

9
Where are you and where do you go?
Where are you? Where have you been?
Where are you going? This kind of
questions are stated nowadays by you,
your family, your friends, and others you
might even not suspect who are tracking
and tracing you. You have to be aware of
your whereabouts and your activity patterns
are connected to. The theoretical concepts
of localisation, location-based applications
and services, and the societal and technical
push and pull factors are the core elements
of this course.
Without the framework of global and local
reference and coordinate systems you are
literally lost. You have to express your own
location in context to what is around you
from different perspectives and scales.
Or, more meaning full: an address (country,
city, street, house number) or an indoor
location description (building, floor, room-
number). This step from a global position
to a representation in local context requires
profound knowledge of reference systems,
coordinate transformations, and geo-
coding.
Positioning & Location Awareness
To get a position, or to be positioned, is
the second part of this course. Almost
any smartphone and tablet is equipped
with a kind of a GPS (global positioning
system) device. When used within built
environments with ‘urban canyons’ the
performance is limited. The availability,
accuracy, continuity, and integrity of
the positioning is not appropriate or
guaranteed. For indoor environments – in
with we spend 80% of our lifetime – GPS is
out of scope. To cover this part of the world
there are a wide range of other localisation
techniques, one better suited than the
other, but all with performance limitations.
Judging these systems (Wi-Fi signals,
RFID, sound, vision, etc.) on their physical
characteristics and usability is another
learning objective of this course.
Location-Based Services
People are concerned with the use of
location technology in the private and public
sector. Recent news on privacy intrusion by
security agencies, government, and retailers
have increased the awareness of ‘you are
being watched’. But at the same time,
almost everyone is sharing their location –
without realizing – voluntarily to the main
smartphone vendors to let app-builders built
location-based services to support your
daily activities. This innovative trade-off
between ‘what is possible’ and ‘what is
needed’ is thus to be kept in the borders
of a legal and societal context and the final
learning objective of this course.
ir. E. Verbree
is a specialist in the field of positioning and location
awareness concerning both indoor and outdoor.

10

Challenges in 3D modelling
We see 3D models of houses, terrain,
bridges, underground formations, trees,
interiors, enclosed spaces, almost
everywhere nowadays: in Google Earth,
Bing maps 3D, on TV, in the cinema, at
exhibitions, on mobile devices. 3D models
of the real world are created for all kinds of
different purposes: either for visualization
to create immersive impressions and allow
navigation through models, or for design to
encourage spatial thinking and creativity,
or for analysis to investigate various
phenomena such as air quality, shadow
effects, sky visibility, of for simulation of
dynamic events such as flood, vegetation
growth and mobility. The available
3D models vary greatly in realism and
resolution, and similarly to the well-known
two-dimensional maps can have a different
accuracy.
How can we create 3D models in the most
efficient way? Where to start? What kind of
sensors can we use to record the details
that we need for our application? Do
we use photo images or laser scanning
measurements or just use existing 2D
maps? How to process the raw data and
re-use them existing data? What kind of
algorithms we need to apply for houses?
Are they the same for the trees? How can
we make our 3D model very realistic?
What kind of rules do we have to make our
models accurate and correct?
Imagine we run a flood simulation. Our 3D
houses should be watertight as we don’t
want water streaming through the interior.
What kind of approach we have to use to
store and maintain our 3D models? What
shall we do if we have 3D models of our
city of in different resolutions: can we still
maintain all together? The data structures
should be well-defined and transparent
to allow organisations and institutions to
re-use 3D data for different purposes. And
finally what kind of systems can visualise
our 3D models?
3D modelling for the built environment
These and many other challenging
questions related to creating, managing,
analysing and visualising of 3D models will
be discussed in the course 3D modelling
of the built environment. The course
is organised as a mixture of lectures,
workshops and hands on. In the lectures
end labs students can be tested and
participate in open discussions. The
assignments are organised in such a way
that both students loving developing own
tools and students mastering conceptual
workflows can debate, exchange ideas
and learn how things work. The course
is given by a very enthusiastic team of
lecturers from GIS technology and Design
Informatics.
11
mw. dr. dipl. ing. S. Zlatanova
leads the Group ‘Geo-information for Crisis
Management’. Her interests include integrated 3D
modeling (indoor/outdoor, above/below) and 3D
indoor navigation.

12
Serious gaming for decision support
Around the world hundreds of decisions
that influence billons of people are made
every day. Most of these issues are a matter
of who does what, when and where and
what are possible consequences of these
decisions.
Where should a new neighbourhood be
developed? Which high water defence
measure should have priority? Which fire
brigade, with what equipment is the fastest
at the place of emergency? What may be
the consequences for human and nature if
a the harbour is extended?
These questions do not have simple
answers, because they involve very often
different people with different backgrounds,
interest and needs. Information that could
help to make decision are often not easy
available or only in a form that specialist
understand it. It is also very difficult to
predict what the effects and consequence
of these decision may be, as decisions may
have unintended consequences we were
not aware of before. This is where Spatial
decision support systems (SDSS) come into
the game. They are one tool that help to
make decision in this complex situation.
SDSS are interactive computer systems that
integrate and analyse spatial information
from different fields of expertise and
present them in a way that decision maker
can understand them. Moreover, they allow
us to compare different possible decisions
by modelling there consequences before
we actually make decisions. The provide an
interactive setting where people involved
in decision making can play through the
decision process in advance and make
decisions that are better informed then
without SDSS.DI A. Wandl, MSc researches, among others, the
following fields: dispersed spatial development & GIS
based spatial analyses and modelling.

13

Daren 2013
During the daren project, seven sudents
travelled to Wuhan, China to conduct a
research in cooperation with the University
of Wuhan. The students have been
experimenting with realizing a 3D indoor
navigation system called DaRen for the
Provincial Museum of Hubei in China.
“DaRen” is derived from Chinese words
Da “intelligence, accessibility” and Ren
“people”. The students made the first step
in the development of 3D indoor navigation.
The general goal of the project is to
demonstrate the potential of 3D indoor
navigation systems and raise awareness of
the possibilities provided by the technology
for every-day users. The output of the
project is a 3D indoor navigation application
for the Hubei Provincial Museum which
provides the real time location of the user
based on Wi-Fi technology and the route to
a final destination in a 3D model visualized
on the mobile device.
Although DaRen application demonstrated
promising results, several shortcomings
and recommendations could be addressed
including the following. Different user types
in the application should be considered.
The two localization sub-systems to be
integrated into one application that serves
both visitors and museum managers’
needs. The 3D navigation network for
the whole building should be generated.
The 3D model should be stored in the
database to save storing space of the
application. The important semantic
information should be attached to the
3D model and visualized on the screen
of mobile device.
Urban Heat 2012
In association with Laboratoire des
Sciences de L’Image Informatique et
Teledetection (LSIIT) at the University of
Strasbourg, the 2012 GSP explored the
impact of 3D geometry complexity on the
accuracy of simulating radiative, convective
and conductive fluxes in an urban canyon.
The research involved the collection of
meteorological data near the urban canyon
in Strasbourg, France, for input into a
model called LAtent, SEnsible, Radiation
Fluxes (LASER/F), which simulates the
aforementioned fluxes. The preparation of
seven geometry scenarios with different
complexities was completed and test run
in LASER/F. The results were validated
with thermal images of two facades
collected during the field campaign in
Strasbourg. The results show that LASER/F
systematically underestimates facade
surface temperatures due to various model
assumptions..
Synthesis Projects
Graduation Projects
14
Graduation Karl van Winden
There are many applications that use maps,
and more detailed the maps are, more
applications can benefit from the map.
Many maps are still manually created and
also the underlying attributes are informed
manually. This thesis presents a method to
automatically derive and update attribute
road data from mining and analyzing
movement trajectories.
The method used for this thesis
implemented OpenStreetMap as the
underlying map which will be updated.
GPS tracks are the movement trajectories
that will be used to derive the information
for the road attributes.
Graduation Weilin Xu
In order to address the problem of indoor
pedestrian tracking, this thesis carries
a research on spatial models’ ability to
reduce tracking error of a Wi-Fi positioning
system. The grid-based spatial model is
employed because it is easy to design
and maintain, has high flexibility, is able
to provide accurate location data and
is powerful for computation. The thesis
explores various geometric, topological
and semantic features of the grid model.
A tracking algorithm, which integrates all
selected features of the grid model as well
as measurements from Wi-Fi positioning
system and magnetometer using the grid
filter, is proposed.

Simeon Nedkov
I started the Geomatics programme in 2009
after successfully completing the Aerospace
Engineering minor Earth and Planetary
Observation. Coming from the conservative
and slowly developing field of Aerospace
Engineering, the tangible and fast paced
field of Geomatics was like a breath of fresh
air. Geomatics is a very broad and exciting
field; I quickly felt at home and never looked
back.
The Geomatics programme as taught
at the TU is thorough, rich and flexible.
The courses are of a high quality and
cover the complete chain of information
gathering, storage, management, analysis
and visualization. The programme teaches
each phase’s fundamentals and stays away
from specific tools or software packages.
Students are therefore able to apply their
geographical knowledge to a broad set of
challenges and fields.
Karl van Winden
I started this MSc at TU Delft to learn the
core of Geomatics from the technical point
of view. Through the different courses
taken, I experienced how Geomatics is
made of different disciplines, which is
the strength and uniqueness of this field.
After two challenging years and writing a
demanding thesis, I can say that I achieved
more than my own expectations. The
knowledge acquired during the research
included advanced topics in 3D GIS and
their implementation using state of the art
Web Technologies.
Geomatics demands the best form
different knowledge areas and as such, the
obtained results are awesome. Experiences
and contributions from colleagues play
a fundamental role in the Master, and
the availability of people with different
backgrounds provides different points of
view and different expertise. In sum, this
diversity makes the experience of studying
Geomatics rich and unique.
Some months before graduating, I started
working with a company in Mexico,
PointofB, which offers cartographic and GIS
consultancy services. My main role at the
company is the definition and automation
of GIS processes, but also the deployment
of GIS technologies for the Web. Mexico
is growing country and the need for GIS
products and Geomatics specialists gave
me a privileged position in the industry,
which is always increasing.
Alumni
15

16
The era of BIG data
We are entering the era of BIG data. It
is widely assumed that further progress
and innovation in our society depends
on managing and exploiting this data; as
expressed by European Commission in the
Digital agenda for Europe (http://ec.europa.
eu/digital-agenda) and in the Dutch
context by the recent establishment of
the Netherlands eScience Center.
Data sources are numerous and increasing,
both professional (governmental and
commercial) and non-professional (location-
aware social media, and smart phone
use, sometimes termed VGI or Voluntary
Geographic Information). Sensors, surveys,
designs (building information models, or
BIM) or simulations (for weather predication
or water management) generate ever
increasing amounts of spatial data. In order
to better deal with dynamic phenomena at a
wide range of scales the temporal and scale
dimensions get more attention. For example
in situ sensor networks (monitoring water/
air flow and quality, or traffic in a city) and
continuously observing satellites in which
the temporal dimension is vital.
Data gets meaningful through structure,
such as the classification of objects, their
properties and their relationships. A road
network for example is a highly connected
(topological) dataset where each road is
connected to junctions. Integration and
combination of the various data types
is a key aspect; e.g. find all laser scan
points from HUGE elevation point cloud
that are within 5 meters distance from a
given building from the national buildings
database.
How can these data be management,
including the access rights (who may read,
update)?. Support for spatial data types
is often missing from traditional database
systems where efficient access is often
based on sorting; e.g. on social security
number or family name. This needs different
support for multi-dimensional data.
The Course
The course “geo-database managed
systems” will first introduce generic tools
for database management (SQL) and data
modelling (UML) and will then explain how
the various types of spatial data can be
managed. This includes 2D, 3D and higher
dimensional vector data, raster data, and
point clouds with emphasize on advanced
functionality and BIG datasets. Both open
source and commercial systems are
covered: PostgreSQL with PostGIS, Oracle
with Oracle Spatial, etc. Also, the Dutch
database MonetDB will be elaborated on.
The era of BIG data
Prof. dr. ir. P.J.M. van Oosterom
is head of the section ‘GIS Technology’. His interests
include map generalization & spatial databases.

Information must flow in order to be used.
Information that is not used has no value.
The Internet is the ultimate communication
channel. We are entering a networked
society in which we are all and always
connected. This includes the non-humans:
Internet of Things. Objects often have a
(static or dynamic) location, making the
spatial aspect crucial. The re-use of spatial
information requires facilities: the geo-
infrastructure (GII or geoweb for short).
This geoweb can be considered the nerve
system of our society.
For real world activities, information from
many sources has to be combined. Take
for example planning and maintenance
of utility networks requiring information
on existing other utility networks, the
topography, new houses/ connections.
Or crisis management urgently needing
information about the location of the
disaster, the status of the roads, building
types, people living their, dangerous goods,
utility networks, weather predictions, etc..
There are many aspects to be addressed
before information can be shared: How
to represent spatial reference systems,
coordinates, geometry types, and other
attributes? How to know which source
has what information? How to request
a selection from a webservice? How to
encode the response? The standards of the
OGC and ISO TC211 are used to build the
geoweb in our heterogeneous environment
with many different types of devices of
makings. The third dimension requires
specific attention!
Being connected more and more has
one drawback: not understanding all the
information (meaning) at the unknown
and remote sources. Therefore semantic
technologies, such as developed by the
W3C, are needed: RDF, OWL and linked
data are some of the generic ingredients
here. However, humans agree on the
information content: the concepts and their
labels. Also this requires standardization,
but now at semantics level; good examples
are the INSPIRE data specifications of 34
themes.
Geo Web, Sensor Networks and
3D-GeoVisualisation Technology
The geoweb is not a one-way flow of
information as used for data distribution.
It can as well be used for data collection;
e.g. via VGI (Volunteerd Geographical
Information) using the many smartphones
or cars with GPS, but also via the many
sensors in our world. This later is called the
Sensor Web and based on specific sets of
standards (SWE). Organizations such as
RWS, RIVM and TNO are applying this to
realize the Smart-XXX (cities, dikes, roads,
etc.) The course “geoweb technology” will
introduce the overall architecture, based
on protocols such as WMS, WFS, GML,
WCS, SLD, SVG, X3D, WebGL. Besides
the GIS and DBMS systems covered in
other courses, this course will introduce
some more: GeoServer, OpenLayers, Layar,
Cortona, etc...
‘Internet of things’
mw. drs. M.E. de Vries is a specialist on publication
and use of (3D) geo-information in Web-based
distributed systems
17

18
‘What is the closest café with wifi?’, ‘How
do I get to the central station as fast as
possible?’, ‘What interesting places are
within 10 minutes away from me?’. There
are plenty of application available answering
such questions. Without information
about our surroundings these applications
couldn’t exist. Geo-information is crucial in
solving spatial-related problems.
Geo information is not only used to
solve these individual problems but also
used for management and planning of
our intensively used environment by
governmental organizations. Think of the
monitoring of the amount of cars on the
Dutch highways to find flow problems and
patterns. The last 10 years an astonishing
millions of geo-data sets have become
available, acquired by both governmental
organizations and companies. This amount
will only increase in the (near) future.
The growth of this huge amount of data
is even larger than our ability to use it
in a meaningful way! Sensible use of
these highly heterogeneous data requires
thorough understanding of the, among
others, content, meaning and precision
level of the data. In this way it can be
applied by professional users resulting
in well informed decision making and
service for the non-professional users. In
addition, understanding the quality of geo-
data sets and how the quality influences
the outcomes of spatial processing and
analyses is essential, since often crucial
decisions are made based on these
analyses. Therefore specific attention is paid
on the quality aspect of geo-data sets and
processing.
Geo Datasets and Quality
The course “geo-data sets and quality”
explains the ins and outs of available geo-
data sets and how the content and meaning
of these data sets can be expressed and
explored via information models to make
optimal and appropriate use of geo-data
sets in all kinds of applications.
Quality influences the outcome
mw. Prof. dr. J. Stoter is projectleader of the
researchproject “5D data modellering”. She received
a prestigious Vidi award for this research from NWO.
18

19

20
In the information age, information
has become of vital importance to the
economic and social development of a
country. Especially geographic information
is of increasing importance for the
successful execution of (public and private)
tasks. Professors Onsrud and Rushton
convincingly argue that “The value of
information comes from its use”.
Spatial Data Infrastructures (SDIs) facilitate
the collection, maintenance, dissemination,
and use of geographic information. By
reducing duplication, facilitating integration
and developing new and innovative
applications, and respecting user needs,
SDIs can produce significant human
and resource savings and returns and
performance gains of both public task and
private tasks.
The legal and organisational frameworks
are important for the successful use of
geographic information. Think about
the intellectual property rights such as
copyright and the database right, the
right to access public data, and the need
to respect the privacy frameworks in
using data. Also one should bear in mind
that the collection, and processing of
geographic data requires significant human
and financial resources. It is therefore
imperative that the geo-processes are
organised as efficient as possible: collect
it once use it many times. Not only each
single organisation is stimulated to adhere
to this principle, also at a national, regional
(European Union) and global level this
would result in significant societal benefits.
However, the needs of communities change
over time. While technology may fulfil the
new needs, these are often not anticipated
by outdated legislation and inflexible
organisational structures. Also we have
seen an increased role for citizens in the
SDI processes. This volunteered geographic
information adds a new dimension to
traditional structures of cooperation and
data exchange.
The Geo-information Organisation
and Legislation course provides the
key legislative frameworks applying to
geographic information and addresses
the organisational challenges practitioners
may be confronted with when working
with geo-information within and between
organisations, countries and regions.
Provide the key legalisation framework
dr. ir. B van Loenen focusus on open data:
the stimulation of re-use of public sector geo-
information. Other research interests include the
development and assessment of Spatial data
infrastructures (SDI).
21
We are living in a world dominated by
software. People use their smart phones
running software for displaying web maps
and finding directions. Massive amounts
of data are collected, and processing these
data is not a task done manually, but by
means of computer programs. Software
has become a critical asset in our lives. In
the future not knowing the language of
computers will be challenging. Similar to
being illiterate or innumerate today.
Apart from learning to use a programming
language, the course Python programming
for Geomatics, promotes computational
thinking. Computational thinking is how
software enigneers solve problems. It
combines aspects from mathematics, logic
and algorithms. Thinking this way teaches
you how to tackle problems by breaking
them down into smaller, more manageable
chunks. This is a skill that every (Geomatics)
engineer should be equipped with. Even
if you will never code in your professional
career, you will benefit if you understand
how to think this way.
Python programming
This course provides a basis for using
Python programming as a general purpose
programming language (‘a Swiss army
knife’) within other Geomatics courses
and your professional career. Python is
used, because it is a fun and extremely
easy to use language, and can be used
for a variety of tasks. Also mainstream
Geographic Information Systems, such as
QGIS or ArcGIS, or database systems, such
as PostgreSQL, can be extended by using
Python.
Computational thinking
dr. ir. B.M. Meijers is a researcher at the section of
GIS Technology. He has special interest for Vario scale
geo-information.
22
The Geomatics Synthesis Project (GSP) is a
culminating group project by second-year
MSc Geomatics students. The objective is
to undertake a small but real-world research
project with companies or at the university.
The students are able to practice skills
in acquisition, visualization, processing,
analysis, and interpretation of geo-spatial
data, as well as project management- an
invaluable experience.
Most of the subjects taught in the master
programme will be combined in the
synthesis project: Sensing Technologies,
GIS, Location awareness, 3D Modelling,
Spatial Decision Support, Geo-DBMS,
GeoWeb Technology, Geo Datasets, and
Organisation and Legislation. The project,
which is carried out in a project team
to practice teamwork, runs through all
phases from preparation to fieldwork and
application. The students are coached
by the staff, encouraging collaboration
between students and staff. The final
result is presented during a public seminar
organized by the students. This way the
students experience the entire process from
project definition, over measurement (data
gathering), data processing and analysis, to
presentation and delivery, and application
in a neighbouring domain (e.g. built
environment).
Geomatics Synthese Project 2014
(Wifi Tracking)
Nowadays most people carry one or more
mobile devices around with them that have
WiFi functionality. Also more and more
public places are offering (free) WiFi which
makes people use their smartphone, tablet
or laptop outside their homes a lot more
than before. This development provides
a platform to track people by using WiFi
monitoring technology. This technology can
detect a signal that WiFi-enabled devices
are sending out all the time in their search
for a WiFi access point. The information
that can be derived from these signals can
be useful for crowd control, marketing
purposes or real time monitoring of public
space use.
In 2014 three parallel projects on WiFi
positioning and tracking were run:
(1) The GeoFort Geoexperience in Herwijnen
has the ambition to promote the aspects of
geo-information to a wide range of visitors,
from young children to adults with different
backgrounds and interests. Goal of the
Geomatics Synthesis Project (GSP) is to
make the visitors of the GeoFort aware of
the principles and possibilities of passive
WiFi tracking. For this project the goal of
this setup is twofold:
- To educate the visitors of the GeoFort on
passive WiFi tracking
- To provide the management of the
GeoFort with information about how the
visitors use the island during a visit.
Research Question: Which setup and
algorithms are best suited using passive
WiFi monitoring devices provided by
BlueMark, for showing individual user
tracks and a (semi-)real time map of the
visitors of the GeoFort?
(2) Rhythm of the Campus is about
detecting users of buildings at the TU
Delft campus in order to gain insight
in the occupation and use of these
buildings. Information about the behaviour
an movements of people have been
studied ever since manually. A ‘proof of
concept’ has been provided to collect this
information in an automated way. The focus
of this research is on the Central Library
of the TU Delft and the Aula Conference
Center as these two buildings are use by
a large number of people with different
backgrounds. The main question to be
answered in the research is: “What kind of
patterns of using the area of the Library &
Aula can be recognized by WiFi-monitoring
within the TU Delft Campus and how
trustable are these results?”
(3) The project ‘De Rotterdam’ aims to
provide the Municipality of Rotterdam with
a solution to the problem its employees
face, when needing to contact and meet
fellow team members in the vast new
environment of ‘De Rotterdam’ building.
In fact, in this building employees do not
all have a fixed workplace to work at, but
can choose to work at flexible workplaces.
This makes it hard for employees to find
their colleagues, especially since the
building has 40 floors. In addition, another
challenge is addressed, which stems from
the unawareness of employees about
the availability of free workspaces in ‘De
Rotterdam’, which will cost them time and
can cause frustration.
The team comprised for this project has
been asked to develop a smartphone
application with an easy to use interface
that can locate its user, as well as the
colleague the user wants to find, in a
reasonable time frame with the help of
Wi-Fi monitoring. Additionally, dependable
navigation should be provided with a route
description. As an agreed limitation, given
that most of the employees use Samsung
smartphones, the application will be aimed
for Android software devices.
Synthesis Project
22

23
The MSc in Geomatics for the Built
Environment is concluded with an individual
graduation project that takes about 9
months to complete. This individual project
can take place at the University or in
cooperation with a company.
Graduation topics are subdivided in five
main themes:
1. Modelling, Multi-scale and Visualization
2. Sensor networks, Tracking
and Semantics
3. Privacy and Open data
4. Databases, Processing and Classification
5. GIS and Spatial analysis
Modelling includes looking at how to
model, how to structure and how to
visualize and analyse. Multi-scale refers to
the scale on which data is made available
and the detail in which geo-data is stored.
Visualization is a retuning subject both
for the modelling and multi scale topics.
Visualization also includes looking at how
software can visualize certain data.
Sensor networks are the means by which
data is collected. Think of the monitoring
of people and places. This already touches
the subject of Tracking, which is concerned
with localization of assets and a sequence
of past and current positions. Tracking is
also related to navigation and path finding.
Semantics are a key concept in the latter
since it looks at what the geometries in
practise are.
In the information age, information has
become of vital importance to the economic
and social development of a country.
The legal and organisational frameworks
are important for the successful use of
geographic information.
Spatial data sources are numerous and
increasing, both professional (government
authorities and commercial data producers)
and non-professional (location-aware social
media, and smart phone use). Processing
and Classification of the data makes the
spatial data usable for both types of users.
The theme of Geographical Information
Systems and spatial analysis is concerned
with a wide variation of research topics.
On one end of the spectrum is the theory
related to GIS. For example, edge matching
can form the basis of the master research.
On the other end of the spectrum is a more
practical approach of spatial analysis is for
example looking at the influence of spatial
changes (think of street and road network)
on the vitality of existing areas.
Thesis

24
Gra
ph
ic D
esig
n:
Pau
l O
uw
erke
rk/G
rap
hic
Lan
gu
age
Career prospects
Geomatics engineers are in high demand
as there are many projects requiring spatial
information and there is a shortage of
capable graduates. Past students are sought
out by specialised geomatics companies,
large companies dealing with spatial
data and governmental bodies. Geomatics
graduates can find positions in local and
national governmental agencies such as
the Dutch Kadaster, Geonovum or local
municipalities with their activities ranging
from data gathering and information
processing to project initiation and
management. Others take positions in the
private sector with industrial firms and
consultancy agencies, such as TomTom,
Here (the geo-component of Nokia),
Tracé (Secondment or traineeships),
Google, CGI or ESRI.
Others pursue doctoral degrees at national
and international universities and research
institutes. Geomatics graduates have
a specialised skill set that is widely
valued and that allows them to work in
interdisciplinary teams on ground breaking
projects worldwide.
Career prospects
For the most up-to-date information go to
the TU Delft admissions and applications
website:
www.admissions.tudelft.nl.
Contact information
dr. ir. S.C. van der Spek,
Programme Director
T +31 (0)15 27 89860
E [email protected] or
For international applicants:
Faculty of Architecture and the Built
Environment
Julianalaan 134
2628 BL DELFT
The Netherlands
http://geomatics.tudelft.nl
www.facebook.com/GeomaticsDelft
@ArchTUDelft @GeomaticsDelft
Last but not least

Gra
ph
ic D
esig
n:
Pau
l O
uw
erke
rk/G
rap
hic
Lan
gu
age
